Article

Mining Candidate Genes and Favorable Haplotypes for Flag Leaf Shape in Rice (Oryza sativa L.) Based on a Genome-Wide Association Study

College of Agronomy, Anhui Agricultural University, Hefei 230000, China
*
Author to whom correspondence should be addressed.
These authors contributed equally to this work.
Agronomy 2022, 12(8), 1814; https://doi.org/10.3390/agronomy12081814
Submission received: 22 May 2022 / Revised: 14 July 2022 / Accepted: 28 July 2022 / Published: 30 July 2022

Abstract

:
The shape of the rice flag leaf affects rice yield. Therefore, the detection of quantitative trait loci (QTLs) and alleles related to rice flag leaf shape is of great significance for rice yield improvement. Therefore, in 2019 and 2020, we carried out a genome-wide association study of flag leaf length (FLL), flag leaf width (FLW), flag leaf length–width ratio (FLR), and flag leaf area (FLA), considering 1.3 million single-nucleotide polymorphisms (SNPs) in 173 rice accessions, in order to investigate the effects of various genes on flag leaf shape. An abundance of phenotypic variation was found, with respect to the four flag leaf shape parameters of these accessions. We identified one significant SNP position associated with FLL and FLR on chromosome 5 and one significant SNP position associated with FLW on chromosome 2, which were detected in both of the two years of the study period through general linear model (GLM) and mixed linear model (MLM). Furthermore, three candidate genes—LOC_Os02g56760, LOC_Os05g34380, and LOC_Os05g34600—were found to possibly be significantly related to flag leaf shape in rice. Haplotype analysis indicated that LOC_Os05g34380 is highly associated with flag leaf length and flag leaf length–width ratio, LOC_Os05g34600 is highly associated with flag leaf length, and LOC_Os02g56760 is highly associated with flag leaf width. Our results provide important genetic information for the molecular improvement of rice flag leaf shape, laying the foundation for further cloning and molecular-assisted breeding of flag leaf genes.

1. Introduction

Rice (Oryza sativa L.) is an important staple food that feeds approximately half of the world’s population [1]. With an increasing global population, high yield has become one of the key targets in rice breeding. The yield of rice depends on the source–sink relationship of the top three leaves, where the flag leaf is the main source–sink organ of rice, providing more than half of the carbohydrates [2,3]. Therefore, rice flag leaf shape is one of the important characteristics in rice breeding, affecting rice yield in two aspects. First, a large flag leaf area, as determined by the flag leaf length and flag leaf width, can improve the net photosynthetic rate [4]. Secondly, the ideal flag leaf shape, determined by the flag leaf length to width ratio, is also an index of ideal plant type. The ideal flag leaf is long and straight and not only has a large area, but also does not shade other leaves, effectively improving the population transmittance [5]. Therefore, improving the flag leaf shape is of great significance for rice breeding and rice yield improvement.
Rice flag leaf length and width are typical quantitative traits, which are controlled by multiple genes and easily affected by the environment. In recent years, with the rapid development of molecular biology technology, many QTLs and genes related to flag leaf shapes have been mapped and cloned [6,7,8,9,10]; however, they have been much less cloned than other traits in rice. Chen et al. [11] have constructed a recombinant inbred line by crossing D50 (japonica rice varieties with narrow leaf type) with HB277 (indica rice variety with wide leaf type), and they mapped five QTLs related to the flag leaf width on chromosomes 1, 4, 7, and 10. Xiao et al. [12] have identified eight QTLs related to FLL, FLW, and FLA, which were mapped on chromosomes 1, 3, and 6 in back-cross recombinant inbred lines (BILs) of the japonica variety Koshihikari and the indica rice variety Kasalath. Jiang et al. [13] have analyzed QTLs affecting flag leaf length by applying F2 individuals derived from a cross between two japonica rice cultivars, SN265 and LTH, and the QTL was found between RM24,423 and RM24,434. Peng et al. [14] have constructed two populations of double haploid (DH) and recombinant inbred lines (RIL), and they detected 8 and 16 flag leaf-related QTLs in these two populations, respectively. Through genome-wide association analysis and linkage analysis, Wang et al. [15] have identified two QTLs related to flag leaf width, qFL2 and qFL10, in natural populations and recombinant inbred lines. Further analysis showed that LOC_Os10g20160 belongs to the S-domain receptor-like protein kinase gene, which might be a candidate gene for qFL10. Tang et al. [16] have constructed a chromosomal segment substitution line (CSSL) consisting of 143 strains. A total of 14 QTLs related to flag leaf length and 9 QTLS related to flag leaf width were detected. In the study of Xu et al. [5], 4, 4, and 6 QTLs related to flag leaf length, width, and area were identified, using 128 chromosome fragment substitution lines, 9311, and Nipponbare, respectively.
Studying rice mutants is an effective method for the identification and isolation of genes related to flag leaf [17,18]. To date, all five cloned genes of flag leaf shapes in previous studies have been obtained from rice mutants. Among them, three genes, including Nal1 [19], NAL7 [20], and OsSAUR45 [21], were associated with auxin. The flag leaf width-related gene Nal1, located on chromosome 4, encodes a specific plant protein. The gene Nal1 affects the polar auxin transport and vascular pattern of rice, which plays an important role in controlling lateral leaf growth. The gene NAL7 has been identified as a mutant gene from narrow leaf 7 (nal7). NAL7 encodes a family of riboflavin-containing mono-oxygenases. Mutations in this gene alter the content of endogenous auxin in plants and play important roles in leaf narrowing, regulation of vascular tissue development, and IAA biosynthesis. OsSAUR45 is involved in plant growth by inhibiting the expression of OsYUCCA and OsPIN genes, as well as by affecting auxin synthesis and transport. In over-expressed lines, the plants were dwarfed, the taproot became shorter, the number of accidental roots decreased, the root length became shorter, the leaves became narrower, and the seed setting rate decreased. Aside from the auxin-related genes, another two genes—NRL1 and the WOX family gene NAL2/3—have been cloned. NRL1 encodes a cellular-like synthase protein. Mutation of this gene leads to the number of veins in the leaves to be reduced, resulting in narrow leaf and roll-leaf phenotypes, and it also leads to varying degrees of dwarfing. The number of vascular bundles in the leaves and stems of nrl1 was significantly reduced, compared with the wild-type [22,23]. The narrow-curl leaf gene NAL2/3 encodes the OsWOX3A (OsNS) protein. Mutation of these two genes lead to reduced lateral axons, fewer longitudinal veins, and more bubble cells, resulting in narrow and curly rice leaves [24].
Although many flag leaf-related genes have been reported, the associated molecular and genetic basis is unclear, and the regulatory network requires further study. If linkage mapping is to be performed to construct a certain population, it will take a long time and only two alleles can be identified [25]. Therefore, more genes need to be mined for further studies. In this study, 173 rice germplasm resources were used as materials, and QTLs related to flag leaf shape were determined through a genome-wide association analysis. The objectives of this study were to (1) identify QTLs related to flag leaf shape, including flag leaf length (FLL), flag leaf width (FLW), flag leaf length–width ratio (FLR), and flag leaf area (FLA); (2) mine the genes associated with flag leaf shapes; (3) detect favorable haplotypes; and (4) provide excellent parents and molecular information for improving flag leaf shape through pyramiding breeding.

2. Materials and Methods

2.1. Material Distribution and Field Planting

The natural population for the GWAS consisted of 173 rice accessions, collected from the Heilongjiang (19), Tianjin (1), Henan (3), Yunnan (3), Hunan (10), Hubei (1), Sichuan (4), Guangdong (4), Hainan (2), Fujian (2), Jiangsu (79), Anhui (5) provinces and Shanghai (1) in China (134), as well as other countries, including Japan (11), Indonesia (4), the Philippines (2), and Vietnam (21). Detailed information of the rice accessions is given in Table S1 and Figure S1, including the name, country of origin, latitude, and longitude of the varieties.
The 173 germplasm accessions were collected, preserved, and provided by the State Key Laboratory of Crop Genetics and Germplasm Innovation of Nanjing Agricultural University. All 173 accessions were planted in the normal season (May to October), over two years (2019–2020). The accessions were planted at the Jiangpu Experimental Station of Nanjing Agricultural University in Nanjing of China. A randomized block design was used for both two-year experiments, with two replicates. In each plot, 40 varieties were planted in a total of five rows. Rice plants were spaced 20 cm × 17 cm, and they were managed in accordance with conventional agricultural management practices.

2.2. Phenotypic Characterization

Repeated experiments were conducted twice a year, and five plants were randomly selected for each replicate. A complete randomized block design was used in the field test. The flag leaf of the main panicle at the full heading time was selected to measure the flag leaf shape. The average values of five flag leaves per variety were obtained for each phenotypic value. The flag leaf width was measured at the widest part of the flag leaf, and the flag leaf length–width ratio and flag leaf area was calculated as follows:
FLR = FLL / FLW ,
FLA = FLL   ×   FLW   ×   0 . 75 .
The leaf area is given as: Leaf area (cm2) = K × length (cm) × width (cm), where K is a correction factor. The correction factor used for rice leaves ranges from 0.67 to 0.80, depending on the variety and growth stage. The value of 0.75, however, can be used for all growth stages, except the seedling stage and at maturity [2]. Therefore, we selected the value of 0.75 for K. Statistical analyses were performed in Excel 2010 (Microsoft) and the SPSS software (version 25.0). Welch’s two-sample t-test and ANOVA with Duncan’s multiple range tests were used to analyze the different phenotypes of the haplotypes in the candidate genes using the SPSS software.

2.3. SNP Access

For each of 173 accessions to be sequenced, two leaves were collected from a single plant at the tiller stage (1 month after seedling transplantation), and genomic DNA was extracted using a standard cetyltrimethylammonium bromide protocol [26]. According to the manufacturer’s instructions (Illumina, https://www.illlighta.com/, accessed on 26 April 2019), paired-end sequencing libraries were constructed using 5 μg of genomic DNA, with inserted fragments of approximately 350 bp. The Illumina HiSeq X10 platform was used to obtain the pair-ends of 150 bp reads, and the original sequence was further processed to remove adaptor contamination and low-quality reads, resulting in a total of 0.532 Tb of genome sequence data. The average of genome coverage of each accession was 5.48-fold. Library construction, sequencing, and sequence cleaning were all performed by Mega Genomics Beijing (http://www.megagenomics.cn/mobile.php/, accessed on 10 April 2019).
Raw reads were aligned against the Nipponbare genome sequence, downloaded from the International Rice Genome Sequencing Project (IRGSP-1.0, http://rapdb.dna.affrc.go.jp/, access on 3 August 2019), using the Bowtie 2 software. The parameter used for read mapping was bowtie2−x<bt2-ids> {−1<m1>−2<m2>|−U<r>}−S [<hit>]. The reads used for further SNP calling were required to have a unique mapping position in the Nipponbare genome and a mapping score of more than 60. Finally, 95% of the total reads were mapped to the scaffolds of the Nipponbare genome; the 3% of reads which did not map to any location or which mapped to multiple locations were removed. The mapping results were converted to VCF format using SAMtools (version 0.1.18) [27]. The HaplotypeCaller of GATK 3.8–0 (https://software.broadinstitute.org/gatk/, access on 25 September 2019) was used for SNP calling. SNPs whose minor allele frequency (MAF) was lower than 5% were removed from the population.
The annovar software [28] was used for SNP annotation of the Nipponbare genome sequence. The annotation results were divided into exons, introns, UTR, inter-gene, upstream, and downstream regions. The SNPs in the exon region could be divided into synonymous and non-synonymous. Base substitutions of non-synonymous SNPs led to amino acid changes, but the base substitutions of synonymous SNPs do not change the coding amino acid.

2.4. Population Genetic Analysis

Based on the SNPs of the 173 rice accessions, we calculated the genetic distance matrix using VCF2Dis (https://github.com/BGI-shenzhen/VCF2Dis, accessed on 6 October 2021). Construction and beautification of the neighbor-joining (NJ) tree were carried out using iTOL (https://itol.embl.de/, accessed on 7 October 2021). Principal component analysis was conducted using the GCTA (version 1.93.2) software [29] on Linux, and the two most significant principal components were plotted in R using the package “ggplot”. For the population structure, we used the STRUCTURE (version 2.3.4) software [30] on Linux. We used PLINK (version 1.9) [31] to filter SNPs, based on the LD (linkage disequilibrium) in order to retain unlinked SNPs, and converted it into STRUCTURE format. STRUCTURE was used to analyze the population structure of the accessions. The number of subgroups (K) was set to 1–10 and the number of random seeds was set to 1–3. The ‘define BURNIN’ was set as 5000 times and the ‘define NUMBERS’ was set as 50,000 times in the configuration file. We analyzed the STRUCTURE results using Evanno [32] with STRUCTURE HARVESTER [33]. In general, the true number of subgroups is determined by the maximum logarithmic likelihood; however, if the logarithmic likelihood increases with the number of subgroups, the change rate of logarithmic likelihood (ΔK), proposed by Evanno [32], was used to determine the appropriate number of subgroups. The kinship was calculated using Normalized_IBS in the TASSEL (version 5.2.40) software [34].
In this study, the r2 value [35] was used to measure the degree of linkage disequilibrium between loci across the whole rice genome. PLINK (version 1.9) [31] was used for Linkage Disequilibrium (LD) analysis of the genotype data on Linux, using the default parameters. The LD heatmap in GWAS was drawn using the R package “LDheatmap” [36].

2.5. Genome-Wide Association Mapping

In this study, we obtained 1,322,884 SNPs (MAF > 0.05) and four sets of phenotypic data. The SNPs and phenotype data were used to conduct GWAS in the TASSEL (version 5.2.40) [34] software, using a GLM and an MLM [37]. For the GLM, the threshold was set at p = 3.78 × 10⁻⁸ (i.e., 0.05/1,322,884) by the Bonferroni correction method. The false discovery rate (FDR) was calculated for significant associations using the Benjamini and Hochberg (1995) correction method, with 1.0 × 10⁻⁵ as the threshold for MLM. The SNPs in the same LD region were regarded as a QTL, and the SNP with the smallest p-value was regarded as the lead SNP. The Manhattan plot was drawn using the R package “CMplot”.

2.6. Identification of the Candidate Genes and Haplotype Analysis

Candidate regions on chromosomes were estimated based on genome-wide LD decay analysis. We focused on the associated non-synonymous SNPs which could induce amino acid changes and were significantly associated with the traits in the GWAS result by comparison with the reference genome sequence of Nipponbare (http://rice.plantbiology.msu.edu/cgi-bin/gbrowse/rice/, accessed on 15 January 2022). Candidate genes were identified based on the predicted function from the rice genome annotation project. All non-synonymous SNPs in exons were selected, in order to narrow the range of candidate genes for haplotype analysis and selection of favorable haplotypes. Haplotypes distribution of candidate genes was analyzed according to geographical regions and subgroups. The haplotypes of candidate genes were also analyzed using the RFGB v2.0 database (https://www.rmbreeding.cn/, accessed on 25 July 2022). The data displayed in the database derive from the genome information of about 3000 rice accessions (3K rice genome) from 89 countries.

2.7. Prediction of Excellent Parents

The average positive (negate+ve) haplotype effect (AHE) within a gene locus was calculated as follows:
AHE = h c n c ,
where hc represents the phenotypic value of the cth haplotype with a positive (negative) effect, and nc represents the number of haplotypes with positive (negative) effects within the gene locus.
The rice accessions with the highest positive haplotype effects on all flag leaf shape-related gene loci were predicted to be the most promising parents for flag leaf shape improvement in rice breeding.

3. Results

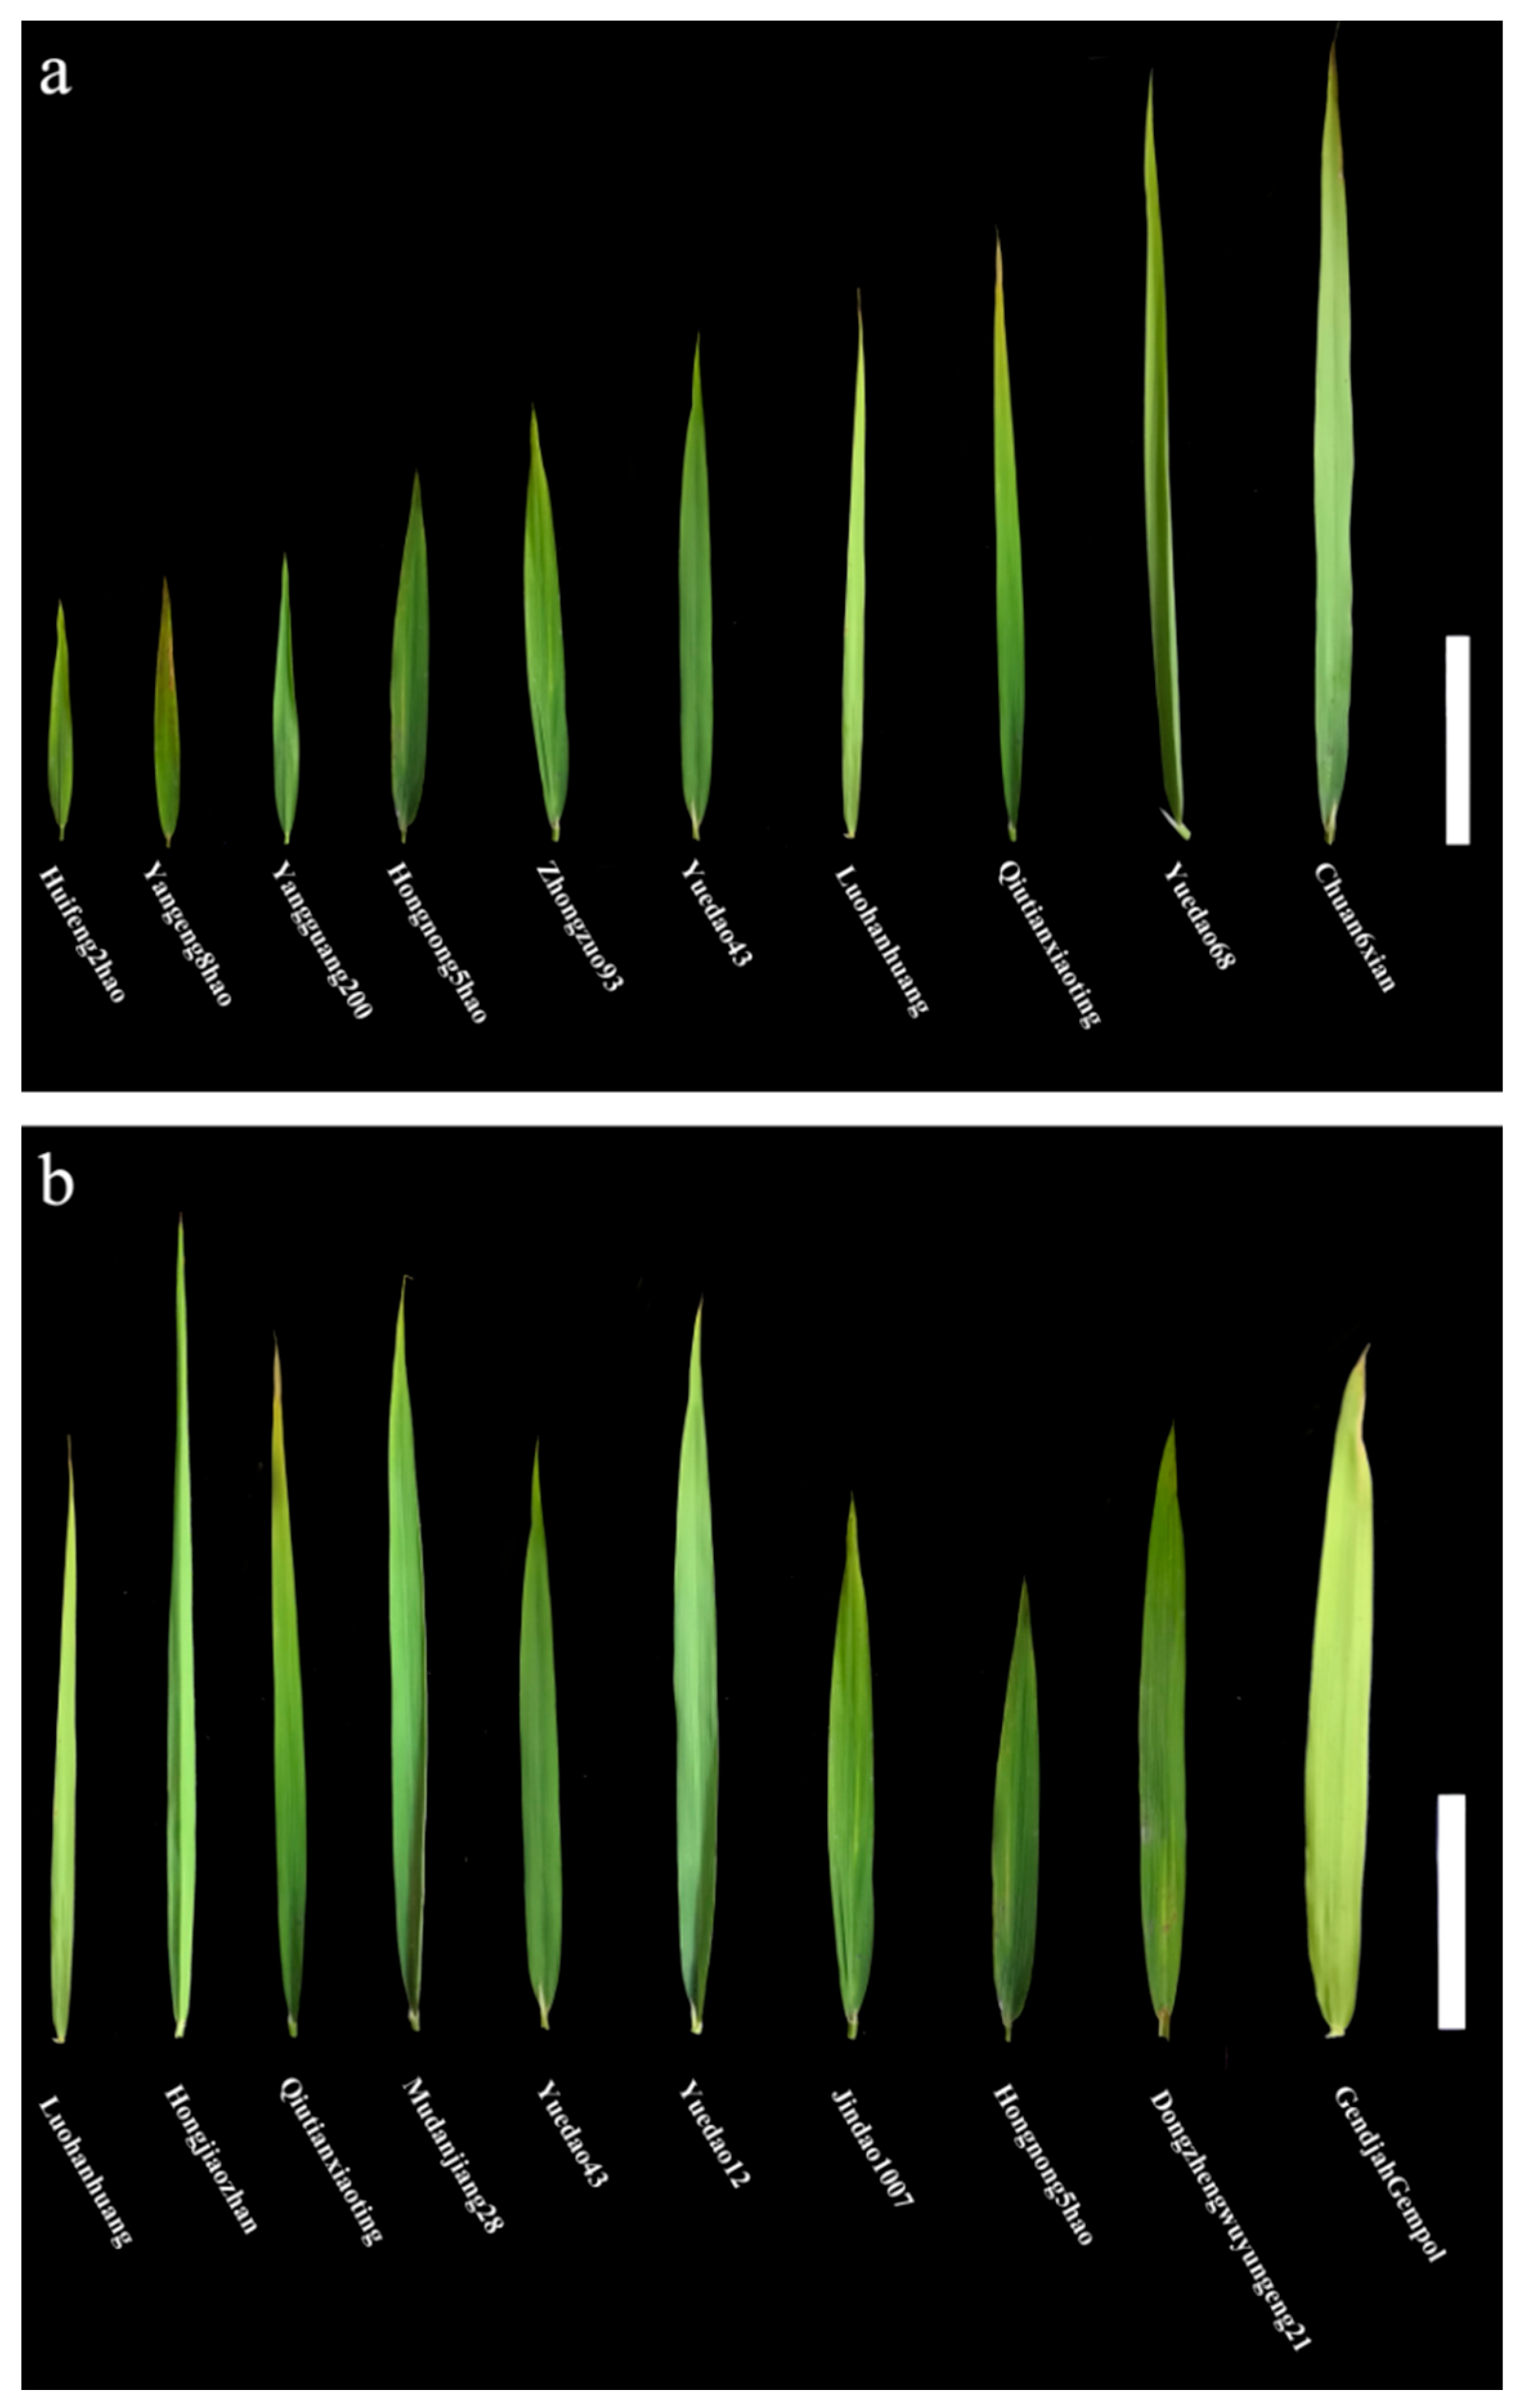
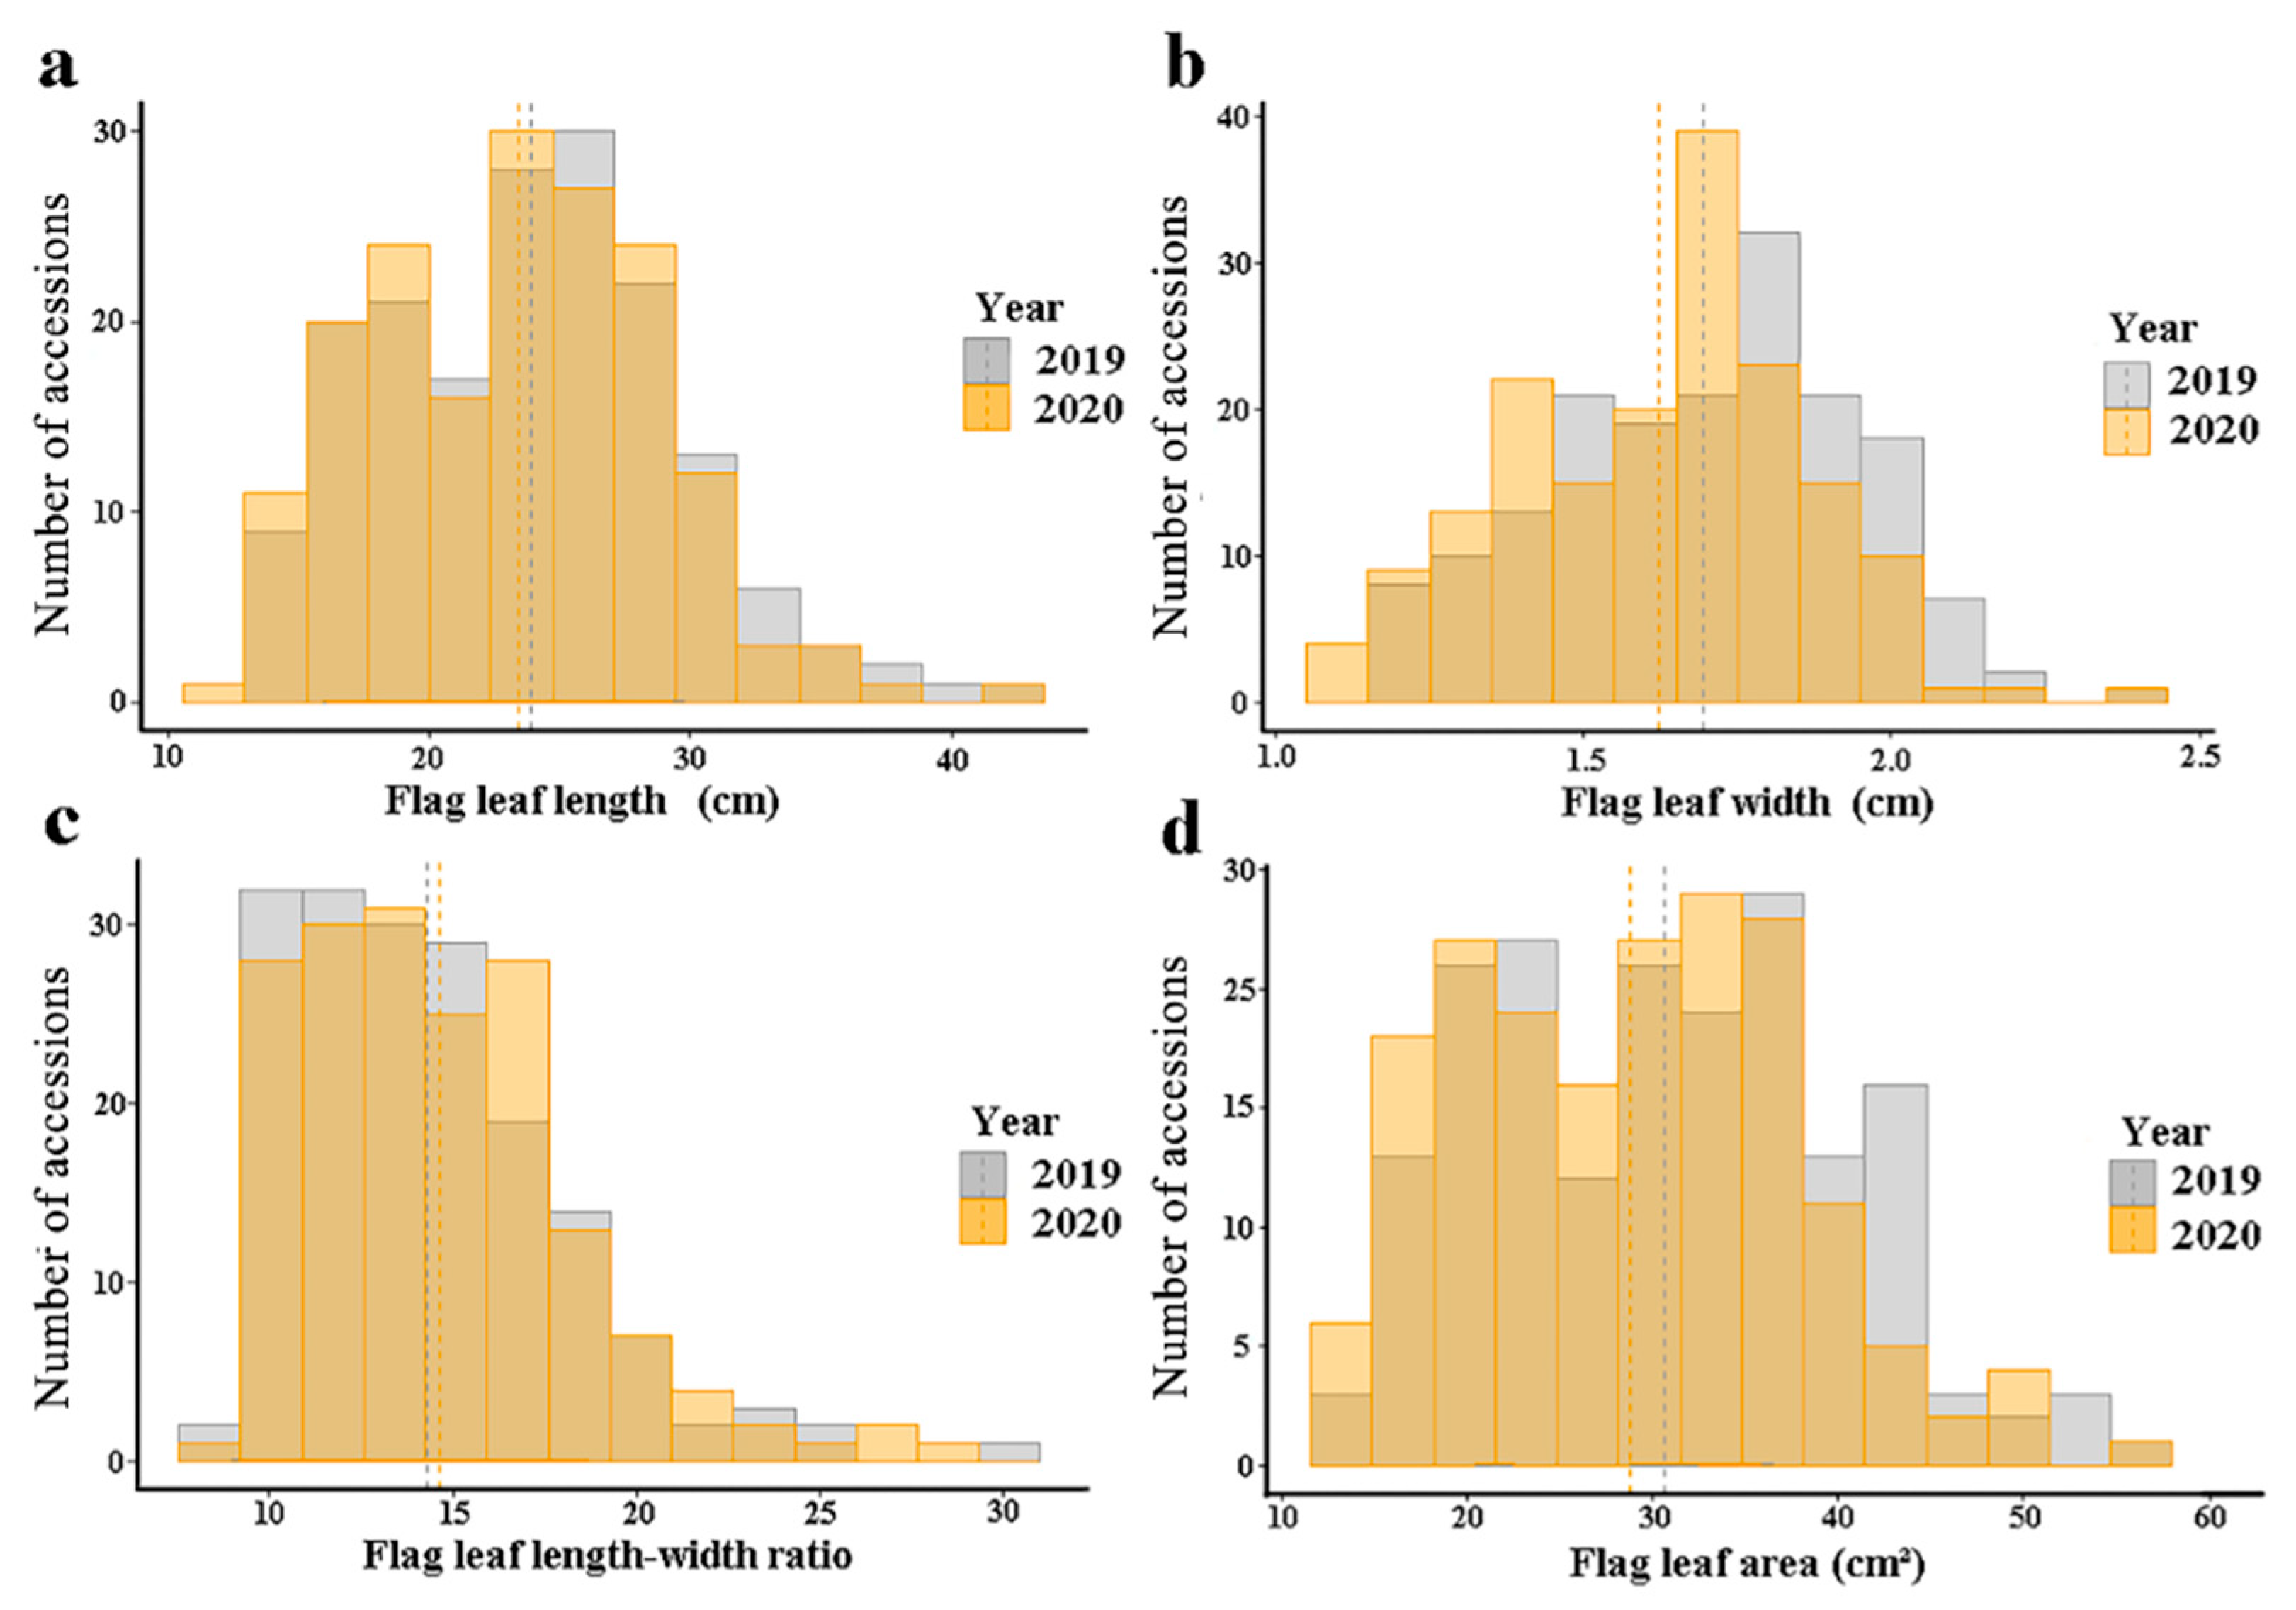
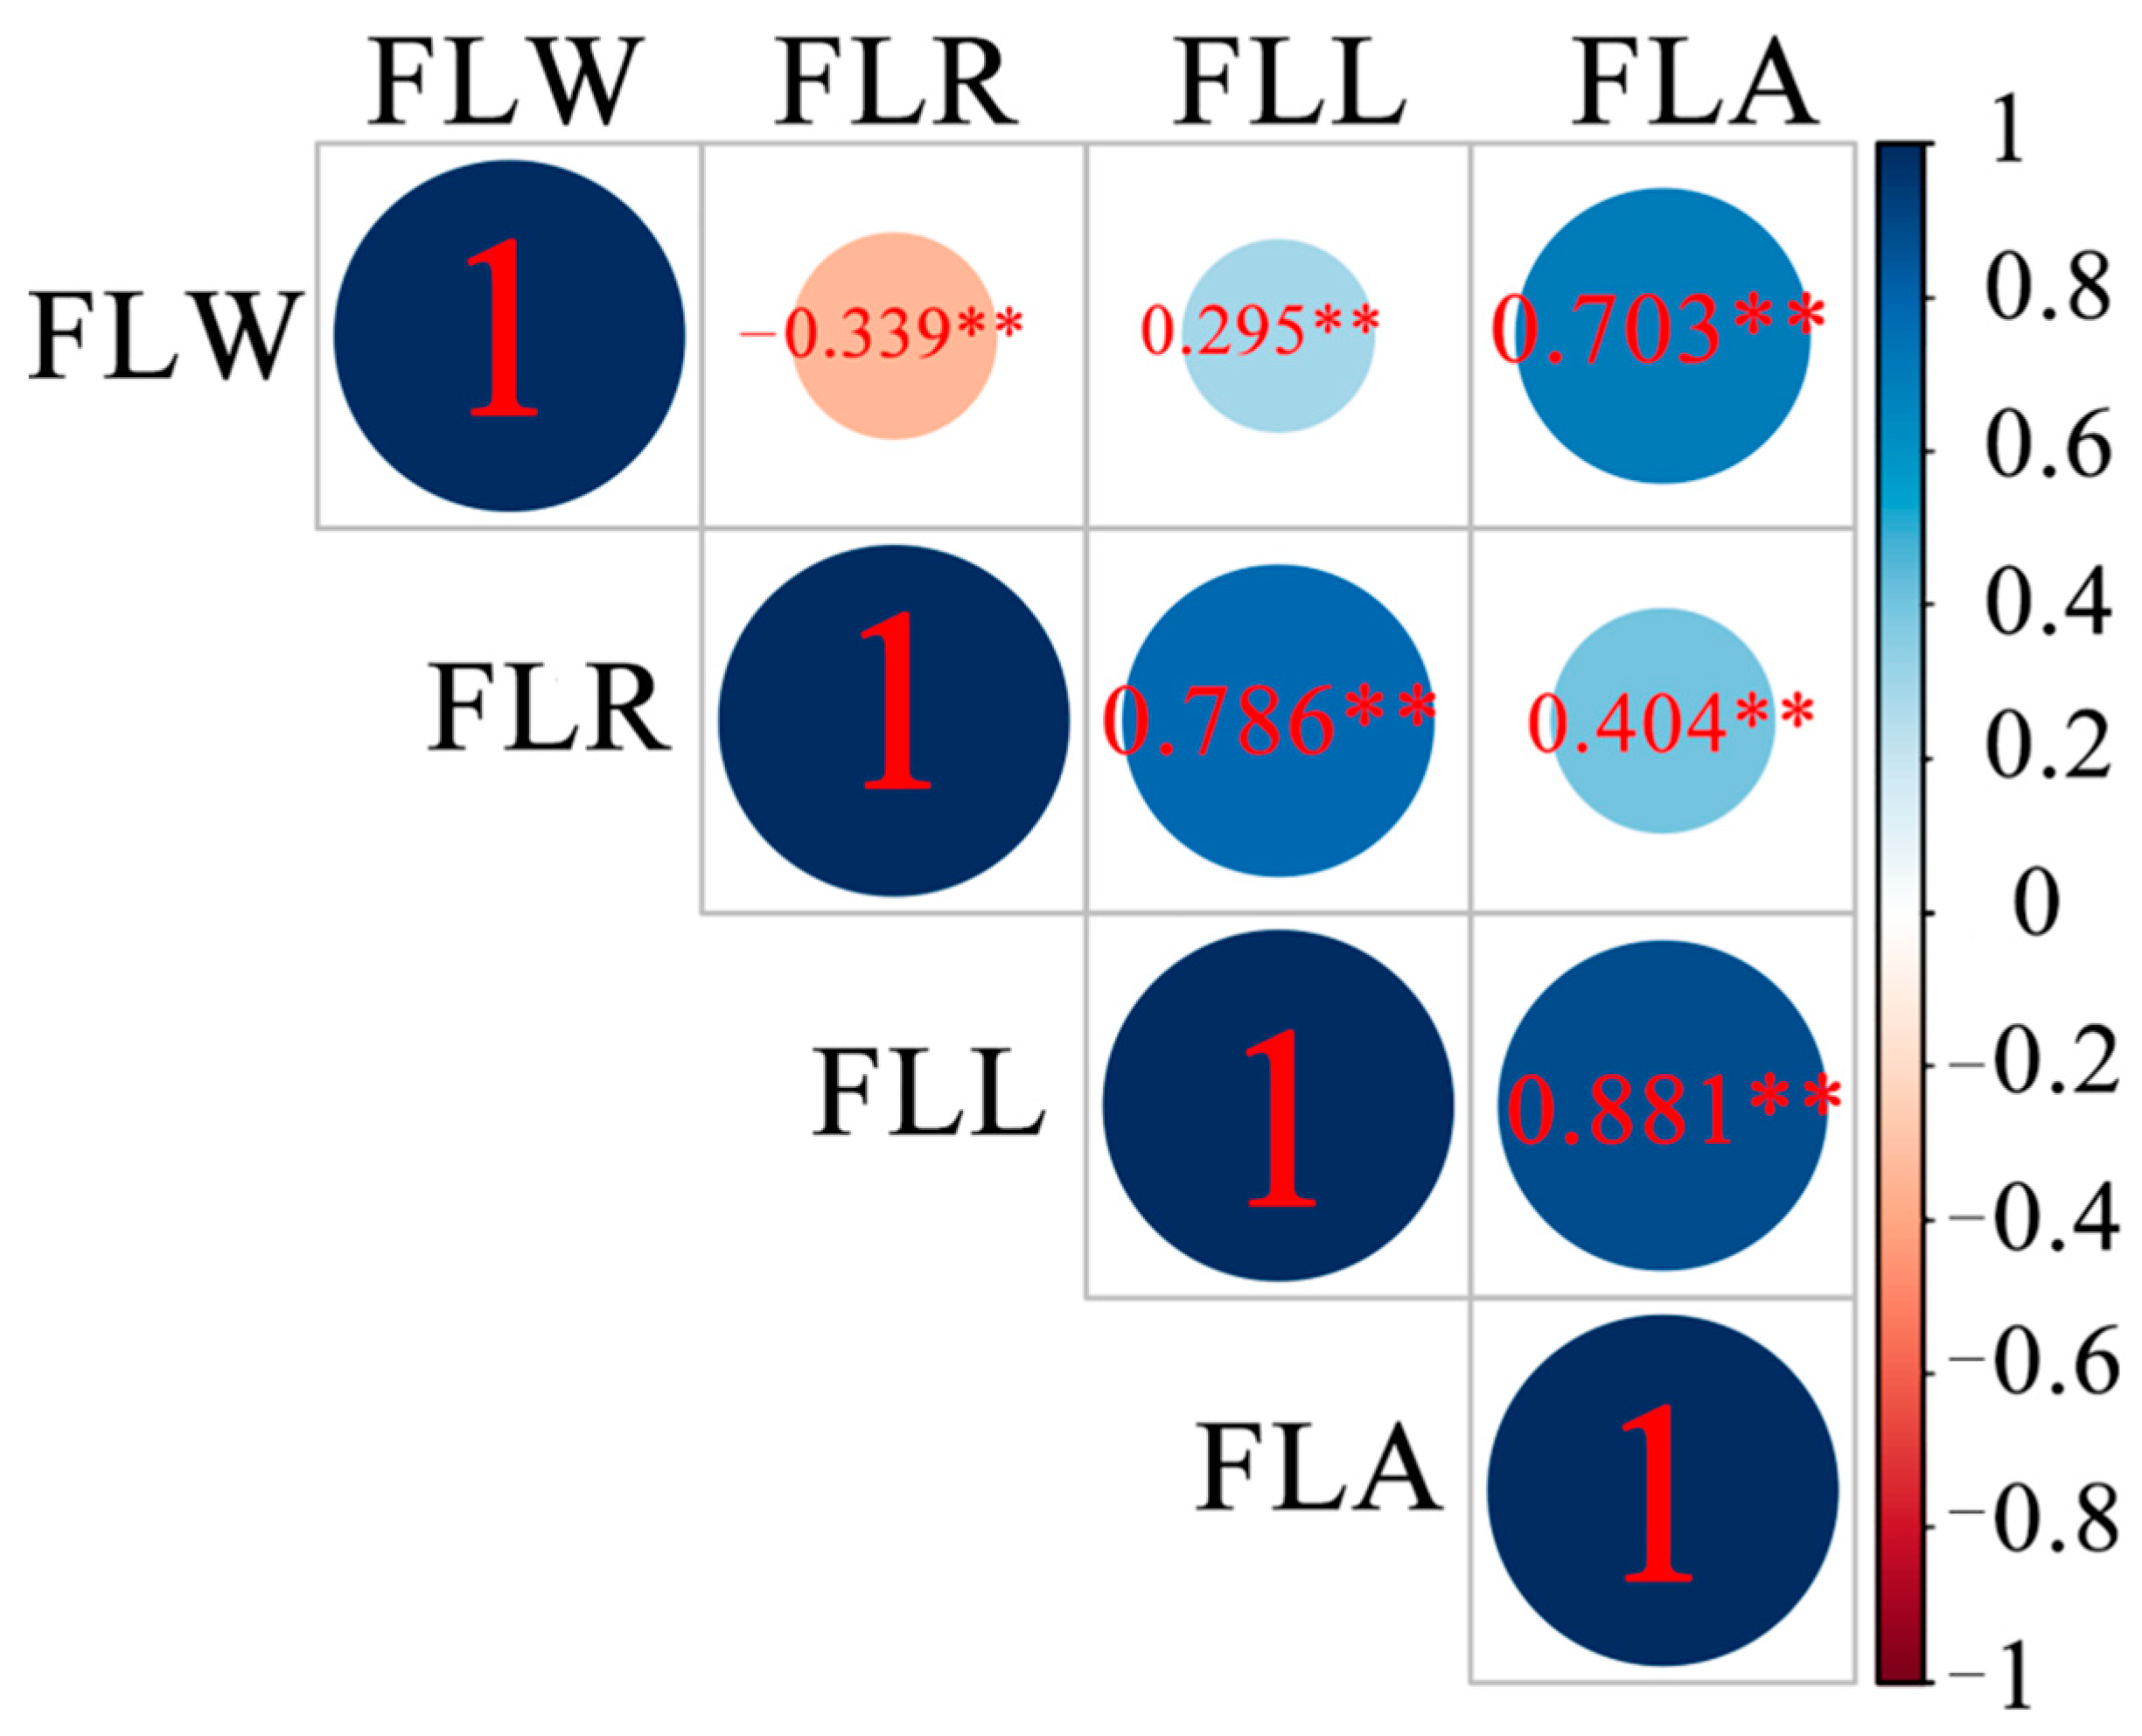
3.1. Phenotypic Variation of the Flag Leaf Shapes in the Natural Population

We selected ten accessions to represent the diversity of flag leaf length and flag leaf width among the 173 rice accessions, including the shortest FLL accession Huifeng2hao (14.7 cm), the longest FLL accession Chuan6xian (32.1 cm), the narrowest FLW accession Luohanhuang (1.2 cm), and the widest FLW accession GendjahGempol (2.4 cm) (Figure 1). The mean, standard error (SE), range, coefficient of variation (CV), and generalized heritability (HB2) of FLL, FLW, FLR, and FLA were derived in the natural populations. There were significant differences in FLL, FLW, FLR, and FLA values among the varieties in both 2019 and 2020, with CV ranging from 14.73% to 30.95% (Table 1). All traits had high generalized heritability. Among the 173 accessions, the FLL were 13.57–41.23 cm (2019) and 12.83–43.35 cm (2020), with a CV of 23.81% and 23.76%, respectively. FLW ranged from 1.16–2.44 cm (2019) and 1.08–2.42 cm (2020), with CVs of 14.79% (2019) and 14.73% (2020). The maximum values of FLR were 30.60 cm (2019) and 29.02 cm (2020), while the minimum values were 1.16 cm (2019) and 1.08 cm (2020), with CVs across the two years being 25.89% (2019) and 25.58% (2020). The ranges of FLA in 2019 and 2020 were 13.66–55.99 cm and 12.88–55.95 cm, with CVs of 30.90% and 30.95%, respectively.
The results above indicated abundant phenotypic variation in the natural population considered in this study. Statistical analysis showed that FLL, FLW, FLR, and FLA all conformed to normal distributions, indicating that these four traits were quantitative traits controlled by multiple genes (Figure 2). At the same time, variance analysis showed that the four traits significantly differed among varieties at the α = 0.01 level, demonstrating that these traits presented great genetic variation in the 173 rice accessions (Table S2).
FLR was negatively correlated with FLW and positively correlated with FLL. FLR had the highest correlations with FLL and FLW, being 0.703 ** and 0.881 **, respectively (Figure 3).

3.2. Genomic Variation at the SNP Level in the 173 Rice Accessions

A total of 950 million pairs of 150 bp paired-end reads with an average coverage depth of 4.36 times were obtained using an Illumina re-sequencing platform. We identified 1,322,884 SNPs after mapping from the Nipponbare reference genome sequence and excluding more than 18% of the missing data loci (Original data set 1). We observed 463,740 SNPs in various gene regions: 48,054 synonymous SNPs, 52,283 non-synonymous SNPs, 270,622 in introns, 621,813 in untranslated regions (UTRs), and 30,600 in 5′-UTR SNPs.

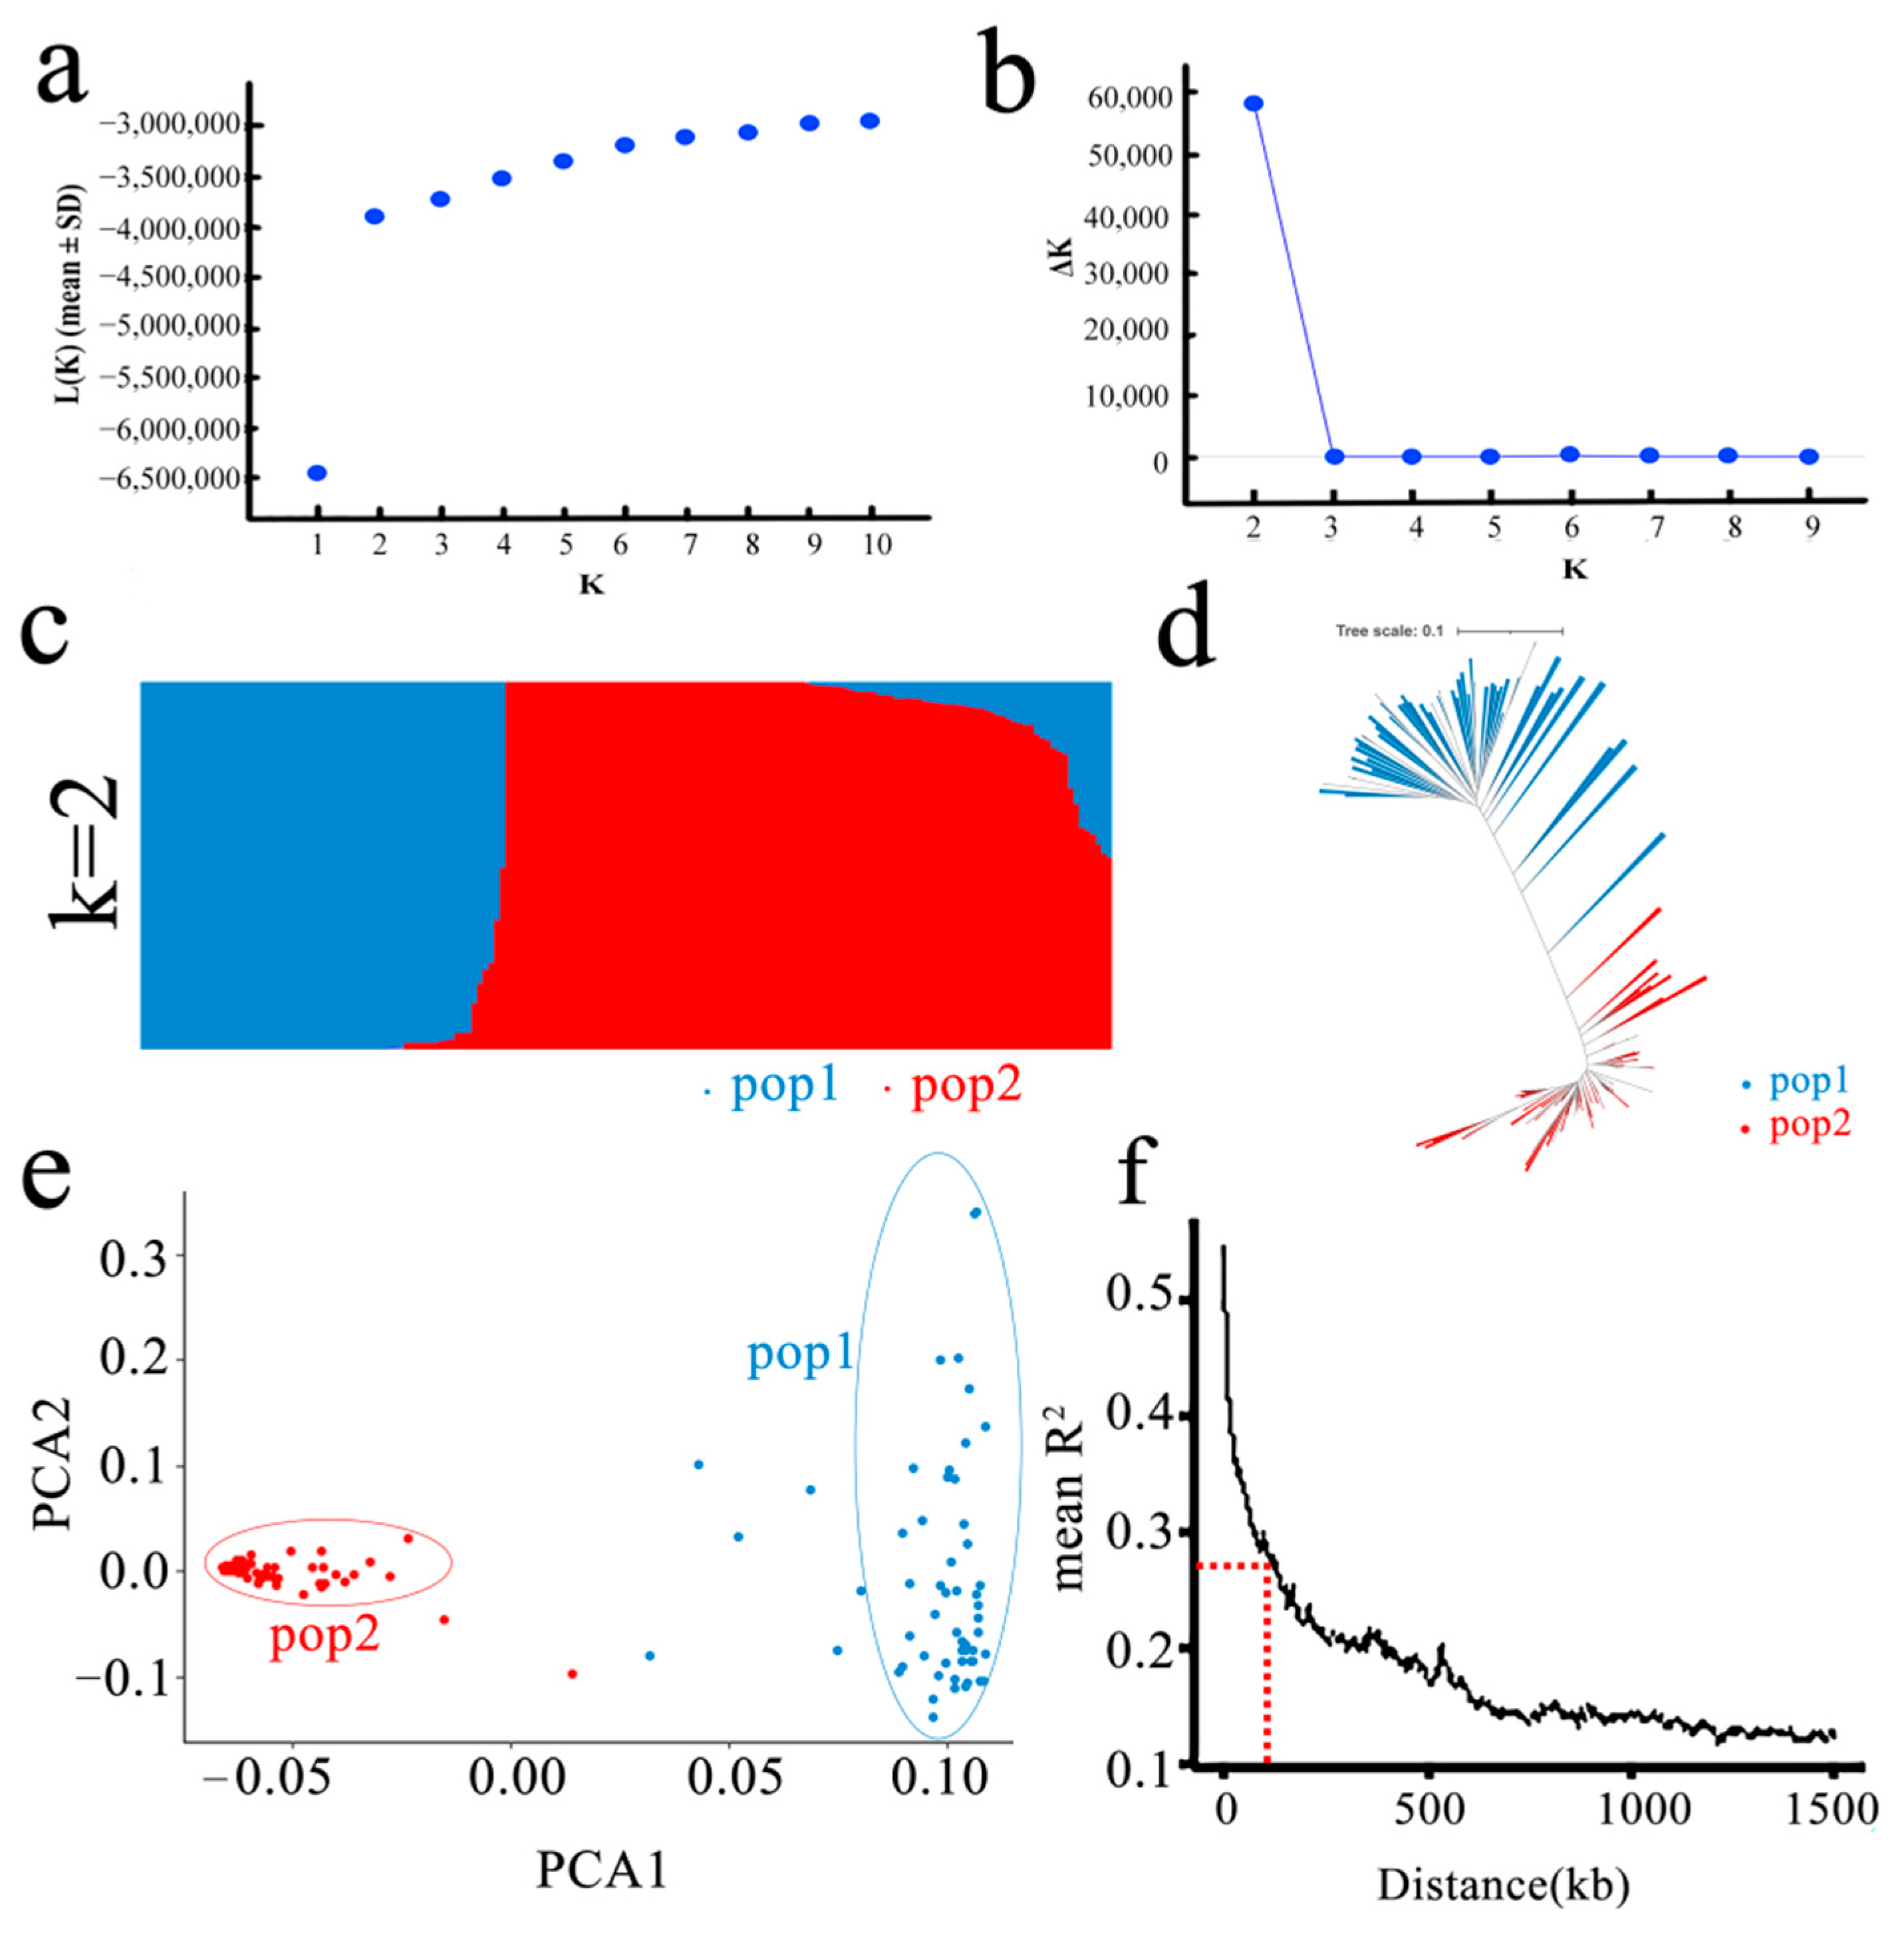
3.3. Population Structure and LD Analysis

Genetic structure analysis of the natural population was constructed from the 173 rice accessions and SNP markers (Figure 4 and Table S3). As the logarithmic likelihood value increased with an increase in K (Figure 4a), the appropriate subgroup number was determined by assessing ΔK. According to the results, when K = 2, the ΔK value was the highest (Figure 4b); therefore, the rice accessions were divided into two subgroups (Figure 4c). The number of rice accessions in the pop1 and pop2 subgroups was 61 and 112, respectively. The results of the neighbor-joining (NJ) tree (Figure 4d) and principal component analysis (Figure 4e) were consistent with the structural result, which further verified that the population was divided into two subgroups.
When r2 decreased to half of the maximum value, the corresponding distance was denoted as the LD attenuation distance. It can be seen, from the figure, that when r2 decreased to half of the maximum value, the corresponding attenuation distance was 112 kb (Figure 4f).

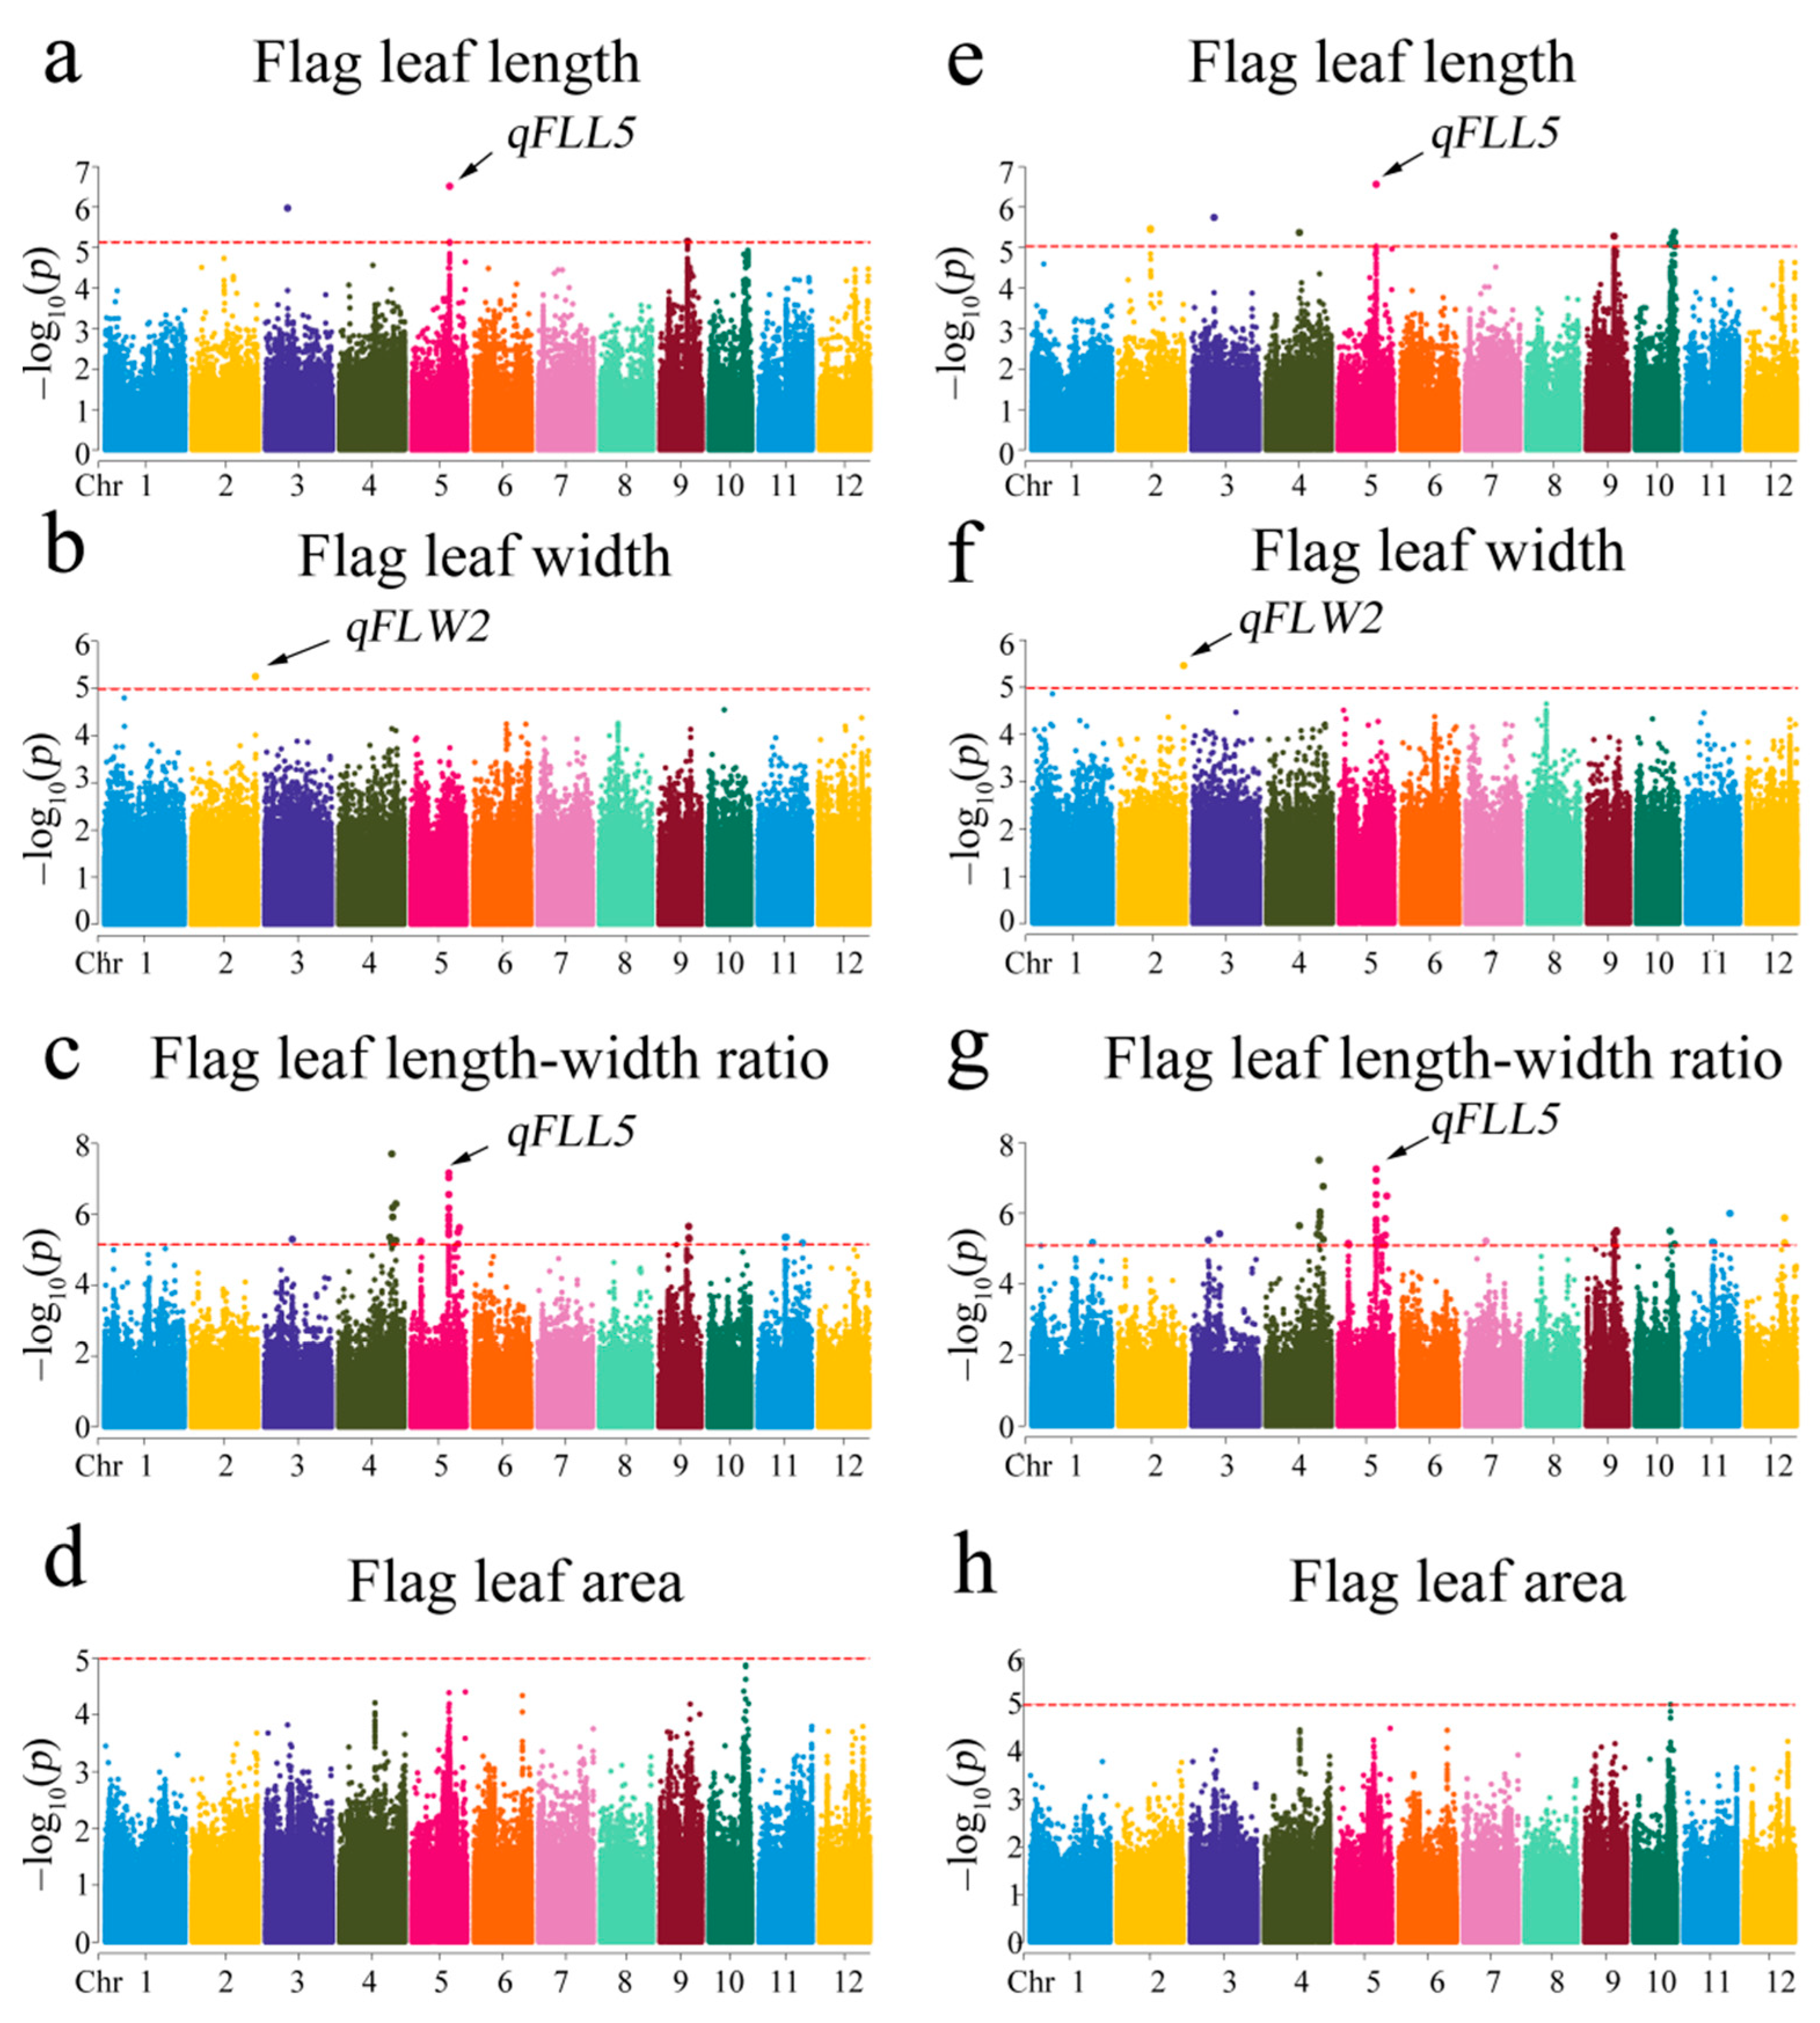
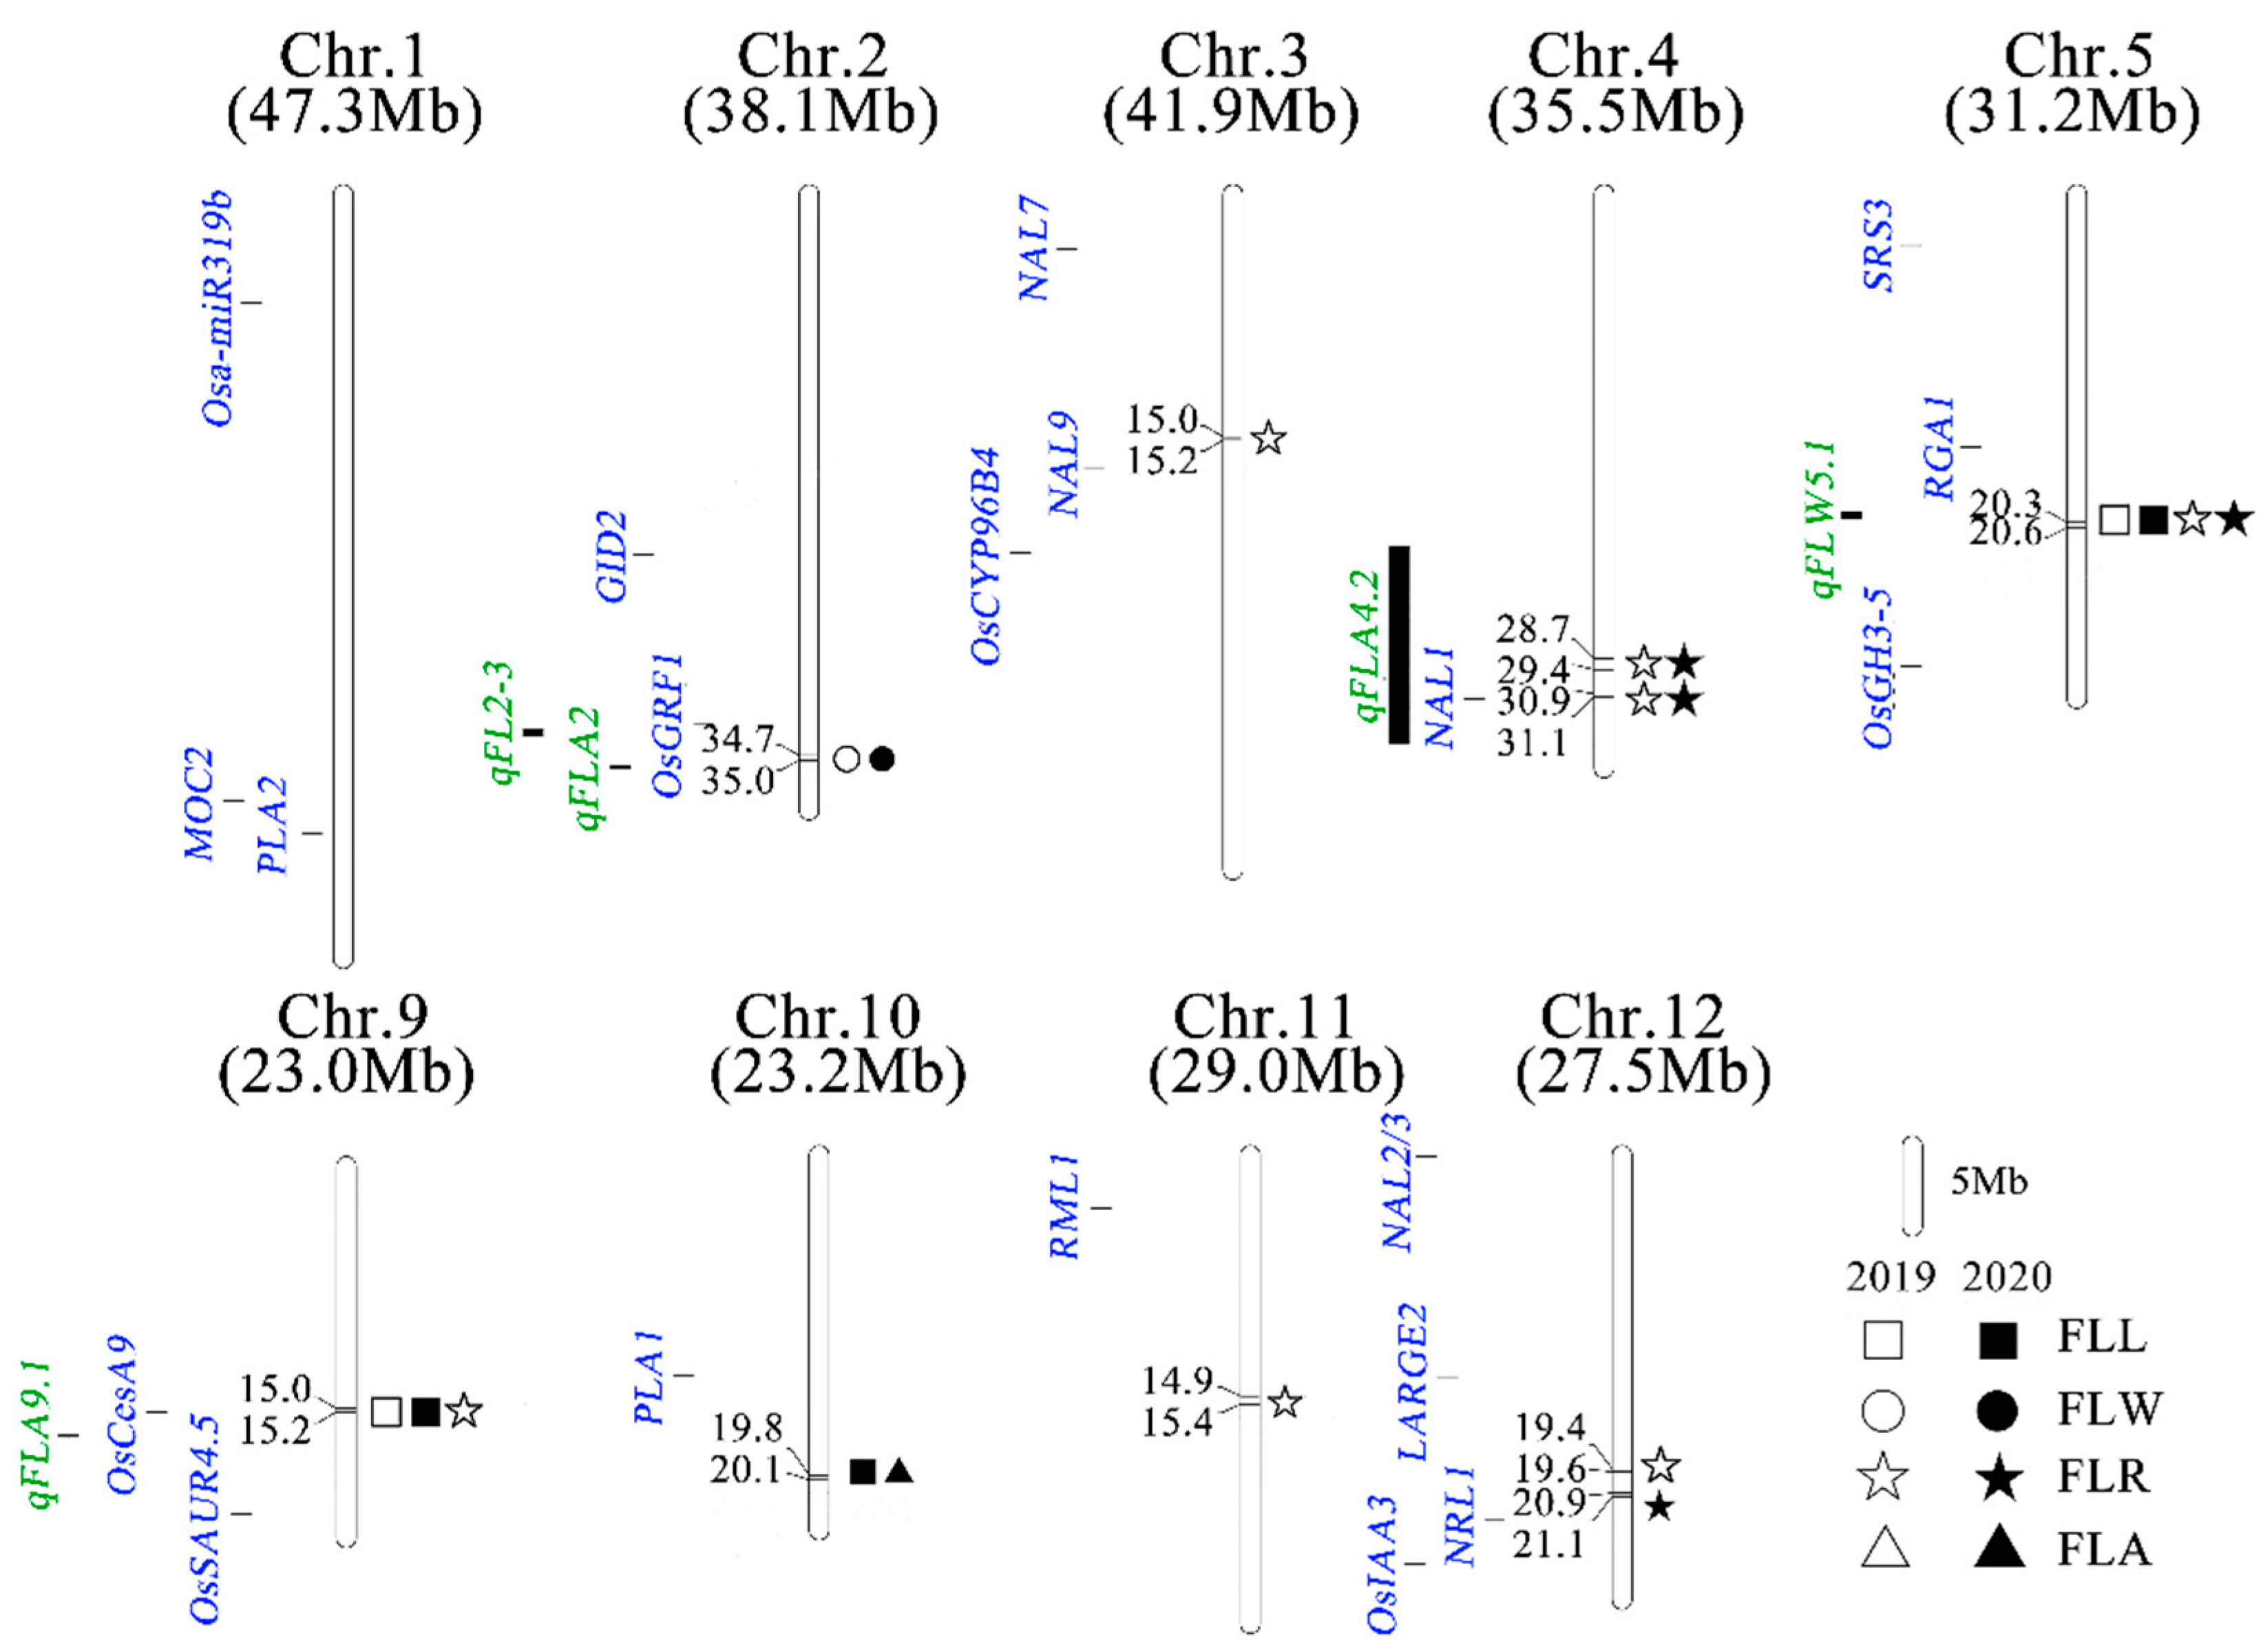
3.4. Genome-Wide Association Mapping for Flag Leaf Shapes

The GWAS of the 173 rice accessions was analyzed with respect to the GLM and MLMFigure 5 and Figure S2 show the Manhattan plot of the GWAS results. A total of 15 (3 for FLL, 1 for FLW, 10 for FLR, 1 for FLA) significant SNPs (QTLs) were significantly associated with FLL, FLW, FLR, and FLA. These SNPs were located on chromosomes 2–5, and 9–12, with PVE values ranging from 11.99–30.85%. There were 7 QTLs located in the two years and in the two models. For FLL, qFLL5 (Chr5_20,452,668) and qFLL9 (Chr9_15,134,940) were identified; while qFLW2 (Chr2_34,839,350) was identified for FLW. There were four QTLs for FLR, including qFLR4.1 (Chr4_28,859,732), qFLR4.2 (Chr4_29,302,234), qFLR4.3 (Chr3_31,016,407), and qFLR5 (Chr5_20,452,668). Chr5_20,452,668 (qFLL5, qFLR5) was found to be associated with FLL and FLR, simultaneously, in both 2019 and 2020. We consider that the derived SNP–trait associations were stable (Table 2). Eight QTLs were detected only in one year (Table S4). Therefore, we focused on the loci which were located in both the two years and the two models. Although qFLW2 was only detected for FLW, it was also detected in both years and two models. Finally, we conducted further studies on these three QTLs.

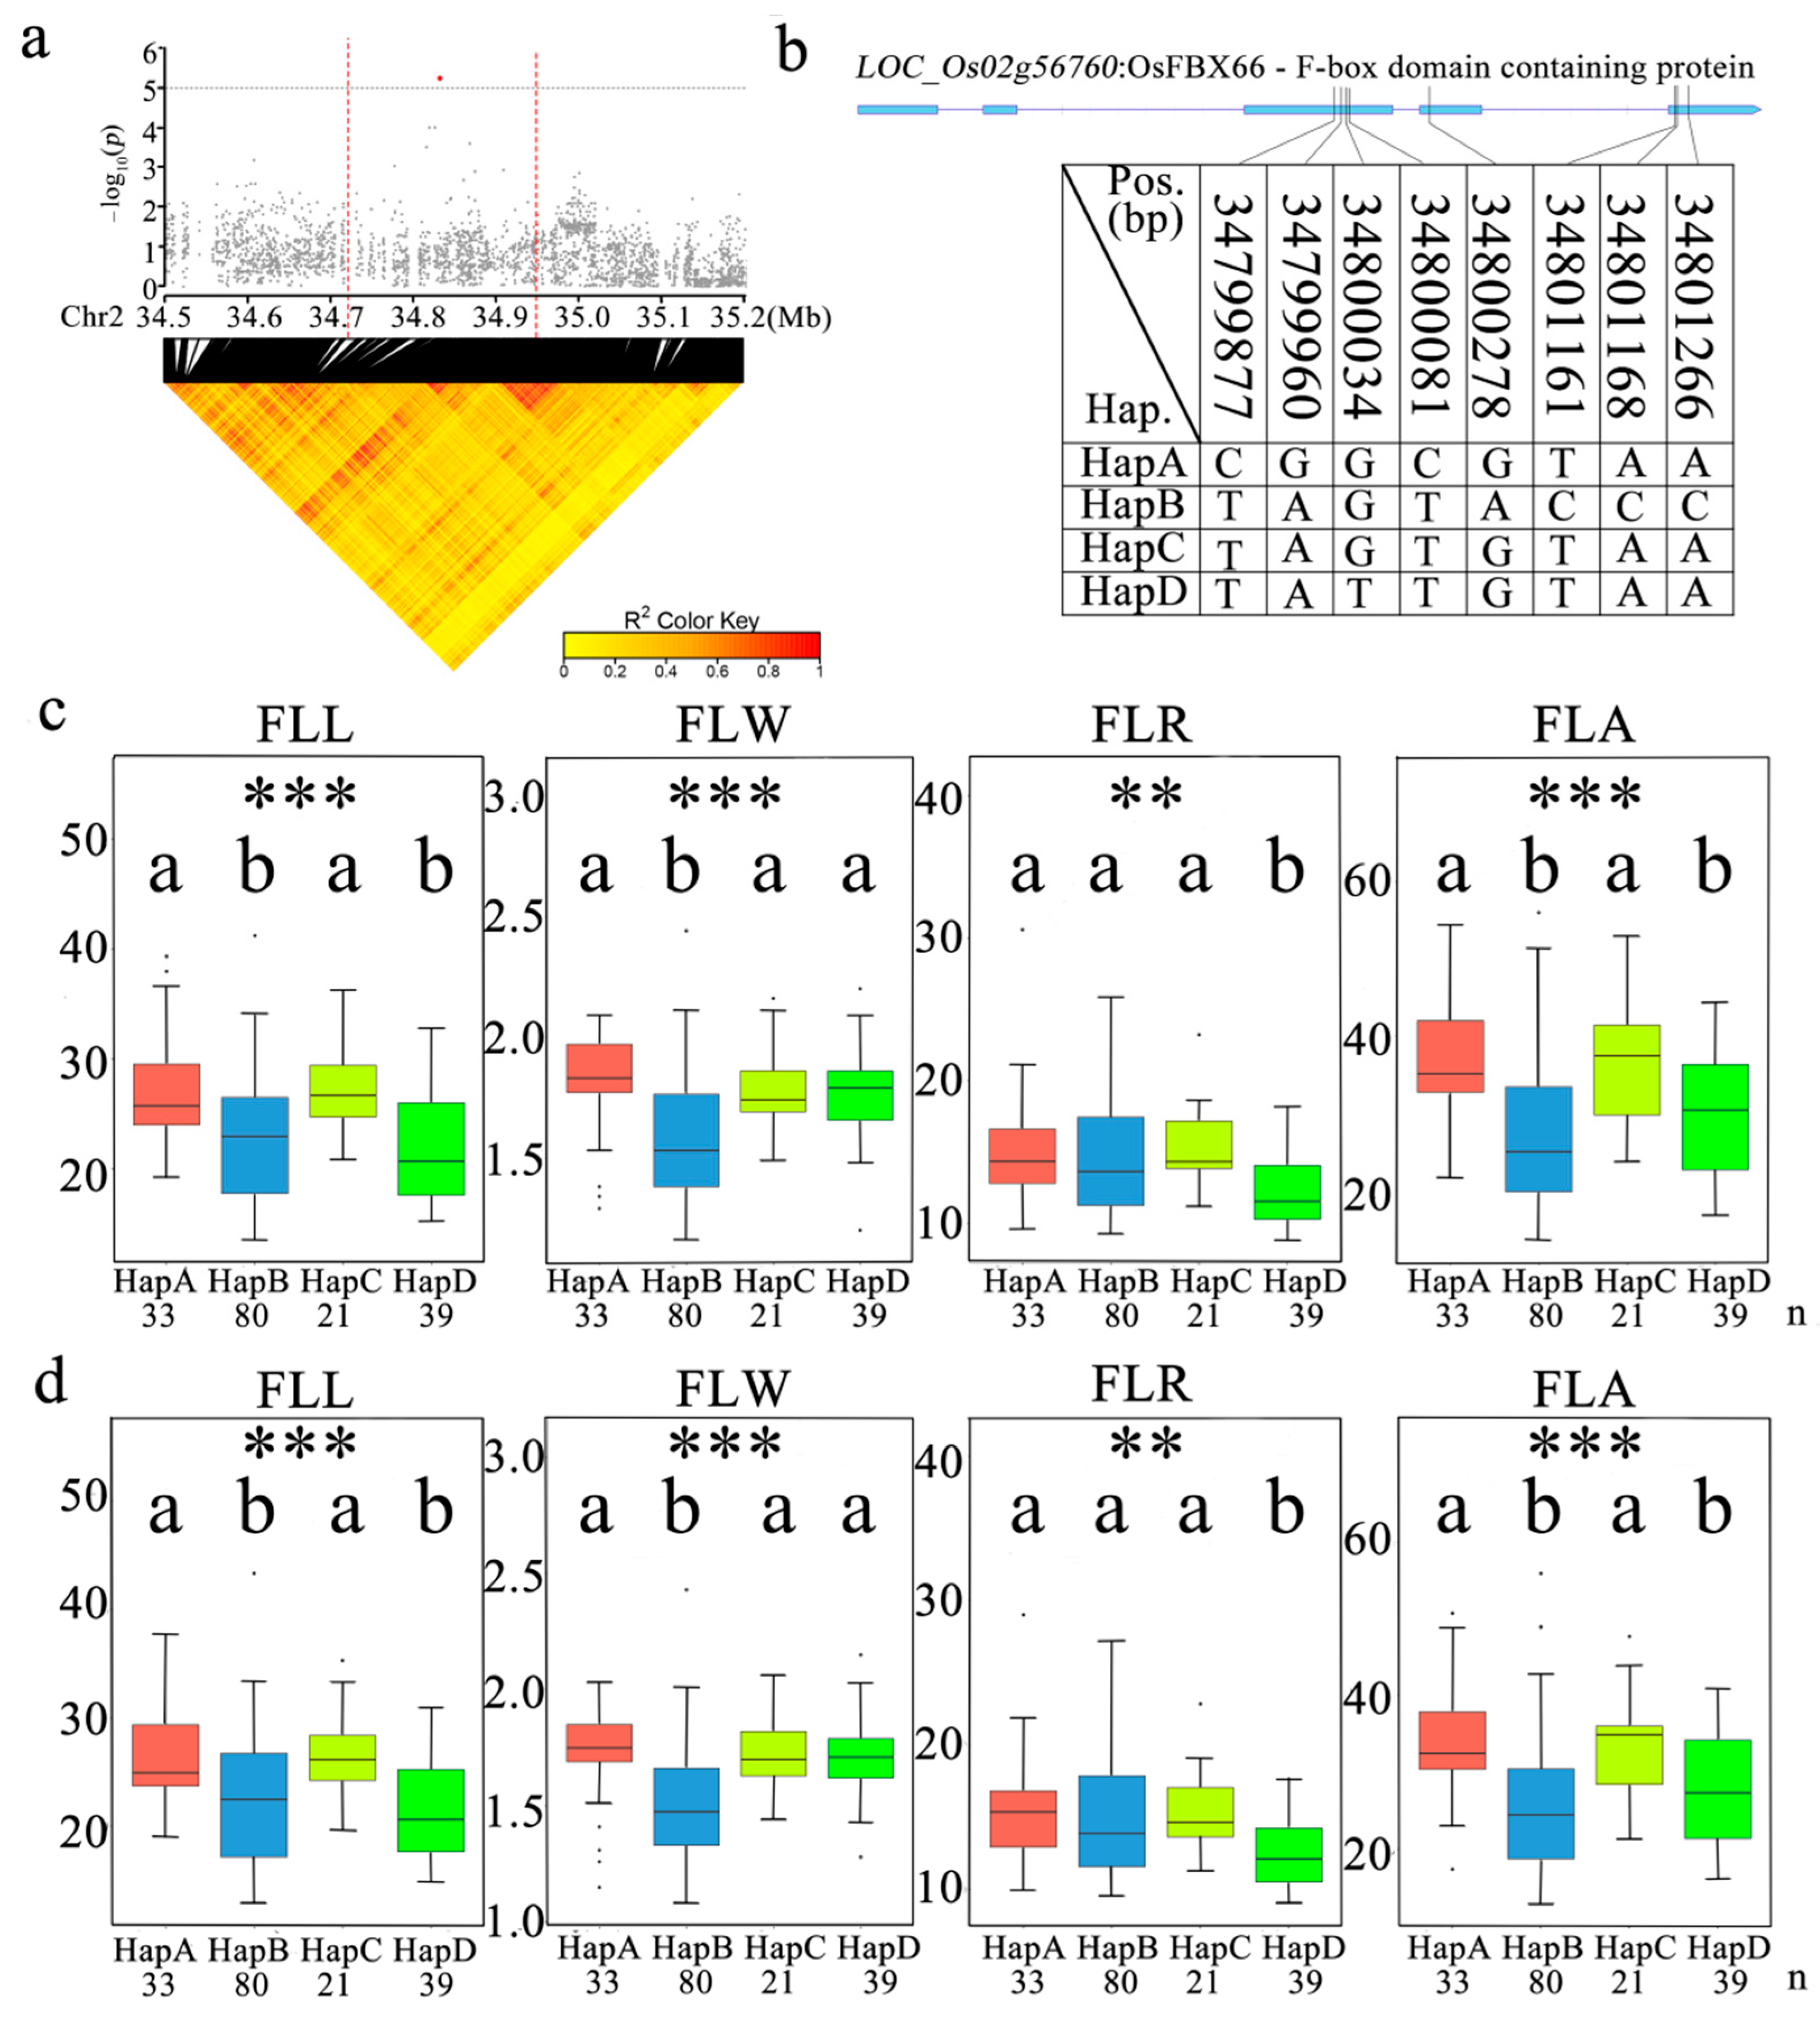
3.5. Identification of a Candidate Gene for qFLW2

A search for candidate genes playing putative roles in flag leaf shape was carried out by considering all the annotated genes included in the genomic regions indicated above, through screening of the Nipponbare genomic reference sequence (http://rice.plantbiology.msu.edu/cgi-bin/gbrowse/rice/, accessed on 15 January 2022). After removal of genes encoding hypothetical proteins, retrotransposons, and transposon proteins, we obtained 32 candidate genes associated with significant SNP loci in the 34.5–35.2 Mb region on chromosome 2 (Figure 6a; Table S5). Non-synonymous mutations were found in 8 of the 32 genes (Table S6). We found two non-synonymous SNPs in LOC_Os02g56760, which encodes an F-box domain-containing protein, OsFBX66. A previous study has demonstrated that such proteins regulate plant growth and development [38]. For the gene LOC_Os02g56760, all accessions could be divided into four haplotypes, based on the SNPs in its cDNA (Figure 6b). The average FLW of HapA was 1.77 ± 0.22 cm, while that of HapB was 1.54 ± 0.26 cm, HapC was 1.74 ± 0.19 cm, and HapD was 1.74 ± 0.17 cm. Haplotype analysis for the whole population showed that the FLW of HapB was significantly lower than the other three haplotypes, while there were no significant differences between the FLWs of HapA, HapC, and HapD (Figure 6c,d), suggesting that LOC_Os02g56760 might be a candidate gene involved in flag leaf width.

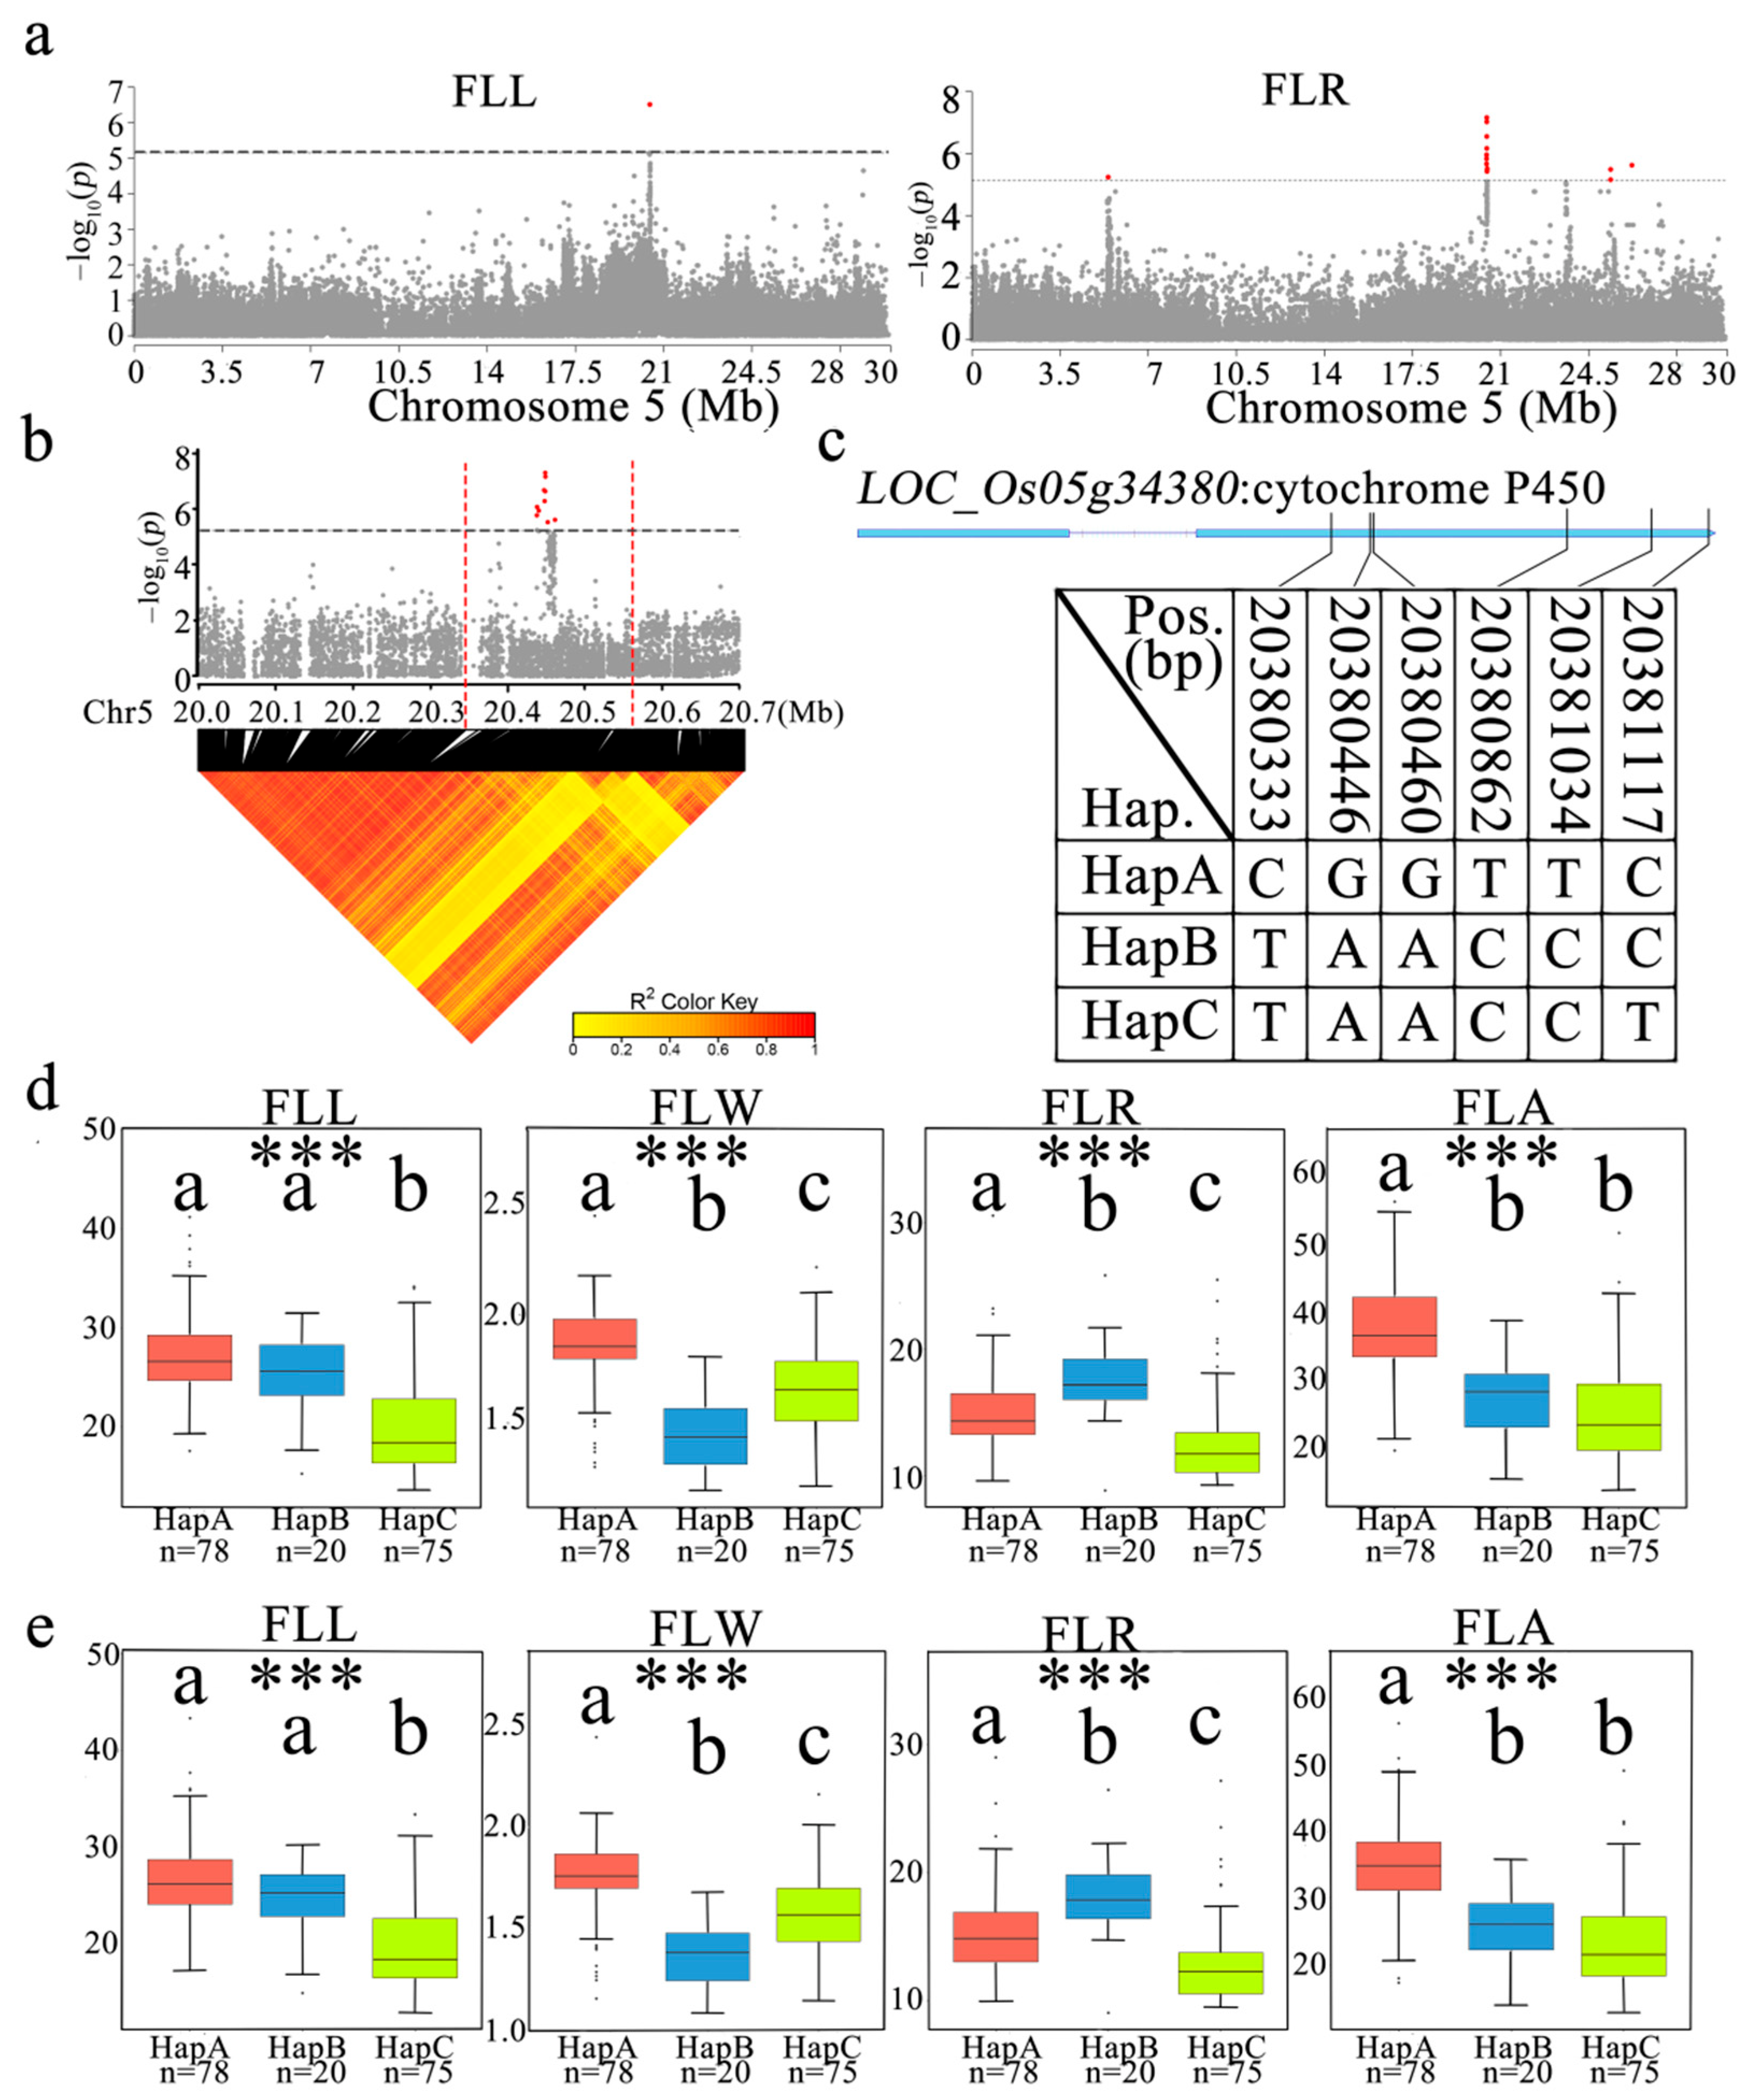
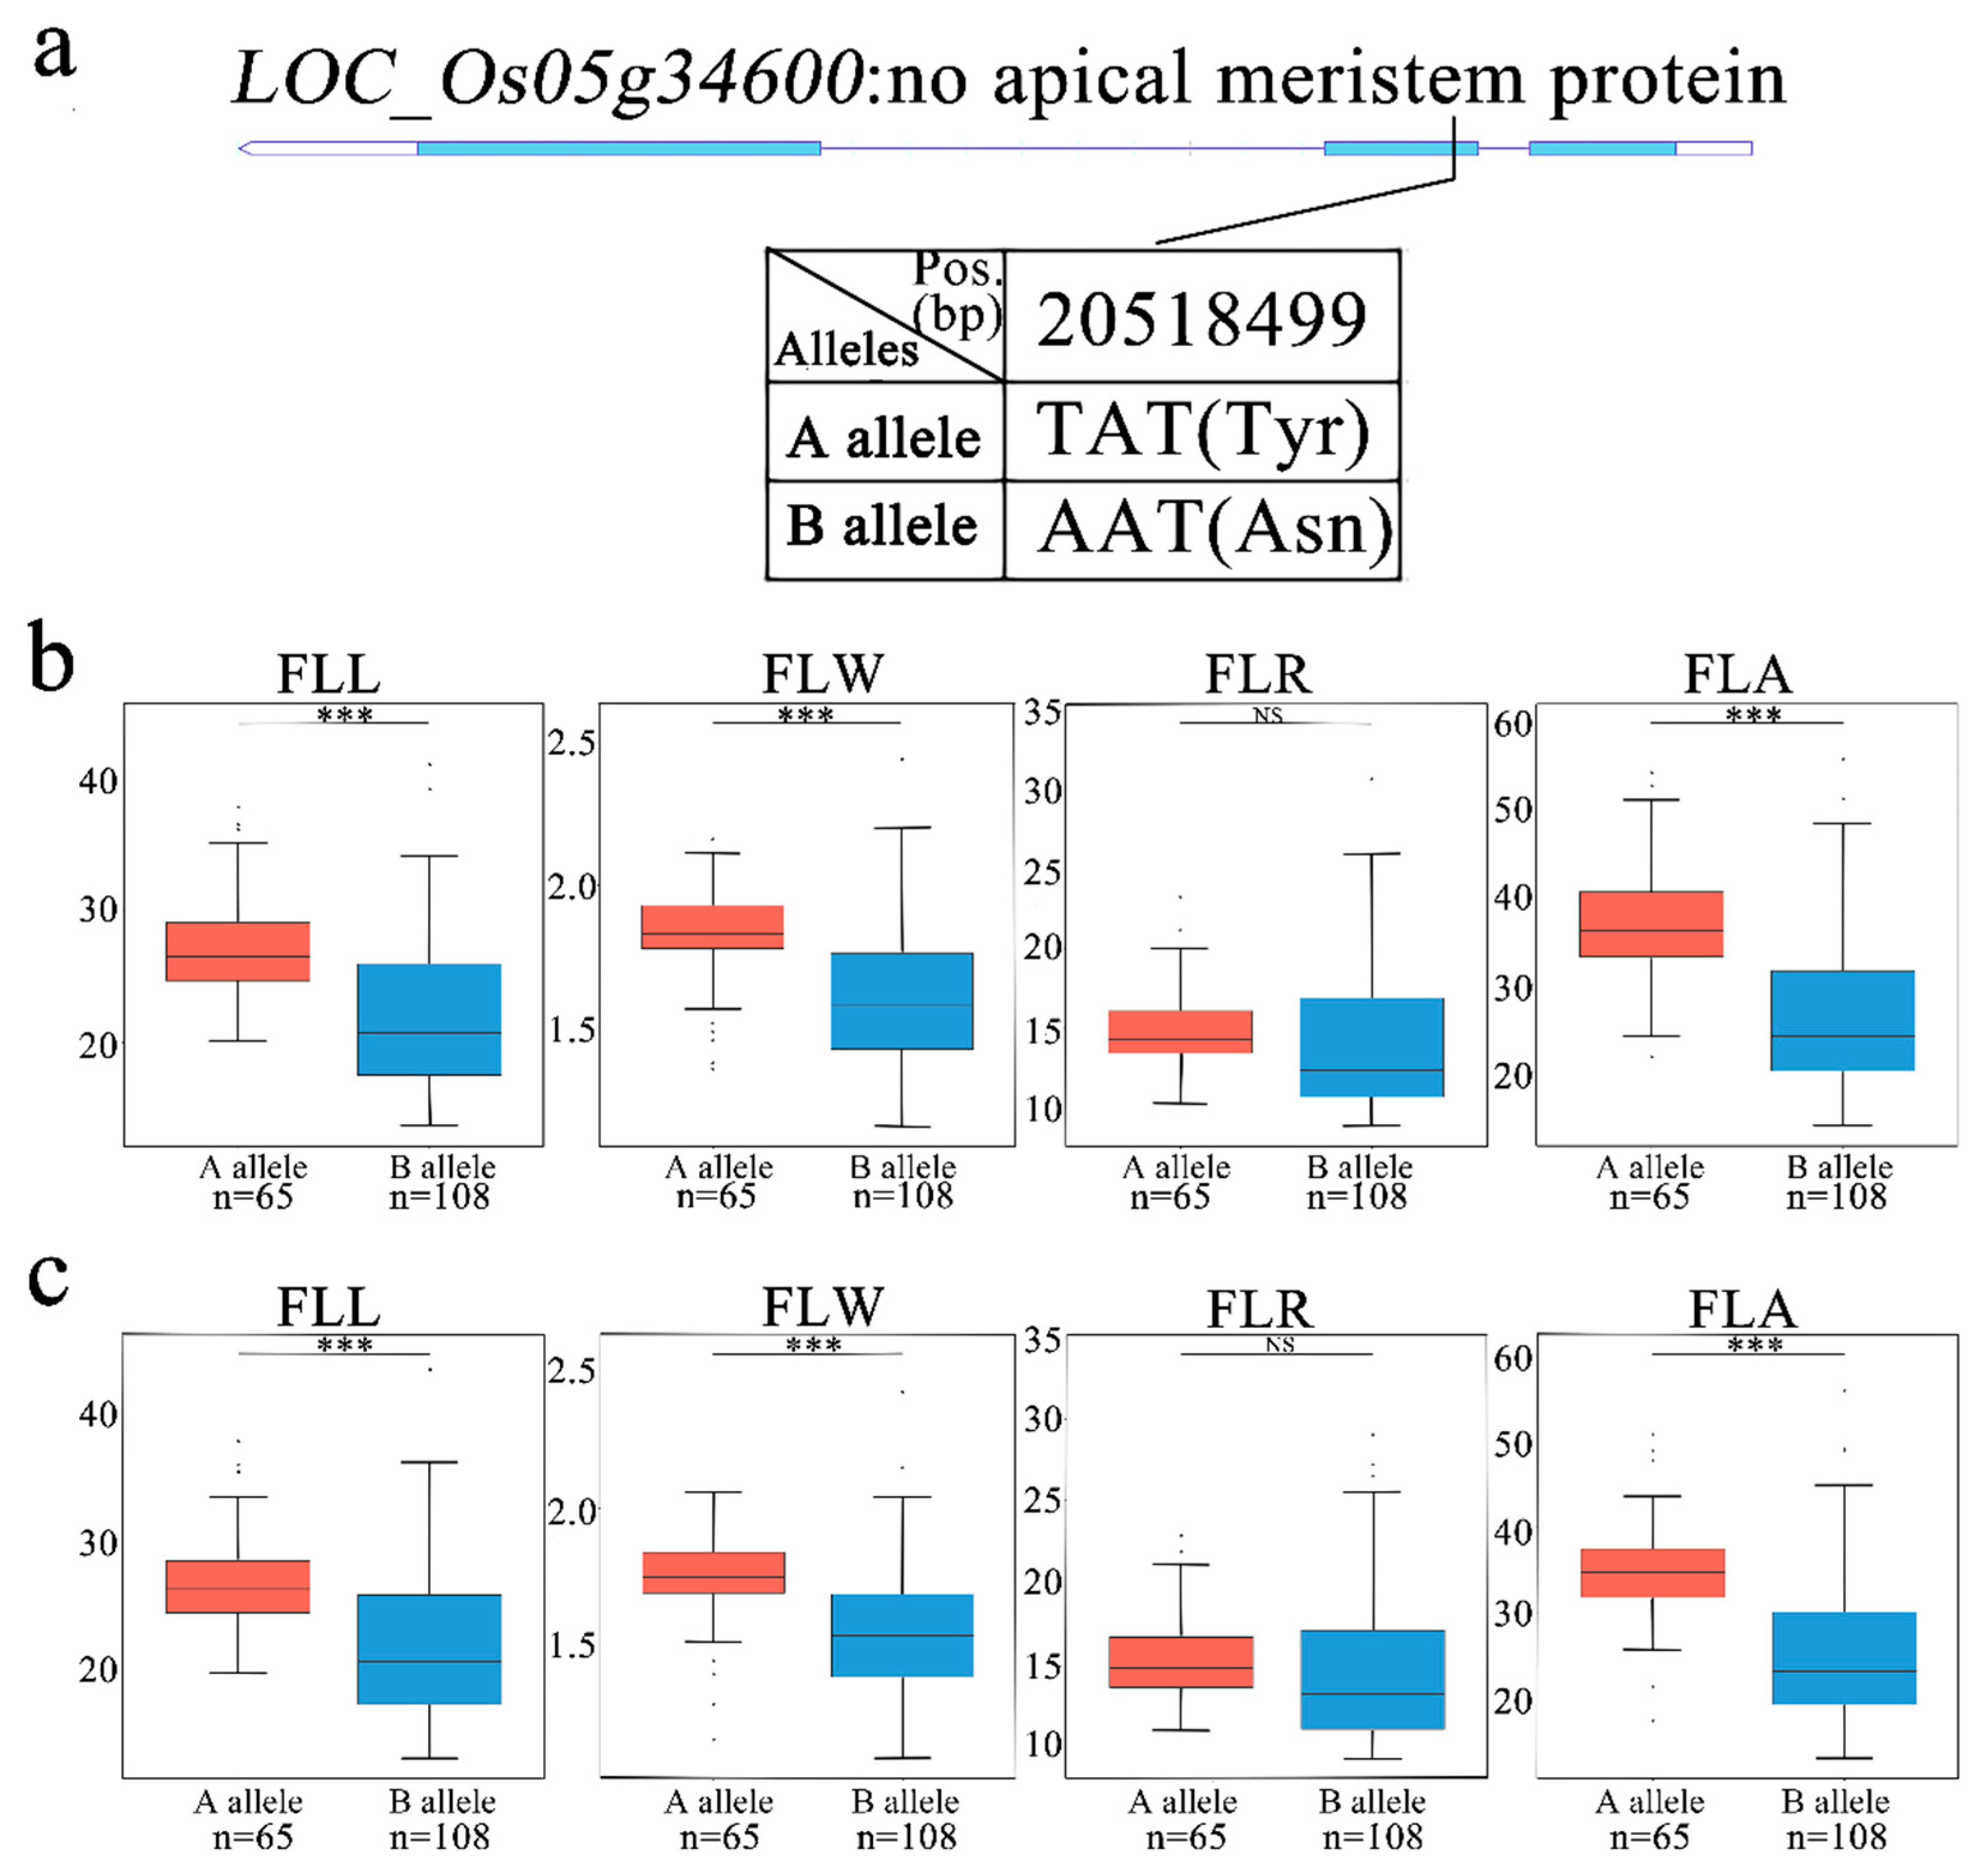
3.6. Identification of Candidate Genes for qFLL5 and qFLR5.1

qFLL5 and qFLR5.1 were the same QTL, co-located in FLL and FLR. The 20.3–20.6 Mb region on chromosome 5 contained 34 genes, including 8 genes encoding proteins with unknown functions, 12 functionally annotated genes, 1 gene encoding a hypothetical protein, 9 genes encoding retrotransposons, and 1 gene encoding a conserved hypothetical protein (Figure 7a,b; Table S7). Non-synonymous mutations were found in 5 of the 13 genes (Table S8). LOC_Os05g34380 encodes a protein (cytochrome P450). A previous study has shown that CYP450 is involved in the synthesis of auxin precursors [39]. Accessions were divided into three haplotypes, based on the SNPs in the cDNA of LOC_Os05g34380 (Figure 7c). The average FLL of the three haplotypes ranged from 20.1 ± 4.92 cm to 26.8 ± 4.42 cm, while the average FLR of three haplotypes was from 12.8 ± 3.41 cm to 17.1 ± 3.38 cm. Haplotype analysis of the whole population showed that FLW and FLR significantly differed among the three haplotypes. For FLW, HapA was the highest and HapB was the lowest; meanwhile, the FLR of HapB was significantly higher than that of the other two haplotypes, which might be due to FLR being affected by FLW (Figure 7d,e).
In this candidate region, the gene LOC_Os05g34600 was a possible candidate gene for FLR. This gene encodes a no apical meristem protein, which plays an important role in plant growth and development [40]. Accessions were divided into two alleles, based on the SNPs in the cDNA of LOC_Os05g34600 (Figure 8a). The average FLLs of the two alleles were 21.8 ± 5.80 cm and 26.6 ± 3.73 cm, respectively. Analysis of variance showed that the FLL significantly differed among the two alleles, where that of the A allele was significantly higher than the B allele. However, there was no significant difference in FLR among the two alleles (Figure 8b,c). Therefore, these two genes were selected for further study.

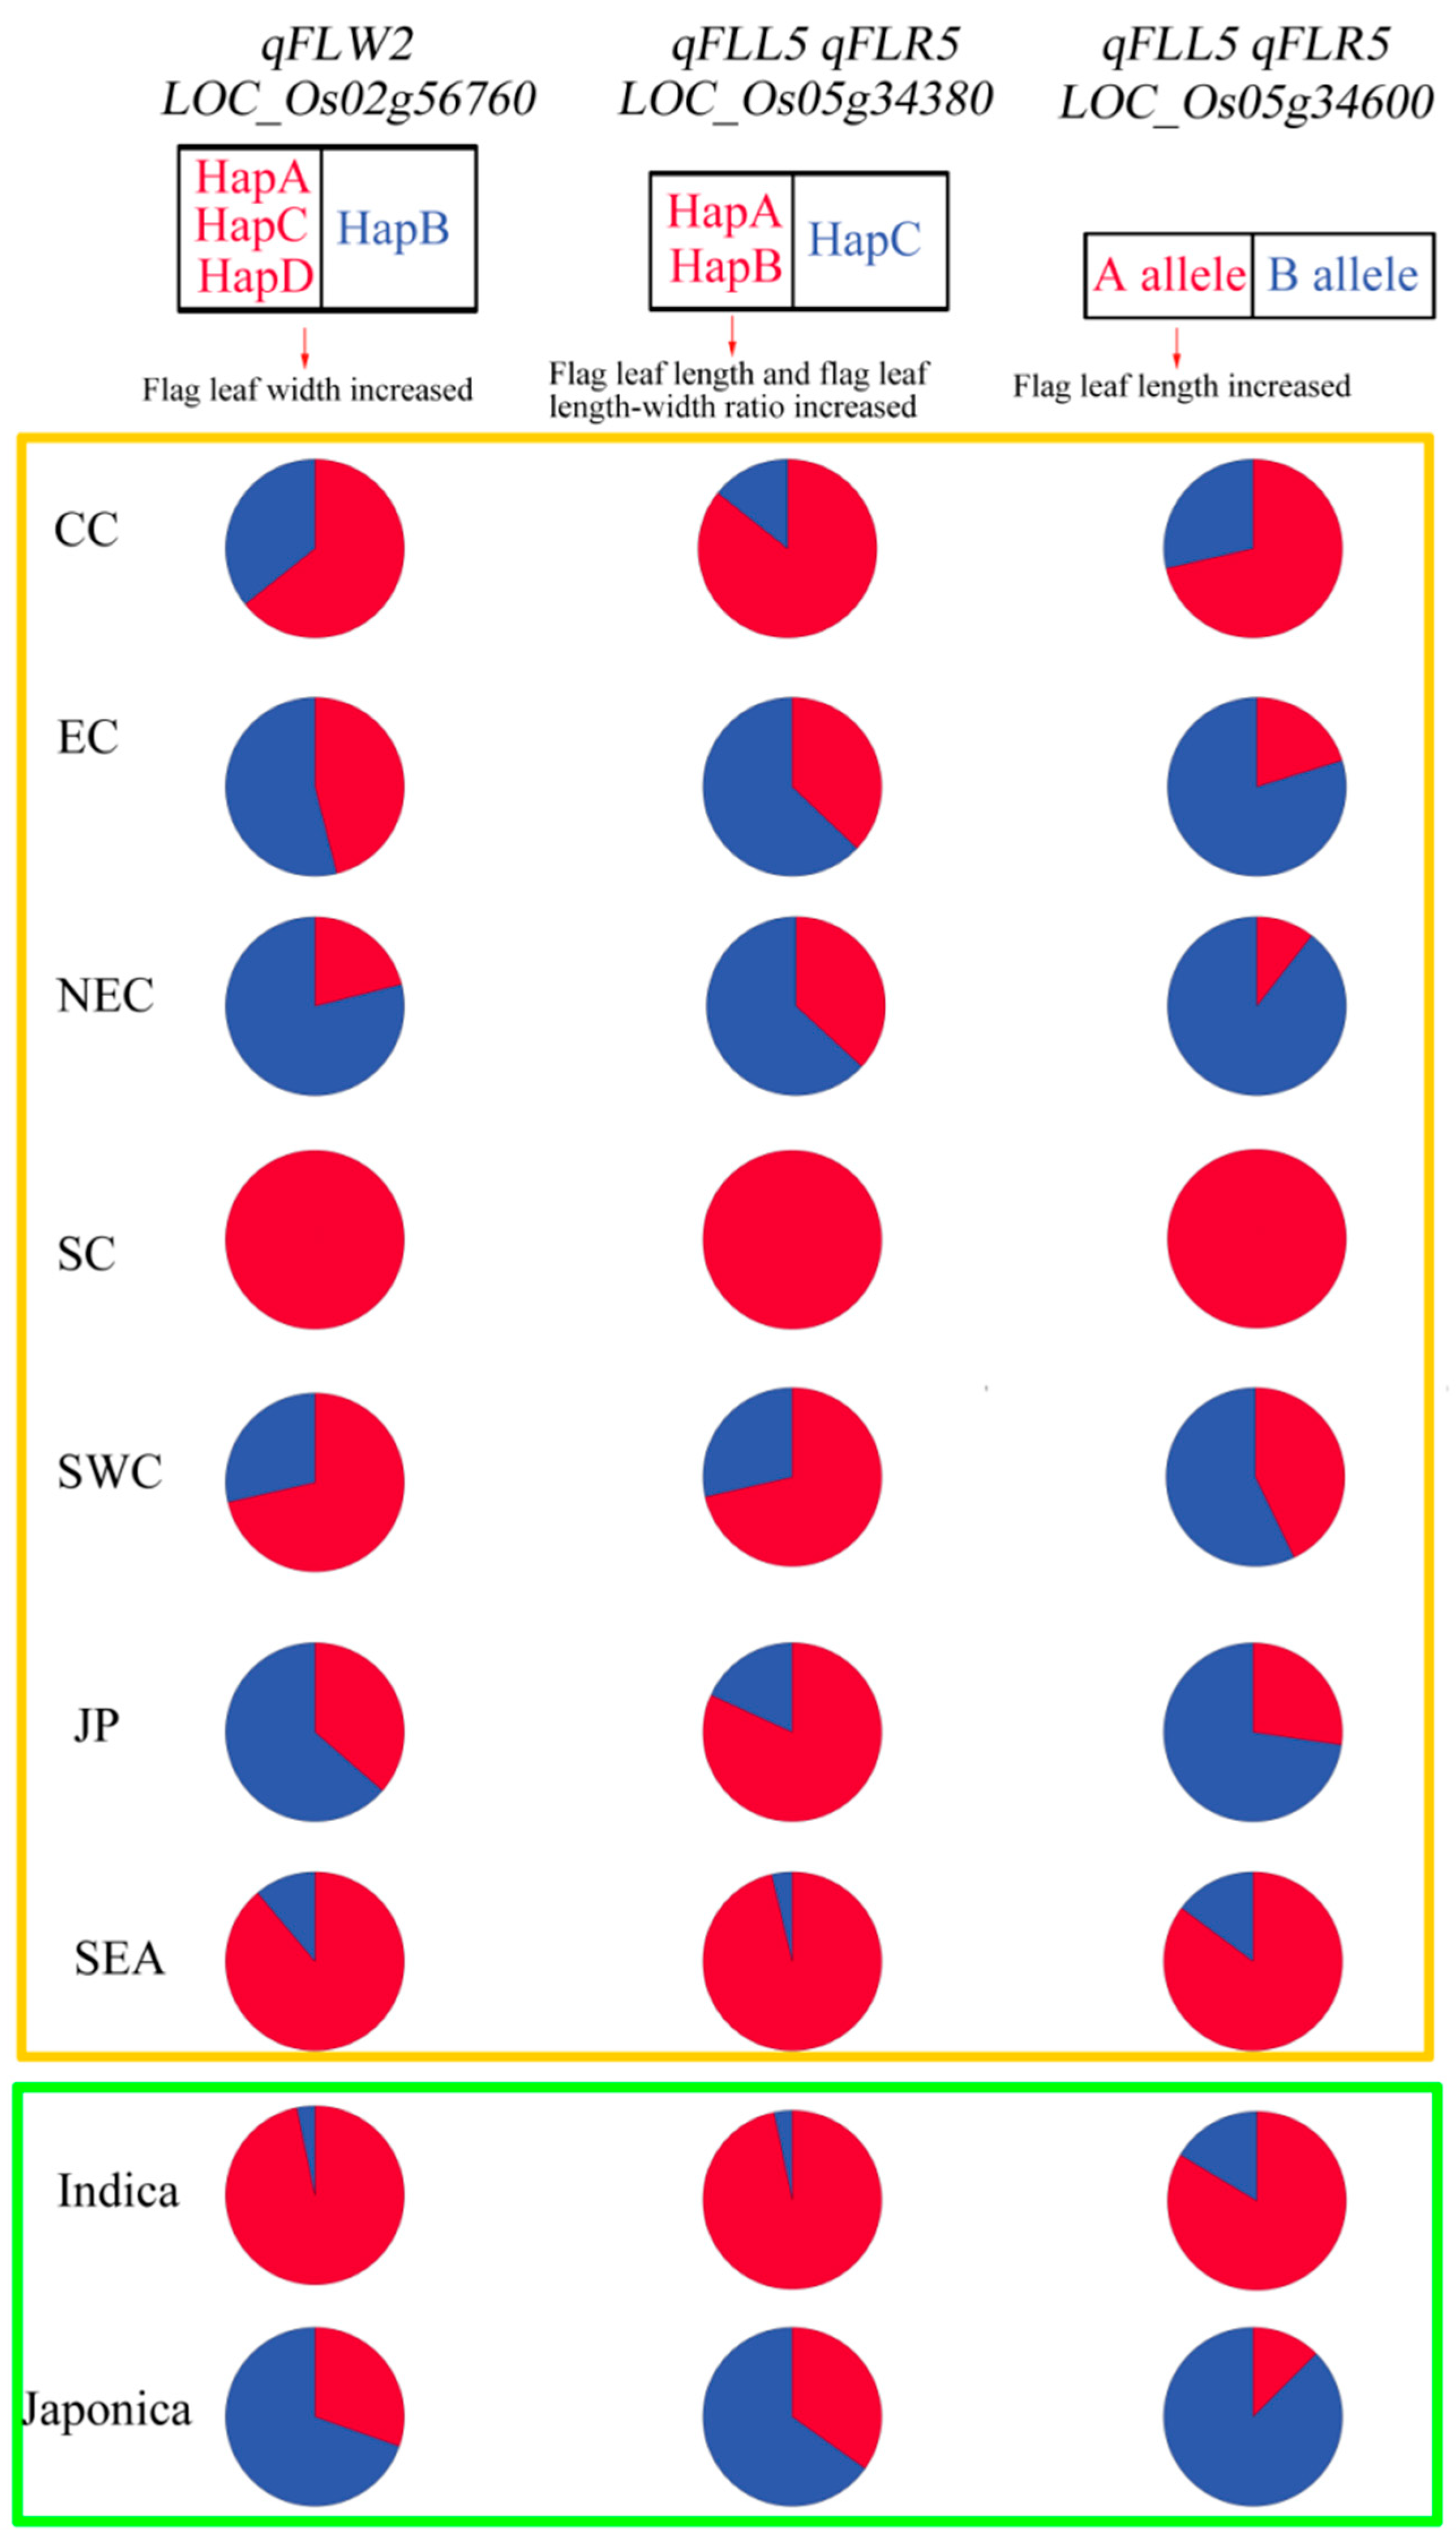
3.7. Haplotypes Distribution of Candidate Genes

In order to further analyze the results of the haplotype analysis, we sorted out the haplotypes of candidate genes according to geographical regions and subgroups (Figure 9). The favorable haplotypes, HapA, HapC, and HapD, of LOC _Os02g56760 are mainly distributed in the subgroup of indica and the low-latitude regions such as southern China (SC) and southeast Asia (SEA). For the HapB of LOC _Os02g56760, we found that it is mainly distributed in accessions collected from high-latitude regions, such as northeastern China and eastern China (EC), and FLW decreases with the increase of latitude (Figure 9). Similar situations were observed in the favorable haplotypes of other candidate genes, in which the favorable haplotypes HapA and HapB of LOC_Os05g34380 and favorable A allele of LOC_Os05g34600 were mainly distributed in accessions collected from SC and SEA. Therefore, the accessions with longer and wider flag leaves were mainly distributed in subgroups of indica and low-latitude regions, which is basically consistent with the results of the haplotype analysis in the 3K rice genome (Table S9). In 3K rice, Hap1 and Hap4 for LOC_Os05g34380 and Hap1, Hap2, and Hap3 for LOC_Os05g34600 are mainly distributed in indica rice, which have the longer flag leaf length (Table S9). And the favorable haplotypes of three candidate genes for FLW are mainly distributed in japonica rice (Table S9).

3.8. Excellent Parental Combinations Predicted for Flag Leaf Shapes

According to the measured phenotypic data and the results of the haplotype analysis, three haplotypes of the three genes showed negative effects and six haplotypes showed positive effects (Table S10). Ten excellent parents were predicted for improvement of the flag leaf shape (Table 3). As shown in the Table 3, both indica and japonica rice contain HapA of LOC_Os05g34380 and HapA of LOC_Os05g34600, and these two haplotypes were the superior haplotypes of these two genes, respectively. For FLW, there was no significant difference in HapA, HapC, and HapD in the 173 rice accessions. Taking Xiangchuanwuxinbaimi (japonica) as an example, the FLA of the superior haplotype containing these three genes could be theoretically increased by 0.18 cm2. Similarly, other species were predicted.

4. Discussion

Although only 173 rice accessions were used in this study, these germplasm resources were selected from 13 provinces in China and four other countries in Asia. The phenotypic variation was high in these germplasms, with coefficients of variation ranging from 14.73% to 30.95%, similar to those reported in other studies, including: Peng et al., who have used 280 recombinant inbred lines for flag leaf phenotypic identification, with CVs ranging from 20.16% to 25.92% [41]. Li et al., who have used a back-cross population for flag leaf phenotypic identification, with CVs ranging from 5.00% to 22.80% [42]. Zhu et al., who have used 1016 rice accessions to identify flag leaf phenotypes, with CVs ranging from 17.03% to 42.59% [43].
In the study of Rohila, J. S. et al. [44], they used the USDA rice mini-core collection (URMC) with an average sequencing depth of 1.5× for GWAS, and 14 highly salt-tolerant accessions, 6 novel loci, and 16 candidate genes in their vicinity were identified. These results may be useful in breeding for salt stress tolerance. Wu et al. [45] have mapped candidate genes that might be related to the mesocotyl length of rice using 2.5× and 5× average genome coverage of a mini-core collection of Chinese rice germplasm with water-saving and drought-resistant rice (WDR). Wang et al. [46] have conducted a comparison with deeper sequencing, and found that low-coverage sequencing provides a powerful and cost-effective alternative for GWAS in rice. Therefore, the 4× sequencing depth per genome used in our study was sufficient for GWAS, allowing us to map candidate genes in rice.
There are many ways to build an evolutionary tree, each of which has its own advantages and disadvantages. Neighbor-Join (NJ) algorithm [47] has the advantages of fast speed and elegance, and it ensures that the right tree is generated when accurate distances are given; however, when the sequence length is limited, it cannot guarantee efficiency or unbiased behavior [48]. Maximum parsimony focuses on minimizing the total character states during phylogenetic tree construction, but only the main distinguishing characteristics are considered in maximum parsimony. Maximum likelihood is very appropriate when analyzing a simple data set containing genetic information. When the degree of variance among the genetic data is low, the maximum likelihood scores are reliable. In comparison to the advantages mentioned above, this method is a slow and intense process. Furthermore, in the absence of a single data set, the error output may be high [49]. Bayesian has a strong connection to the maximum likelihood method, and may be faster than maximum likelihood; however, it is difficult to determine whether the Markov Chain Monte Carlo (MCMC) approximation has run long enough [50]. Although the NJ method is not the best, it is convenient, saves time for analysis, and is easier to operate than other methods. Therefore, it was considered suitable for the needs of our study.
GWAS analysis has been widely used worldwide, and regression models are generally constructed to test whether there exists a correlation between markers and phenotypes. Population structure is usually represented by the proportion of subpopulations that individuals belong to, also known as the Q matrix. Because the subsets in the Q matrix has fixed effect fitting, a general linear model (GLM) is used to test genetic markers (S) [51,52]. This model can be conceptually expressed as y = Q + S + e, where y and e are phenotypes and residues, respectively. This model is also known as the Q model, which will cause serious overestimation of the site effect value and produce false positive results when we solve it. Mixed linear model (MLM) can effectively correct the population structure and complex genetic relationships within populations. A mixed linear model (MLM) can be expressed as y = Q + K + S + e, also known as a Q + K model. Previous studies have shown that Q and Q + K models control false positives better than simple models, such as t-tests. The MLM is better than the simple models [37,53], which was well-reflected in our results. Therefore, we used both MLM and GLM to ensure the accuracy of our results.
The LD distance in our study was similar to those reported previously. In the study of Wang et al. [15], the LD decay distance was 109 kb. Li et al. [54] have used natural populations to explore alkali-tolerance genes in rice, and their LD decay distance was 109.77 kb. In the study of Huang et al. [55], the rice genome of the LD generally decayed at 100 kb. By comparing the detected QTLs of leaf shapes in our study with the QTLs obtained in previous studies, we found that 4 QTLs were similar to those reported in previous studies, while the remaining 11 QTLs found in our study were novel QTLs with MLM (Figure 10). qFW2, detected in our study, was located on Chr2 (34.7–35.0 Mb), which was close to qFL2-3 (33.1–33.5 Mb), which regulates flag leaf length [16], and qFLA2, which regulates flag leaf area [10]. The qFLR5 (Chr5: 20.3–20.6 Mb) was near to qFLW5.1 (19.7–20.0 Mb), reported in the study of Xu et al. [5]. Wang et al. [10] have detected two QTLs—qFLA4.2 (21.8–34.0 Mb) and qFLA9.1 (16.6–16.7 Mb)—using an RIL population. In our study, the QTLs qFLR4.1, qFLR4.2, qFLR4.3, and qFLR9 were found to overlap with qFLA4.2 and were close to qFLA9.1. The QTL qFLW2 in this study was located near the cloned gene OsGRF1, which encodes a transcription factor. OsGRF1 RNAi plants have short leaves, while over-expressed plants have enlarged leaves [56]. NAL9 [17] encodes a protein homologous to the ClpP6 subunit of Arabidopsis thaliana L; and mutant nal9 exhibits a narrow leaf phenotype throughout the growth period, which was found to be located near qFLR3. Mutations in NAL1, which encodes trypsin-like serine/cysteine proteases, significantly reduce auxin polar transport activity, which was found to be located near qFLR4.3 [19]. OsCesA9, located near qFLR9, is a catalytic subunit of cellulose synthase, which is involved in cellulose synthesis; notably, OsCesA9 mutants present smaller leaves [18]. NRL1 [22], which was found to be located near qFLR12.2, encodes the cellulose synthase-like protein D4. Mutants of nrl1 showed decreased leaf width, semi-coiled leaves, and different degrees of a dwarf phenotype.
The qFLW2 (LOC_Os02g56760) of FLW, which was detected in both of the two years in this study, was selected for further analysis. The gene LOC_Os02g56760 encodes an F-box domain containing protein. Previous studies have shown that F-box proteins can regulate plant growth and development, as well as responding to stress by integrating plant hormone signaling pathways [38,57], which play an important role in regulating various developmental processes and stress responses [58,59]. In the study of Baute, J. et al. [38], the ectopic expression of ZmFBX92, which encodes an F-box protein, was shown to affect the leaf size of Arabidopsis. This is mainly due to the influence of the F-box protein FBX92 on cell division, resulting in different cell numbers and, ultimately, affecting leaf size. Therefore, we may speculate that the gene LOC_Os02g56760 is most likely a candidate gene for flag leaf width in rice.
qFLL5 and qFLR5.1 were in the same QTL, which were both detected for FLL and FLR in the two years. Through functional annotation and haplotype analysis, two genes—LOC_Os05g34380 and LOC_Os05g34600—were selected as candidate genes for FLL and FLR. LOC_Os05g34380 encodes a cytochrome P450 protein, a broad-spectrum biocatalytic enzyme which is widely distributed throughout the biological world and is involved in a variety of metabolic reactions. The CYP450 protein not only participates in the metabolism of endogenous substances [60,61], but also plays an important role in the degradation of exogenous substances [62]. Cytochrome P450 has also been shown to be involved in glucosinolate and auxin biosynthesis. CYP79B2 and CYP79B3 of Arabidopsis can catalyze Trp to synthesize indoleacetaloxime (IAOx), which is a precursor of glucosinolate and a precursor of auxin [39,63]. The other gene, LOC_Os05g34600, encodes a no apical meristem (NAM) protein. The NAM family of plant-specific transcription factors belongs to the NAC transcription factor superfamily, which plays an important role in plant growth and development, physiological metabolism, and the response to various stresses [40,64]. The family of no apical meristem (NAM) proteins is plant development proteins. Mutations in NAM resulted in a failure to develop a shoot apical meristem in petunia embryos. NAM proteins have been indicated as playing a role in determining the positions of meristems and primordials [65]. One member of this family, NAP (NAC-like, activated by AP3/PI), is encoded by the target genes of the AP3/PI transcriptional activators and functions in the transition between growth by cell division and cell expansion in stamens and petals [66]; therefore, LOC_Os05g34600 may be one of the candidate genes affecting rice flag leaf shape.
The FLA of rice could be increased by using the optimal alleles detected in this study. Among the ten predicted parents, indica rice theoretically improved flag leaf area more than japonica rice. The performance of all predicted superior parents on flag leaves needs further verification in the production contexts.

5. Conclusions

Two SNP loci significantly related to flag leaf shape were detected on chromosomes 2 and 5 through a study conducted during 2019 and 2020. The gene LOC_Os02g56760 was identified as the candidate gene for FLW, while LOC_Os05g34380 and LOC_Os05g34600 were identified as candidate genes for FLL and FLR. These genes will be the focus of further studies. Ten rice accessions were predicted to be excellent parents that possess favorable alleles of the flag leaf shape genes detected in this study. The results of this study provide a molecular basis and information on optimal parents for flag leaf shape improvement in the rice breeding context.

Supplementary Materials

The following supporting information can be downloaded at https://www.mdpi.com/article/10.3390/agronomy12081814/s1. Original data set 1: The SNP data of 173 accessions; Figure S1: Geographical distribution maps of 173 rice accessions used in this study; Figure S2: Manhattan plots of genome-wide association studies for FLL, FLW, FLR, and FLA with GLM. (a) Manhattan plot for FLL in 2019; (b) Manhattan plot for FLW in 2019; (c) Manhattan plot for FLR in 2019; (d) Manhattan plot for FLA in 2019; (e) Manhattan plot for FLL in 2020; (f) Manhattan plot for FLW in 2020; (g) Manhattan plot for FLR in 2020; (h) Manhattan plot for FLA in 2020.; Table S1: Names and origins of 173 rice accessions used for association mapping; Table S2: Results of variance analysis for the flag leaf shape; Table S3: Names and origins of 173 rice accessions used for association mapping and the corresponding Q-values calculated by the STRUCTURE software; Table S4. SNP Positions for FLL, FLW, FLR, and FLW identified by GWAS in 2019 or 2020; Table S5: Candidate gene annotation in the LD region 34.5–35.2 Mb associated with FLW; Table S6: SNP information in 34.5–35.2 Mb candidate region for FLW; Table S7: Candidate gene annotation in the LD region 20.3–20.6 Mb associated with FLL and FLR; Table S8: SNP information in 20.3–20.6 Mb associated with FLL and FLR; Table S9. Haplotype analysis of three candidate genes in the 3K rice genome. Table S10: Gene haplotype distribution of 173 accessions.

Author Contributions

R.W., X.L., Z.Z., M.L. and C.L. conducted experiments and collected data; Y.C., M.D. and Z.L. carried out data collation and statistical analyses; M.X. and M.D. constructed the graphics; M.D. wrote the paper; E.L. designed the experiment and reviewed the paper. All authors have read and agreed to the published version of the manuscript.

Funding

This research was funded by the Natural Science Foundation of Anhui Universities, grant number KJ2020A0118; National Natural Science Foundation of China, grant numbers 32101768 and U21A20214; Natural Science Foundation of Anhui Province, grant number 2108085MC97; Talent project of Anhui Agricultural University, grant number rc312002; Natural Science Research Project of Colleges and Universities in Anhui Province, grant number YJS20210250; Key Research and Development Program of Anhui Province, grant number 202004a06020024.

Data Availability Statement

Not applicable.

Acknowledgments

The authors thank Delin Hong, State Key Laboratory of Crop Genetics and Germplasm Innovation, Nanjing Agricultural University, for providing the rice materials used in this study.

Conflicts of Interest

The authors declare no conflict of interest.

References

  1. Fageria, N.K. Yield physiology of rice. J. Plant Nutr. 2007, 30, 843–879. [Google Scholar] [CrossRef]
  2. Yoshida, S. Fundamentals of Rice Crop Science; International Rice Research Institute: Manila, Philippines, 1981. [Google Scholar]
  3. Li, Z.; Pinson, S.R.; Stansel, J.W.; Paterson, A.H. Genetic dissection of the source-sink relationship affecting fecundity and yield in rice (shape Oryza sativa L.). Mol. Breed. 1998, 4, 419–426. [Google Scholar] [CrossRef]
  4. Yuan, L.; Denning, G.; Mew, T. Hybrid Rice Breeding for Super High Yield; Denning, G.L., Mew, T.W., Eds.; International Rice Research Institute: Manila, Philippines, 1998; pp. 10–12. [Google Scholar]
  5. Xu, J.; Zhao, Q.; Zhao, Y.; Zhu, L.; Xu, C.; Gu, M.; Han, B.; Liang, G. Mapping of QTLs for Flag Leaf Shape Using Whole-Genome Re-sequenced Chromosome Segment Substitution Lines in Rice. Chin. J. Rice Sci. 2011, 25, 483–487. [Google Scholar]
  6. Farooq, M.; Tagle, A.G.; Santos, R.E.; Ebron, L.A.; Fujita, D.; Kobayashi, N. Quantitative trait loci mapping for leaf length and leaf width in rice cv. IR64 derived lines. J. Integr. Plant Biol. 2010, 52, 578–584. [Google Scholar] [CrossRef] [PubMed]
  7. Lin, L.; Zhao, Y.; Liu, F.; Chen, Q.; Qi, J. Narrow leaf 1 (NAL1) regulates leaf shape by affecting cell expansion in rice (Oryza sativa L.). Biochem. Biophys. Res. Commun. 2019, 516, 957–962. [Google Scholar] [CrossRef]
  8. Zhang, G.H.; Li, S.Y.; Wang, L.; Ye, W.J.; Zeng, D.L.; Rao, Y.C.; Peng, Y.L.; Hu, J.; Yang, Y.L.; Xu, J.; et al. LSCHL4 from Japonica Cultivar, Which Is Allelic to NAL1, Increases Yield of Indica Super Rice 93–11. Mol. Plant 2014, 7, 1350–1364. [Google Scholar] [CrossRef] [PubMed] [Green Version]
  9. Cai, J.; Zhang, M.; Guo, L.; Li, X.; Bao, J.; Ma, L. QTLs for rice flag leaf traits in doubled haploid populations in different environments. Genet. Mol. Res. 2015, 14, 6786–6795. [Google Scholar] [CrossRef] [PubMed]
  10. Wang, S.; Ye, H.; Li, S.; Jiang, J.; Zhang, Y.; Pan, C.; Zhou, W.; Chen, W.; Wang, K.; Dai, G. QTL mapping and analysis of candidate genes in flag leaf morphology in rice. Sci. Sin. Vitae 2021, 51, 567–578. [Google Scholar] [CrossRef]
  11. Chen, M.; Luo, J.; Shao, G.; Wei, X.; Tang, S.; Sheng, Z.; Song, J.; Hu, P. Fine mapping of a major QTL for flag leaf width in rice, qFLW4, which might be caused by alternative splicing of NAL1. Plant Cell Rep. 2012, 31, 863–872. [Google Scholar] [CrossRef]
  12. Xiao, K.; Zuo, H.L.; Gong, Y.J.; Zhang, J.Z.; Zhang, Y.J.; Dong, Y.J. Locating quantitative trait loci affecting flag-leaf shape traits in rice (Oryza sativa L.). J. Shanghai Norm. Univ. Nat. Sci. 2007, 36, 66–70. [Google Scholar]
  13. Jiang, S.; Zhang, X.; Wang, J.; Chen, W.; Xu, Z. Fine mapping of the quantitative trait locus qFLL9 controlling flag leaf length in rice. Euphytica 2010, 176, 341–347. [Google Scholar] [CrossRef]
  14. Peng, M.; Yang, G.; Zhang, Q.; An, B.; Li, Y. QTL analysis for flag leaf morphological traits in rice (Oryza sativa L.) under different genetic backgrounds. Chin. J. Rice Sci. 2007, 21, 247–252. [Google Scholar]
  15. Wang, J.; Wang, T.; Wang, Q.; Tang, X.; Ren, Y.; Zheng, H.; Liu, K.; Yang, L.; Jiang, H.; Li, Y. QTL mapping and candidate gene mining of flag leaf size traits in Japonica rice based on linkage mapping and genome-wide association study. Mol. Biol. Rep. 2022, 49, 63–71. [Google Scholar] [CrossRef] [PubMed]
  16. Tang, X.; Gong, R.; Sun, W.; Zhang, C.; Yu, S. Genetic dissection and validation of candidate genes for flag leaf size in rice (Oryza sativa L.). Theor. Appl. Genet. 2018, 131, 801–815. [Google Scholar] [CrossRef]
  17. Li, W.; Wu, C.; Hu, G.; Xing, L.; Qian, W.; Si, H.; Sun, Z.; Wang, X.; Fu, Y.; Liu, W. Characterization and fine mapping of a novel rice narrow leaf mutant nal9. J. Integr. Plant Biol. 2013, 55, 1016–1025. [Google Scholar] [CrossRef] [PubMed]
  18. Tanaka, K.; Murata, K.; Yamazaki, M.; Onosato, K.; Miyao, A.; Hirochika, H. Three distinct rice cellulose synthase catalytic subunit genes required for cellulose synthesis in the secondary wall. Plant Physiol. 2003, 133, 73–83. [Google Scholar] [CrossRef] [PubMed] [Green Version]
  19. Qi, J.; Qian, Q.; Bu, Q.; Li, S.; Chen, Q.; Sun, J.; Liang, W.; Zhou, Y.; Chu, C.; Li, X. Mutation of the rice Narrow leaf1 gene, which encodes a novel protein, affects vein patterning and polar auxin transport. Plant Physiol. 2008, 147, 1947–1959. [Google Scholar] [CrossRef] [PubMed] [Green Version]
  20. Fujino, K.; Matsuda, Y.; Ozawa, K.; Nishimura, T.; Koshiba, T.; Fraaije, M.W.; Sekiguchi, H. NARROW LEAF 7 controls leaf shape mediated by auxin in rice. Mol. Genet. Genom. 2008, 279, 499–507. [Google Scholar] [CrossRef] [Green Version]
  21. Xu, Y.X.; Xiao, M.Z.; Liu, Y.; Fu, J.L.; He, Y.; Jiang, D.A. The small auxin-up RNA OsSAUR45 affects auxin synthesis and transport in rice. Plant Mol. Biol. 2017, 94, 97–107. [Google Scholar] [CrossRef]
  22. Hu, J.; Zhu, L.; Zeng, D.; Gao, Z.; Guo, L.; Fang, Y.; Zhang, G.; Dong, G.; Yan, M.; Liu, J. Identification and characterization of NARROW AND ROLLED LEAF 1, a novel gene regulating leaf morphology and plant architecture in rice. Plant Mol. Mol. Biol. 2010, 73, 283–292. [Google Scholar] [CrossRef]
  23. Wu, C.; Fu, Y.; Hu, G.; Si, H.; Cheng, S.; Liu, W. Isolation and characterization of a rice mutant with narrow and rolled leaves. Planta 2010, 232, 313–324. [Google Scholar] [CrossRef] [PubMed]
  24. Cho, S.H.; Yoo, S.C.; Zhang, H.; Pandeya, D.; Koh, H.J.; Hwang, J.Y.; Kim, G.T.; Paek, N.C. The rice narrow leaf2 and narrow leaf3 loci encode WUSCHEL-related homeobox 3 A (OsWOX3A) and function in leaf, spikelet, tiller and lateral root development. New Phytol. 2013, 198, 1071–1084. [Google Scholar] [CrossRef] [PubMed]
  25. Kang, L.; Xu, J. Genetic basis of grain yield potential in rice: A critical review on QTL studies. J. Plant Genet. Resour. 2008, 9, 545–550. [Google Scholar]
  26. Murray, M.G.; Thompson, W.F. Rapid isolation of high molecular weight plant DNA. Nucleic Acids Acids Res. 1980, 8, 4321–4325. [Google Scholar] [CrossRef] [Green Version]
  27. Li, H.; Handsaker, B.; Wysoker, A.; Fennell, T.; Ruan, J.; Homer, N.; Marth, G.; Abecasis, G.; Durbin, R.; Genome Project Data, P. The Sequence Alignment/Map format and SAMtools. Bioinformatics 2009, 25, 2078–2079. [Google Scholar] [CrossRef] [Green Version]
  28. Wang, K.; Li, M.Y.; Hakonarson, H. ANNOVAR: Functional annotation of genetic variants from high-throughput sequencing data. Nucleic Acids Res. 2010, 38, 7. [Google Scholar] [CrossRef]
  29. Yang, J.; Lee, S.H.; Goddard, M.E.; Visscher, P.M. GCTA: A tool for genome-wide complex trait analysis. Am. J. Hum. Genet. 2011, 88, 76–82. [Google Scholar] [CrossRef] [PubMed] [Green Version]
  30. Pritchard, J.K.; Stephens, M.; Rosenberg, N.A.; Donnelly, P. Association mapping in structured populations. Am. J. Hum. Genet. 2000, 67, 170–181. [Google Scholar] [CrossRef] [Green Version]
  31. Purcell, S.; Neale, B.; Todd-Brown, K.; Thomas, L.; Ferreira, M.A.R.; Bender, D.; Maller, J.; Sklar, P.; Bakker, P.I.W.D.; Daly, M.J. PLINK: A tool set for whole-genome association and population-based linkage analyses. Am. J. Hum. Genet. 2007, 81, 559–575. [Google Scholar] [CrossRef] [Green Version]
  32. Evanno, G.; Regnaut, S.; Goudet, J. Detecting the number of clusters of individuals using the software STRUCTURE: A simulation study. Mol. Ecol. 2005, 14, 2611–2620. [Google Scholar] [CrossRef] [Green Version]
  33. Earl, D.A.; Vonholdt, B.M. STRUCTURE HARVESTER: A website and program for visualizing STRUCTURE output and implementing the Evanno method. Conserv. Genet. Resour. 2012, 4, 359–361. [Google Scholar] [CrossRef]
  34. Bradbury, P.J.; Zhang, Z.; Kroon, D.E.; Casstevens, T.M.; Ramdoss, Y.; Buckler, E.S. TASSEL: Software for association mapping of complex traits in diverse samples. Bioinformatics 2007, 23, 2633–2635. [Google Scholar] [CrossRef] [PubMed]
  35. Mather, K.A.; Caicedo, A.L.; Polato, N.R.; Olsen, K.M.; McCouch, S.; Purugganan, M.D. The extent of linkage disequilibrium in rice (Oryza sativa L.). Genetics 2007, 177, 2223–2232. [Google Scholar] [CrossRef] [PubMed] [Green Version]
  36. Shin, J.H.; Blay, S.; McNeney, B.; Graham, J. LDheatmap: An R function for graphical display of pairwise linkage disequilibria between single nucleotide polymorphisms. J. Stat. Stat. Softw. 2006, 16, 1–9. [Google Scholar] [CrossRef] [Green Version]
  37. Yu, J.M.; Pressoir, G.; Briggs, W.H.; Bi, I.V.; Yamasaki, M.; Doebley, J.F.; McMullen, M.D.; Gaut, B.S.; Nielsen, D.M.; Holland, J.B.; et al. A unified mixed-model method for association mapping that accounts for multiple levels of relatedness. Nat. Genet. 2006, 38, 203–208. [Google Scholar] [CrossRef] [PubMed]
  38. Baute, J.; Polyn, S.; De Block, J.; Blomme, J.; Van Lijsebettens, M.; Inzé, D. F-box protein FBX92 affects leaf size in Arabidopsis thaliana. Plant Cell Physiol. 2017, 58, 962–975. [Google Scholar] [CrossRef] [Green Version]
  39. Bak, S.; Tax, F.E.; Feldmann, K.A.; Galbraith, D.W.; Feyereisen, R. CYP83B1, a cytochrome P450 at the metabolic branch point in auxin and indole glucosinolate biosynthesis in Arabidopsis. Plant Cell 2001, 13, 101–111. [Google Scholar] [CrossRef] [Green Version]
  40. Mitsuda, N.; Seki, M.; Shinozaki, K.; Ohme-Takagi, M. The NAC transcription factors NST1 and NST2 of Arabidopsis regulate secondary wall thickenings and are required for anther dehiscence. Plant Cell 2005, 17, 2993–3006. [Google Scholar] [CrossRef] [Green Version]
  41. Peng, W.; Sun, P.; Pan, S.; Li, W. Mapping QTLs for grain shape, flag leaf traits, and plant height in rice variety Mowanggu. Acta Agron. Sin. 2018, 44, 1673–1680. [Google Scholar] [CrossRef]
  42. Li, J.; Tian, R.; Bai, T.; Zhu, C.; Song, J.; Tian, L.; Ma, S.; Lv, J.; Hu, H.; Wang, Z. Comprehensive Evaluation and QTL Analysis for Flag Leaf Traits Using a Backcross Population in Rice. Chin. J. Rice Sci. 2021, 35, 573–585. [Google Scholar]
  43. Zhu, S.; Lv, W.; He, L.; Xing, D.; Yang, L.; Qiu, X.; Xu, J. Genetic Dissection of Flag Leaf Related Traits and Grain Yield per Plant Using Genome-wide Association Analysis. J. Plant Genet. Resour. 2020, 21, 663–673. [Google Scholar]
  44. Rohila, J.S.; Edwards, J.D.; Tran, G.D.; Jackson, A.K.; McClung, A.M. Identification of Superior Alleles for Seedling Stage Salt Tolerance in the USDA Rice Mini-Core Collection. Plants 2019, 8, 472. [Google Scholar] [CrossRef] [PubMed] [Green Version]
  45. Wu, J.; Feng, F.; Lian, X.; Teng, X.; Wei, H.; Yu, H.; Xie, W.; Yan, M.; Fan, P.; Li, Y. Genome-wide Association Study (GWAS) of mesocotyl elongation based on re-sequencing approach in rice. BMC Plant Biol. 2015, 15, 1–10. [Google Scholar] [CrossRef] [PubMed] [Green Version]
  46. Wang, H.R.; Xu, X.; Vieira, F.G.; Xiao, Y.H.; Li, Z.K.; Wang, J.; Nielsen, R.; Chu, C.C. The Power of Inbreeding: NGS-Based GWAS of Rice Reveals Convergent Evolution during Rice Domestication. Mol. Plant 2016, 9, 975–985. [Google Scholar] [CrossRef] [PubMed] [Green Version]
  47. Tamura, K.; Nei, M. Estimation of the number of nucleotide substitutions in the control region of mitochondrial DNA in humans and chimpanzees. Mol. Biol. Evol. 1993, 10, 512–526. [Google Scholar]
  48. Bruno, W.J.; Socci, N.D.; Halpern, A.L. Weighted neighbor joining: A likelihood-based approach to distance-based phylogeny reconstruction. Mol. Biol. Evol. 2000, 17, 189–197. [Google Scholar] [CrossRef] [Green Version]
  49. Sober, E. The contest between parsimony and likelihood. Syst. Biol. 2004, 53, 644–653. [Google Scholar] [CrossRef] [PubMed] [Green Version]
  50. Holder, M.; Lewis, P.O. Phylogeny estimation: Traditional and Bayesian approaches. Nat. Rev. Genet. 2003, 4, 275–284. [Google Scholar] [CrossRef]
  51. Price, A.L.; Patterson, N.J.; Plenge, R.M.; Weinblatt, M.E.; Shadick, N.A.; Reich, D. Principal components analysis corrects for stratification in genome-wide association studies. Nat. Genet. 2006, 38, 904–909. [Google Scholar] [CrossRef]
  52. Liu, X.L.; Huang, M.; Fan, B.; Buckler, E.S.; Zhang, Z.W. Iterative Usage of Fixed and Random Effect Models for Powerful and Efficient Genome-Wide Association Studies. PLoS Genet. 2016, 12, e1005767. [Google Scholar] [CrossRef]
  53. Zhao, K.Y.; Aranzana, M.J.; Kim, S.; Lister, C.; Shindo, C.; Tang, C.L.; Toomajian, C.; Zheng, H.G.; Dean, C.; Marjoram, P.; et al. An Arabidopsis example of association mapping in structured samples. PLoS Genet. 2007, 3, e4. [Google Scholar] [CrossRef] [PubMed] [Green Version]
  54. Li, N.; Zheng, H.L.; Cui, J.N.; Wang, J.G.; Liu, H.L.; Sun, J.; Liu, T.T.; Zhao, H.W.; Lai, Y.C.; Zou, D.T. Genome-wide association study and candidate gene analysis of alkalinity tolerance in japonica rice germplasm at the seedling stage. Rice 2019, 12, 24. [Google Scholar] [CrossRef] [PubMed]
  55. Huang, X.; Han, B. Natural variations and genome-wide association studies in crop plants. Annu. Rev. Plant Biol. 2014, 65, 531–551. [Google Scholar] [CrossRef] [PubMed]
  56. Lu, Y.; Meng, Y.; Zeng, J.; Luo, Y.; Feng, Z.; Bian, L.; Gao, S. Coordination between GROWTH-REGULATING FACTOR1 and GRF-INTERACTING FACTOR1 plays a key role in regulating leaf growth in rice. BMC Plant Biol. 2020, 20, 200. [Google Scholar] [CrossRef] [PubMed]
  57. Zhao, Z.; Zhang, G.; Zhou, S.; Ren, Y.; Wang, W. The improvement of salt tolerance in transgenic tobacco by overexpression of wheat F-box gene TaFBA1. Plant Sci. 2017, 259, 71–85. [Google Scholar] [CrossRef]
  58. Dreher, K.; Callis, J. Ubiquitin, hormones and biotic stress in plants. Annals of botany 2007, 99, 787–822. [Google Scholar] [CrossRef] [PubMed]
  59. Lechner, E.; Achard, P.; Vansiri, A.; Potuschak, T.; Genschik, P. F-box proteins everywhere. Curr. Opin. Plant Biol. 2006, 9, 631–638. [Google Scholar] [CrossRef]
  60. Pinot, F.; Beisson, F. Cytochrome P450 metabolizing fatty acids in plants: Characterization and physiological roles. FEBS J. 2011, 278, 195–205. [Google Scholar] [CrossRef]
  61. Paddon, C.J.; Westfall, P.J.; Pitera, D.J.; Benjamin, K.; Fisher, K.; McPhee, D.; Leavell, M.; Tai, A.; Main, A.; Eng, D. High-level semi-synthetic production of the potent antimalarial artemisinin. Nature 2013, 496, 528–532. [Google Scholar] [CrossRef] [Green Version]
  62. Höfer, R.; Boachon, B.; Renault, H.; Gavira, C.; Miesch, L.; Iglesias, J.; Ginglinger, J.-F.; Allouche, L.; Miesch, M.; Grec, S. Dual function of the cytochrome P450 CYP76 family from Arabidopsis thaliana in the metabolism of monoterpenols and phenylurea herbicides. Plant Physiol. 2014, 166, 1149–1161. [Google Scholar] [CrossRef] [Green Version]
  63. Hull, A.K.; Vij, R.; Celenza, J.L. Arabidopsis cytochrome P450s that catalyze the first step of tryptophan-dependent indole-3-acetic acid biosynthesis. Proc. Natl. Acad. Sci. USA 2000, 97, 2379–2384. [Google Scholar] [CrossRef] [PubMed] [Green Version]
  64. Peng, H.; Cheng, H.Y.; Chen, C.; Yu, X.W.; Yang, J.N.; Gao, W.R.; Shi, Q.H.; Zhang, H.; Li, J.G.; Ma, H. A NAC transcription factor gene of Chickpea (Cicer arietinum), CarNAC3, is involved in drought stress response and various developmental processes. J. Plant Physiol. 2009, 166, 1934–1945. [Google Scholar] [CrossRef] [PubMed]
  65. Souer, E.; van Houwelingen, A.; Kloos, D.; Mol, J.; Koes, R. The no apical meristem gene of Petunia is required for pattern formation in embryos and flowers and is expressed at meristem and primordia boundaries. Cell 1996, 85, 159–170. [Google Scholar] [CrossRef] [Green Version]
  66. Sablowski, R.W.; Meyerowitz, E.M. A homolog of NO APICAL MERISTEM is an immediate target of the floral homeotic genes APETALA3/PISTILLATA. Cell 1998, 92, 93–103. [Google Scholar] [CrossRef] [Green Version]
Figure 1. Phenotypes of flag leaf shapes in 10 rice accessions: (a) Flag leaf length; and (b) flag leaf width. Scale bar = 10 cm.
Agronomy 12 01814 g001
Figure 2. Histogram of the phenotypic frequency distribution of flag leaf shapes in 173 rice accessions: (a) Flag leaf length; (b) Flag leaf width; (c) Flag leaf length–width ratio; and (d) Flag leaf area.
Agronomy 12 01814 g002
Figure 3. Correlation analysis of flag leaf shape in 173 rice accessions. **, significant differences at p < 0.01.
Agronomy 12 01814 g003
Figure 4. Genetic structure analysis of natural population constructed from 173 rice accessions: (a) Change of logarithmic likelihood with subgroup number; (b) ΔK value variation with subgroup number; (c) Natural population structure (K = 2). Blue and red colors represent pop1 and pop2 in Figure 4b, respectively; (d) Neighbor-joining tree of natural rice population. Blue and red colors represent pop1 and pop2 in Figure 4b, respectively; (e) Principal component analysis of natural rice populations. Blue and red colors represent pop1 and pop2 in Figure 4b, respectively and (f) LD decay analysis of the whole genome in natural rice populations.
Agronomy 12 01814 g004
Figure 5. Manhattan plots of the genome-wide association studies for FLL, FLW, FLR, and FLA with MLM: (a) Manhattan plot for FLL in 2019; (b) Manhattan plot for FLW in 2019; (c) Manhattan plot for FLR in 2019; (d) Manhattan plot for FLA in 2019; (e) Manhattan plot for FLL in 2020; (f) Manhattan plot for FLW in 2020; (g) Manhattan plot for FLR in 2020; and (h) Manhattan plot for FLA in 2020.
Agronomy 12 01814 g005
Figure 6. Haplotype analysis of the candidate gene: (a) Local Manhattan plot (top) and linkage disequilibrium heatmap (bottom). The candidate region lies between the red solid lines; (b) Schematic representation of LOC_Os02g56760 structure and single-nucleotide polymorphisms in LOC_Os02g56760 cDNA between HapA, HapB, HapC, and HapD. Blue boxes indicate exons; (c) Box plots for FLL, FLW, FLR, and FLA in the four haplotypes of LOC_Os02g56760 in all accessions in 2019; (d) Box plots for FLL, FLW, FLR, and FLA in the four haplotypes of LOC_Os02g56760 in all accessions in 2020. The number of accessions (n) of each haplotype (Hap) in each panel is given under the x-axis. Boxes show the median and upper/lower quartiles. Whiskers extend to 1.5× the inter-quartile range, with any remaining points indicated with dots. **, p < 0.01; ***, p < 0.001 (ANOVA). Letters indicate significant differences, p < 0.05 (Duncan’s multiple comparison test).
Agronomy 12 01814 g006
Figure 7. Haplotype analysis of the candidate gene LOC_Os05g34380: (a) Manhattan plots for FLL and FLR. Dashed lines represent significance thresholds; (b) Local Manhattan plot (top) and linkage disequilibrium heatmap (bottom), candidate region lies between the red solid lines; (c) Schematic representation of LOC_Os05g34380 structure and single-nucleotide polymorphisms in LOC_Os05g34380 cDNA between HapA, HapB, HapC, and HapD. Blue boxes indicate exons; (d) Box plots for FLL, FLW, FLR, and FLA in the four haplotypes of LOC_Os05g34380 in all accessions in 2019; (e) Box plots for FLL, FLW, FLR, and FLA in the four haplotypes of LOC_Os05g34380 in all accessions in 2020. The number of accessions (n) of each haplotype (Hap) in each panel is given under the x-axis. Boxes show the median and upper/lower quartiles. Whiskers extend to 1.5× the inter-quartile range, with any remaining points indicated with dots. ***, p < 0.001 (ANOVA). Letters indicate significant differences, p < 0.05 (Duncan’s multiple comparison test).
Agronomy 12 01814 g007
Figure 8. Haplotype analysis of the candidate gene LOC_Os05g34600: (a) Schematic representation in LOC_Os05g34600 structure and single-nucleotide polymorphisms in LOC_Os05g34600 cDNA between the two alleles. Blue boxes indicate exons; (b) Box plots for FLL, FLW, FLR, and FLA in the four haplotypes of LOC_Os05g34600 in all accessions in 2019; (c) Box plots for FLL, FLW, FLR, and FLA in the four haplotypes of LOC_Os02g56760 in all accessions in 2020. The number of accessions (n) of each allele in each panel is given under the x-axis. Boxes show the median and upper/lower quartiles. Whiskers extend to 1.5× the inter-quartile range, with any remaining points indicated with dots. ***, p < 0.001; NS, not significant (Welch’s two-sample t-test).
Agronomy 12 01814 g008
Figure 9. Haplotypes of candidate genes in seven geographic groups and two subgroups. Red represents favorable haplotypes and the blue represents non-favorable haplotypes. Yellow box represents by regions and the green box represents by subgroups. SC, southern China; CC, central China; EC, eastern China; NEC, northeastern China; SWC, southwest China; JP, Japan; SEA, southeast Asia.
Agronomy 12 01814 g009
Figure 10. QTLs detected in natural populations in 2019 and 2020 with MLM. Blue and green colors represent genes and QTLs reported in previous studies, respectively.
Agronomy 12 01814 g010
Table 1. Descriptive statistics of flag leaf traits in 173 rice accessions.
PhenotypeYearMean ± SD (cm)Range (cm)CV (%)HB2 (%)
FLL201923.86 ± 5.6813.57–41.2323.8180.30
202023.38 ± 5.5612.83–43.3523.7666.15
FLW20191.69 ± 0.251.16–2.4414.7991.82
20201.62 ± 0.241.08–2.4214.7377.70
FLR201914.31 ± 3.718.84–30.6025.8981.91
202014.65 ± 3.759.03–29.0225.5869.85
FLA201930.62 ± 9.4613.66–55.9930.9084.09
202028.80 ± 8.9112.88–55.9530.9568.44
Table 2. SNP Positions for FLL, FLW, and FLR identified by GWAS, the proportion of phenotypic variance explained (PVE), and p-value in 2019 and 2020.
TraitQTLsChrSNPAllele20192020Model
p-ValueFDRPVE(%)p-ValueFDRPVE (%)
FLLqFLL5520452668G/A3.06 × 10−71.84 × 10−616.032.74 × 10−73.15 × 10−616.18MLM
520452668G/A9.05 × 10−118.71 × 10−1016.077.04 × 10−116.86 × 10−1016.63GLM
qFLL9915134940C/A6.96 × 10−68.51 × 10−614.385.22 × 10−68.58 × 10−614.76MLM
915134940C/A1.89 × 10−101.57 × 10−917.036.28 × 10−116.36 × 10−1018.20GLM
FLWqFLW2234839350G/A5.57 × 10−65.57 × 10−615.093.48 × 10−63.48 × 10−615.71MLM
234839350G/A2.93 × 10−82.93 × 10−814.491.64 × 10−84.09 × 10−815.14GLM
FLRqFLR4.1428859732C/T1.98 × 10−89.5 × 10−720.063.17 × 10−82.88 × 10−619.45MLM
428859732C/T2.72 × 10−142.69 × 10−1127.818.08 × 10−155.73 × 10−1228.89GLM
qFLR4.2429302234T/A6.53 × 10−74.03 × 10−617.929.22 × 10−79.32 × 10−617.47MLM
429302234T/A5.12 × 10−141.68 × 10−1129.197.26 × 10−151.03 × 10−1130.85GLM
qFLR4.3431016407G/T5.04 × 10−74.03 × 10−615.771.74 × 10−73.17 × 10−617.18MLM
431016407G/T2.84 × 10−84.22 × 10−815.979.15 × 10−92.07 × 10−817.07GLM
qFLR5520452668G/A6.83 × 10−81.09 × 10−618.405.61 × 10−81.7 × 10−618.68MLM
520452668G/A3.63 × 10−111.43 × 10−921.888.07 × 10−125.21 × 10−1023.25GLM
PVE, phenotypic variation explanation ratio.
Table 3. Excellent parents predicted for flag leaf shape improvement.
Best Predicted ParentsPredicted FLL Improvement (cm)Predicted FLW Improvement (cm)Total Predicted FLA Improvement (cm2)
LOC_Os05g34380LOC_Os05g34600LOC_Os02g56760
Xiangchuanwuxinbaimi (japonica)HapA (3.17)HapA (2.96)HapC (0.08)0.18
Tijin (japonica)HapA (3.17)HapA (2.96)HapD (0.09)0.21
Xiangjing 9407 (japonica)HapA (3.17)HapA (2.96)HapD (0.09)0.21
Shengtangqing (japonica)HapA (3.17)HapA (2.96)HapD (0.09)0.21
Nannongjing 1R (japonica)HapA (3.17)HapA (2.96)HapA (0.12)0.28
Yuedao 68 (indica)HapA (3.17)HapA (2.96)HapA (0.12)0.28
Yuetai B (indica)HapA (3.17)HapA (2.96)HapA (0.12)0.28
Yuedao 37 (indica)HapA (3.17)HapA (2.96)HapA (0.12)0.28
Yuedao 61 (indica)HapA (3.17)HapA (2.96)HapA (0.12)0.28
Yuedao 9 (indica)HapA (3.17)HapA (2.96)HapA (0.12)0.28
Publisher’s Note: MDPI stays neutral with regard to jurisdictional claims in published maps and institutional affiliations.

