Article

Agriculture in Marginal Areas: Reintroduction of Rye and Wheat Varieties for Breadmaking in the Antrona Valley

1
Department of Agricultural and Environmental Sciences—Production, Landscape and Agroenergy, University of Milan, Via Celoria 2, 20133 Milan, Italy
2
Department of Food, Environmental and Nutritional Sciences, University of Milan, Via Celoria 2, 20133 Milan, Italy
3
Department of Veterinary Medicine and Animal Sciences, University of Milan, Via Dell’Università 6, 26900 Lodi, Italy
4
Ente di Gestione delle Aree Protette dell’Ossola, Viale Pieri 13, 28868 Varzo, Italy
5
Department of Earth and Environmental Sciences, University of Pavia, Via S. Epifanio 14, 27100 Pavia, Italy
*
Author to whom correspondence should be addressed.
Agronomy 2022, 12(7), 1695; https://doi.org/10.3390/agronomy12071695
Submission received: 16 May 2022 / Revised: 6 July 2022 / Accepted: 13 July 2022 / Published: 18 July 2022

Abstract

:
In marginal lands, cereal landraces continue to be important in agricultural production, whereas hybrids lose their competitive advantage. In this context, selection for adaptation to each environment is particularly important in crops grown under unfavourable conditions, e.g., mountain areas. In this work, from a panel of traditional and modern varieties, mixtures and evolutionary populations, a randomised block experiment was established to select the most productive and suitable wheat and rye varieties specific for the Antrona Valley. The nutritional analysis of each flour was carried out. The results obtained in two years of varietal comparison suggested that rye is more suitable than wheat for growing in this environment: Alpina rye showed the highest yield/m2 and the highest ash content (1.87% ± 0.03%; p < 0.05) compared to other varieties, indicating it as suitable for the baking process. Among wheats, San Pastore showed the highest number of ears/m2 (411 and 350; p < 0.05) compared to others. However, in a context of climate change, the cultivation of Solibam could ensure yield stability, thanks to the high variability within the evolutionary population. Overall, our results demonstrated the possible reintroduction of the cereal supply chain in the Valley and the resumption of the historic rye bread production.

1. Introduction

The loss of biodiversity has been a crucial problem in the last century, and it was estimated that about 75% of the species of living things used for food and agriculture were lost; nowadays, three-quarters of global food produced is composed of only five animal species and twelve plant species [1,2,3,4,5]. Thus, the safeguarding and the promotion of agrobiodiversity have been central issues in recent decades [6,7,8].
A fundamental role in maintaining cereal agrobiodiversity over the centuries has been played by farmers saving seeds at harvest for the next generation and enhancing the gene flow through seed exchanges with neighbours and with the introduction of local varieties [9]. These practices underline the importance of farmer communities and traditional farming systems in the development and maintenance of landraces [10]. In this context, landraces are defined as dynamic populations of cultivated plants that are characterised by historical origin and distinct identity, and a lack of commercial crop improvement, as well as being locally adaptable, genetically diverse and associated with traditional farming [11]. A comprehensive knowledge of landrace diversity is fundamental to define the best sampling strategies; therefore, the GeneBank core collections are used to ensure precise documentation [12,13].
Landraces played a key role in the history of crops worldwide. Farmers cultivated these traditional varieties until the Second World War, when more productive hybrids were introduced and led to the gradual disappearance of landraces [14]. The introduction of modern cultivars, combined with the mass exodus of the young workforce from rural areas, led to the consequent abandonment of traditional agricultural practices [15].
However, cereal landraces are still considered important in agricultural production, particularly in marginal lands and mountain areas where hybrids lose their competitive advantage [16,17,18]. In fact, the adaptability of landraces to unfavourable conditions contributes to yield stability [19] and to abiotic and biotic stress tolerance [20,21]. In this context, the selection for specific adaptation to each target environment is particularly important in crops that are grown in unfavourable conditions, e.g., mountain areas, because unfavourable environments can be very different from each other, whereas favourable environments tend to be similar [22]. Conventional plant breeding has been successful in favourable environments, or in those that can be made favourable by using chemical inputs; it has been much less successful in marginal areas. Even in areas where conventional crop breeding has given the advantage, there are different environmental and biodiversity concerns, such as the heavy use of chemical inputs required by modern varieties and the narrowing of the genetic basis of crops. Conversely, by selecting for specific adaptations, cultivars which are suitable to marginal areas can be obtained. This approach is more sustainable than others which rely on altering the environment to fit new cultivars used for plain agriculture [22].
Rye bread is a type of bread made with different proportions of rye/wheat flour and it was considered a staple food until the beginning of the second half of the last century, when it was abandoned following the depopulation of the mountain areas. In recent years, a renewed interest in this product has been growing due to the nutritional properties of rye flour.
Cereals are a major source of mycotoxin ingestion in the human diet. Rye in particular may be highly infested with Claviceps spp. sclerotia, which often lead to the accumulation of ergot alkaloids in the flour. These compounds have significant effects on human and animal health as they exert both cytotoxin and neurological noxious activity [23]. Starting from January 2022, EU limits for ergot alkaloids in rye were introduced, set at 500 µg/kg, which will be further reduced to 250 µg/kg in July 2024 as the maximum amount of ergotamine and related ergot compounds to protect consumer safety. For this reason, assessing the toxicological risk posed by rye flour produced in marginal areas is deemed fundamental.
In the frame of the SOCIAAALP (reti SOCIALi per Agro Ambienti ALPini) project, the aim of the present work was to encourage the reintroduction of traditional cereals in the Antrona Valley (Piedmont) in order to revive the historic rye bread production chain which was abandoned several years ago. The goal was to identify crop varieties suitable to the physical and the socio-economic environment of the Antrona Valley. In this project, we evaluated in randomised block designs the best rye and wheat varieties for the Antrona Valley terraced environment. The comparisons were carried out on different varieties and evolutionary populations of rye and wheat in order to evaluate the most suitable varieties for agronomic performance in the environmental context of the Antrona Valley. Nutritional analysis of each flour was also carried out.

2. Materials and Methods

2.1. Plant Material

The variety comparison was made taking into consideration different types of rye and wheat: traditional and modern varieties, mixtures and evolutionary populations were compared. The complete list is shown in Table 1. For wheat, the following varieties were assessed: (i) 7 Grani, a mixture of seven different traditional varieties: Gentilrosso, Andriolo, Verna, Sieve, Inallettabile, Frassineto; (ii) Giorgione, a traditional variety characterised by excellent tillering capacity and excellent milling quality flour; (iii) Mentana, a traditional variety obtained from Nazareno Strampelli in 1918; (iv) Solibam, an evolutionary population established in 2009 by the ICARDA (International Center for Agricultural Research in the Dry Areas), starting from 2000 crosses of common wheat; (v) Tengri, a newly synthesised variety obtained by the Swiss geneticist Peter Kunz, specific for organic farming and characterised by good resistance to rust; (vi) San Pastore, a traditional variety characterised by good resistance to lodging, selected in the early 1900s by the geneticist Nazareno Strampelli. The seeds were provided by Andrea Messa from the “Grani dell’Asta del Serio” association.
For rye, the following varieties were evaluated: (i) SKTP50, a blend of Stanko rye (50%) and Tradizionale Piemonte (50%),which will become, starting from the second year, an evolutionary population since rye is an allogamous species; (ii) Stanko, a variety of neo-synthesis; (iii) Tradizionale Piemonte, a traditional variety of Piedmont; (iv) Alpina rye, a traditional variety coming from the Italian valleys of the Cuneo area, more precisely from Coumboscuro (Valle Grana). It was provided by Andrea Messa from the “Grani dell’Ativesta del Serio” association.
In the second year, the experimentation was carried out by sowing the same starting materials as in the first year, since rye is an allogamous species and it is necessary to avoid the effects of hybridisations. However, for the SKTP50 mixture, the seed collected in the first year was sown in the second, in order to allow its evolution at the local level.

2.2. Experimental Design

Experiments were carried out during two growing seasons (2019/2020 and 2020/2021) in two locations in the Antrona Valley (VB): Varchignoli (584 a.s.l, 46°4′ N; 8°14′ E) and Valleggia (750 a.s.l, 46°3′ N; 8°12′ E). The experiments were laid out in randomised blocks and each variety was cultivated in three plots, the size of which was 4 m2 (4 m × 1 m) each. The sowing soil was prepared by rotovation using a motor hoe. The sowing was carried out in rows, using a manual seeder, at a density of 200 kg/ha. The seeds of each variety were sown at the end of October in both years. Both the experimental fields were on marginal land, and the Valleggia site was previously used as a vegetable garden. Periodic monitoring was conducted during the crop cycle, but no further agronomic interventions were carried out. The harvest was performed manually at the end of July for each year. The characteristics of the soils are reported in Table S1.

2.3. Agronomic Parameters

At maturity, the following agronomic parameters were measured: yield, number of ears per m2, single-seed weight and plant height. The yield was estimated by threshing the harvested ears (with a mechanical thresher) and weighing the seeds obtained. Subsequently, the potential yield was reported in t/ha. The number of ears per m2 was obtained by counting the number of ears collected for each plot and dividing it by the area of the single parcel. The single-seed weight was determined by weighing 100 seeds and dividing this value by 100. The plant height of ten representative plants for each plot was measured using a measuring rod before the harvest.

2.4. Compositional Analysis

Wheat and rye samples were ground, passed through a 1 mm screen grid and analysed for the bromatological composition following the official methods of the Association of Official Analytical Chemists [24]. In particular, the dry matter (DM) was obtained by drying samples in a forced air oven at 65 °C for 24 h (AOAC method 930.15). Crude protein was determined by the Kjeldahl method (AOAC method 2001.11). Crude fat was obtained through ether extraction using the Soxtec system (AOAC method 2003.05). Crude fibre was evaluated using the filter bag technique [25]. Ash content was measured after incinerating samples in a muffle furnace at 550 °C for 3 h (AOAC method 942.05). Starch content was assessed after passing ground samples through a 0.5 mm screen by using a colorimetric kit following the manufacturers’ instructions (Total Starch Assay Kit AA/AMG, Megazyme Ltd., Bray, Ireland). Absorbances were measured with a spectrophotometer at 510 nm (V630 UV-Vis, Jasco GmBH, Pfungstadt, Germany). All samples were analysed in triplicate and the results are presented as the percentage of dry matter (DM%).

2.5. Mixing and Leavening Properties

In the following mixing and leavening tests, as well as for bread production (Section 2.6), the rye produced in Cheggio was used. Cheggio is a village in the Antrona Valley, where the evolutionary population (composed by Stanko, Tradizionale Piemonte and Alpina rye) was expanded for the production of flour and the consequent bread production. Regarding wheat, the one from Val Vigezzo (Piedmont) was chosen for dough characterisation and bread production. The grinding of kernels was carried out using a stone mill. Wheat was used alone, whereas rye was mixed with wheat in the proportion of 30:70.
Mixing properties were assessed by means of the Farinograph-E (Brabender GmbH & Co. KG, Duisburg, Germany) with a 50 g kneading bowl, following the ICC 115/1 approved method [26].
Dough leavening properties were investigated using a rheofermentometer (Chopin Technologies, Villeneuve-la-Garenne, France). Dough was prepared by mixing for 8 min in the alveograph (Chopin Technologies, Villeneuve-la-Garenne, France) 250 g of flour, 3.5 g of dried yeast, 1.2% of NaCl and 2.85 g of sugar. The hydration level was selected according to the farinographic analysis. Then, 315 g of dough was transferred into the rheofermentometer chamber for leavening (3 h at 30 °C).

2.6. Breadmaking and Characterisation

The bread was prepared in a breadmaking machine (Imetec Zero-glu PRO, Tenacta Group SpA, Azzano San Paolo, Italy) from both wheat flour and the rye-wheat blend (30:70). Flour (350 g) was added to water (in the amount suggested by the farinographic analysis), as was 3.5 g of powder yeast (Cameo S.p.A., Desenzano del Garda, Italy), 10 g of virgin olive oil (Oleificio Zucchi S.p.A., Cremona, Italy), 7 g of sugar (Eridania S.p.A., Russi, Italy) and 7 g of NaCl (VWR Chemicals, LLC, Solon, OH, USA). After 25 min of kneading and 1 h of leavening, the dough was manually divided into 6 loaves of 95 g each. The loaves were then baked for 70 min at 150 °C in the breadmaking machine. For each loaf of bread, the specific volume, colour, texture, moisture content and water activity were determined. Specific volume was calculated as the ratio between the apparent volume, assayed by the seed replacement method (AACC 10–05.01) [27], and bread weight. The colour of the crust and crumb were determined with a colourimeter, the CR 300 (Minolta Co., Osaka, Japan), and the results were expressed in the CIE L*a*b* colour space. The texture was measured with a texture analyser (TA.XTplus, Stable Micro System, Surrey, UK). A slice of 2.5 cm was cut from each loaf and the firmness was determined according to the AACC 74.09 method. Water activity was determined with a water activity measurement device (Novasina Lab Master-aw) and moisture content with a thermobalance (Radwag Wagi Elektroniczne, Chorzow, Poland).

2.7. Mycotoxin Analysis

Mycotoxin analysis was carried out by Romer Labs (AUT) on three biological replicates of a representative sample of rye flour obtained from the bulk (Stanko, Tradizionale Piemonte and Alpina rye) cultivated in Cheggio. The extraction and analytical method was carried out according to the EN 17,280 method [28] on 100 g of rye flour monitoring the following mycotoxins: 15-acetoxyscirpenol, 15-acetyl-deoxynivalenol, 3-acetyl-deoxynivalenol, aflatoxin B1, aflatoxin B2, aflatoxin G1, aflatoxin G2, agroclavin, alpha-ergocryptine, alpha-ergocryptinine, alpha-zearalenol, alternariol, beauvericin, beta-zearalenol, deoxynivalenol, deoxynivalenol-3-glucoside, diacetoxyscirpenol, dihydrolysergol, elymoclavin, enniatin A, enniatin A1, enniatin B, enniatin B1, ergine, ergocornine, ergocorninine, ergocristine, ergocristinine, ergometrine, ergometrinine, ergosine, ergotamine, fumonisin B1, fumonisin B2, fumonisin B3, fusarenon X, gliotoxin, HT-2 toxin, moniliformin, mycophenolic acid, neosolaniol, nivalenol, ochratoxin A, ochratoxin B, patulin, penicillanic acid, roquefortine C, sterigmatocystin, T-2 toxin, T-2 triol, T-2 tetraol, zearalanone, zearalenone. The LOQ (limit of quantification) and LOD (limit of detection) for the method are reported in the results table.

2.8. Statistical Analysis

Microsoft Excel® was used to collect data. SPSS® was used to perform a t-test or one-way ANOVA on sampled data. For evaluating post hoc pairwise comparisons, Tukey’s test was used. Results are presented as least square means ± standard deviation. Statistically significant differences are considered for p ≤ 0.05.

3. Results

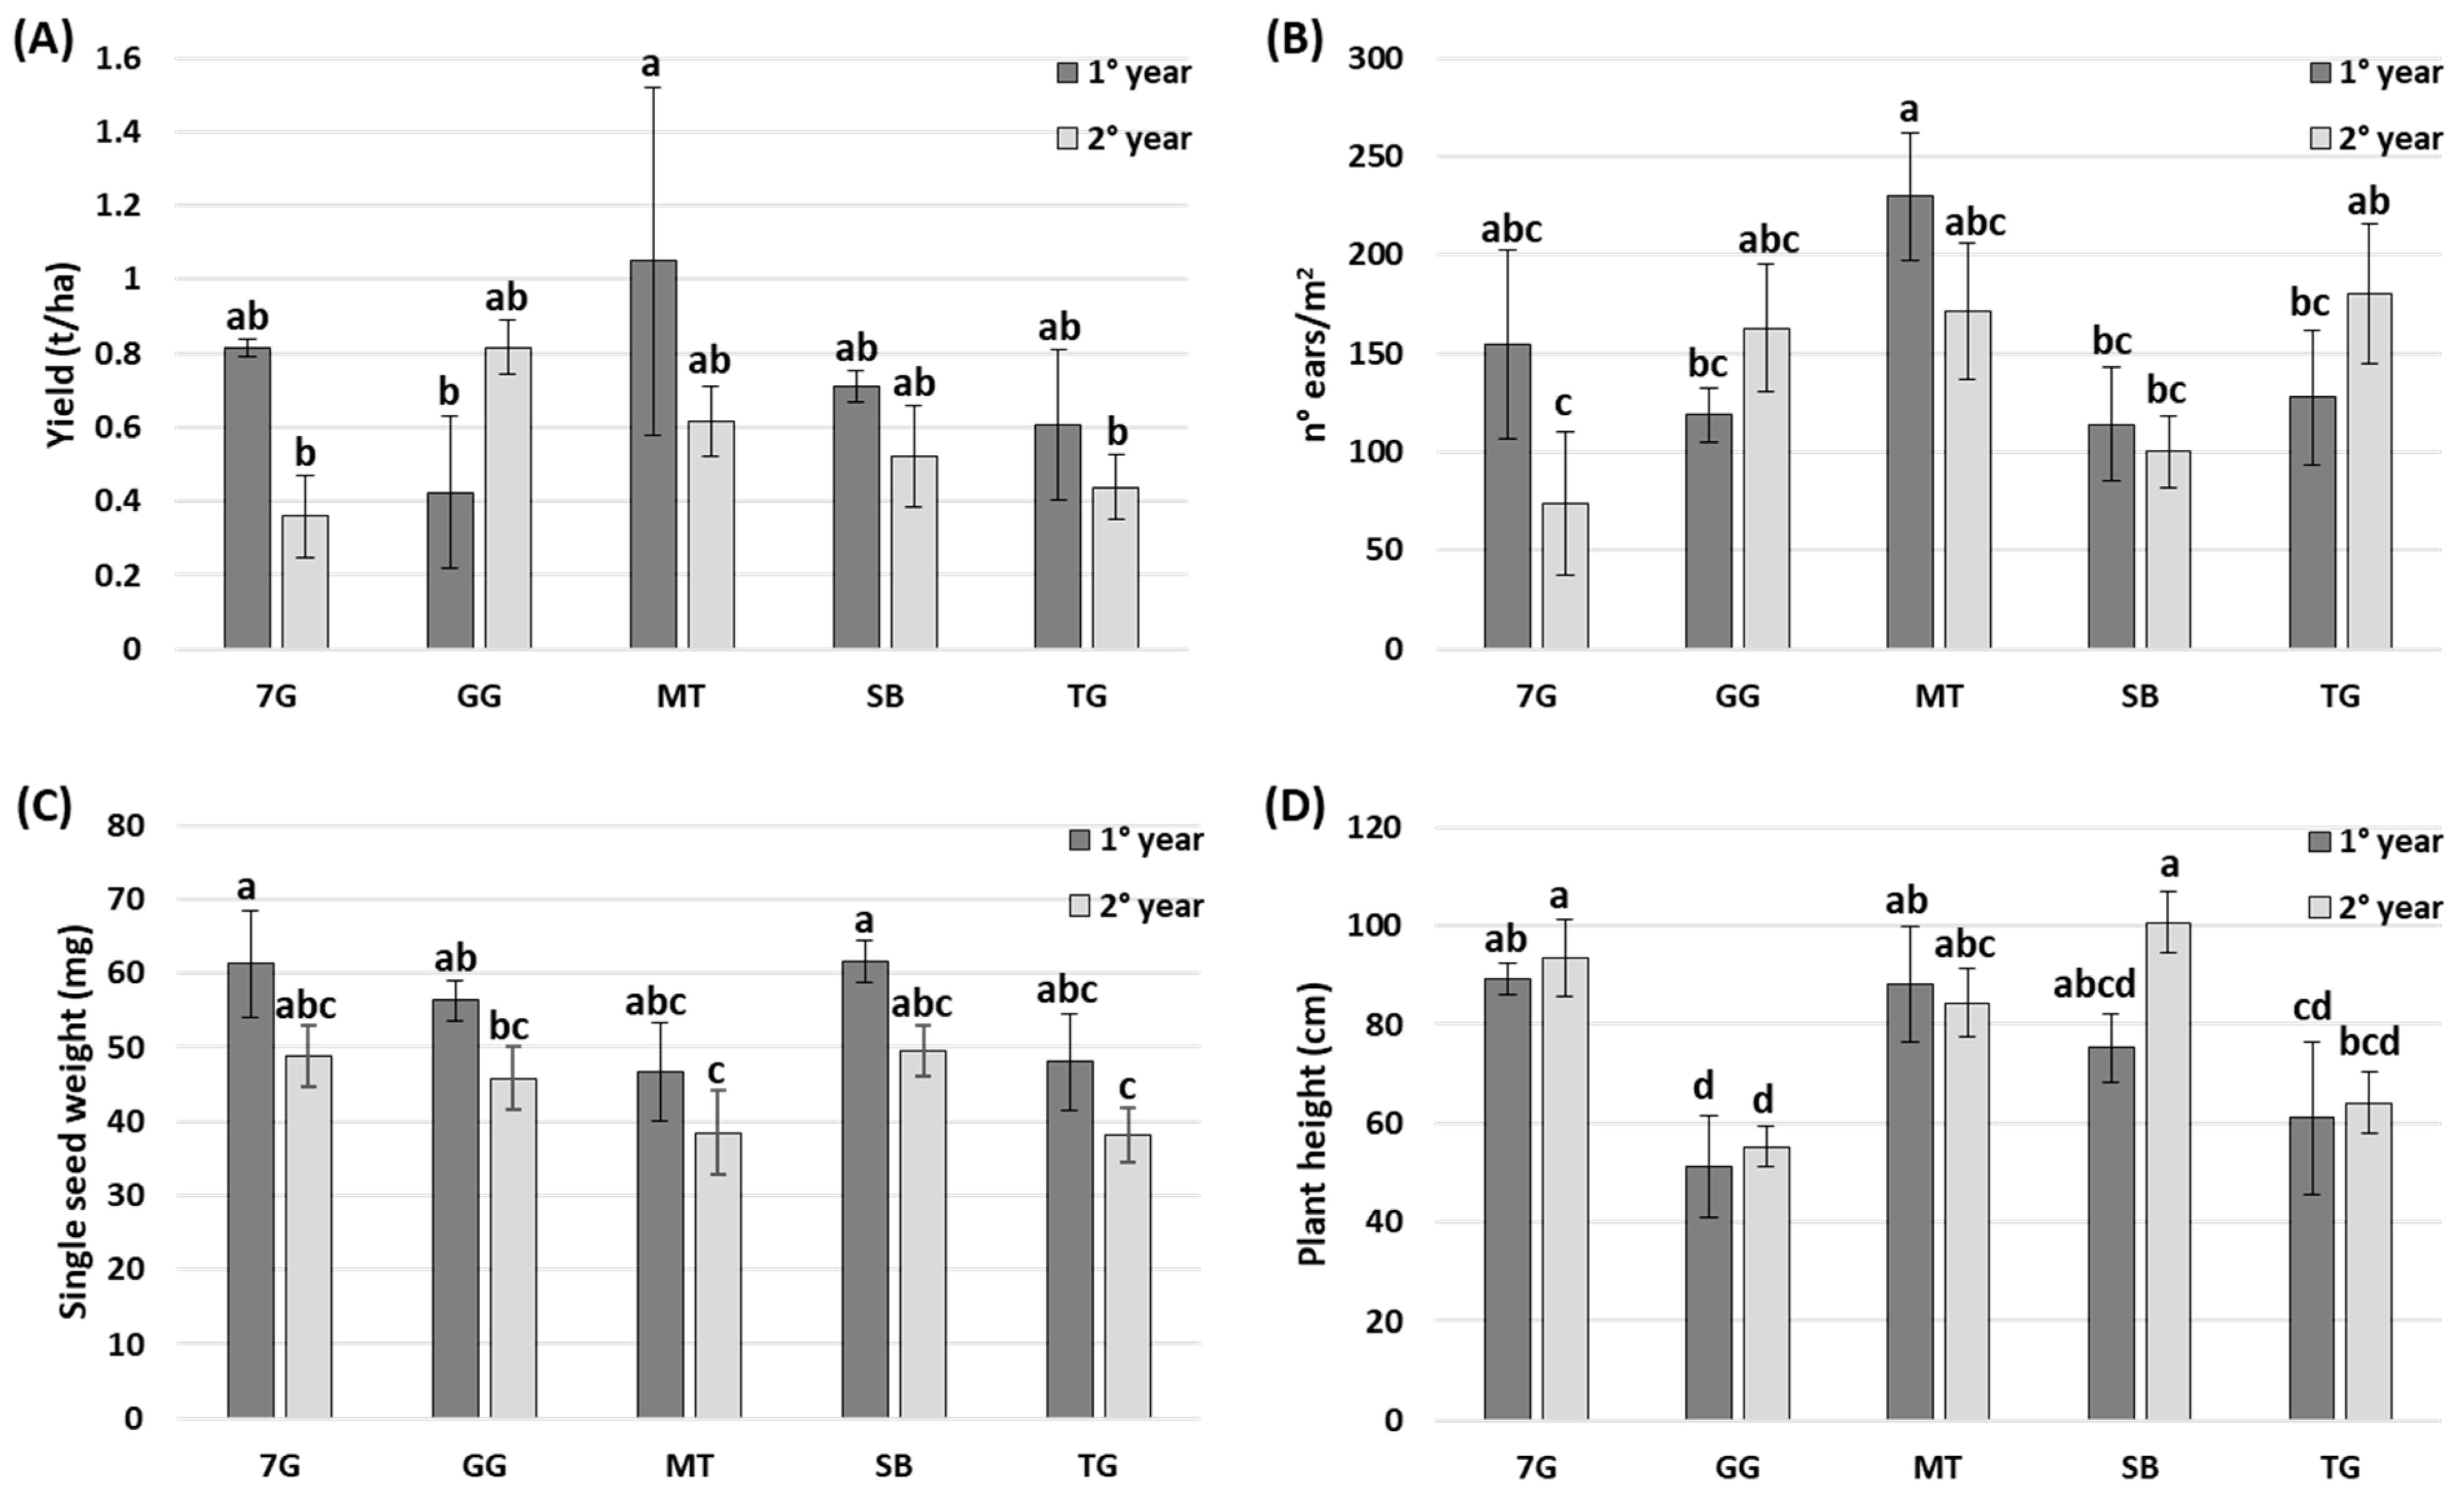
3.1. Comparison of Wheat Varieties over Two Years: Agronomic Aspects

Experiments were carried out during two growing seasons (2019/2020 and 2020/2021) in two locations in the Antrona Valley (VB): Varchignoli (584 a.s.l) and Valleggia (750 a.s.l). The varietal comparison was made taking into consideration different types of rye and wheat and the complete list is shown in Table 1. The experiment was organised in randomised blocks and different parameters were collected to select the best varieties for each environment. In the first location, Varchignoli, five different varieties of wheat were grown under the same conditions and the results obtained after two years of comparison are reported in Figure 1. The following agronomic parameters were measured for each variety: yield, number of ears per m2, single-seed weight and plant height. Starting from the estimated yield, this value was almost always below 1 t/ha and, except for the Giorgione variety, it was lower in the second year compared to the first (p < 0.05; Figure 1A). These yields were significantly lower than those recorded in the other location, Valleggia (Figure 2A). In this context, it is important to remember that the site of Valleggia was previously used as a vegetable garden. The only wheat variety grown here, San Pastore, showed a constant yield of more than 4 t/ha for both years (Figure 2A). In line with the yield, a high number of ears per m2 was recorded for San Pastore: on average, there were 411 in the first year and 350 in the second (p < 0.05; Figure 2B). The number of ears per m2 was lower in the varieties grown in Varchignoli: in Mentana, 229 ears were counted in the first year and 171 in the second year. The other varieties grown here showed fewer ears than Mentana (p < 0.05; Figure 1B). Another parameter measured for all the accessions in the two locations was the single-seed weight: in Varchignoli, in the 7 Grani mix and in the evolutionary population of Solibam the values reached 61 mg in the first year, whereas in the same year they were statistically lower in Mentana and Tengri (46.6 ± 6.65 and 47.9 ± 6.51 mg, respectively; p < 0.05) (Figure 1C). In the second year of measurements, the single-seed weight was statistically lower in all the accessions compared to the first year, with the lowest values recorded once again in Mentana and Tengri (38.4 ± 5.68 and 38.1 ± 3.61 mg, respectively) (p < 0.05; Figure 1C). In the second location, Valleggia, the San Pastore seed weight was statistically higher in the first year than in the second (45.5 ± 2.97 vs. 37.7 ± 2.67 mg) (p < 0.05; Figure 2C). Before harvesting, the heights of ten representative plants were measured for each plot in both locations: in Varchignoli the tallest accessions were 7 Grani, Solibam and Mentana, whereas the lowest values were recorded with the traditional Giorgione variety (p < 0.05; Figure 1D); in Valleggia, the height of the San Pastore wheat was statistically the same in 2020 and 2021: 87.6 ± 4.60 vs. 93.3 ± 4.36 cm, respectively (Figure 2D).

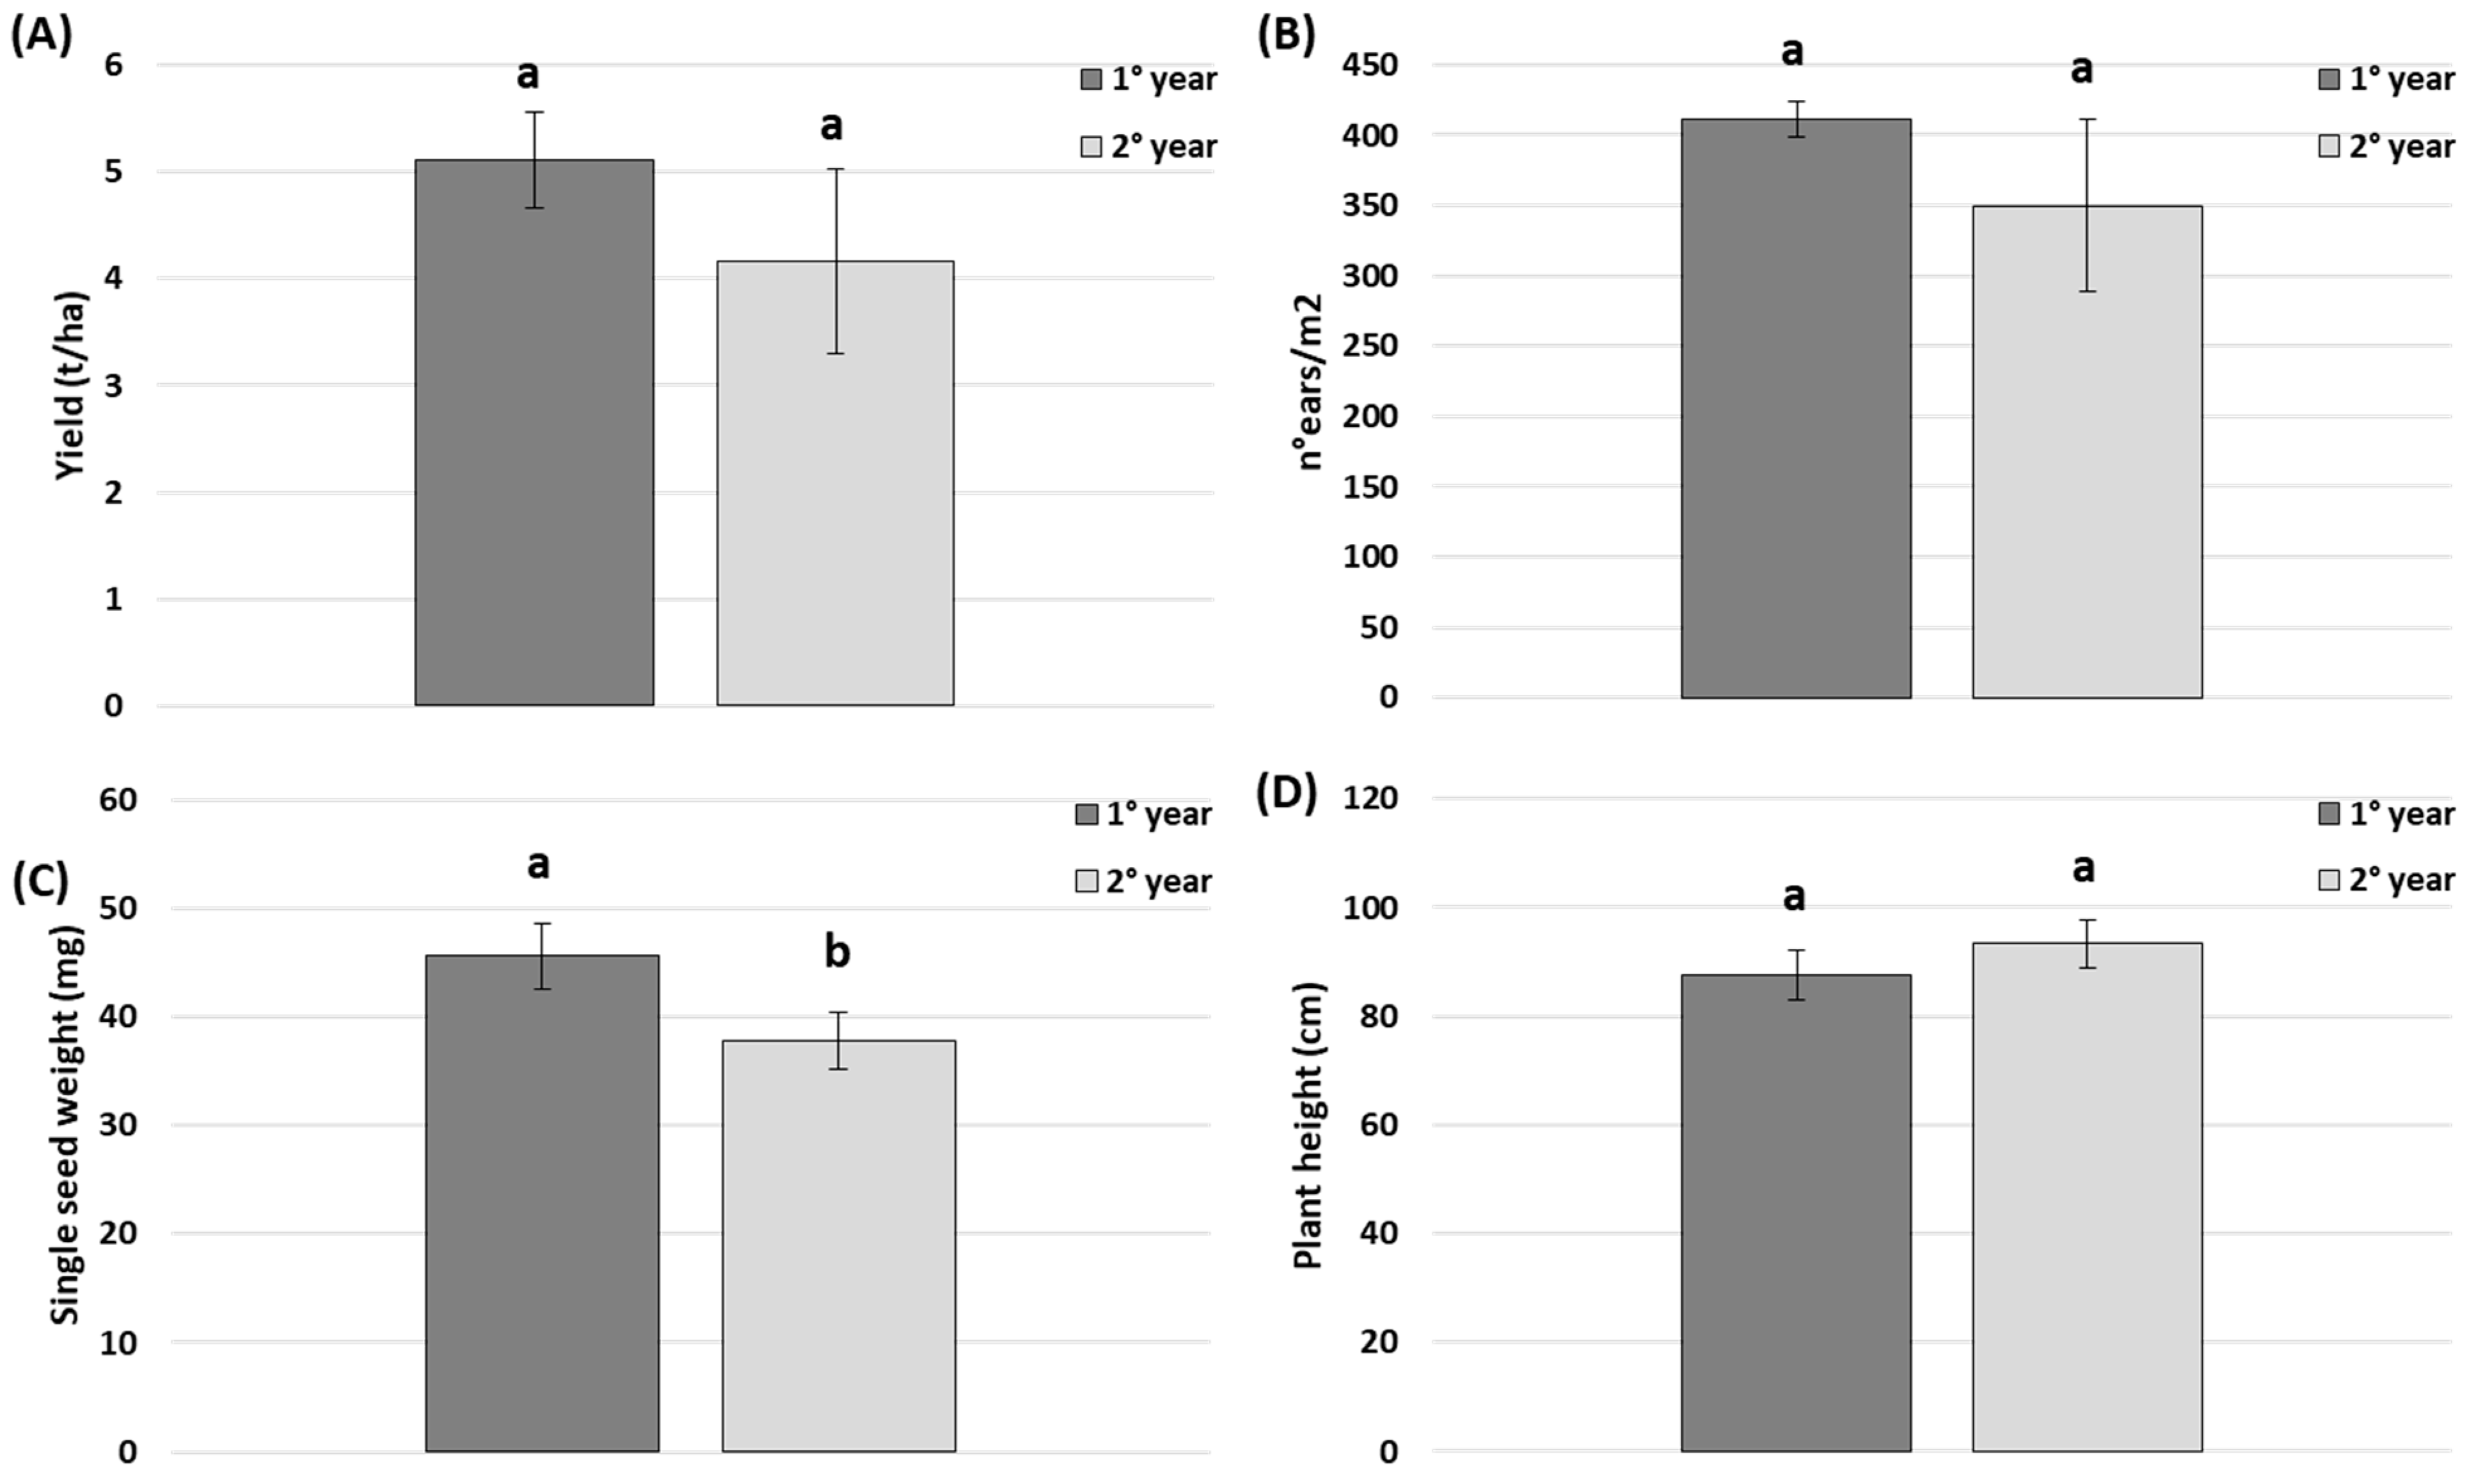
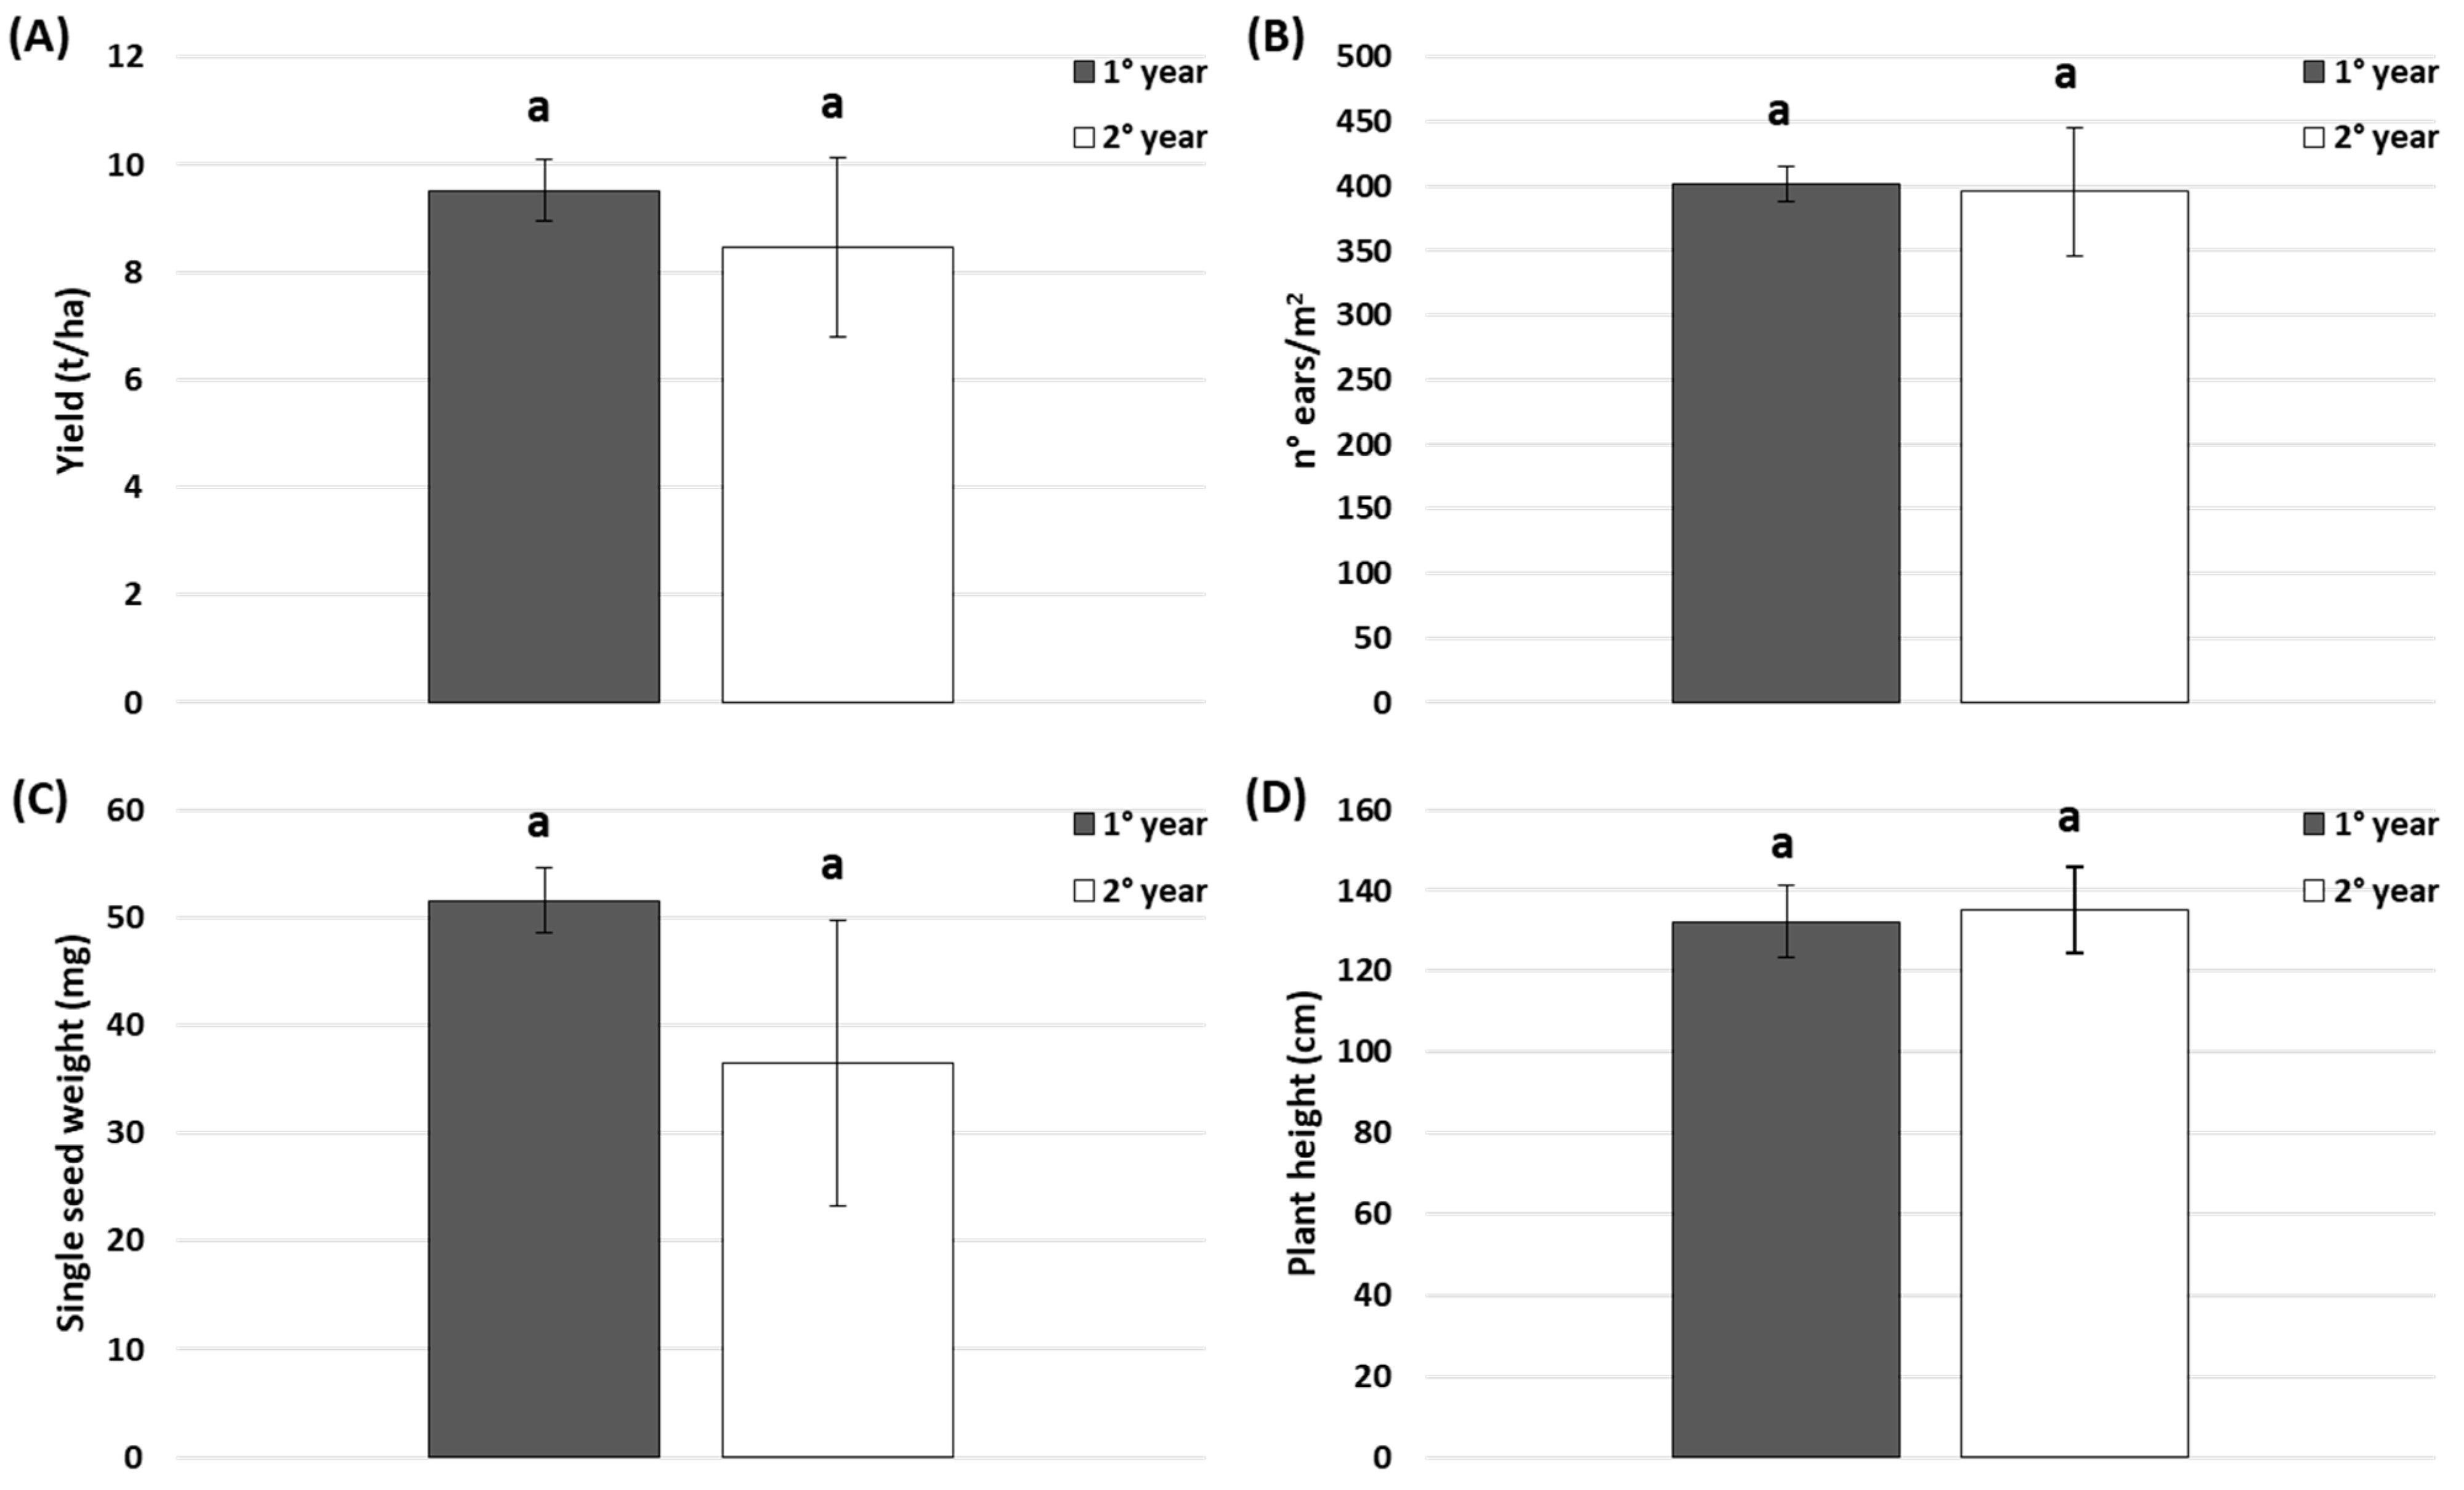
3.2. Comparison of Rye Varieties over Two Years: Agronomic Aspects

In wheat and also in rye, the experimentation was organised in randomised blocks. Three accessions of rye were grown in Varchignoli, and only Alpina rye was grown in Valleggia. This species seemed to perform well in marginal areas and unfavourable climates and did not require operations during the growing season. The agronomic parameters measured were the same as those previously described; regarding the estimated yield, no significant differences were observed in Varchignoli among the three accessions analysed, where the highest values were recorded in Tradizionale Piemonte (3.14 ± 0.89 t/ha in 2020 and 3.39 ± 0.73 t/ha in 2021) (p < 0.05; Figure 3A). Despite this, these values were very low when compared with the Alpina rye grown in the second location, Valleggia: the yield recorded here was higher than 8 t/ha in both years (p < 0.05; Figure 4A). In line with the yield, a higher number of ears per m2 was recorded in the experimental field of Valleggia compared to Varchignoli: Alpina rye had on average 401 ears in the first year and 395 in the second (p < 0.05; Figure 4B), whereas in Varchignoli there were about 200 ears/m2 for SKTP50 and Stanko, and about 300 for Tradizionale Piemonte (p < 0.05; Figure 3B). Furthermore, in Varchignoli, the single-seed weight in the three accessions analysed was significantly higher in 2020 compared to 2021 (on average 57 mg vs. 40 mg, respectively) (p < 0.05; Figure 3C). The same trend was recorded in Valleggia: there was a higher average weight of 51 mg during the first year and 36 mg in the second (p < 0.05; Figure 4C). Finally, the rye height was measured before harvesting: In Varchignoli, no significant differences were found between varieties in the two years of study and the plant height was always above 100 cm (Figure 3D). In Valleggia, the average height of Alpina rye was over 130 cm in both years (Figure 4D).

3.3. Compositional Analyses of Flours

Compositional analyses were carried out to determine the qualitative characteristics of the different varieties of wheat and rye. In particular, we detected the content of ash, crude fibre, crude fat, crude protein and starch content (Table 2 and Table 3). These characteristics are necessary for the evaluation of the suitability of varieties for the bread-baking process. As reported in Table 2, the highest values of ash were measured in 7 Grani (2.07 ± 0.05%) and the lowest in Giorgione and Tengri (1.58 ± 0.06 and 1.53 ± 0.07%, respectively; p < 0.05). The content of crude fibre was significantly higher in Giorgione and San Pastore compared to the other varieties (p < 0.05), whereas the crude fat reached its maximum value in the traditional variety Mentana compared to other cultivars (1.70 ± 0.03%; p < 0.05). However, Mentana registered the minimum value of crude protein among the accessions under evaluation (10.93 ± 0.29%; p < 0.05); this parameter was statistically higher in Solibam and San Pastore compared to other varieties (14.69 ± 0.12 and 14.14 ± 0.50%, respectively; p < 0.05). Finally, there were no significant differences in the starch content between the different varieties. The highest values of ash and crude protein were recorded in Alpina rye, whereas the crude fat was significantly higher in the SKTP50 mixture. No significant differences among varieties were found for the crude fibre and starch content.

3.4. Dough and Bread Characteristics

The farinograph test provides information on flour behaviour during mixing, i.e., the first step of the bread-making process. Results are reported in Table 4. Firstly, the water absorption—which is the amount of water added to the flour to make dough with optimal consistency (i.e., 500 Farinograph Units)—was calculated. Adding rye to wheat led to a decrease in this index, likely due to the effect of gluten dilution. In addition to water absorption, this test measures the consistency of the dough during mixing. From the charts (data not shown), the dough development time (which is the time required to reach the maximum consistency) and the stability time (which is the time by which the dough keeps its consistency) were calculated. Upon the addition of rye, the dough development time significantly decreased (p < 0.05). This was, again, probably due to wheat gluten dilution, although the rye did not negatively affect the dough stability, indicating a similar dough resistance to mechanical stress as in wheat dough.
Figure 5 reports dough behaviour during leavening. In particular, Figure 5A reports dough development during 3 h of leavening. Rye positively affected dough development: the dough rose faster and higher when rye was added to wheat. Rye-enriched dough maintained the maximum height till the end of the test, whereas a slight drop (by 17%) of height occurred in wheat dough. Figure 5B showed CO2 production: during leavening, the yeast produces gas which is kept—until a time known as “porosity time”—inside the gluten matrix. The release of gas outside the matrix is responsible for the porous structure of the bread crumb; however, an excessive release of gas might cause dough collapse. Rye-enriched dough produced a higher amount of total gas (1252 vs. 1086 mL), whereas gas release occurred 30 min earlier in this sample compared to wheat dough. Moreover, rye-enriched dough was able to retain less gas until the end of the test: indeed, the retention coefficient was 91.8% and 94.4% for rye-based and wheat doughs, respectively. Wheat substitution with rye at a 30% level did not significantly affect bread features: volume and crumb firmness were similar, as well as crumb moisture. However, rye affected the colour of the crumb, which appeared less yellow and less red than wheat bread (Table 4 and Figure 6).

3.5. Mycotoxin Analysis

Among the EU-regulated mycotoxins, only ergotoxins were measurable in the rye samples (124 µg/kg). All other EU-regulated toxin classes were below the LOD of the method (see Table 5 for the LOD values for each compound). The ergotoxin contamination was below the EU threshold for rye flour. Even the more restrictive application of the novel EU regulation on ergotoxin contamination, which foresees a further decrease of the limit from 500 to 250 µg/kg, confirms the safety of the produced flour. Other detected mycotoxins included alternariol with an average contamination of 191 µg/kg and compounds of the enniatin class, whose major component detected was enniatin B with and average content of 782 µg/kg. Other Fusarium toxins were not detected. Contamination levels found in the flour are in agreement with the values found in Italy on rye for ergotoxins [29], as well as for enniatins in Danish rye [30] and Alternaria toxins in Slovenian rye [31]. Overall, the contamination of the rye flour from mycotoxins (Table 5) was limited and below the safety threshold. This result suggests that the flour is adequate for human consumption.

4. Discussion

After the Second World War, the advent of mechanised agricultural practices and the use of more productive hybrids led to a gradual disappearance of local varieties. Landraces are one of the most threatened components of agrobiodiversity worldwide, facing the risk of genetic erosion [15]. Despite their progressive abandonment, cereal landraces still continue to be important in agricultural production, mainly in marginal lands and mountain areas where modern hybrids lose their competitive advantage [18]: their adaptability to unfavourable conditions contributes to yield stability [19] and to abiotic and biotic stress tolerance [20,21,32].
The aim of the present work was to provide data to support the reintroduction of the cultivation of rye and wheat in the Antrona Valley (Piedmont) and to resume the historic rye bread production chain that was abandoned several years ago. In this context, we set up a two-year randomised block experiment in two different locations, Varchignoli (584 a.s.l) and Valleggia (750 a.s.l). Different traditional and modern varieties of wheat and rye, mixtures and evolutionary populations were compared, and the most suitable for the cultivation in the terraced environment of the Antrona Valley were selected.
Generally, in a breeding program, the comparison between different accessions is carried out in experimental fields under controlled and standard conditions. The advantage of this experimentation is given by the fact that the varieties were compared in the environment in which their future cultivation will take place. This allowed us to evaluate the most suitable phenotypes for the environment of interest and the cultivation techniques that will be used.
Regarding wheat, five accessions were compared in Varchignoli and the traditional variety Mentana was found to be the most productive in the first year of experimentation (Figure 1A). Interestingly, the evolutionary population of Solibam exhibited intermediate but stable yields in the two years: this stability could be due to the high genetic variability present within the population, which made it more adaptable to environmental changes. Research on evolutionary populations (and also mixtures) has spanned several decades, from the first paper by Harlan and Martini (1929) to recent years [33,34,35]. Several works have demonstrated that natural selection in evolutionary populations and mixtures is effective in improving yield [35,36,37], yield stability [38,39,40] and host plant resistance to pathogens [41,42,43]. It was also reported that the potential of evolutionary populations is higher than that of mixtures [44].
Comparing the yields recorded in Varchignoli with the national average wheat yield of 2021 (5.37 t/ha), all the varieties analysed in this study had lower yields. In fact, the estimated yields were lower than 1 t/ha. The factor that seemed to have the greatest influence on the low yield was the low number of ears/m2 (Figure 1B). These results highlighted that the environment of the Antrona Valley would not seem particularly suitable for the cultivation of wheat, which is why historically it had never been cultivated in this area. A different situation occurred in Valleggia, where the yield of San Pastore wheat was around 4–5 t/ha in both years (Figure 2A) thanks to a greater number of ears/m2 (Figure 2B). The higher yield recorded in Valleggia was probably due to the excellent soil and exposure conditions. This soil was previously treated as a vegetable garden and, therefore, it had a low amount of skeletons and weeds, as well as good fertility.
Unlike wheat, rye proved to be a very suitable crop for cultivation in the marginal environments of the Valley thanks to its hardiness and plasticity. The varieties compared in Valleggia were Stanko, Tradizionale Piemonte and the SKTP50 mix. Observing the estimated yield values, it seemed that Tradizionale Piemonte rye had a higher yield than SK and SKTP50 (Figure 3A). This result was supported by the number of ears per m2, which was significantly higher for TP compared to the others (Figure 3B). However, the three varieties had good yields when compared to the national average yield of rye in 2021, 3.28 t/ha. The yields estimated in our experimentation were slightly lower than this value, except for Tradizionale Piemonte, but were considered good as they were obtained with a low-input cultivation system in a marginal environment. Moreover, the statistical analysis showed that the average seed weight of rye was significantly higher in the first year than in the second (Figure 3C), but no significant differences in plant height were found between the different varieties (Figure 3D). In Valleggia, the estimated yield did not show significant differences between the first and second year (Figure 4A); however, these values were considered very high and were close to the production potential of this crop. Production potential means the maximum production level that the crop can reach in the absence of stress, both biotic and abiotic [45]. Additionally, the other agronomic parameters measured did not show significant differences in the two years of experimentation (Figure 4B–D).
We also carried out qualitative and nutritional analysis on the flour collected for each variety or population. The results obtained from the compositional analyses showed that the kernels of 7 Grains and Solibam had a significantly higher ash content than the other wheat varieties (Table 2). This parameter is an important indicator of the content of mineral salts, essential for yeast nutrition. In fact, a higher ash content favours leavening. Additionally, the crude protein content is considered a key parameter for evaluating the characteristics useful in breadmaking. Among the different varieties, San Pastore and Solibam were those with the greatest bread-making aptitude. The same compositional analyses conducted on rye revealed the superiority of Alpina rye for breadmaking, in particular for the higher content of crude protein (Table 3).
Furthermore, we evaluated the dough development during 3 h of leavening, as reported in Figure 5A: rye positively affected dough development and the dough rose faster and higher when rye was added to wheat. The result might be due to the higher amylase activity found in rye [46]: sugars derived from the starch hydrolysis operated by alpha-amylase are a substrate for yeast growth, and thus, gas production and dough leavening. Finally, the contamination of rye flour by mycotoxins was measured: the contamination was limited and below the safety threshold (Table 5). This result suggests that the flour is suitable for human consumption.
In conclusion, the positive results achieved in this project suggest that the reintroduction of rye and wheat in the Antrona Valley is possible and will allow the relaunch of small food chains in this marginal environment, as well as in other mountain areas.

Supplementary Materials

The following supporting information can be downloaded at: https://www.mdpi.com/article/10.3390/agronomy12071695/s1, Table S1: soil analysis of the experimental fields in Varchignoli and Valleggia.

Author Contributions

Conceptualisation, R.P. and I.D.N.; methodology, G.L.; software, M.P.; validation, F.C., E.C. and N.F.; formal analysis, A.B., M.D., L.R. and M.P.; investigation, F.C., N.F., M.G. and L.C.; resources, R.P.; data curation, F.C.; writing—original draft preparation, F.C.; writing—review and editing, A.M., M.P., L.R. and M.L.; visualisation, A.B. and M.D.; supervision, R.P.; project administration, R.P.; funding acquisition, R.P. All authors have read and agreed to the published version of the manuscript.

Funding

This research was funded by the Fondazione Cariplo. Grant: Coltivare Valore 2018, Progetto SOCIAAALP (Reti Sociali per Agro Ambienti Alpini).

Data Availability Statement

Not applicable.

Acknowledgments

We wish to thank the social cooperative “Il sogno” and the inhabitants of the Antrona Valley for their help in the field during these years. Additionally, we would like to thank Lesley Currah for her editing and suggestions.

Conflicts of Interest

The authors declare no conflict of interest.

References

  1. Hammer, K.; Xhuveli, L.; Perrino, P. Estimating genetic erosion in landraces? two case studies. Genet. Resour. Crop Evol. 1996, 43, 329–336. [Google Scholar] [CrossRef]
  2. FAO. Agricultural Biodiversity. Background Paper 1. FAO/Netherlands Conference of Multifunctional Character of Agriculture and Land. 1999. Available online: http://www.fao.org/mfcal/pdf/bp_1_agb.pdf (accessed on 1 May 2022).
  3. FAO. Building on Gender, Agrobiodiversity and Local Knowledge; Food and Agriculture Organization of the United Nations: Rome, Italy, 2004; Available online: http://www.fao.org/docrep/007/y5609e/y5609e00.htm (accessed on 1 May 2022).
  4. FAO. Second Report on the State of the World’s Plant Genetic Resources for Food and Agriculture; Commission on Genetic Resources for Food and Agriculture, Food and Agriculture Organization of the United Nations: Rome, Italy, 2010. [Google Scholar]
  5. Esquinas-Alcázar, J. Protecting crop genetic diversity for food security: Political, ethical and technical challenges. Nat. Rev. Genet. 2005, 6, 946–953. [Google Scholar] [CrossRef] [PubMed]
  6. Jackson, L.; Pascual, U.; Hodgkin, T. Utilizing and conserving agrobiodiversity in agricultural landscapes. Agric. Ecosyst. Environ. 2007, 121, 196–210. [Google Scholar] [CrossRef]
  7. Giupponi, L.; Pilu, R.; Scarafoni, A.; Giorgi, A. Plant agro-biodiversity needs protection, study and promotion: Results of research conducted in Lombardy region (Northern Italy). Biodivers. Conserv. 2020, 29, 409–430. [Google Scholar] [CrossRef]
  8. Sangiorgio, S.; Colombo, F.; Ghidoli, M.; Giupponi, L.; Ferro, G.; Ferro, C.G.; Cassani, E.; Landoni, M.; Pilu, R. The Ancient Varieties of Mountain Maize: The Inheritance of the Pointed Character and Its Effect on the Natural Drying Process. Agronomy 2021, 11, 2295. [Google Scholar] [CrossRef]
  9. Jones, H.; Lister, D.L.; Bower, M.A.; Leigh, F.J.; Smith, L.M.; Jones, M.K. Approaches and constraints of using existing landrace and extant plant material to understand agricultural spread in prehistory. Plant Genet. Resour. 2008, 6, 98–112. [Google Scholar] [CrossRef]
  10. Zeven, A.C. Traditional maintenance breeding of landraces: 2 Practical and theoretical considerations on maintenance of variation of landraces by farmers and gardeners. Euphytica 2002, 123, 147–158. [Google Scholar] [CrossRef]
  11. Camacho Villa, T.C.; Maxted, N.; Scholten, M.; Ford-Lloyd, B. Defining and identifying crop landraces. Plant Genet. Res. 2005, 3, 373–384. [Google Scholar] [CrossRef] [Green Version]
  12. Aguiriano, E.; Ruiz, M.; Fité, R.; Carrillo, J.M. Analysis of genetic variability in a sample of the durum wheat (Triticum durum Desf.) Spanish collection based on gliadin markers. Genet. Resour. Crop Evol. 2006, 53, 1543–1552. [Google Scholar] [CrossRef] [Green Version]
  13. Teklu, Y.; Hammer, K.; Huang, X.Q.; Roder, M.S. Analysis of microsatellite diversity in Ethiopian tetraploid wheat landraces. Genet. Resour. Crop Evol. 2005, 53, 1115–1126. [Google Scholar] [CrossRef]
  14. Brandolini, A. Maize introduction, evolution and diffusion in Italy. Maydica 2009, 54, 233–242. [Google Scholar]
  15. de Carvalho, M.A.; Bebeli, P.J.; Bettencourt, E.; Costa, G.; Dias, S.; Dos Santos, T.M.; Slaski, J.J. Cereal landraces genetic resources in worldwide GeneBanks. A review. Agron. Sustain. Dev. 2013, 33, 177–203. [Google Scholar] [CrossRef] [Green Version]
  16. Cantaluppi, E.; Manzi, S.; Egal, A.A.; Puglisi, D.; Cassani, E.; Toschi, I.; Cesari, V.T.; Landoni, M.; Scapin, A.; Pilu, S. Nutritional and phenotypical characterization of two South African maize (Zea mays L.) varieties sampled in the Qwa-Qwa region. Maydica 2017, 62, 1–10. [Google Scholar]
  17. Landoni, M.V.; Andrea, S.; Cassani, E.; Borlini, G.; Follador, A.R.V.; Giupponi, L.; Ghidoli, M.; Hejna, M.; Rossi, L.; Pilu, S.R. Comparison among four maize varieties in conventional and low input cultivation. Maydica 2020, 65, 1–13. [Google Scholar]
  18. Giupponi, L.; Leoni, V.; Colombo, F.; Cassani, E.; Hejna, M.; Rossi, L.; Pilu, R. Characterization of “Mais delle Fiorine” (Zea mays L.) and nutritional, morphometric and genetic comparison with other maize landraces of Lombardy region (Northern Italy). Genet. Resour. Crop Evol. 2021, 68, 2075–2091. [Google Scholar] [CrossRef]
  19. Tesemma, T.; Tsegaye, S.; Belay, G.; Bechere, E.; Mitiku, D. Stability of performance of tetraploid wheat landraces in the Ethiopian highland. Euphytica 1998, 102, 301–308. [Google Scholar] [CrossRef]
  20. Pinheiro de Carvalho, M.A.A.; Slaski, J.J.; dos Santos, T.M.M.; Ganança, F.T.; Abreu, I.; Taylor, G.J.; Clemente Vieira, M.R.; Popova, T.N.; Franco, E. Identification of aluminium resistant genotypes among Madeiran regional wheats. Commun. Soil Sci. Plant Anal. 2003, 34, 2973–2985. [Google Scholar] [CrossRef]
  21. Newton, A.C.; Akar, T.; Baresel, J.P.; Bebeli, P.J.; Bettencourt, E.; Bladenopoulos, K.V.; Czembor, J.H.; Fasoula, D.A.; Katsiotis, A.; Koutis, K.; et al. Cereal landraces for sustainable agriculture. A review. Agron. Sust. Dev. 2010, 30, 237–269. [Google Scholar] [CrossRef] [Green Version]
  22. Ceccarelli, S.; Grando, S. Decentralized-participatory plant breeding: An example of demand driven research. Euphytica 2007, 155, 349–360. [Google Scholar] [CrossRef]
  23. Mulac, D.; Hans-Ulrich, H. Cytotoxicity and Accumulation of Ergot Alkaloids in Human Primary Cells. Toxicology 2011, 282, 112–121. [Google Scholar] [CrossRef]
  24. AOAC. Official Methods of Analysis of the Association of Official Analytical Chemists: Official Methods of Analysis of AOAC International, 21st ed.; AOAC: Washington, DC, USA, 2019. [Google Scholar]
  25. American Oil Chemistry Society (AOCS). Crude Fiber Analysis in Feeds by Filter Bag Technique. Official Methods and Recommended Practices; YUMPU Publishing: Champaign, IL, USA, 2009. [Google Scholar]
  26. ICC. Standard methods. International Association for Cereal Science and Technology; ICC: Vienna, Austria, 1992. [Google Scholar]
  27. American Association of Cereal Chemists (AACC). Approved Methods of Analysis, 11th ed.; American Association of Cereal Chemists (AACC): St. Paul, MN, USA, 2001. [Google Scholar]
  28. EN 17280:2019; Foodstuffs—Determination of Zearalenone and Trichothecenes Including Deoxynivalenol and Its Acetylated Derivatives (3-Acetyl-deoxynivalenol and 15-Acetyl-deoxynivalenol), Nivalenol T-2 Toxin and HT-2 Toxin in Cereals and Cereal Products by LC-MS/MS; European Committee for Standardization: Brussels, Belgium, 2019.
  29. Debegnach, F.; Patriarca, S.; Brera, C.; Gregori, E.; Sonego, E.; Moracci, G.; De Santis, B. Ergot alkaloids in wheat and rye derived products in Italy. Foods 2019, 8, 150. [Google Scholar] [CrossRef] [PubMed] [Green Version]
  30. Svingen, T.; Lund Hansen, N.; Taxvig, C.; Vinggaard, A.M.; Jensen, U.; Have Rasmussen, P. Enniatin B and beauvericin are common in Danish cereals and show high hepatotoxicity on a high-content imaging platform. Environ. Toxicol. 2017, 32, 1658–1664. [Google Scholar] [CrossRef] [PubMed]
  31. Babič, J.; Tavčar-Kalcher, G.; Celar, F.A.; Kos, K.; Knific, T.; Jakovac-Strajn, B. Occurrence of Alternaria and other toxins in cereal grains intended for animal feeding collected in Slovenia: A three-year study. Toxins 2021, 13, 304. [Google Scholar] [CrossRef] [PubMed]
  32. Rossi, G.; Guzzon, F.; Bickler, C.; Cauzzi, P.; Di Martino, L.; Di Cecco, V.; Domina, G.; Gargano, D.; Vagge, I.; Orsenigo, S.; et al. Seed germination under osmotic stress across different wild populations of mountain rye (Secale strictum (C.Presl) C.Presl). Plant Biosyst. 2022, 15, 345–352. [Google Scholar] [CrossRef]
  33. Harlan, H.V.; Martini, M.L. A composite hybrid mixture. J. Amer. Soc. Agron. 1929, 21, 487–490. [Google Scholar] [CrossRef] [Green Version]
  34. Goldringer, I.; Prouin, C.; Rousset, M.; Galic, N.; Bonnin, I. Rapid differentiation of experimental populations of wheat for heading time in response to local climatic conditions. Ann. Bot. 2006, 98, 805–817. [Google Scholar] [CrossRef] [Green Version]
  35. Raggi, L.; Ciancaleoni, S.; Torricelli, R.; Terzi, V.; Ceccarelli, S.; Negri, V. Evolutionary breeding for sustainable agriculture: Selection and multi-environment evaluation of barley populations and lines. Field Crop. Res. 2017, 204, 76–88. [Google Scholar] [CrossRef]
  36. Suneson, C.A. An evolutionary plant breeding method. Agron. J. 1956, 48, 188–191. [Google Scholar] [CrossRef]
  37. Rasmusson, D.C.; Beard, B.H.; Johnson, F.K. Effect of natural selection on performance of a barley population. Crop Sci. 1967, 7, 543. [Google Scholar] [CrossRef]
  38. Allard, R.W. Relationship between genetic diversity and consistency of performance in different environments. Crop Sci. 1961, 1, 127–133. [Google Scholar] [CrossRef]
  39. Döring, T.F.; Annicchiarico, P.; Clarke, S.; Haigh, Z.; Jones, H.E.; Pearce, H.; Snape, J.; Zhang, J.; Wolfe, M.S. Comparative analysis of performance and stability among composite cross populations, variety mixtures and pure lines of winter wheat in organic and conventional cropping systems. Field Crop. Res. 2015, 183, 235–245. [Google Scholar] [CrossRef]
  40. Reiss, E.R.; Drinkwater, L.E. Cultivar mixtures: A meta-analysis of the effect of intraspecific diversity on crop yield. Ecol. Appl. 2018, 28, 62–77. [Google Scholar] [CrossRef] [PubMed]
  41. Wolfe, M.S.; Brändle, U.; Koller, B.; Limpert, E.; McDermott, J.M.; Müller, K.; Schaffner, D. Barley mildew in Europe: Population biology and host resistance. Euphytica 1992, 63, 125–139. [Google Scholar] [CrossRef]
  42. Smithson, J.B.; Lenné, J.M. Varietal mixtures: A viable strategy for sustainable productivity in subsistence agriculture. Ann. Appl. Biol. 1996, 128, 127–158. [Google Scholar] [CrossRef]
  43. Mundt, C.C. Use of multiline cultivars and cultivar mixtures for disease management. Annu. Rev. Phytopathol. 2002, 40, 381–410. [Google Scholar] [CrossRef] [PubMed] [Green Version]
  44. Patel, J.D.; Reinbergs, E.; Mather, D.E.; Choo, T.M.; Sterling, J.D. Natural selection in a double-haploid mixture and a composite cross of barley. Crop Sci. 1987, 27, 474–479. [Google Scholar] [CrossRef]
  45. Van Wart, J.; van Bussel, L.; Wolf, J.; Licker, R.; Grassini, P.; Nelson, A.; Boogaard, H.; Gerber, J.; Muller, N.; Claessens, L.; et al. Use of agro-climatic zones to upscale simulated crop yield potential. Field Crop. Res. 2013, 143, 44–55. [Google Scholar] [CrossRef] [Green Version]
  46. Bushuk, W. Rye: Production, Chemistry, and Technology, 2nd ed.; American Association of Cereal Chemists: St. Paul, MN, USA, 2001. [Google Scholar]
Figure 1. The measured yield (A), n°ears/m2 (B), single-seed weight (C) and plant height (D) of five wheat varieties in Varchignoli. For each parameter measured, different letters indicate statistically significant differences (Tukey’s test, p < 0.05).
Agronomy 12 01695 g001
Figure 2. The measured yield (A), n°ears/m2 (B), single-seed weight (C) and plant height (D) of San Pastore wheat in Valleggia. For each parameter measured, different letters indicate statistically significant differences (t-test, p < 0.05).
Agronomy 12 01695 g002
Figure 3. The measured yield (A), n°ears/m2 (B), single-seed weight (C) and plant height (D) of three rye varieties in Varchignoli. For each parameter measured, different letters indicate statistically significant differences (Tukey’s test, p < 0.05).
Agronomy 12 01695 g003
Figure 4. The measured yield (A), n°ears/m2 (B), single-seed weight (C) and plant height (D) of Alpina rye in Valleggia (t-test, p < 0.05).
Agronomy 12 01695 g004
Figure 5. Dough development (A) and gas production (B) of doughs prepared from wheat flour (black line) and rye-wheat blend (30:70) (grey line). In panel B, solid lines refer to produced gas, whereas dotted lines refer to retained gas in the dough.
Agronomy 12 01695 g005
Figure 6. Bread and slices of bread prepared from wheat flour (A) and rye-wheat blend (30:70) (B).
Agronomy 12 01695 g006
Table 1. Varieties of wheat and rye used. Experiments were carried out in two locations: Varchignoli and Valleggia.
CropVarietyAbbreviationTypologyExperimental Field
Wheat7 Grani *7GMixVarchignoli
GiorgioneGGTraditional variety
MentanaMTTraditional variety
SolibamSBEvolutionary population
TengriTGModern variety
San PastoreSPTraditional varietyValleggia
RyeSKTP50 **SKTP50MixVarchignoli
StankoSKModern variety
Tradizionale PiemonteTPTraditional variety
AlpinaAPTraditional varietyValleggia
* Mix of traditional varieties: Gentilrosso, Andriolo, Verna, Sieve, Inallettabile, Frassineto. ** Mix of Stanko (50%) and Tradizionale Piemonte (50%).
Table 2. Compositional analyses performed on wheat flours. The nutrient composition is expressed on a dry matter (DM) basis.
VarietyAsh (%)Crude Fibre (%)Crude Fat (%)Crude Protein (%)Starch (%)
7G2.07 ± 0.05 a1.95 ± 0.01 b1.06 ± 0.04 bc13.66 ± 0.26 b55.22 ± 5.02 a
GG1.58 ± 0.06 c2.90 ± 0.00 a1.49 ± 0.31 ab12.35 ± 0.31 c57.96 ± 4.11 a
MT1.84 ± 0.06 b1.93 ± 0.06 b1.70 ± 0.03 a10.93 ± 0.29 d53.12 ± 2.86 a
SB1.93 ± 0.06 ab1.75 ± 0.09 b1.23 ± 0.26 abc14.69 ± 0.12 a50.83 ± 4.66 a
TG1.53 ± 0.07 c1.99 ± 0.05 b1.11 ± 0.05 bc12.21 ± 0.19 c51.84 ± 2.66 a
SP1.86 ± 0.13 ab3.03 ± 0.20 a0.97 ± 0.15 c14.14 ± 0.50 ab55.15 ± 1.38 a
For each parameter measured, different letters indicate statistically significant differences (Tukey’s test, p < 0.05).
Table 3. Compositional analyses performed on rye flours. The nutrient composition is expressed on a dry matter (DM) basis.
VarietyAsh (%)Crude Fibre (%)Crude Fat (%)Crude Protein (%)Starch (%)
SKTP501.69 ± 0.04 b1.59 ± 0.27 a1.40 ± 0.04 a11.13 ± 0.45 b49.38 ± 1.74 a
SK1.77 ± 0.05 ab1.81 ± 0.25 a0.71 ± 0.29 b11.05 ± 0.38 b51.52 ± 3.41 a
TP1.67 ± 0.07 b1.76 ± 0.18 a1.09 ± 0.22 ab11.50 ± 0.27 b47.33 ± 1.73 a
AP1.87 ± 0.03 a1.48 ± 0.12 a0.90 ± 0.02 b12.40 ± 0.09 a47.49 ± 4.65 a
For each parameter measured, different letters indicate statistically significant differences (Tukey’s test, p < 0.05).
Table 4. Characterisation of dough and bread prepared from wheat flour and rye-wheat blend (30:70).
Wheat30% Rye
DoughWater absorption (g/100g)65.5 ± 0.462.3 ± 1.2 **
Dough development time (min)2.7 ± 0.22.2 ± 0.3 ***
Stability time (min)2.5 ± 0.12.5 ± 0.4
BreadWeight (g)77.0 ± 1.177.0 ± 0.6
Volume (mL)176.0 ± 8.1165.0 ± 9.8
Specific volume (mL/g)2.3 ± 0.12.1 ± 0.1
Moisture content (%)42.1 ± 0.141.9 ± 1.2
Water activity0.9 ± 0.10.9 ± 0.1
Firmness (N)29.9 ± 2.826.5 ± 6.8
Crust colourLuminosity52.4 ± 4.950.8 ± 1.8
Yellowness13.4 ± 1.113.0 ± 0.9
Redness22.5 ± 1.321.5 ± 2.0
Crumb colourLuminosity53.6 ± 2.253.4 ± 1.3
Yellowness6.3 ± 0.25.7 ± 0.1 *
Redness17.1 ± 0.516.4 ± 0.3 *
Asterisk indicates significant differences between the samples (t-test) at p < 0.05 (*); p < 0.01 (**) and p < 0.001 (***).
Table 5. Mycotoxin average quantity and standard deviation calculated on three samples of rye flour used for bread production. On the third column the LODs of the method are indicated.
MycotoxinAverage Quantity ± Dev Std (µg/kg) *LOD (µg/kg)
15-Acetoxyscirpenol<LOD10
15-Acetyl-Deoxynivalenol<LOD50
3-Acetyl-Deoxynivalenol<LOD50
Aflatoxin B1<LOD0.5
Aflatoxin B2<LOD1
Aflatoxin G1<LOD1
Aflatoxin G2<LOD1
Agroclavin<LOQ (1)0.3
alpha-Ergocryptine20 ± 91
alpha-Ergocryptinine2 ± 22
alpha-Zearalenol<LOD3
Alternariol191 ± 7510
Beauvericin<LOQ (3)1
beta-Zearalenol<LOD6
Deoxynivalenol<LOD20
Deoxynivalenol-3-Glucoside<LOD5
Diacetoxyscirpenol<LOD3
Dihydrolysergol<LOD15
Elymoclavin<LOD1
Enniatin A14 ± 91
Enniatin A165 ± 371
Enniatin B782 ± 5681
Enniatin B1205 ± 1151
Ergine<LOD1
Ergocornine22 ± 81
Ergocorninine9 ± 31
Ergocristine23 ± 41
Ergocristinine6 ± 31
Ergometrine9 ± 11
Ergometrinine3 ± 01
Ergosine24 ± 51
Ergotamine5 ± 11
Fumonisin B1<LOD10
Fumonisin B2<LOD10
Fumonisin B3<LOD10
Fusarenon X<LOD30
Gliotoxin<LOD20
HT-2 Toxin<LOD15
Moniliformin69 ± 5210
Mycophenolic acid<LOD20
Neosolaniol<LOD1
Nivalenol<LOD20
Ochratoxin A<LOD0.5
Ochratoxin B<LOD0.5
Patulin<LOD75
Penicillanic acid<LOD7.5
Roquefortine C<LOD2
Sterigmatocystin<LOD0.3
T-2 Toxin<LOD10
T-2 Triol<LOD10
T-2 Tetraol<LOD100
Zearalanon<LOD0.5
Zearalenon<LOD5
* In parenthesis, the LOQ value for the specific mycotoxin.
Publisher’s Note: MDPI stays neutral with regard to jurisdictional claims in published maps and institutional affiliations.

