Article

Hydrochemical Assessment of Water Used for Agricultural Soil Irrigation in the Water Area of the Three Morava Rivers in the Republic of Serbia

by
Radmila Pivić
1,*,
Jelena Maksimović
1,
Zoran Dinić
1,
Darko Jaramaz
1,
Helena Majstorović
2,
Dragana Vidojević
3 and
Aleksandra Stanojković-Sebić
1
1
Institute of Soil Science, Teodora Drajzera 7, 11000 Belgrade, Serbia
2
Institute “Tamiš” Pančevo, 26000 Pančevo, Serbia
3
Ministry of Environmental Protection, Serbian Environmental Protection Agency, 11000 Belgrade, Serbia
*
Author to whom correspondence should be addressed.
Agronomy 2022, 12(5), 1177; https://doi.org/10.3390/agronomy12051177
Submission received: 11 April 2022 / Revised: 5 May 2022 / Accepted: 9 May 2022 / Published: 13 May 2022
(This article belongs to the Special Issue Optimal Water Management and Sustainability in Irrigated Agriculture)

Abstract

:
The assessment of the suitability and status of irrigation water quality from the aspect of its potential negative impact on soil salinization and mapping of spatial distribution within the area of the three Morava rivers, which includes the South, West, and Great Morava basins, was the purpose of this research. A total of 215 samples of irrigation water were tested, and their quality was evaluated based on the analysis of the following parameters: pH, electrical conductivity (EC), total dissolved salt (TDS), sodium adsorption ratio (SAR), and content of SO42−, Cl, HCO3, CO3 2−, Mg2+, Ca2+, Na+, and K+. The results showed that the average content of ions was as follows: Ca2+ > Mg2+ > Na+ > K+ and HCO3 > SO42− > Cl > CO32−. The assessment of irrigation water suitability was determined by calculating the following indices: percentage sodium (Na %), residual sodium carbonate (RSC), permeability index (PI), magnesium hazard (MH), potential salinity (PS), Kelley’s index (KI), total hardness (TH), irrigation water quality index (IWQI). Based on Wilcox’s diagram, the USSL diagram, and the Doneen chart, it was concluded that most of the samples were suitable for irrigation. Using multivariate statistical techniques and correlation matrices in combination with other hydrogeochemical tools such as Piper’s, Chadha’s, and Gibbs diagrams, the main factors associated with hydrogeochemical variability were identified.

1. Introduction

The irrigation of cultivated plants on agricultural soil involves the use of water with the appropriate physical, chemical, and biological properties, so it is very important to examine the quality of water used for its intended purpose to assess the impact on soil and plants. Intensification of irrigation depends primarily on the provision of the required amount of water of adequate quality [1,2]. According to the report of the Republic Bureau of Statistics (RBS), in 2021 [3], 52.236 hectares of agricultural soil in the Republic of Serbia were irrigated, capturing about 92.574 thousand m3 of water, which was mostly pumped from watercourses, about 84.3%, while the remaining quantities were collected from groundwaters, lakes, reservoirs, and other sources.
The area of study, the three Morava rivers, covers an area of agricultural production, within which the application of irrigation is expanding, so the examination of the quality of irrigation water is important for its intensification. This was recognized by the governing body, the Ministry of Agriculture, Water Management and Forestry of the Republic of Serbia, and the Agricultural Soil Administration, which enabled researchers to assess the quality of irrigation water to intensify agricultural production and prevent a negative impact on soil degradation.
Different sources of water are used for irrigation: rivers, streams, natural and artificial reservoirs and lakes, and groundwater from different depths (tube wells and dug wells). Information on irrigation water quality is of critical significance for understanding the changes in product quality and for making necessary modifications in water management [4]. Ayers and Wescot [5] stated the importance of water quality assessment for irrigation. It is a prerequisite for planning, designing, and operating irrigation systems [6].
Surface water quality according to [7], is mostly determined by the quality and scope of industrial, agricultural, and other anthropogenic activities in the basins of a particular area.
Anthropogenic impacts and natural processes can affect the quality of surface water and threaten its use as drinking water, and for use in industry, agriculture, and other purposes [8,9,10].
When assessing the quality of irrigation water, it is very important to evaluate whether it can harm the characteristics of the soil on which it is used. Ghazaryan et al. [11] stated that salinization involves the accumulation of soluble salts in the soil profile and is a process of soil degradation, mainly anthropogenic, which affects highly productive irrigated agricultural ecosystems in semi-arid and arid regions and can negatively affect agricultural production and the sustainable development of agricultural regions. Salinization reduces the production capacity of the soil and degrades the chemical and physical properties of the soil. Given the problem of food shortages worldwide, one of the biggest problems of agriculture is the reduction and control of soil salinity [12].
On irrigated soils, salinization is the main cause of conditions limiting agricultural production and lack of yield and is one of the harmful effects on the environment. Singh et al. [13] list the three most common worldwide problems of irrigation water used being of inadequate quality to include salinity, reduced permeability, and increased specificity of ionic toxicity.
Poor quality irrigation waters can have negative effects on heavy, clayey soils, while the same water can be used satisfactorily on sandy and/or permeable soils [14].
The quality of irrigation water is defined by the type and concentration of dissolved salts and solids [15]. Based on the results of the chemical analyses of surface waters based on hydrochemical parameters, it is possible to obtain adequate data on water types, different geochemical processes, and water classifications [16]. The interaction of the surface water chemistry and geochemical characteristics offers a valuable context for trend analysis, identification of unique environmental problems, and the exchange of information on water sources, geochemical processes, water quality, and water susceptibility to contamination [13,17].
There are several methods and classifications for assessing the quality of irrigation water based on the assessment of analyzed hydrochemical parameters, each of which cannot be considered applicable to all conditions in crop production because each depends on the soil characteristics, plant tolerance, precipitation regime, drainage conditions, watering methods, water accessibility to plants and climate. Different methods and different hydrochemical indices are used to assess the suitability of water for irrigation. Hem [18] states that reliable results can be obtained by analyzing the chemistry of all ions, rather than the individual parameters of irrigation water. Irrigation water quality is determined based on sodium adsorption ratio (SAR), sodium percentage (%N), magnesium ratio (MR), residual sodium carbonate (RSC), permeability index (PI), and Kelley’s index (KI) [11,19,20,21].
By determining the irrigation water quality index (IWQI), which combines several indicators and expresses the quality of irrigation water in the form of a single value as proposed by several authors [22,23,24,25], it is possible to obtain more reliable evaluations.
Graphical representations of the irrigation water quality assessment and its application ability are defined by physicochemical parameters [26], using graphical techniques such as the [27], Wilcox Diagram [28], and Doneen’s chart [29]. Gibbs diagram [30], as a method for defining the main geochemical control processes that affect the chemical composition of surface waters [31], is an applicable and frequently used method for defining the main geochemical control processes that affect the chemical composition of surface water and groundwater, i.e., irrigation water. In addition, by applying multivariate statistical techniques in combination with other hydrogeochemical tools such as Piper’s and Chadha’s diagrams, the main factors associated with hydrogeochemical variability have been identified. The application of cluster analysis (CA)-multivariate statistical analysis [32,33] is often used to assess water quality. It is a multivariate technique for classifying the physicochemical parameters into water classes according to the relationship between the chemical properties of the surface water [34].
Within this paper, the ion content in irrigation water samples, collected from available sources at observation sites (surface and groundwater), i.e., along with agricultural areas where irrigation is used or planned, the water characteristics and the relationship between each component and each type of ion were analyzed. The results have a significant effect on understanding the characteristics of the current situation of the regional hydrochemistry of the analyzed irrigation water and the impact of the examined parameters on the soil, primarily in terms of regional salinization treatment and the impact on agricultural production.
This study aimed to assess the suitability and status of the irrigation water quality and to provide a graphical representation of the applied classifications of the tested irrigation water samples within the three Morava river basin districts, which include the basins of the Južna (English: South), Zapadna (English: West), and Velika (English: Great) Morava rivers. Given that the data of this type of research have not been systematized, processed, and presented so far, the present results will contribute through the adoption of adequate assessment methods that will provide a basis for monitoring and establishing irrigation water quality.

2. Materials and Methods

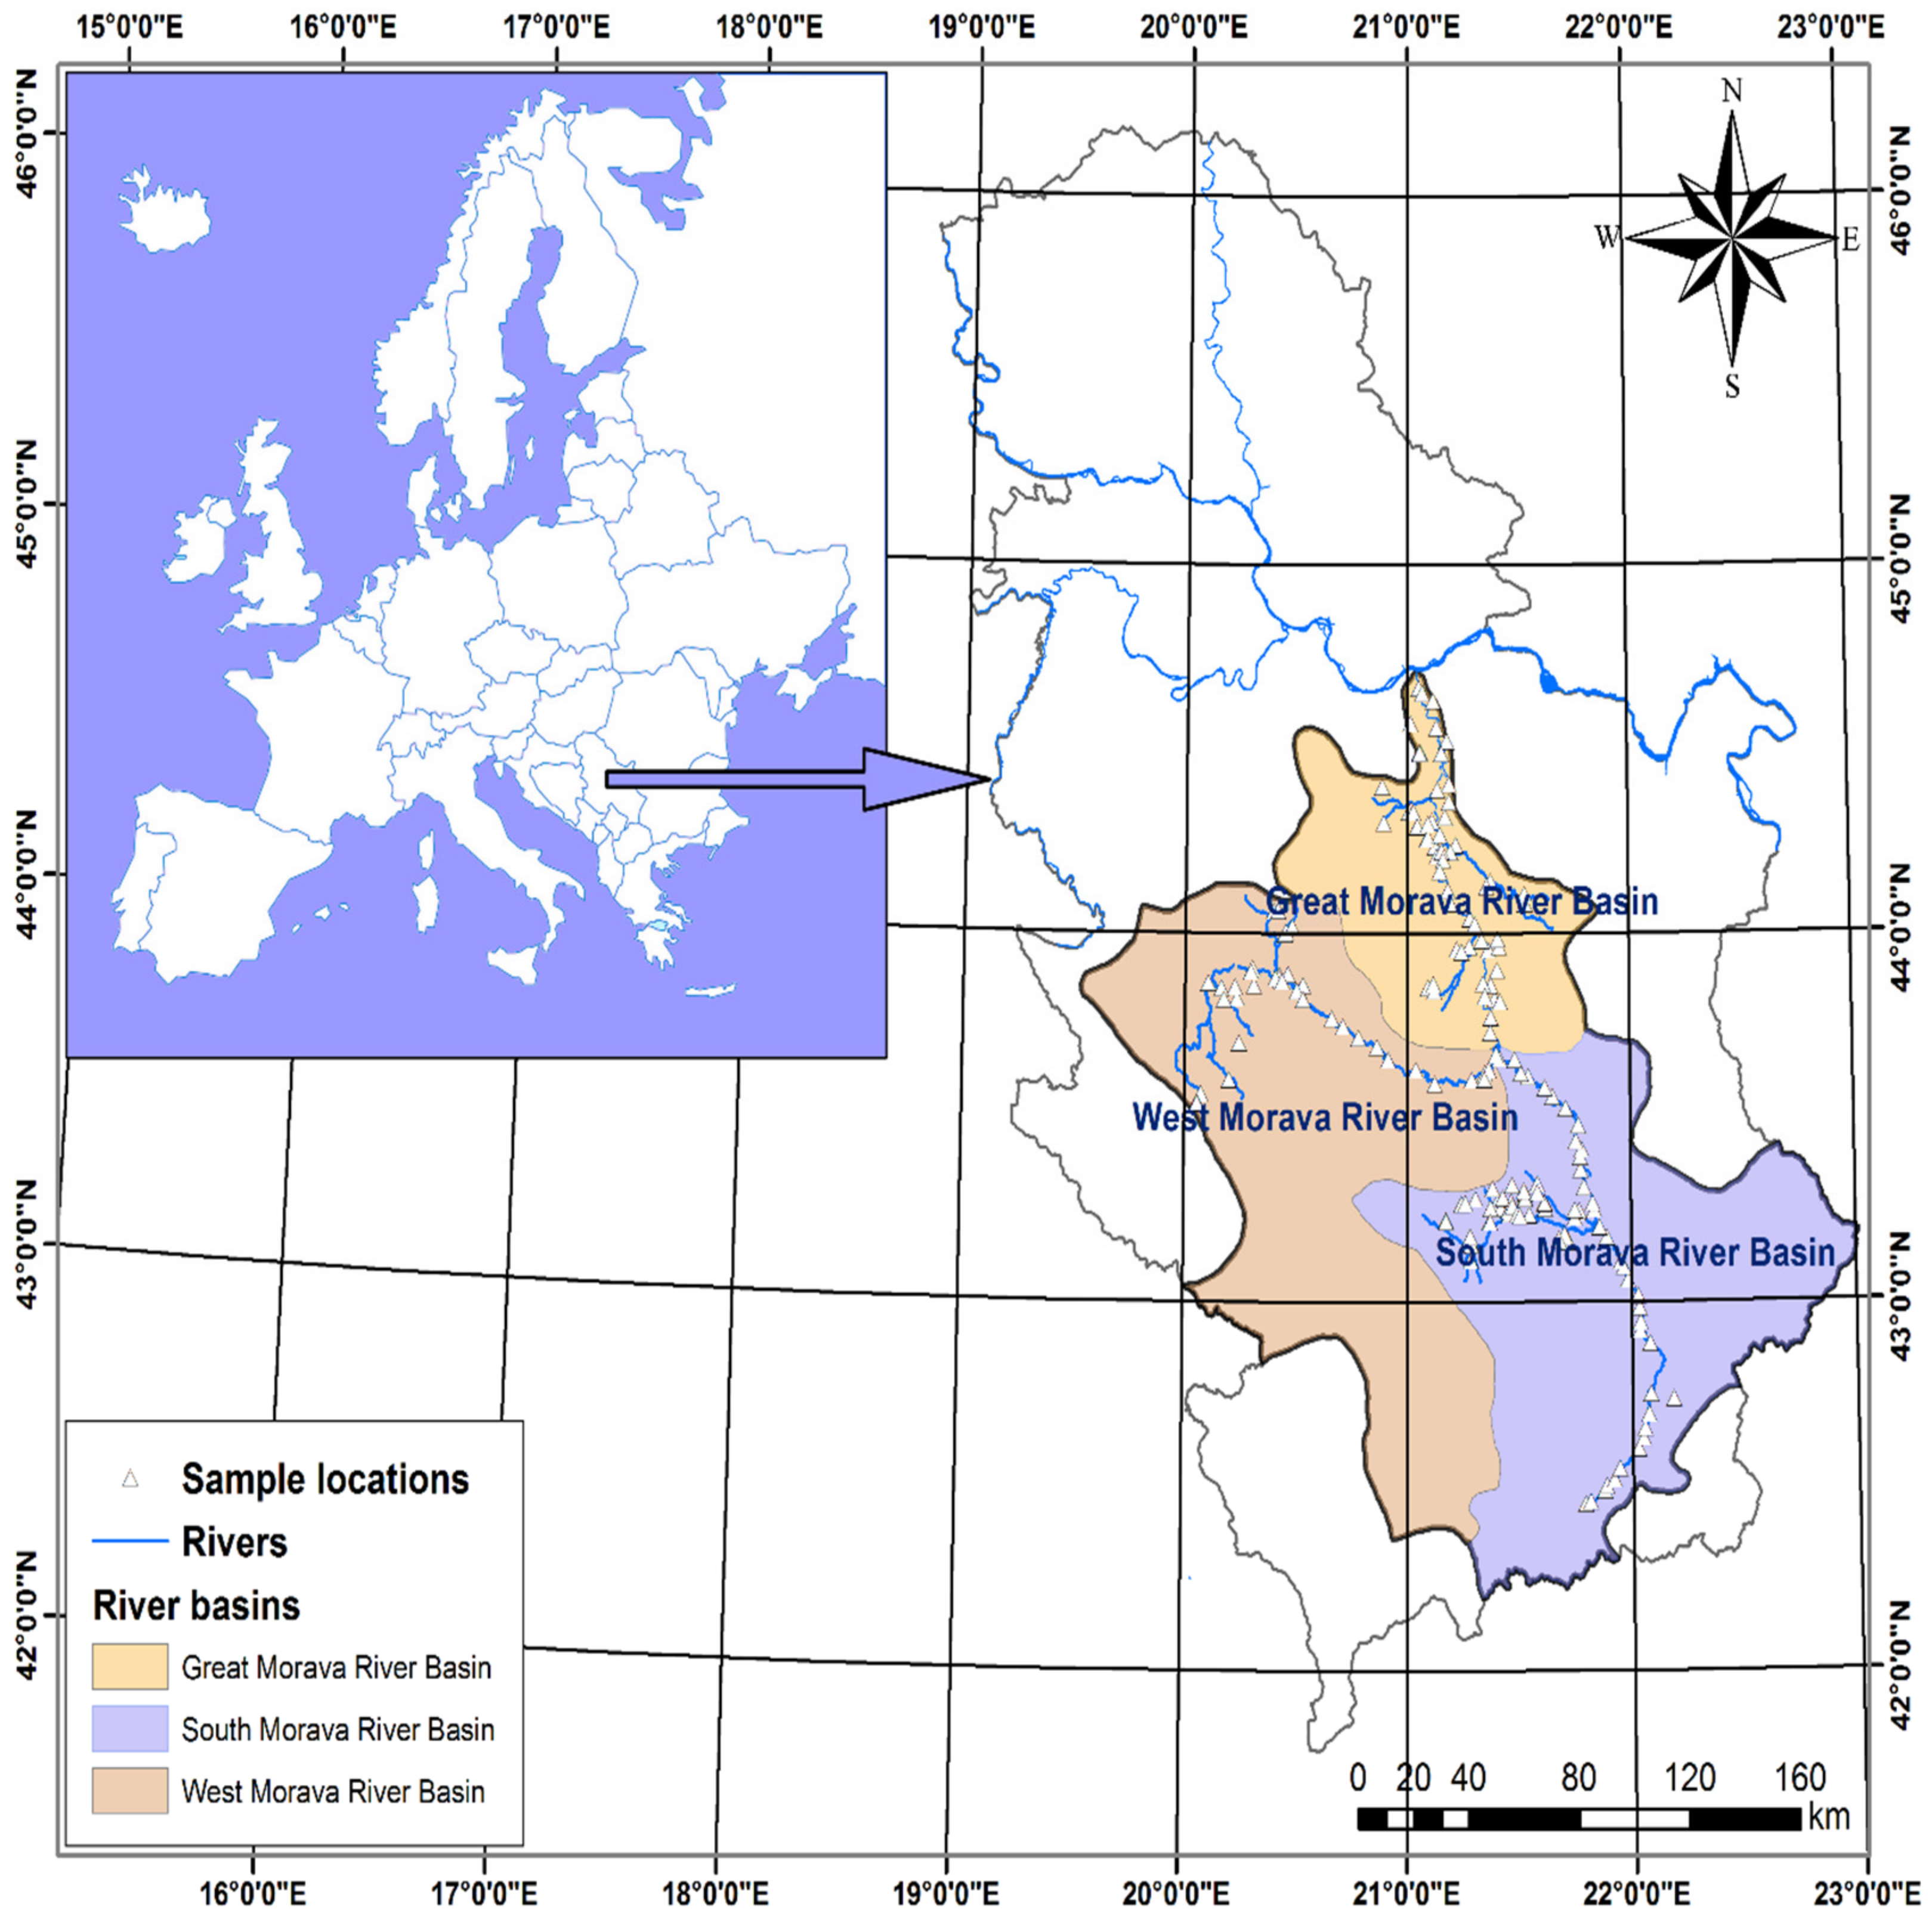
2.1. Description of the Study Area

2.1.1. Location, Hydrological Setting, and Climate

The area of the three Morava rivers is of great importance for the national economy—agriculture, industry, energy, and other human activities. In geographical terms, the basin of the three Morava rivers’ water area lies between 42°04′ and 44°82′ northern latitude and 19°19′ and 23°14′ eastern longitude (Figure 1).
The surface area of the water of the three Morava rivers in the Republic of Serbia, which includes the basins of the Južna, Zapadna, and Velika Morava, is about 36.207 km2. It belongs to the Black Sea basin and spreads over the most fertile and most densely populated area of central Serbia.
Given the small difference in latitude between the southernmost and northernmost points, it could be expected that the general climatic conditions change very little at the examined locality. However, the influence of climatic parameters, primarily the relief and the degree of continentality, determines the diversity of the climate. The climate of the area is moderately continental. Climatic conditions for agricultural production are generally favorable, especially the thermal potential.
Air temperature is one of the most important climatic elements, based on which the insight into the thermal conditions in an area is obtained. Temperatures have been rising steadily since the coldest January when an average minimum temperature of −2.5 °C and an average maximum of 5.2 °C were recorded. The warmest months are July and August with an average minimum temperature of 15.4 °C and 15.0 °C, and an average maximum temperature of 29.3 °C and 29.4 °C, respectively. The highest amplitude is in August, at 14.4 °C, while the annual temperature amplitude is 11.3 °C. The average annual air temperature is 11.8 °C. The annual actual insolation of the observed locality is 2198 h, and the average annual relative air humidity is 72%.
Pomoravlje and its surroundings have a very low annual precipitation of about 665 mm, which is a value close to those of arid areas. The distribution of precipitation throughout the seasons is not favorable for the development of crops that have a higher demand for water in summer. Precipitation is not evenly distributed over the months. The most rain falls in June and May. The months of February and October have the least precipitation when on average 5 to 6% of the total annual precipitation falls.
Droughts during summer and autumn can cause the soil to dry to a depth of 2–4 m. Exceptions are areas with groundwater at shallow depths but in very limited areas.
The wind has a significant effect on evapotranspiration. It can currently modify the weather situation depending on the amount of moisture it carries. Ground air currents are mostly conditioned by an orography. In the warmer part of the year, winds from the northwest and west prevail. During the colder part of the year, the east and southeast wind, called Košava, dominates. For the summer period, it is important to emphasize the appearance of southern winds when there is a great drying of the soil, especially if the average temperatures are high.
Data on the reference evapotranspiration (ETo), calculated using the Penman–Monteith method, showed that the highest value of ETo was registered in July and averaged 4.8 mm day1.
In the study area, the largest deficit occurs in August and occasionally in July. The values of peak water requirements are relatively uniform with an average of 4.2 mm day1.

2.1.2. Geological and Hydrogeological Setting

Within the study area, three different relief units are observed on which very different soils are formed. The terrain of the Zapadna Morava basin has a very heterogeneous geological structure, with very different relief units: river valleys, basins, the coast of Šumadija, and the foothills of the mountains and mountainous area. The basic morphological characteristic of the Južna Morava basin is its great fragmentation. The Južna Morava valley is a typical composite valley, consisting of several valleys separated by gorges. In the valleys filled with loose lake and river sediments, the slopes of the Južna Morava river are less pronounced than in the gorges built of more resistant rocks, various types of crystal-like slates through which recently formed eruptive rocks broke in places. From the steep and mostly deforested mountainsides, the flow of atmospheric water is fast and high, which makes the Južna Morava river and its tributaries have the characteristics of torrents.
In the basin of the Velika Morava river, there are very diverse rocks on which different soils are formed. In the river valleys, huge amounts of alluvial and deluvial sediments were deposited in the quaternary. Neogene sediments predominate on the lake surfaces, and shists, sandstones, limestones, and other compact rocks dominate in the mountainous areas. Certain types of soil are formed on quaternary sediments, primarily on alluvial deposits and loess. Neogene sediments are of great importance for soil formation in the area of lake surfaces.
Shists and compact rocks are important for the formation of shallow mountain soils. Figure 2 shows a geological map of the study area.

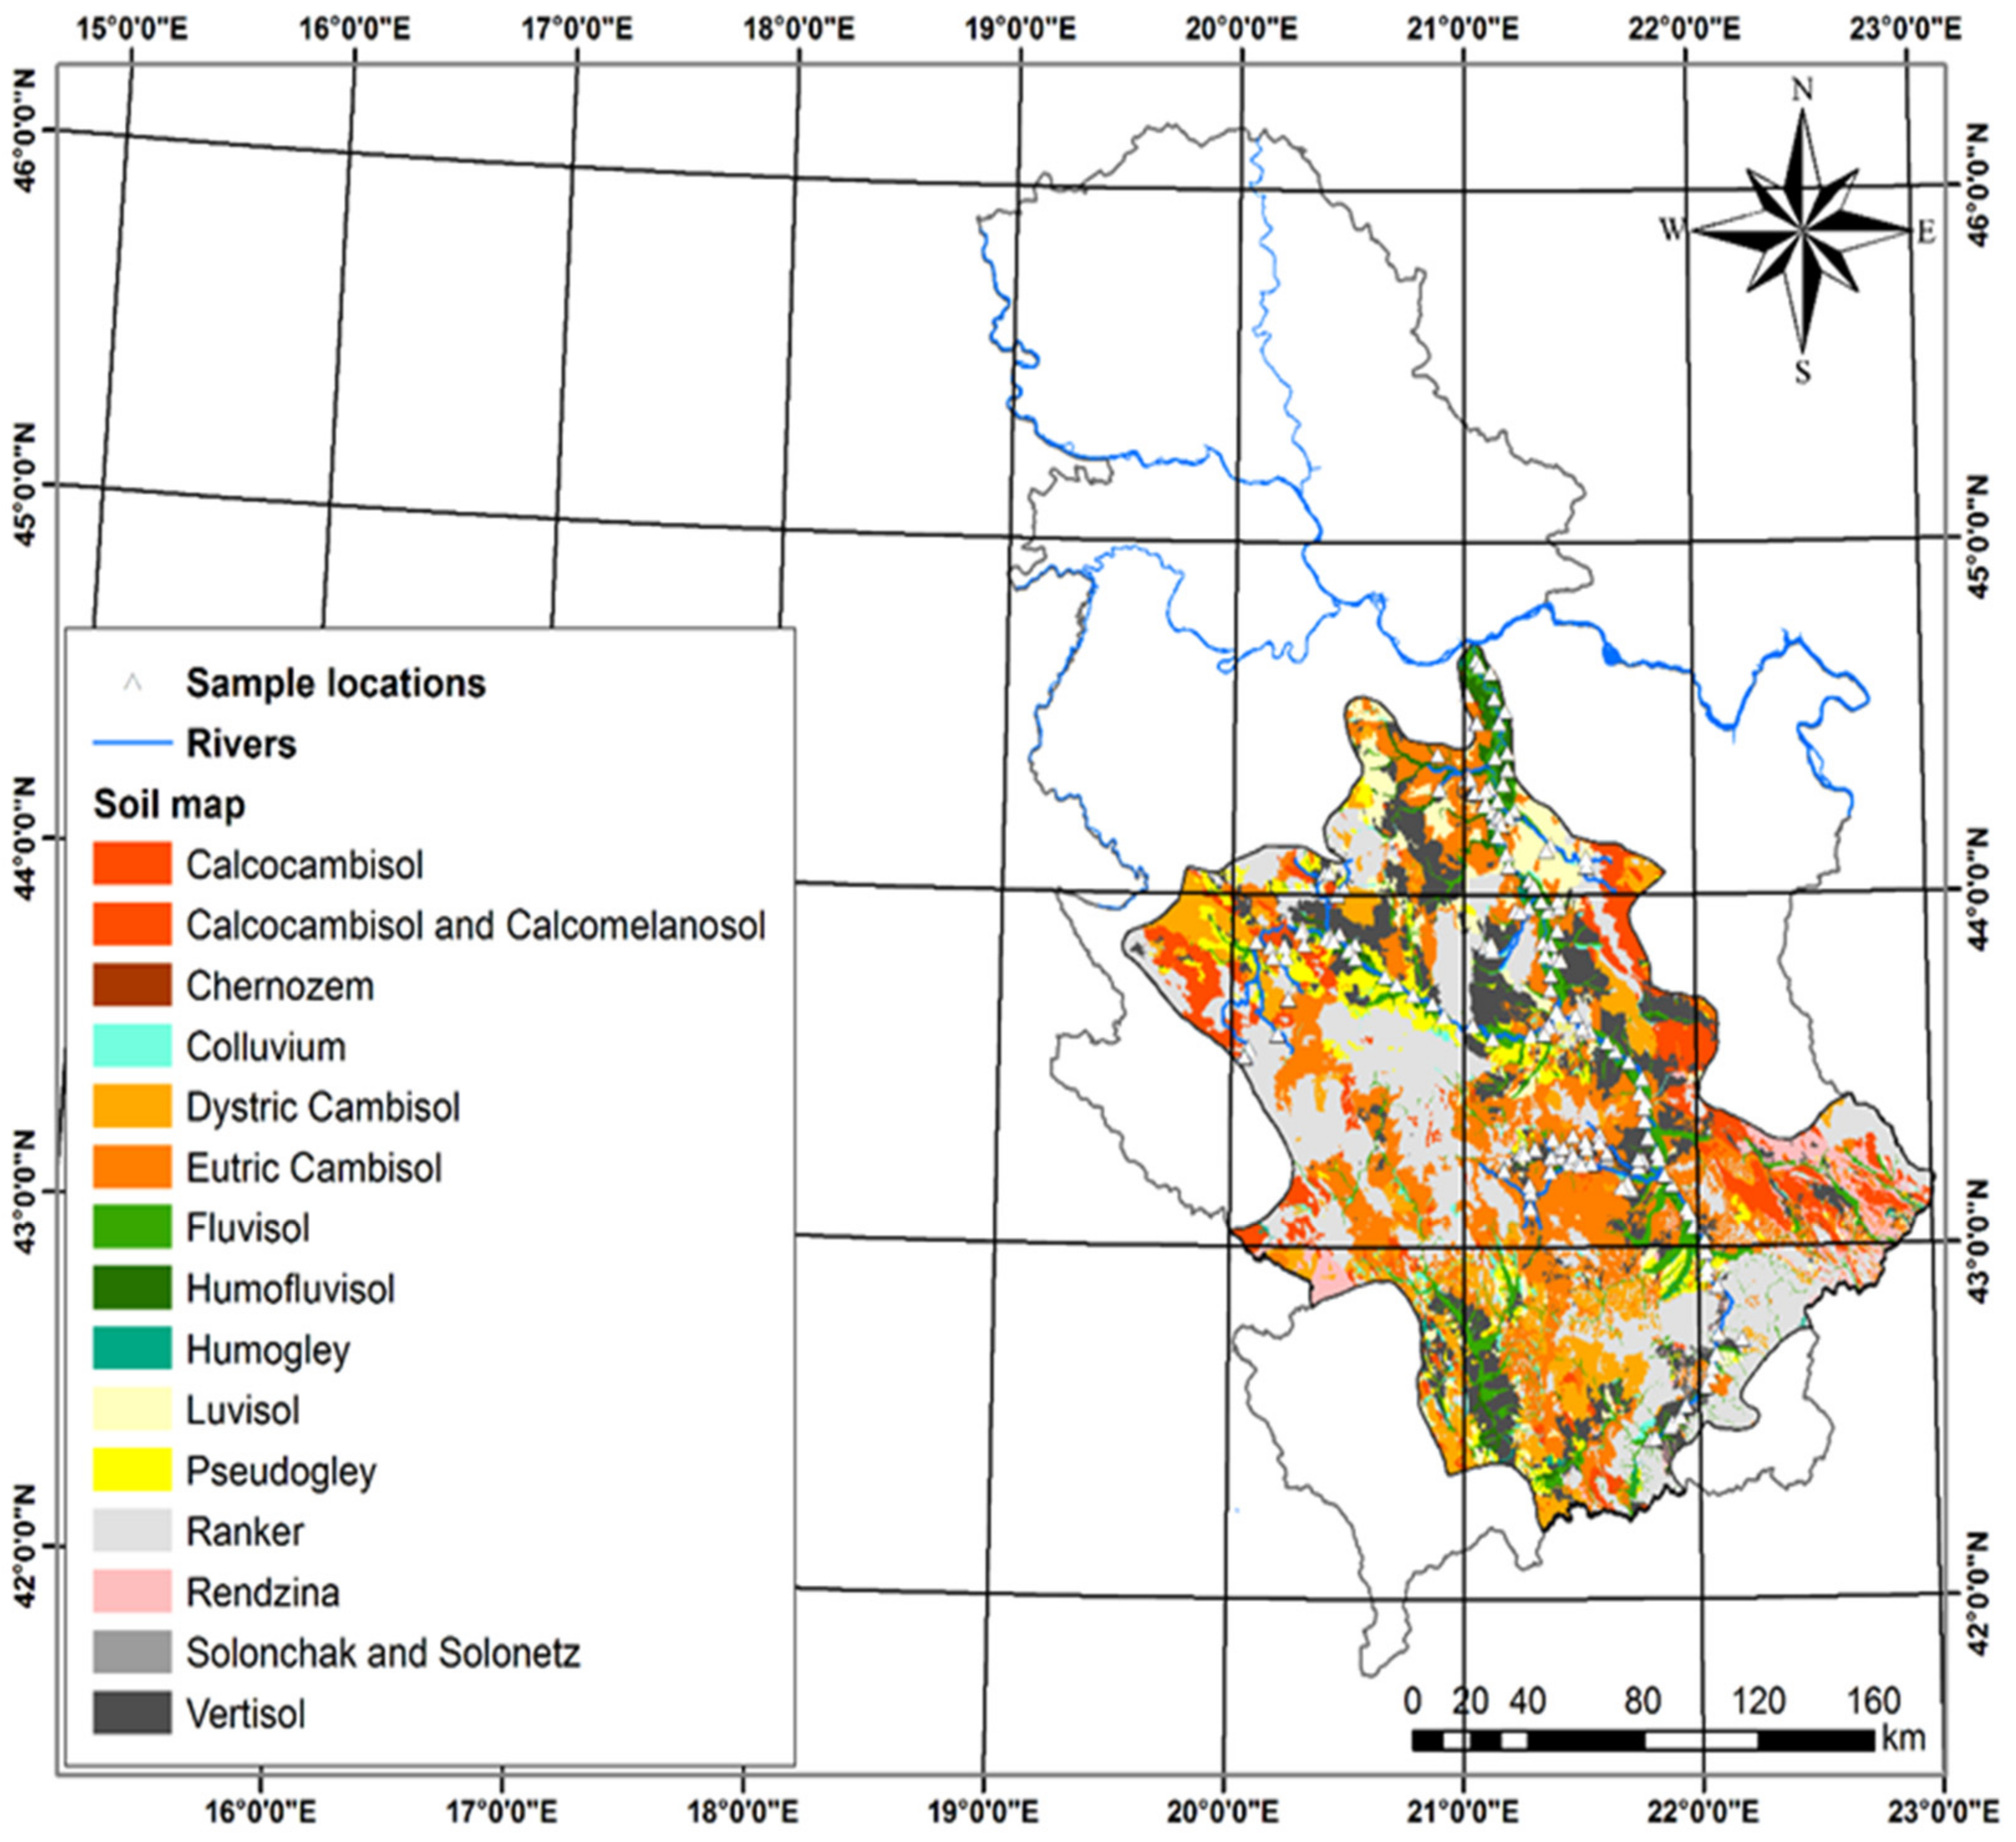
2.1.3. Soil Use Type

Soils suitable for irrigation are primarily alluvial soils along the three Morava rivers and meadow soils that are heavier in texture than alluvium [35,36]. The water physical properties of the soil along the three Morava rivers are of very heterogeneous composition. Represented are applied gravel, sandy gravel, sandy, loamy, and clay composition. All of these soils can be irrigated with varying amounts of water. The basic soil types in the river basin are Fluvisols, Luvisols, Eutric Luvisols, Eutric Cambisols and Eutric Vertisols [37]. These soils have a high potential for fertility, and irrigation is one of the factors that contribute. Irrigation provides increased yields of the crops grown in the river basin. Figure 3 shows a pedological map of the study area.

2.2. Sampling and Collection of Water Samples

A sampling of 215 water samples for irrigation (surface water samples and groundwater samples) within the irrigated agricultural areas or agricultural areas where irrigation is planned was conducted in the period 2014 to 2019, in phases as a result of the study commissioned by the Ministry of Agriculture, Water Management and Forestry of the Republic of Serbia. Water samples were collected according to the methodology described in the professional literature. The sampling locations were determined with a Garmin GSP map 62s GPS device with UTM coordinate recording. Samples were taken in polyethylene sampling bottles with a volume of 2000 mL to determine physicochemical parameters. Before use, they were washed with distilled water, and on the spot three times with sampled water. They were marked, sealed, adequately stored at temperatures up to 4 °C, and transported to the laboratory.

2.3. Laboratory Analysis

Analyses of the sampled water for irrigation were conducted in the laboratory of the Institute of Soil Science, Belgrade. The measured parameters were determined by the following methods: pH—potentiometric [38]; electrical conductivity (EC)—conductiometric [39]; total dissolved solids (TDS)—gravimetric; CO32−, HCO3, Cl—volumetric; K+, Na+—flame photometric [40]; sodium adsorption ratio (SAR)—calculation [41]; Ca2+, Mg2+—spectrophotometric [42]; SO42−—gravimetric [43]. After analysis of ion concentrations, the charge balance error (CBE) was calculated to ensure suitably high quality, and the standard error for each sample was calculated using Equation (1) [44].
C B E = c a t i o n s a n i o n s c a t i o n s + a n i o n s     100 %
CBE values with a limit of 5% were considered acceptable [45]. All cations and anions were expressed in meq L1.

2.4. Data Analysis

Statistical description (range, mean and standard error) of physicochemical parameters was determined using SPSS version 22 (SPSS Inc., Chicago, IL, USA) and shown in Table 1. The relationships between the main physicochemical parameters were processed using Microsoft Excel to identify geochemical processes and control mechanisms that affect the quality of irrigation water.
Analysis of the obtained data of the irrigation water analysis results was estimated using Gibbs diagram, USSL diagram, Wilcox’s diagram, Doneen’s chart, Piper’s diagram, and Chadha’s diagram, using Microsoft Excel 2016 (Redmond, Washington, DC, USA).
Multivariate statistical analysis, including correlation and cluster analysis (CA), was applied to assess the quality of irrigation water, using the Ward method to describe the similarities between the two clusters to identify different geochemical groups with a similar content of physicochemical parameters in the tested samples. Cluster analysis (Dendrograms) was performed using SPSS version 22 (SPSS Inc., Chicago, IL, USA).

2.5. Spatial Distribution

GIS software was used as a platform for geostatistical analysis of spatial data processing. Cartographic data processing was performed using ESRI ArcGIS Desktop 10.7.1 (Esri, Redlands, CA, USA).

2.6. Irrigation Water Quality Evaluation

The following parameters were determined: sodium absorption ratio, sodium hazard, residual sodium carbonate, permeability index, magnesium ratio, Kelley ratio, potential salinity, and irrigation water quality index.
These indicators were obtained using the following formulas:
S A R = N a + C a 2 + + M g 2 + 2
N a % = N a + + K + 100 C a 2 + + M g 2 + + N a + + K +
R S C = C O 3 2 + H C O 3 C a 2 + + M g 2 +
P I = N a + + H C O 3 100 C a 2 + + M g 2 + + N a + + K +
M H = M g 2 + C a 2 + + M g 2 + 100
K I = N a + C a 2 + + M g 2 +
P S = C l + 1 2 S O 4 2 +
The calculation of the irrigation water quality index (IWQI), developed by Meireles et al. [21], for the calculation of the mentioned index values, individual data on the values were used, as follows: EC, Na+, Cl, SAR and HCO3, by Equation (9)
I W Q I = i = 1 n q i   w i
where:
The values of the limit values qi are determined by the following Equation (10), where the corresponding parameters are shown in Table 1.
q i = q m a x x i j x i n f q i m a p x a m p
where:
qmax is the upper value of the corresponding class of qi;
Xij represents the data points of the parameters (observed value of each parameter);
Xinf refers to the lower limit value of the class to which the observed parameter belongs;
qimap represents the class amplitude for qi classes;
ximap corresponds to the class amplitude to which the parameter belongs.
For the calculation of Wi, the following Equation (11) is used:
W i = j = 1 k F j   A i j   j = 1 k i = 1 n F j   A i j  
where Wi and F are the comparative weights of the IWQI physicochemical characteristics, and component i is a constant value; The parameter i that can be described by factor j is denoted by Aij. The number of physicochemical parameters used in the IWQI ranges from 1 to n, while the number of factors chosen in the IWQI ranges from 1 to k, and where n represents the number of parameters considered, in this case, 5, values qi in Table 1 were multiplied by the corresponding weight Wi of each parameter listed in Table 2, according to [23].

3. Results and Discussion

3.1. Irrigation Water Suitability Indicators

Several indicators indicate the suitability of irrigation water. Within this study, the ion content in irrigation water samples was considered, and the water characteristics and the relationship between each component and each ion type were analyzed.
The results have a significant impact on the understanding of the characteristics of the current situation of regional surface water hydrochemistry and the impact of the examined parameters on agriculture, providing support for data for the treatment of regional salinization.
The results of the statistical analysis (min, max, mean, standard deviation value) of the physical and chemical parameters of the analyzed samples of irrigation water are shown in Table 3.
The pH values of the analyzed samples ranged from 6.2 to 8.9 (mean of 7.7). The EC of the samples varied in the ranges of 20.0–2260.0 µSm−1, with an average value of 650.9 µSm−1. TDS values of the samples varied in a wide range from 50.0–2800.0 mg L−1, with a mean value of 497.4 mg L−1. The results showed that the average content of ions was as follows: Ca2+ > Mg2+ > Na+ > K+ and HCO3 > SO42− > Cl > CO32−. The results of the hydrochemical properties of the tested samples are presented below, based on which the performance of the irrigation water suitability was obtained (Table 3).
For a critical assessment of the irrigation water suitability, Table 4 shows the various indicators and associated classifications along with the number and percentage of water samples belonging to each class.

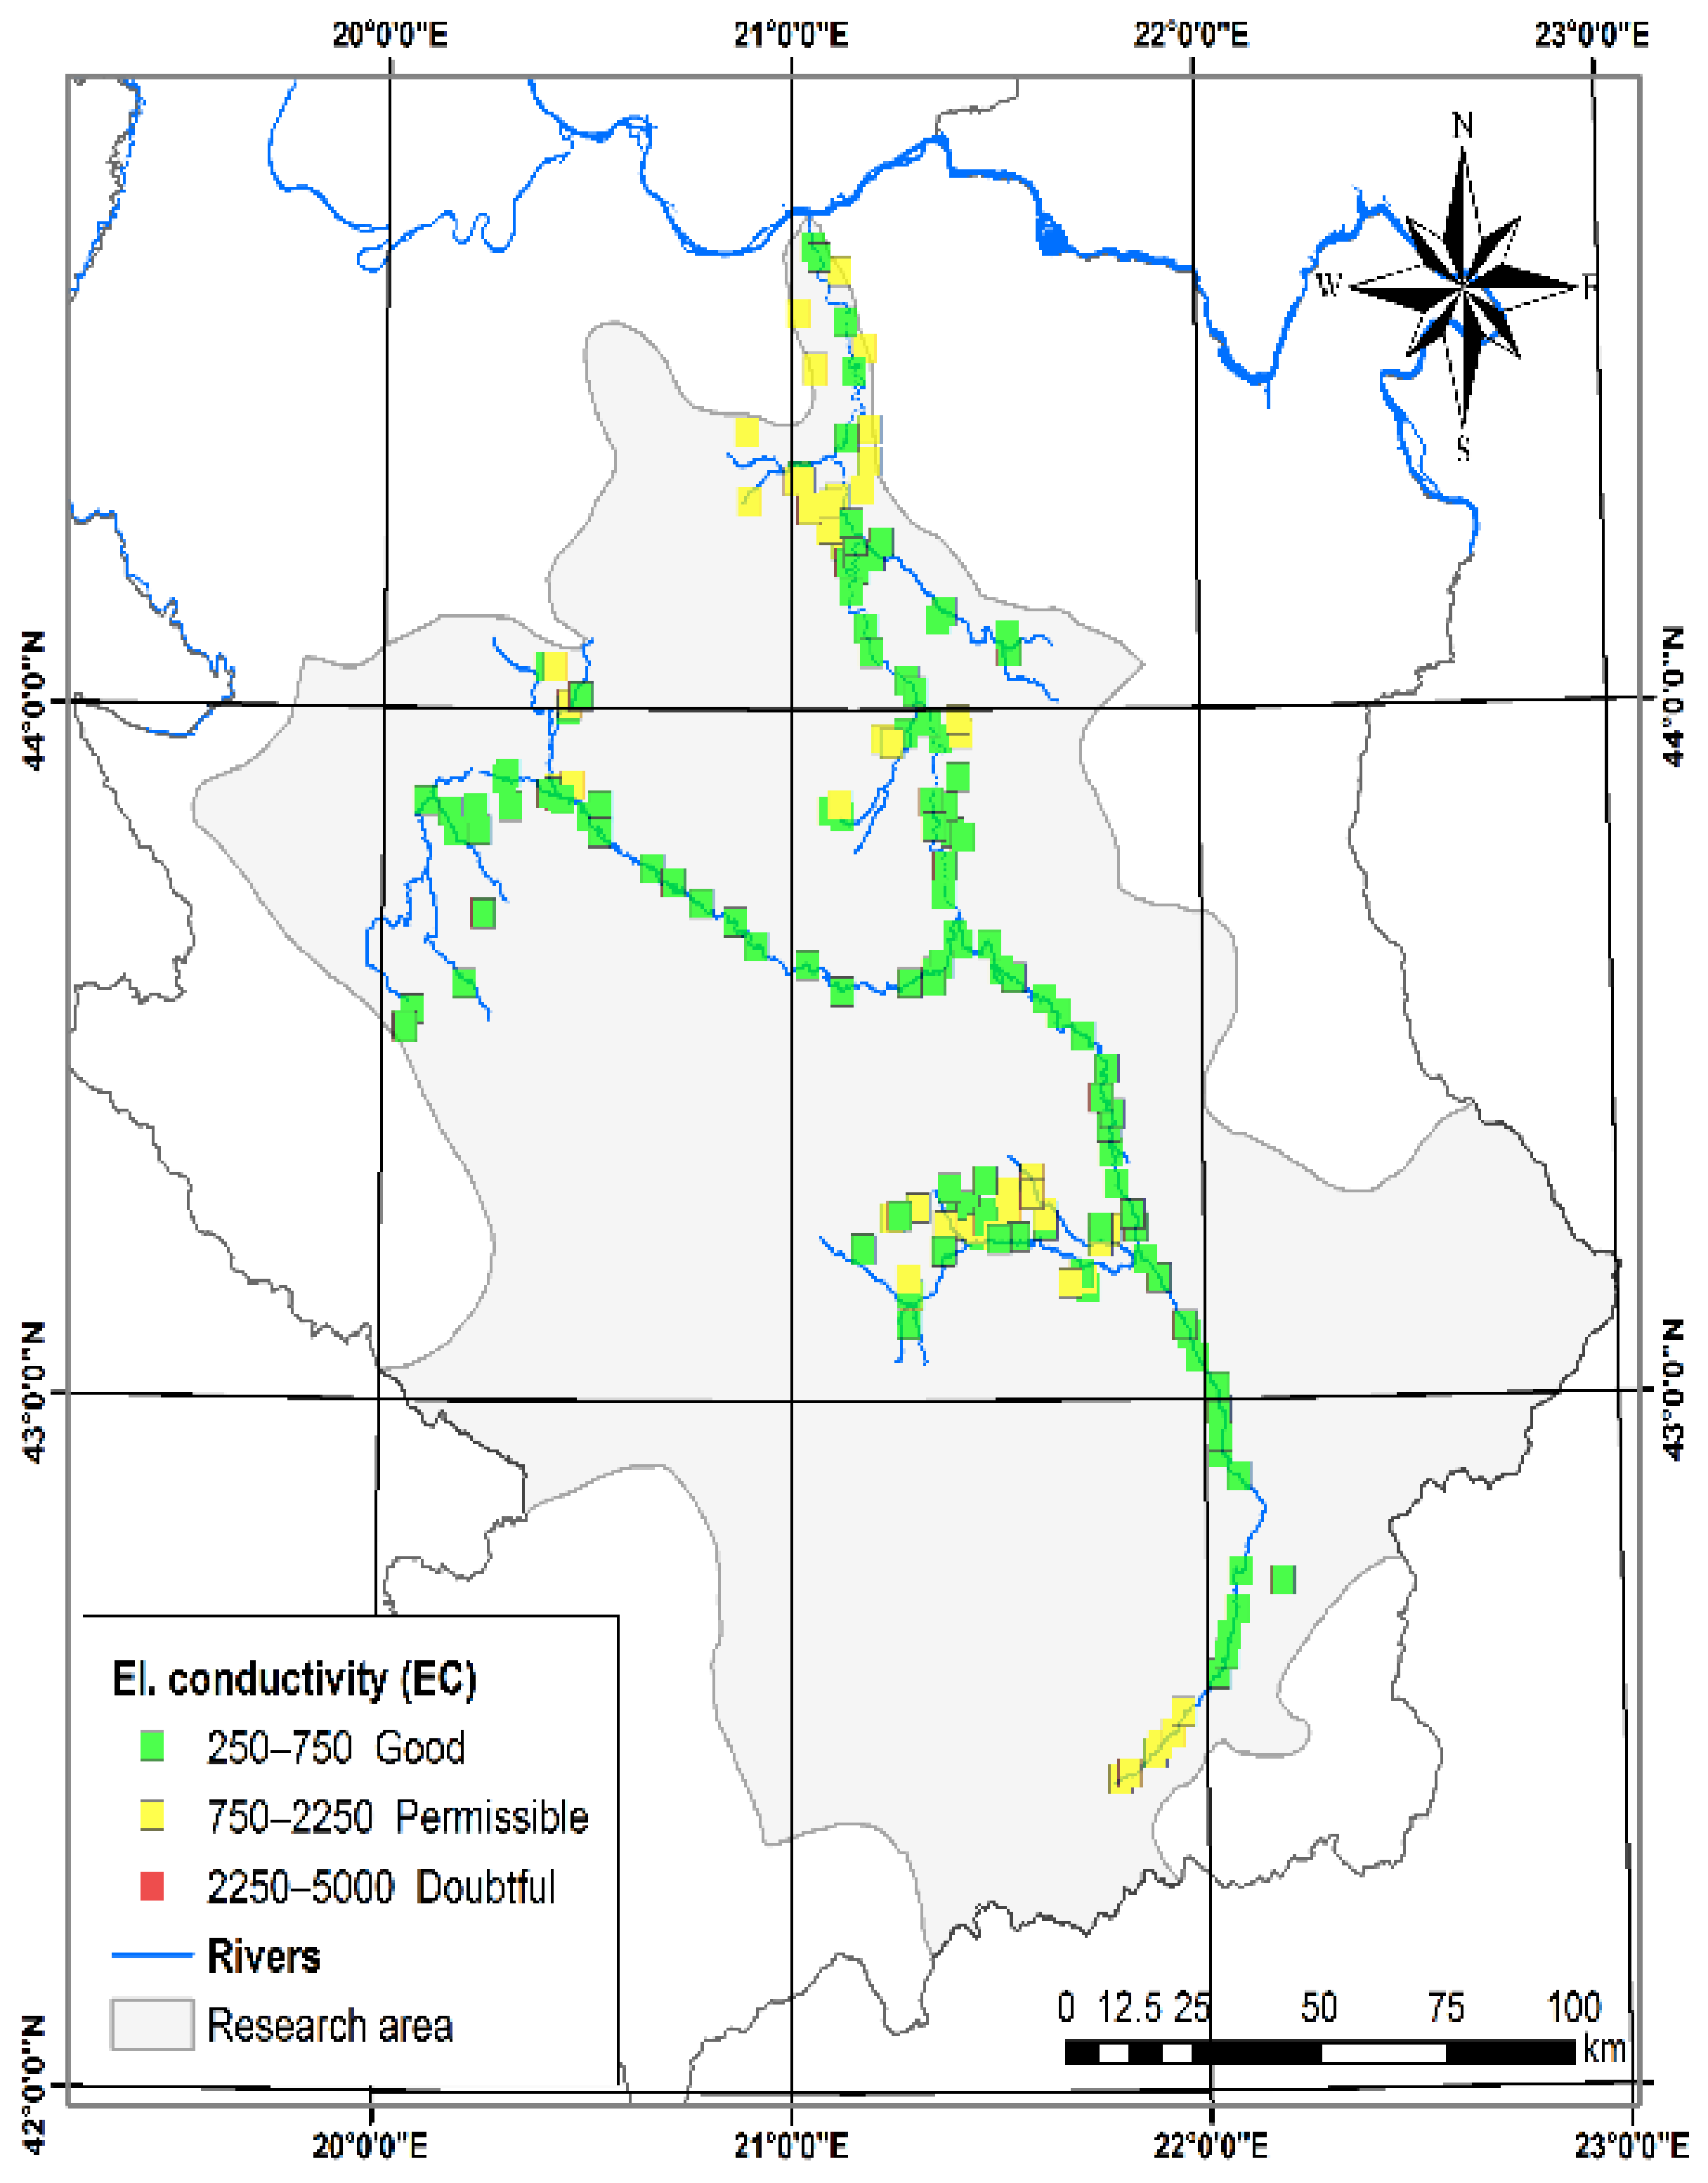
3.1.1. Electrical Conductivity (EC)

Conductivity is a measure of the ability of an aqueous solution to carry an electric current. Increasing levels of conductivity and cations are the products of decomposition and mineralization of organic materials [49]. Natural waters have values of electrical conductivity typically less than unity. Measurement of the electrical conductivity is performed at a specific temperature and it corresponds to the presence of dissolved salts. These are most often sodium chloride (table salt) and may be represented, sodium sulphate, calcium chloride, calcium sulfate, magnesium chloride, and others. Some of the large numbers of different elements dissolved in water favor the plant and their presence is useful, but sometimes these useful items can become harmful if their concentration is too high.
EC and sodium concentration are very important in the classification of irrigation water. Salts, in addition to directly affecting plant growth, also affect soil structure, permeability, and aeration, which indirectly affect plant growth [14].
The presence of a charged particle excess limits the quality of irrigation water. The EC values of the tested samples were in the range of 20–2260 µSm−1 (Table 3) and the graph is shown in Figure 4.

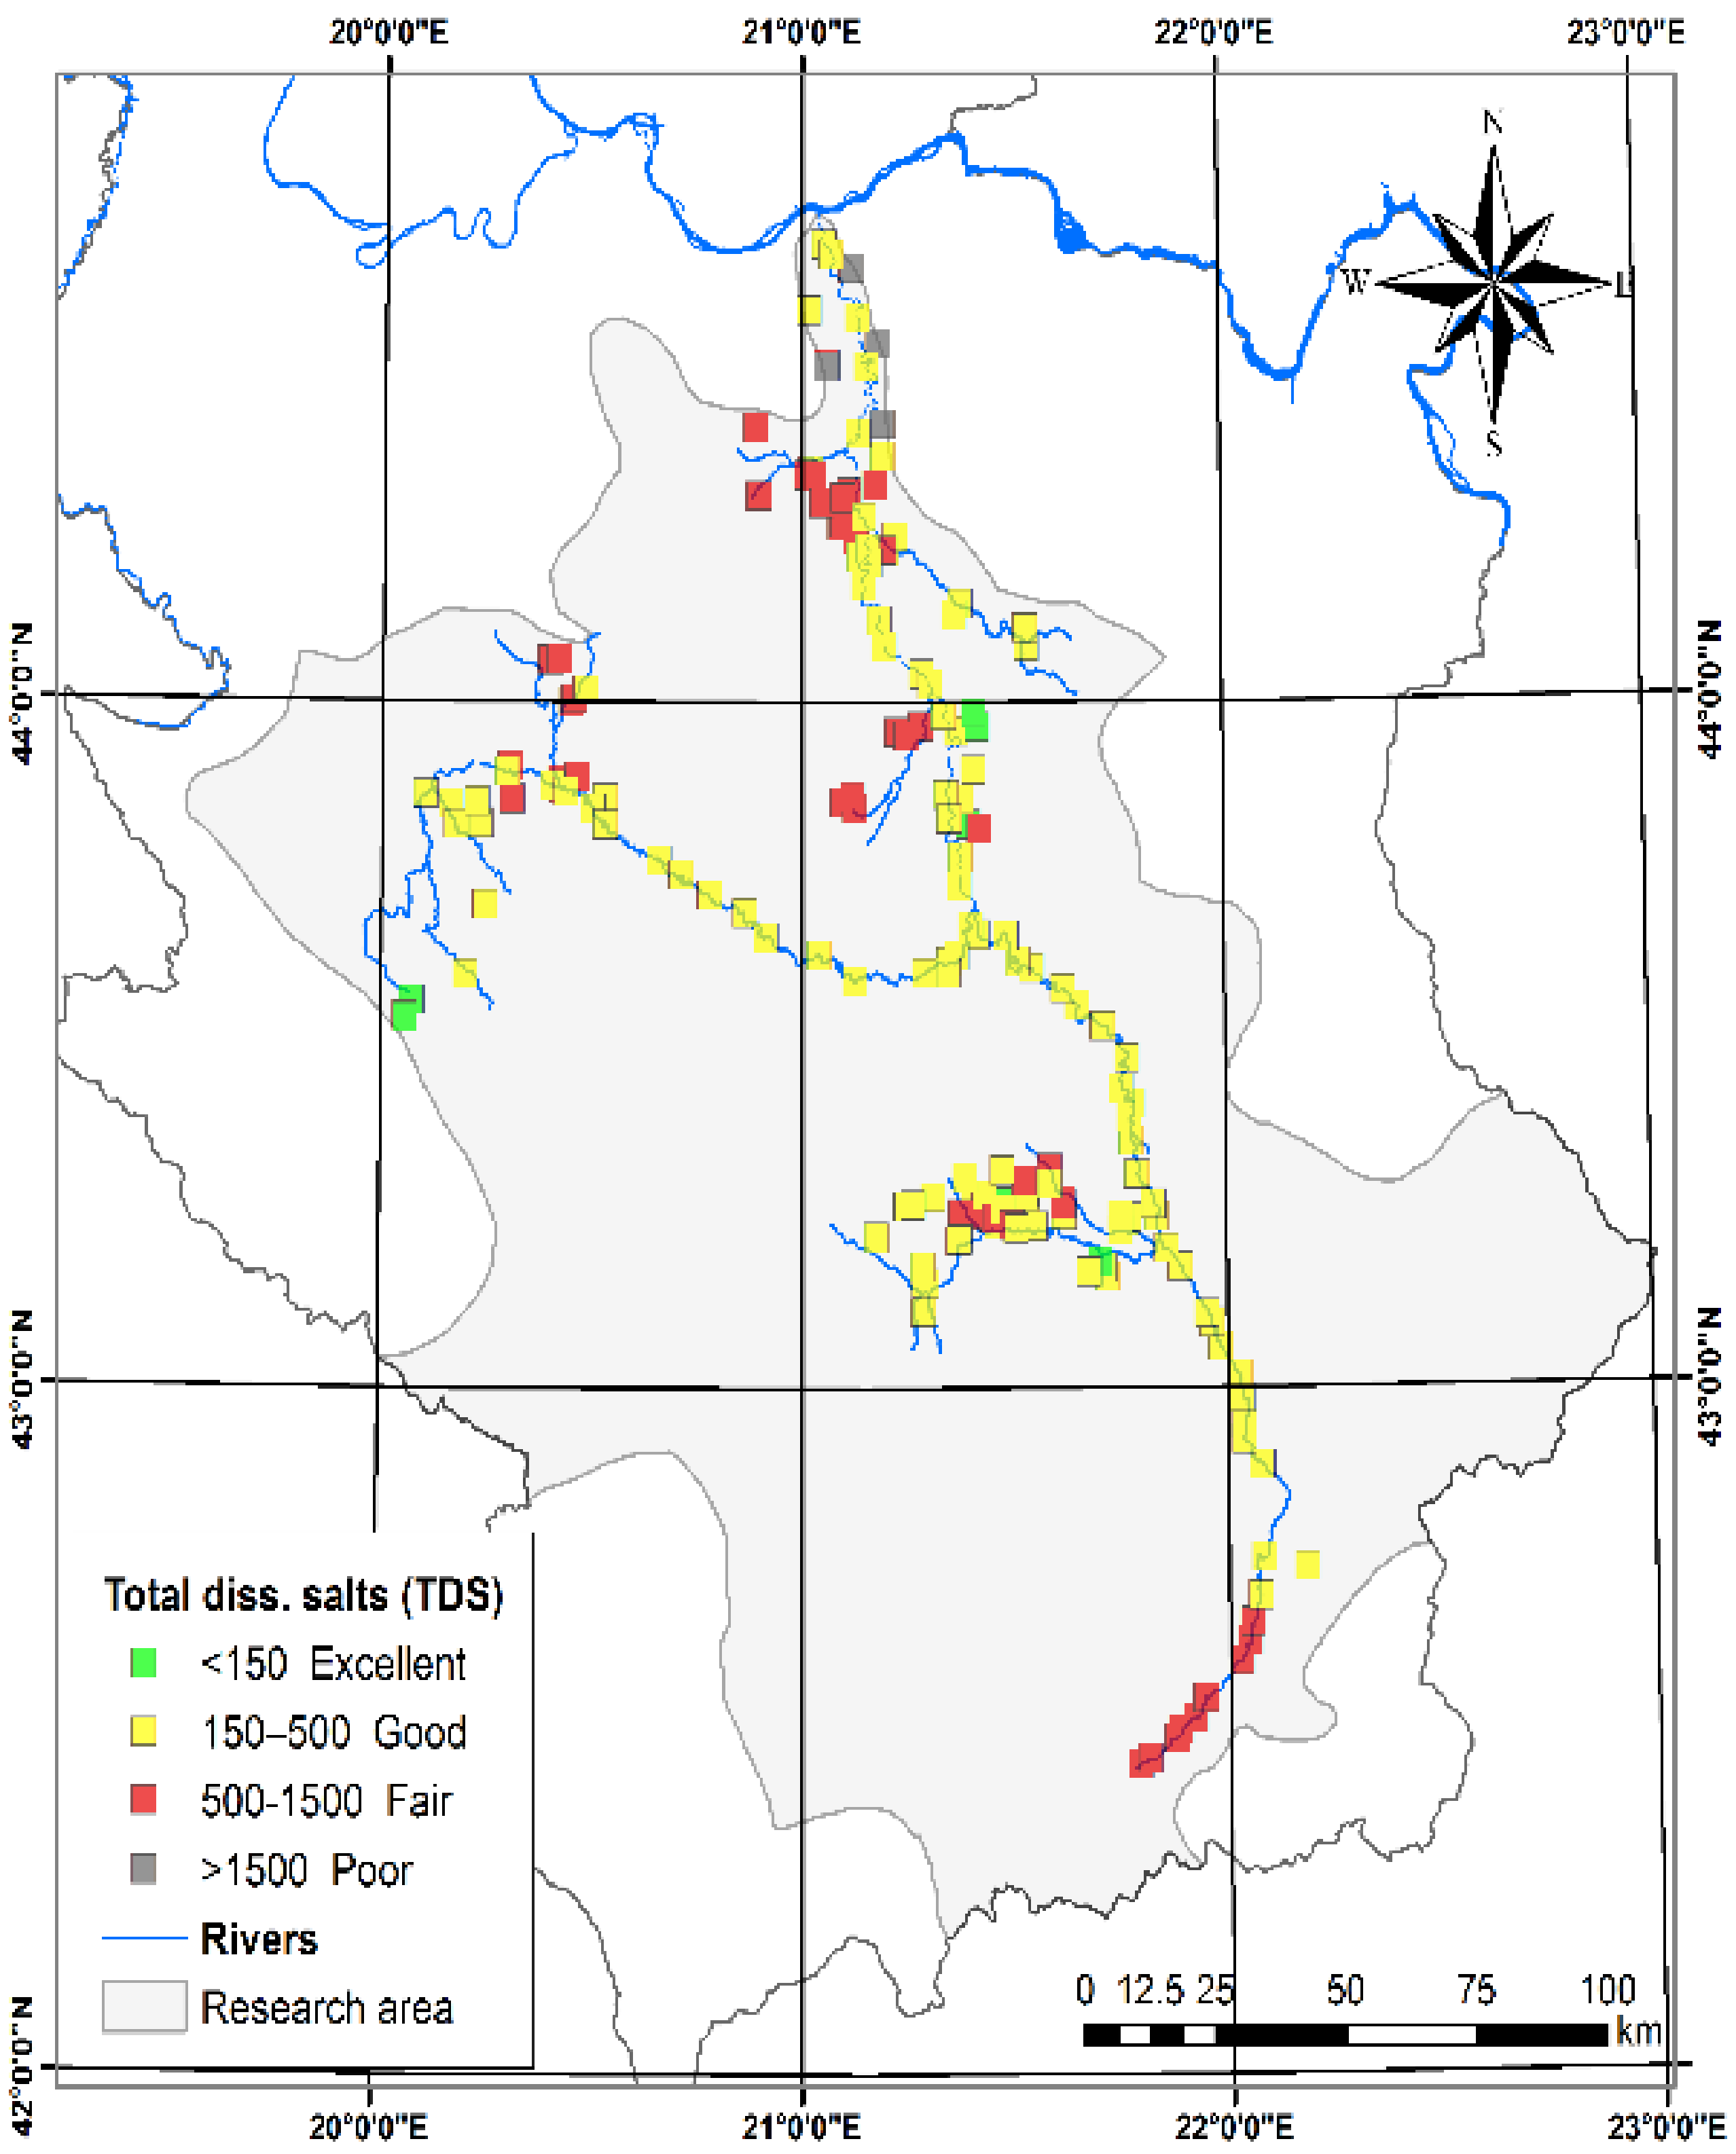
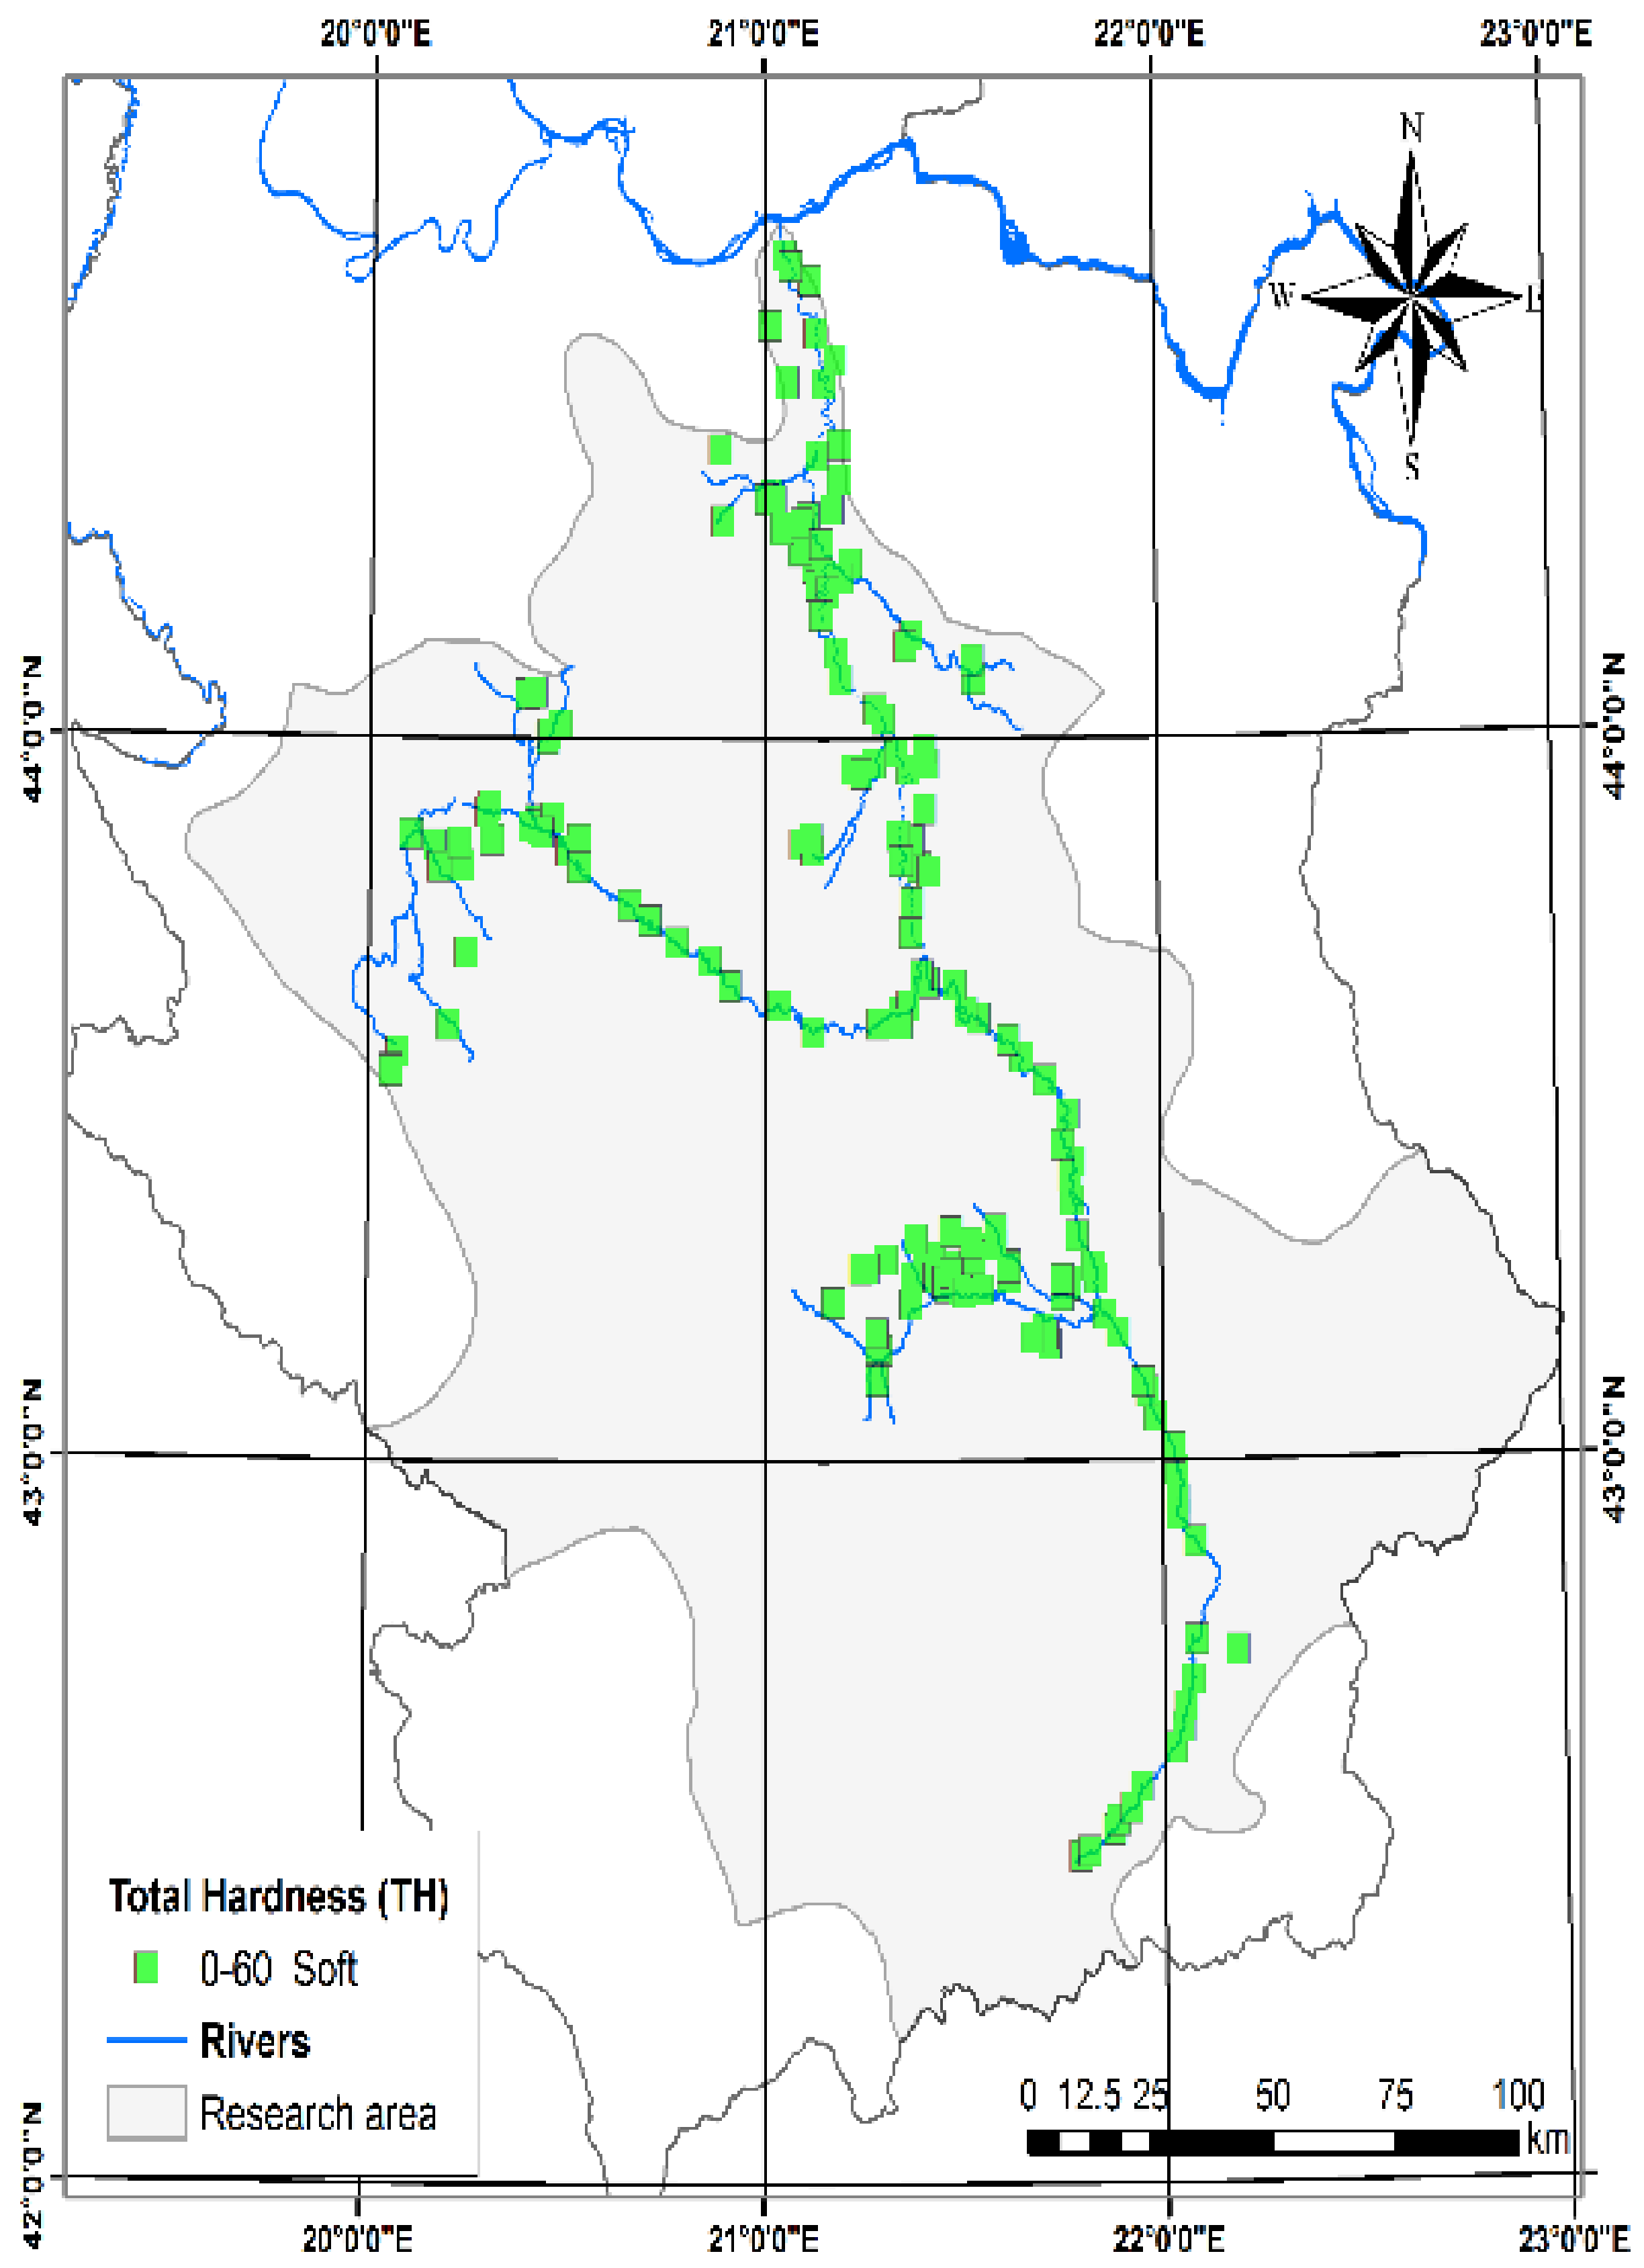
3.1.2. Total Dissolved Solids (TDS) and Total Hardness (TH)

Assessment of total dissolved solids (TDS) is very important for understanding the status of pollutants present in irrigation water. The suitability of using water with a TDS value of less than approximately 500 mg L−1 is often considered good, while a TDS level greater than approximately 1500 mg L−1 is not acceptable for irrigation [27].
In the tested irrigation water samples, the range for TDS was from 50 to 2800 mg L−1 (Table 3). Among the analyzed samples (Table 4), 3.72% of irrigation water samples were in the excellent category (TDS less than 150 mg L−1), 62.33% of samples were in the good category (TDS in the range of 150–500 mg L−1) below very low, 32.09% of the samples were in the fair category (TDS in the range 500–1500 mg L−1), and the remaining 1.86% were in the poor category (TDS > 1500 mg L−1).
The TDS zoning map (Figure 5) shows that TDS values increased from South to Northwest, which may be due to anthropogenic factors and the geological characteristics of the aquifer in the study area. Somewhat higher values were also noticeable in the Southeastern part, which can also be explained by anthropogenic and probably mining activity.
Water hardness (WH) increases due to the increase in the content of alkaline earth elements such as calcium and magnesium [50]. The presence of the minerals calcite and dolomite are the main reasons for the increase in the concentration of Ca2+ and Mg2+ in groundwater [51,52]. Classification of groundwater done by Durfor and Becker [48] based on WH is given in Table 4. All tested samples belong to the soft category. The spatial distribution of the examined parameter is shown in Figure 6.

3.1.3. Sodium Absorption Ratio (SAR)

SAR represents the relative activity of Na+ in soil cation exchange reactions and is used to estimate the degree of alkalization of irrigation water [5]. The SAR concept is used to detect the likely danger of sodium [53]. This parameter was originally proposed by Richards [27]. If the water used for irrigation has a high sodium content and a low calcium content, the cation exchange complex may become saturated with sodium. This can worsen soil structure due to the dispersion of clay particles [14].
Irrigation with water with a high SAR can lead to the formation of an impermeable layer, which leads to reduced soil permeability, internal drainage, and air circulation, or deterioration of the soil structure [54].
Irrigation with water with a high SAR can lead to the formation of an impermeable layer of irrigated soil, which leads to reduced soil permeability, internal drainage and air circulation, and deterioration of the structure [55]. SAR is calculated using Equation (2).
The SAR values of the sampled irrigation water in the study area varied between 0.01 and 10.34 meq L−1 (Table 3). The obtained SAR values showed that all tested samples of irrigation water, except one, were of the excellent class, and one sample of the good class (Table 4.). The spatial distribution of SAR values of the tested irrigation water samples is shown in Figure 7.

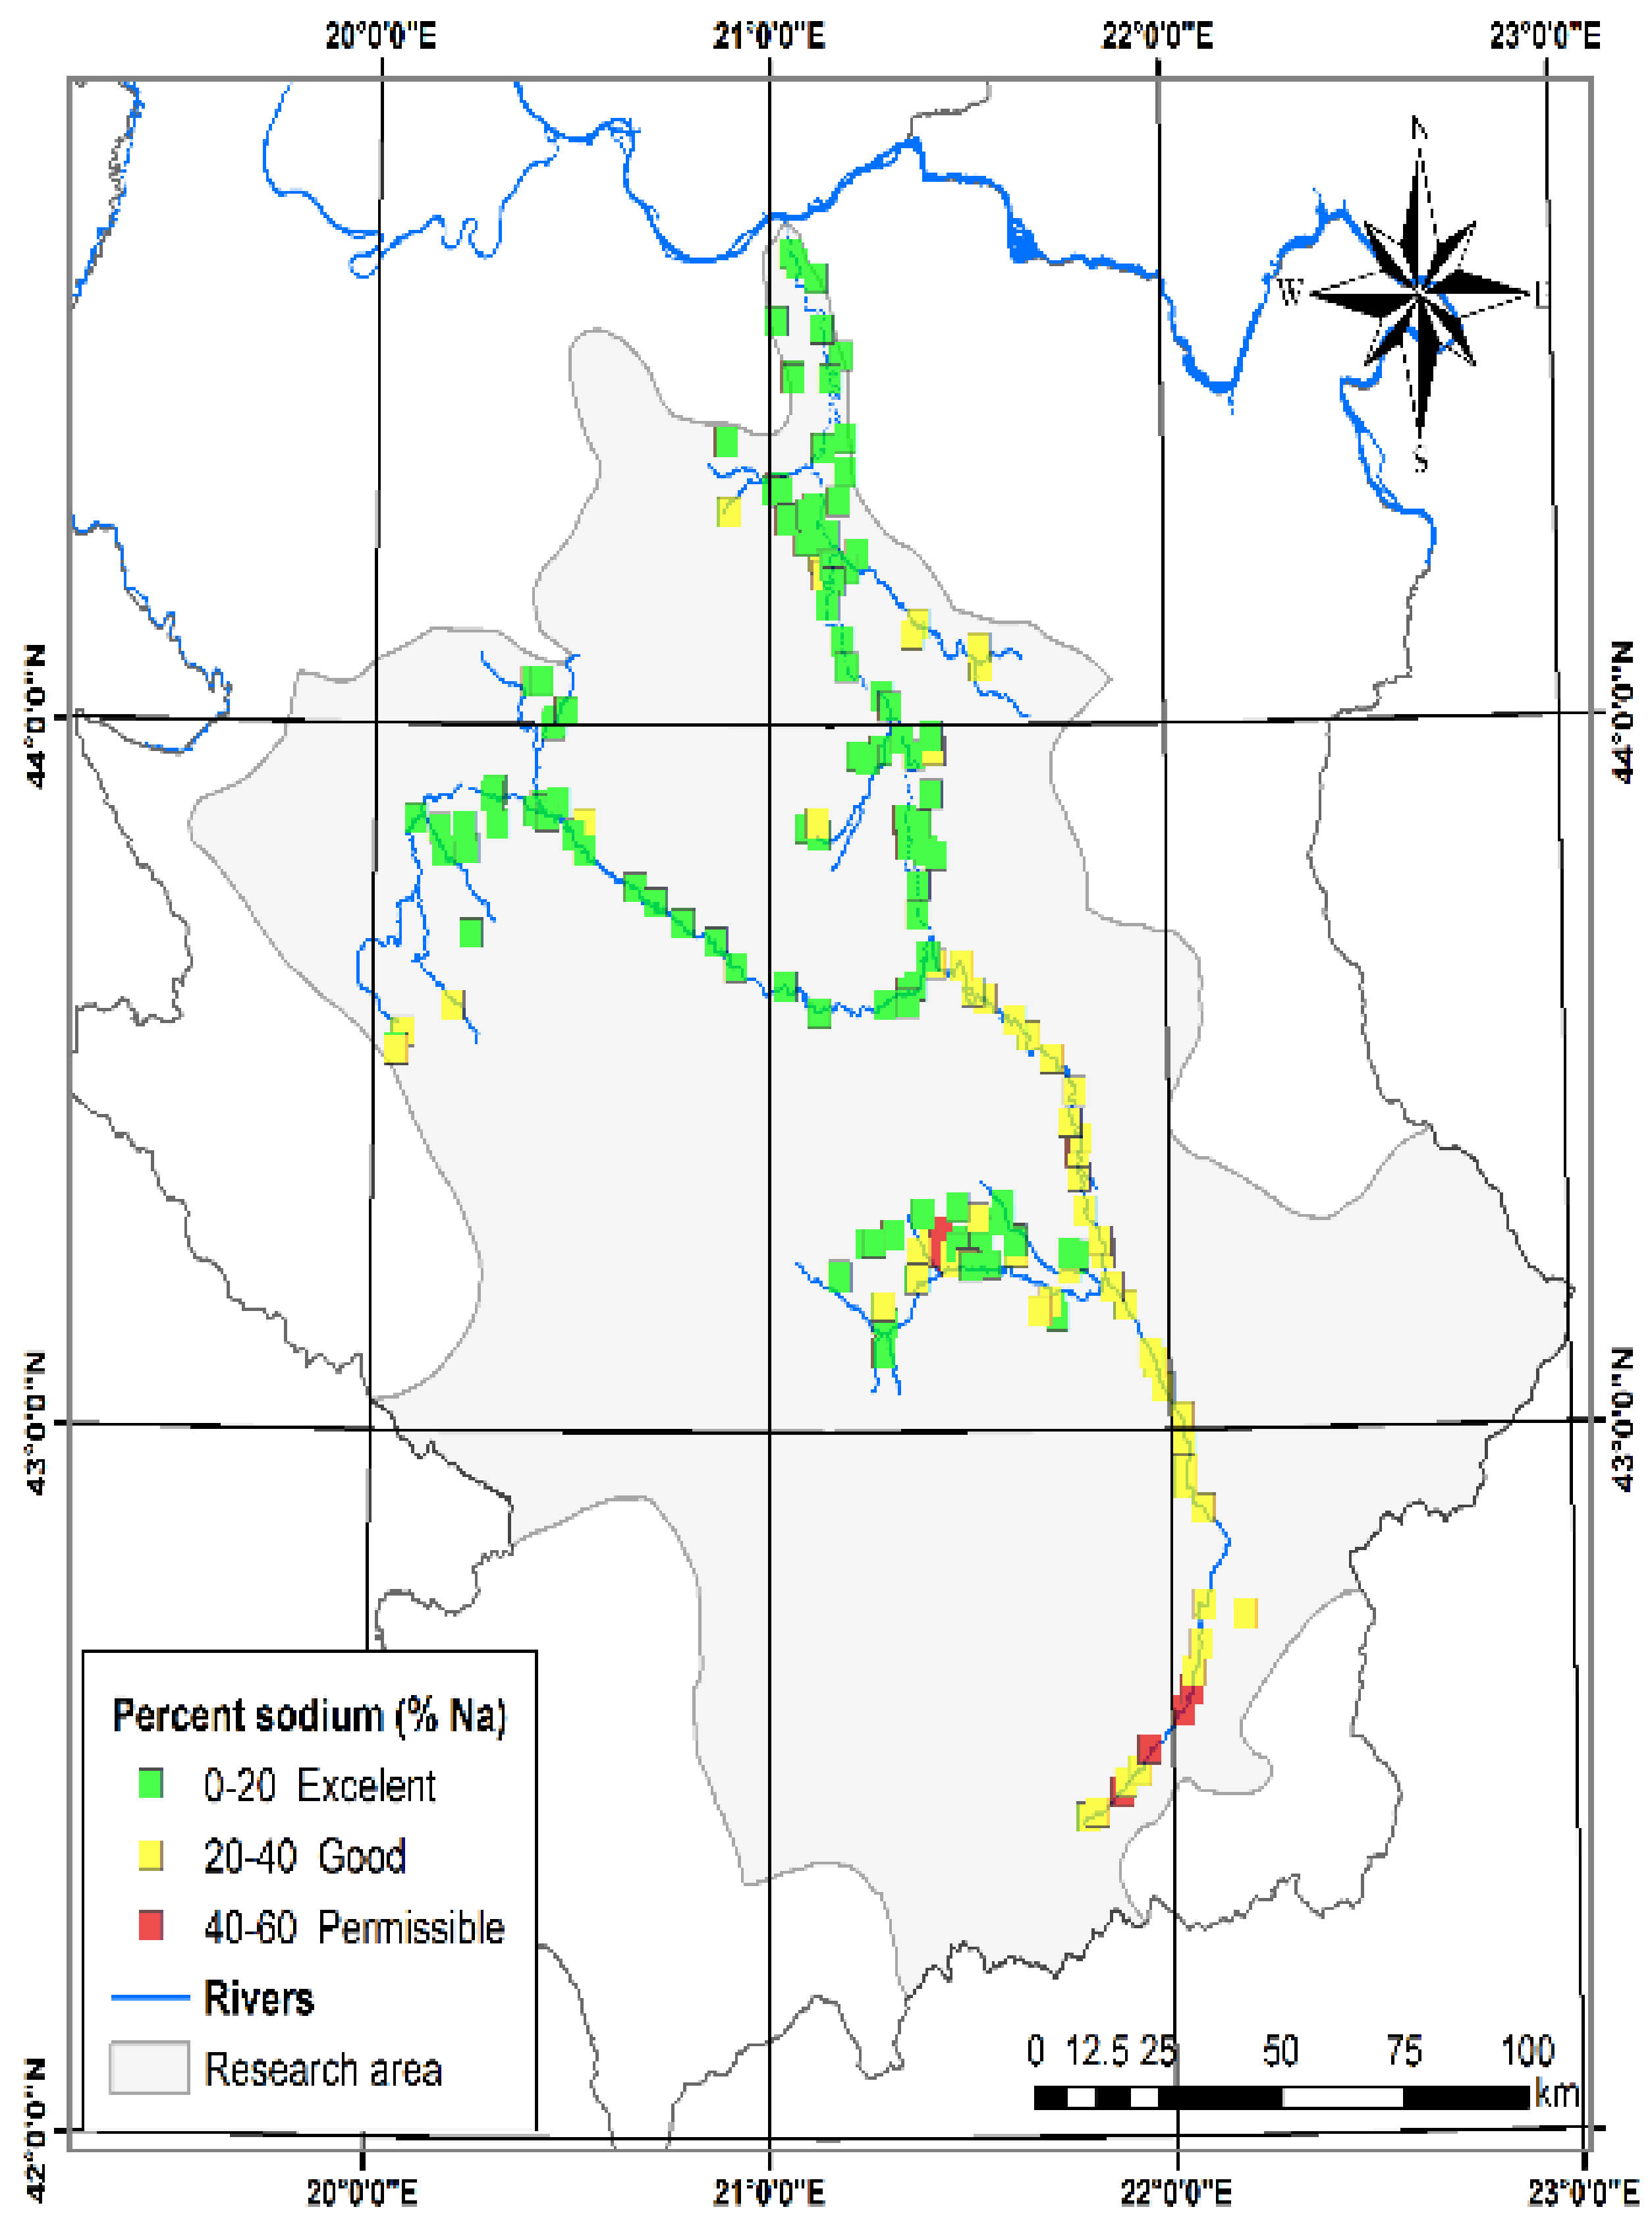
3.1.4. Sodium Hazard (Na %)

For the assessment of the irrigation water quality, the percentage of sodium is one of the most important indicators. An excess of sodium with carbonate ions will help turn the soil into alkaline soil, in contrast, sodium mixed with chloride ions will accelerate the formation of saline soil, which ultimately worsens the infiltration capacity of the soil and reduces plant growth [56,57]. The percentage of sodium (%Na) is often used as a parameter to assess the suitability of irrigation water quality [28]. As a result of its reactivity with soil, sodium is considered an important ion for the classification of irrigation water and, if it occurs in excess, reduces the water permeability of the soil [58,59].
The Na % is determined by calculating the relative proportion of all cations available in water using the Equation (3) [28]:
The value of the specified parameter should not exceed 60% in irrigation waters. Table 3 shows that Na % in samples of water for irrigation in the study area ranged from 0.49 to 51.89%, with an average of 18.79%. One hundred and thirty-six samples, i.e., 63.26%, belonged to the class of excellent for irrigation, 72 samples (33.49%) to the class of good for irrigation, and seven samples (3.26%) to the class of permissible for irrigation. The analytical results were plotted on a Wilcox diagram (Figure 8). It shows the relationship between salinity hazards (expressed using EC values in μS cm−1) and the sodium content in the water (expressed as % Na) [60] and is used to classify irrigation water samples. The spatial distribution of Na % content is shown in Figure 9.

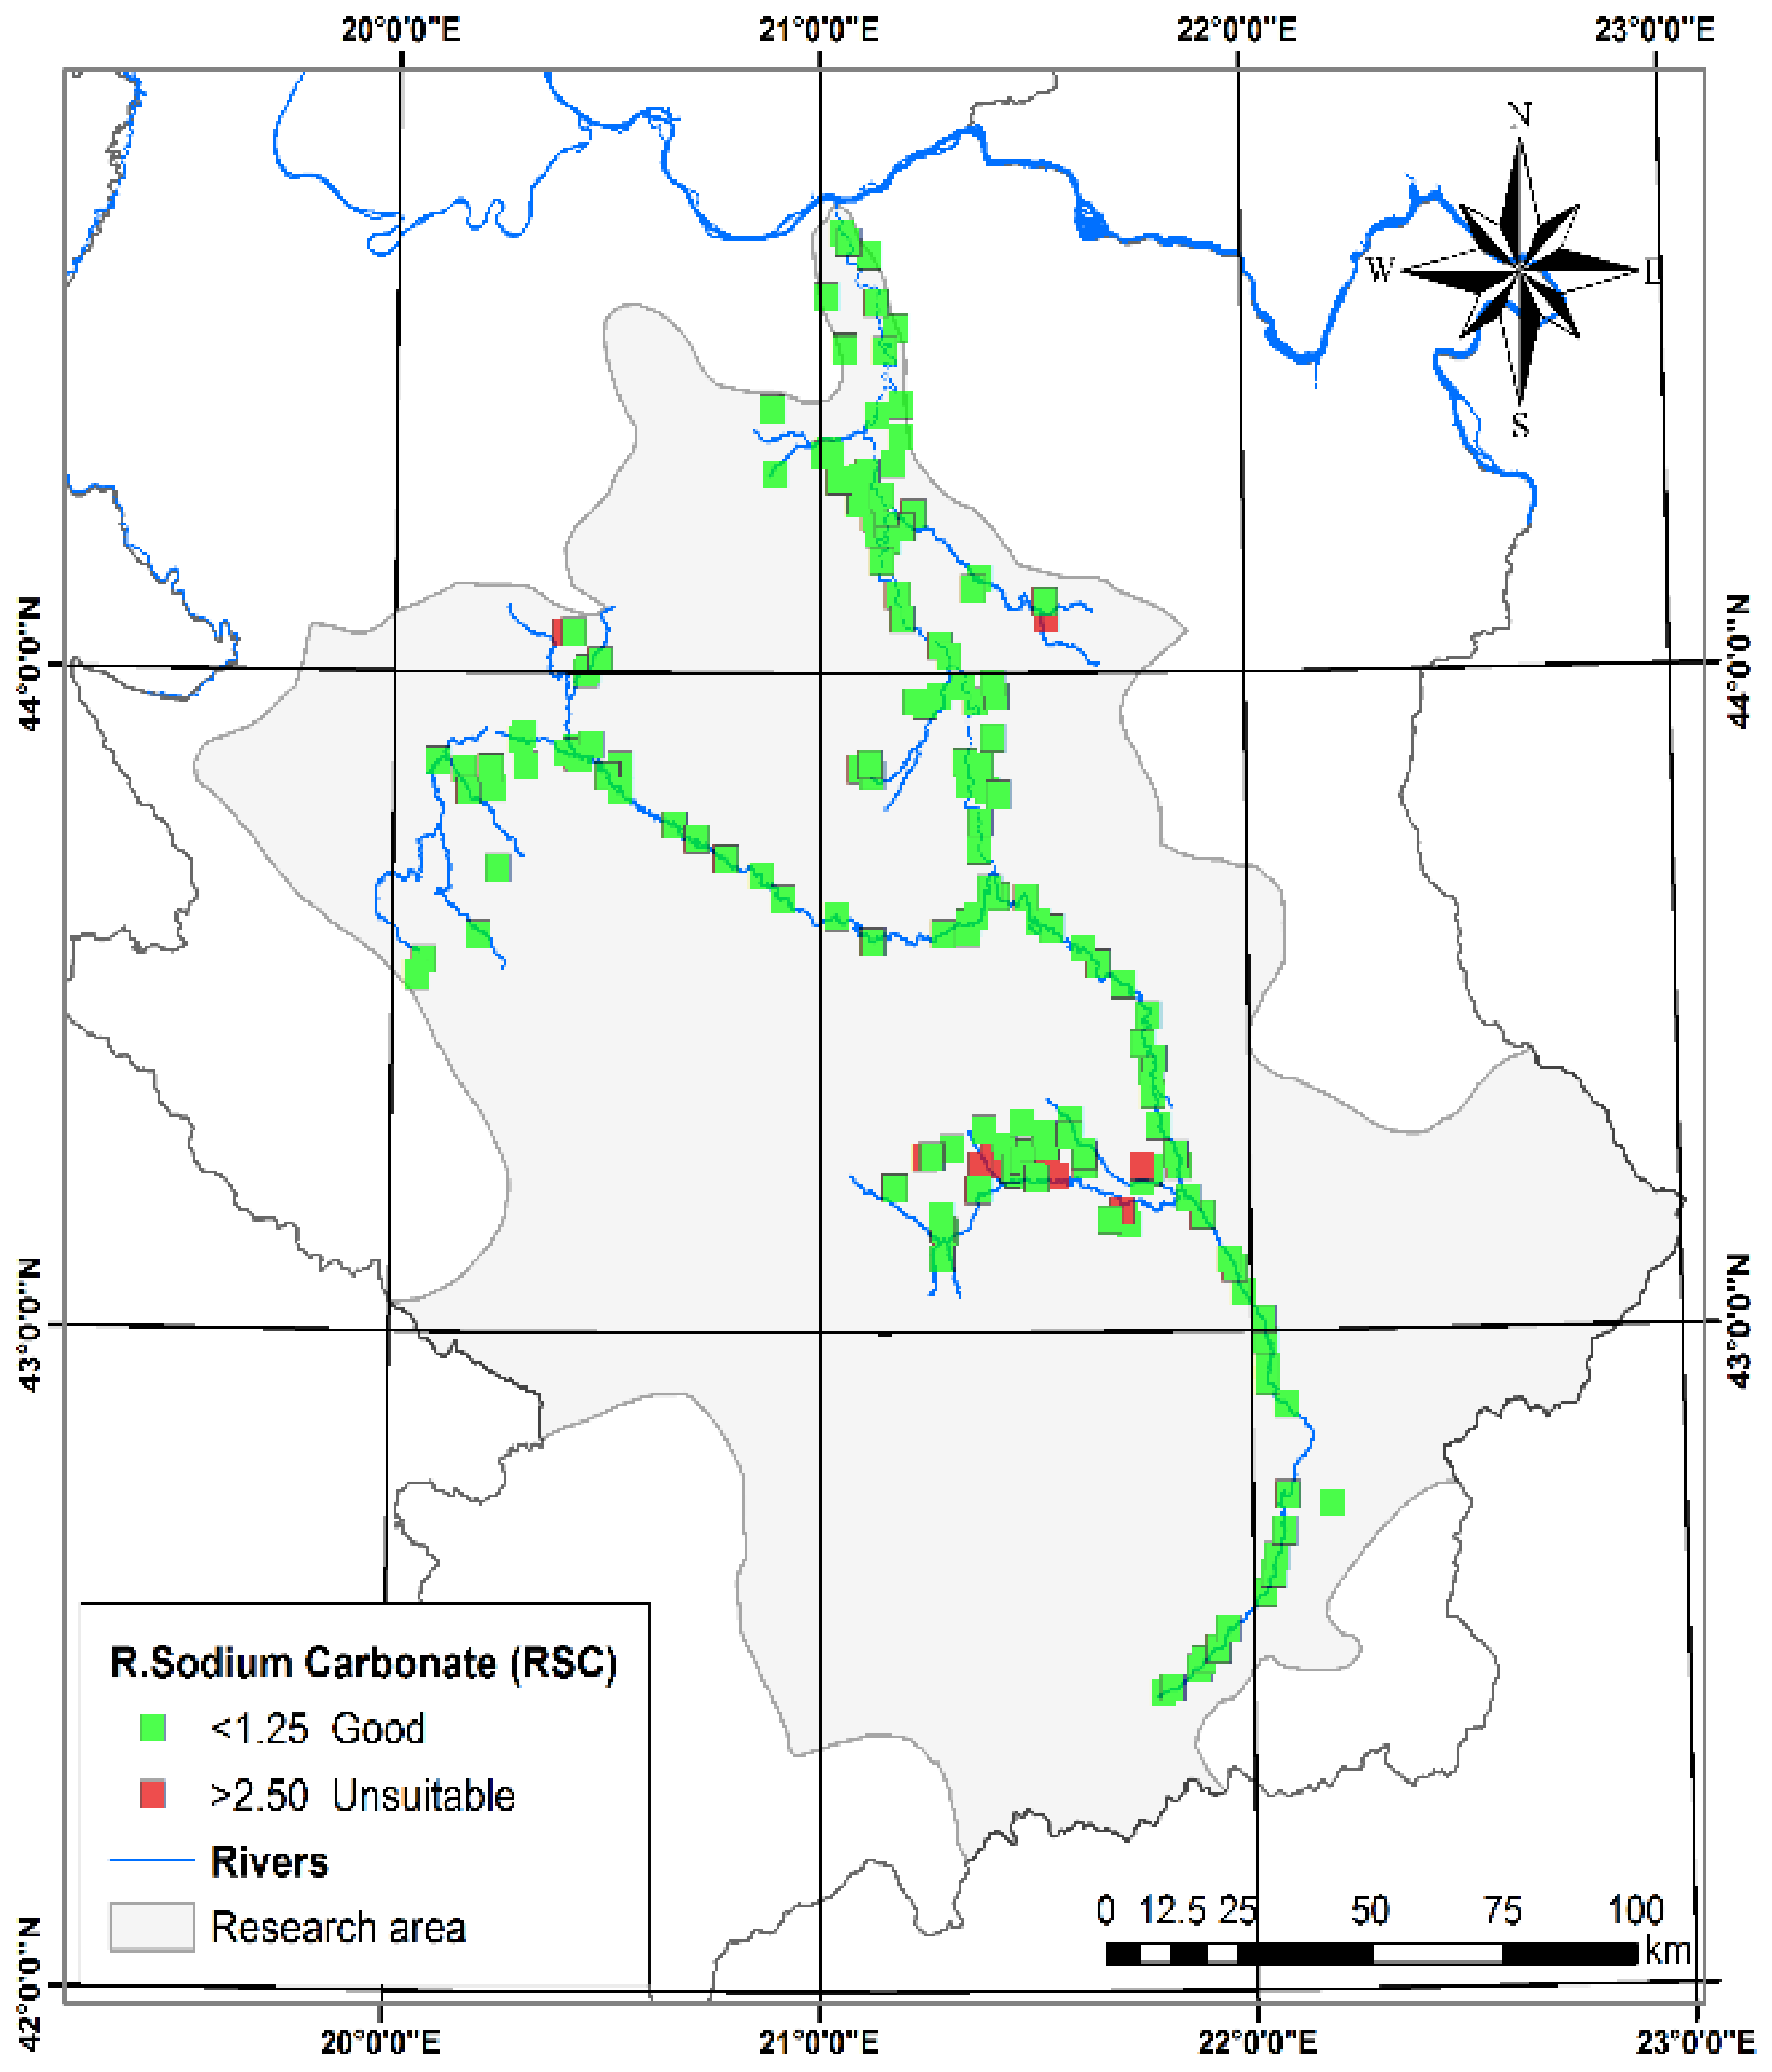
3.1.5. Residual Sodium Carbonate (RSC)

Bicarbonate is an important component for assessing the quality of irrigation water [44]. By measuring the difference between the sum of carbonates and bicarbonates and the sum of calcium and magnesium, the residual sodium carbonate (RSC) value, proposed by Eaton [61], is determined to assess the impact of the danger of using irrigation water that is an alkaline reaction.
Soils irrigated with water of the stated quality, with high RSC, may lose their productive capacity because of structural deterioration due to the deposition of sodium carbonate [44]. Singraja [62] states that increased alkalinity can affect the decomposition of soil organic matter, which is also one of the negative consequences of using water for irrigation that is of inadequate quality.
The RSC index is often used to assess the suitability of water for irrigation in clayey soils that have a high cation exchange capacity. The presence of a higher amount of dissolved sodium compared to dissolved calcium and magnesium in irrigation water leads to the swelling of clayey soils or dispersion, which can lead to a drastic reduction in its infiltration capacity. The value of the specified parameter is determined by Equation (4).
According to RSC, groundwater is suitable for irrigation if RSC < 1.25, is marginal if it is higher than 1.25 but lower than 2.50, and is unsuitable if it exceeds 2.50 [20,63].
Residual sodium carbonate is classified into three categories: good, medium, and bad (Table 4). Of the examined samples, 91.63% belonged to the class of waters with an RSC value of less than 1.25. Those waters are generally safe for irrigation, and 8.37% belonged to the group whose value was higher than 2.5, i.e., generally not suitable for irrigation without improvement. The spatial distribution of a particular RSC is shown in Figure 10.

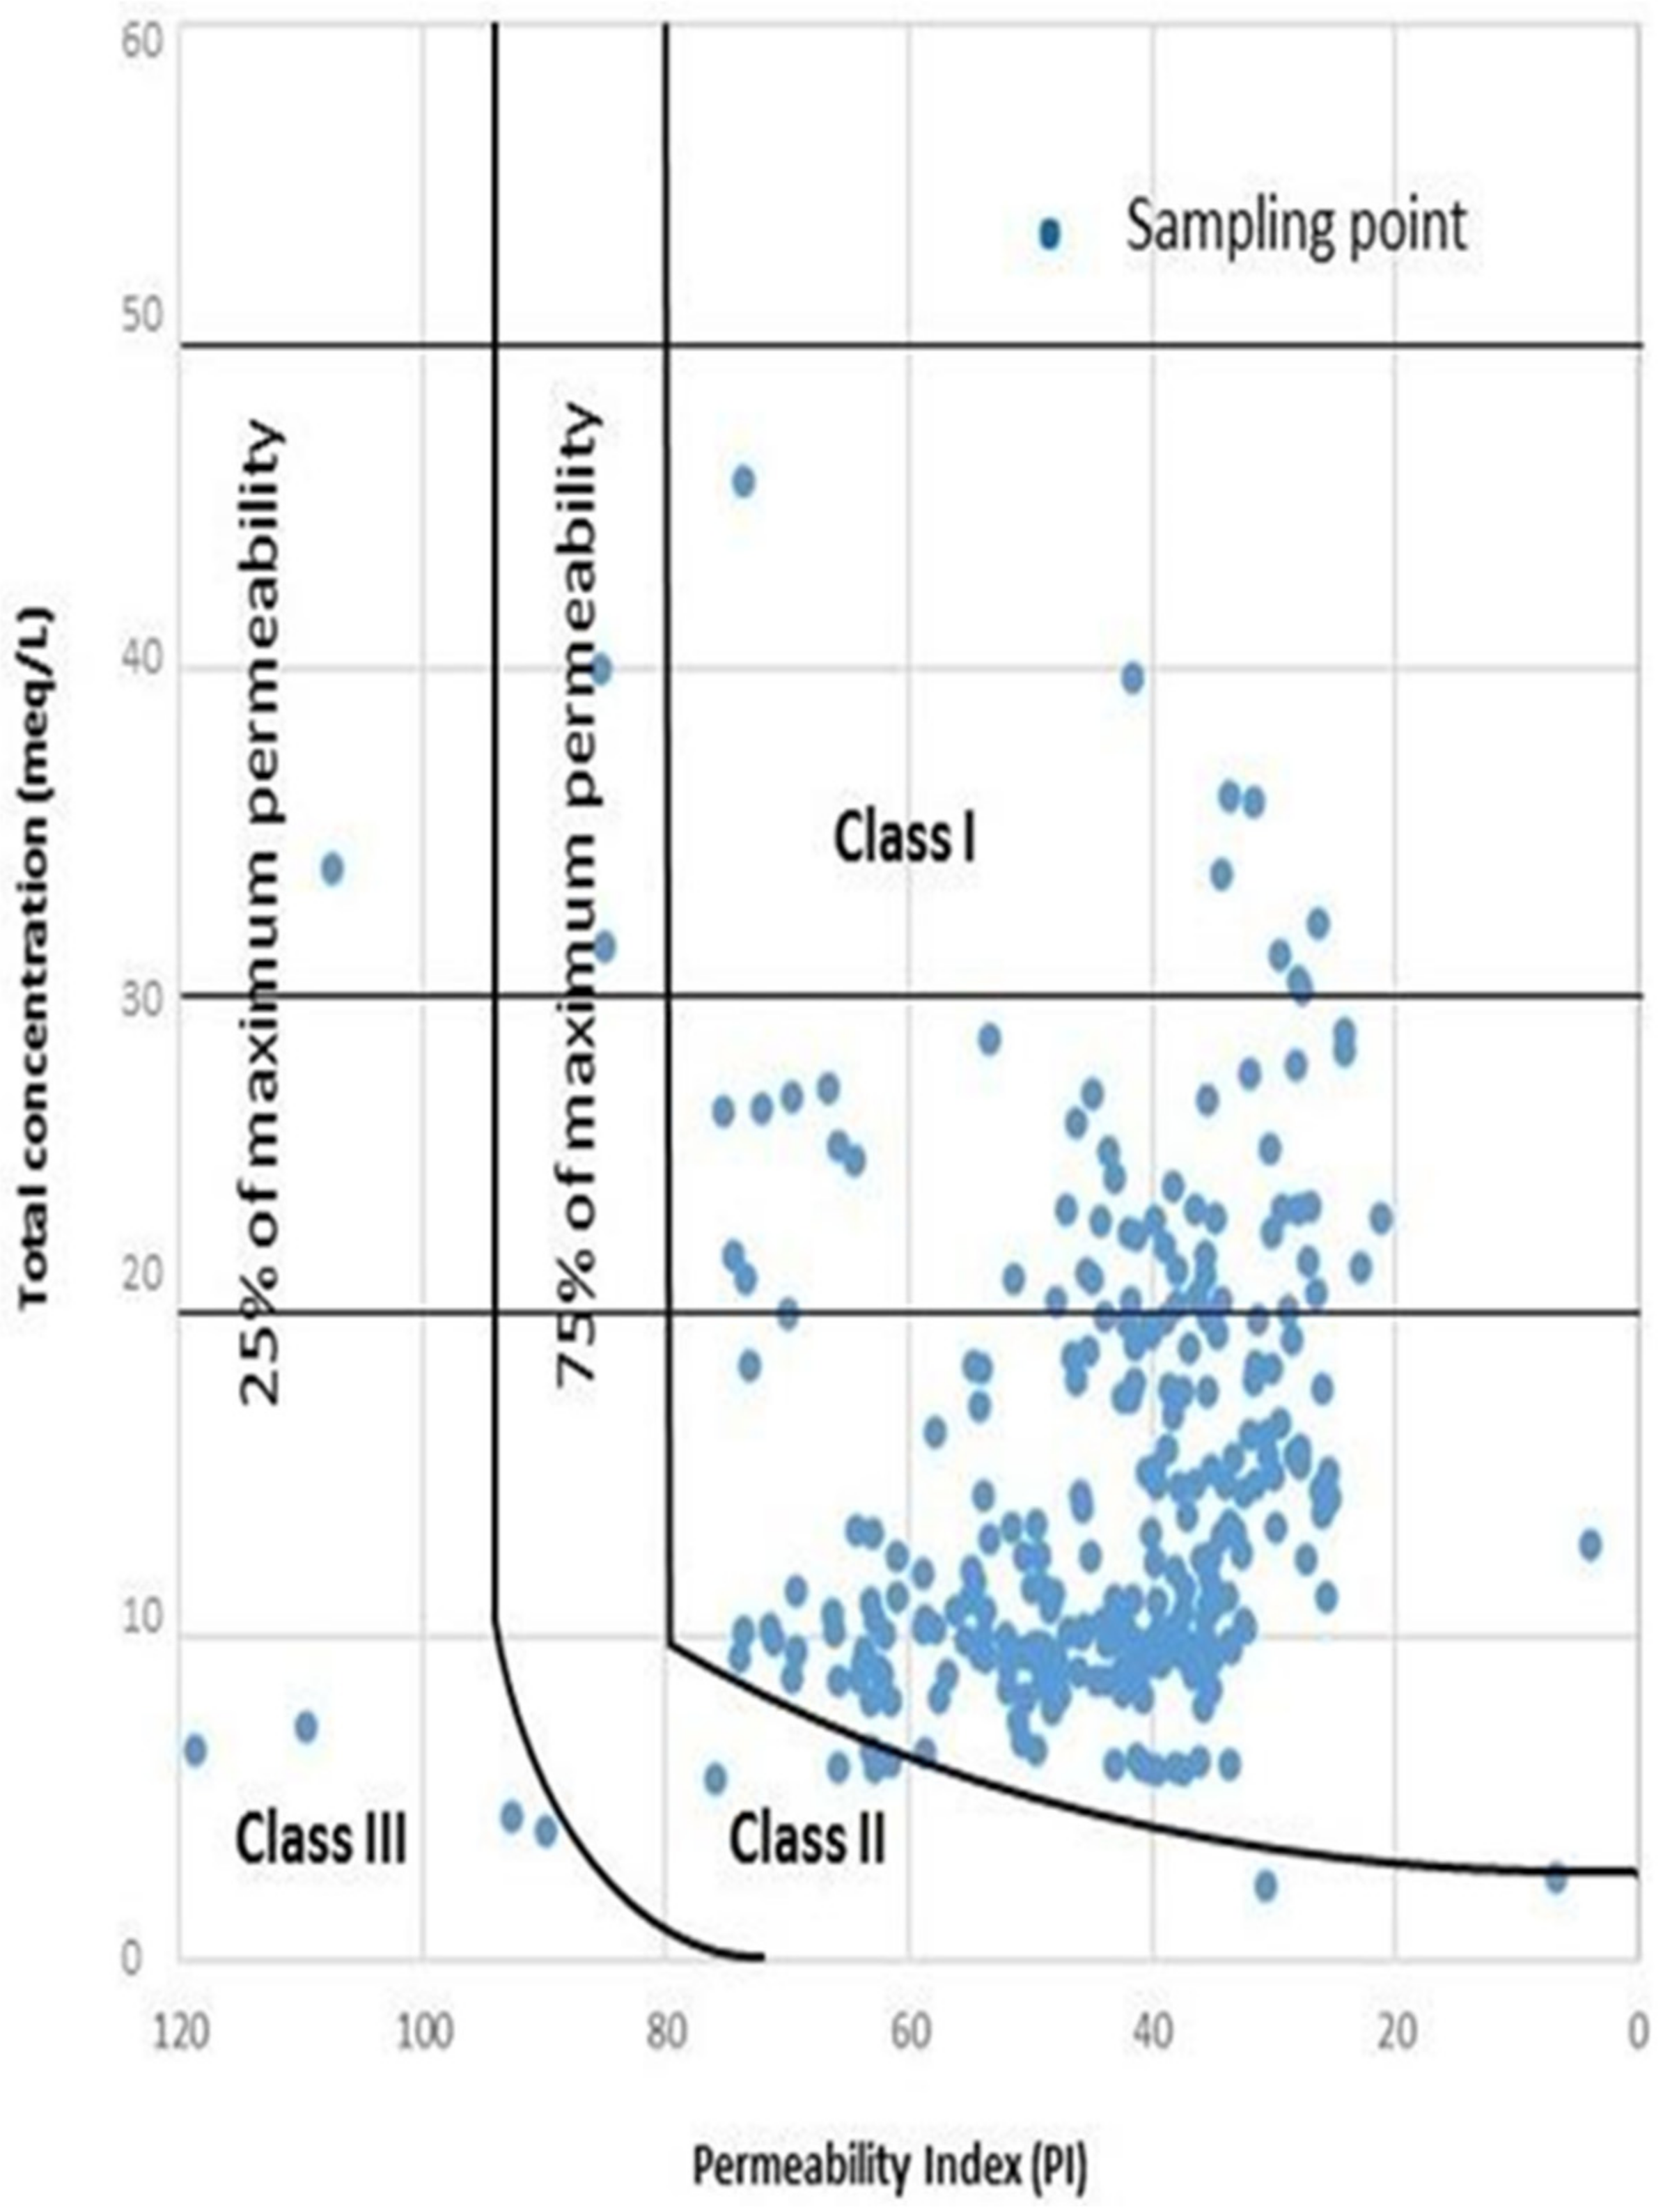
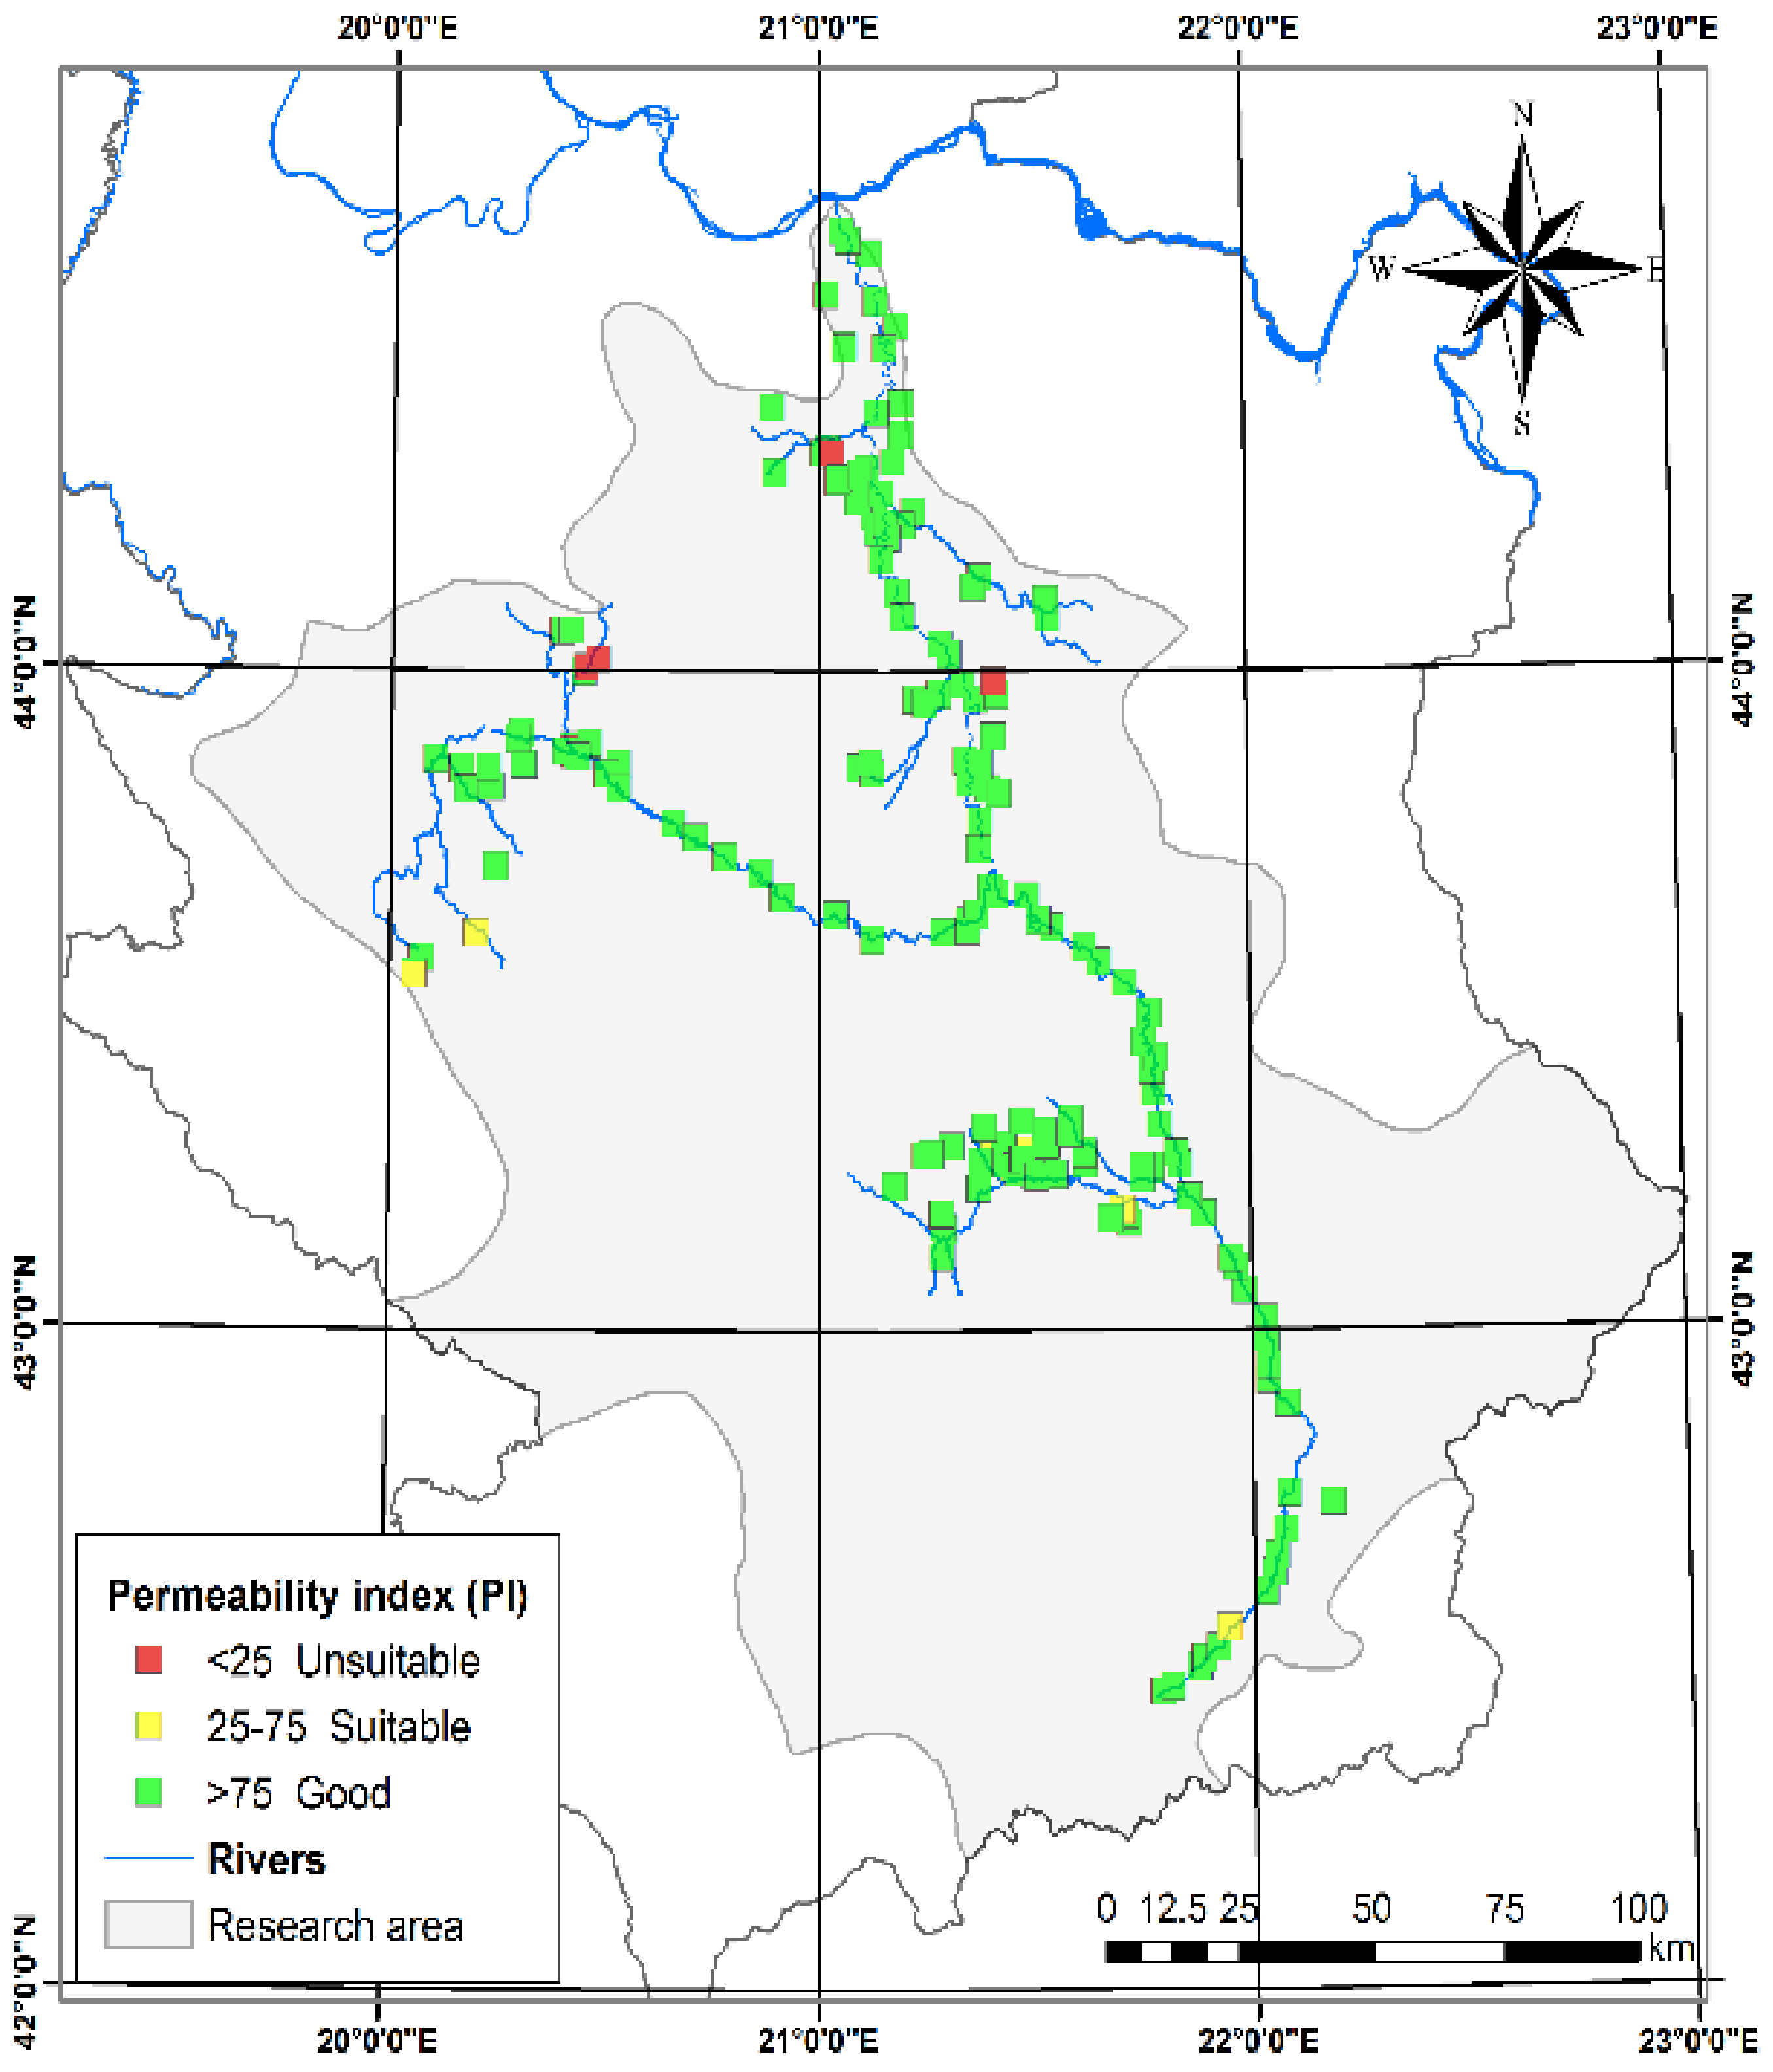
3.1.6. Permeability Index (PI) and Doneen Diagram

The permeability index (PI) is one of the indicators of water suitability for irrigation and indicates problems of water permeability of soil that is flooded for a long time with water with high salt concentration [64]. It links the concentration of sodium, calcium, magnesium, and bicarbonate ions with the effect on soil permeability [65]. Prolonged irrigation with poor quality water can affect soil permeability [66]. To quantify the impact of long-term irrigation on soil quality, Doneen [29] proposed a criterion for assessing the suitability of water for irrigation based on the PI index determined by Equation (5)
Figure 11 presents a graph by which Doneen [29] presented the divisions of irrigation water quality based on the PI index. Class I and Class II waters are categorized as “good” and “suitable” with their higher maximum permeability [67].
Based on the graphic classification of Doneen, this index determined the suitability of water for irrigation and categorized water as class I (PI > 75%), class II (25% < PI < 75%), and class III (PI < 25%) [49]. As shown in Table 4 and Figure 11, 201 samples (93.49%) were of excellent quality for PI-based irrigation and would not affect soil permeability; nine water samples were acceptable (4.19%); five water samples were unsuitable for irrigation, representing 2.33% of the total water samples.
The spatial distribution of the specific PI index of the tested irrigation water samples is shown in Figure 12.

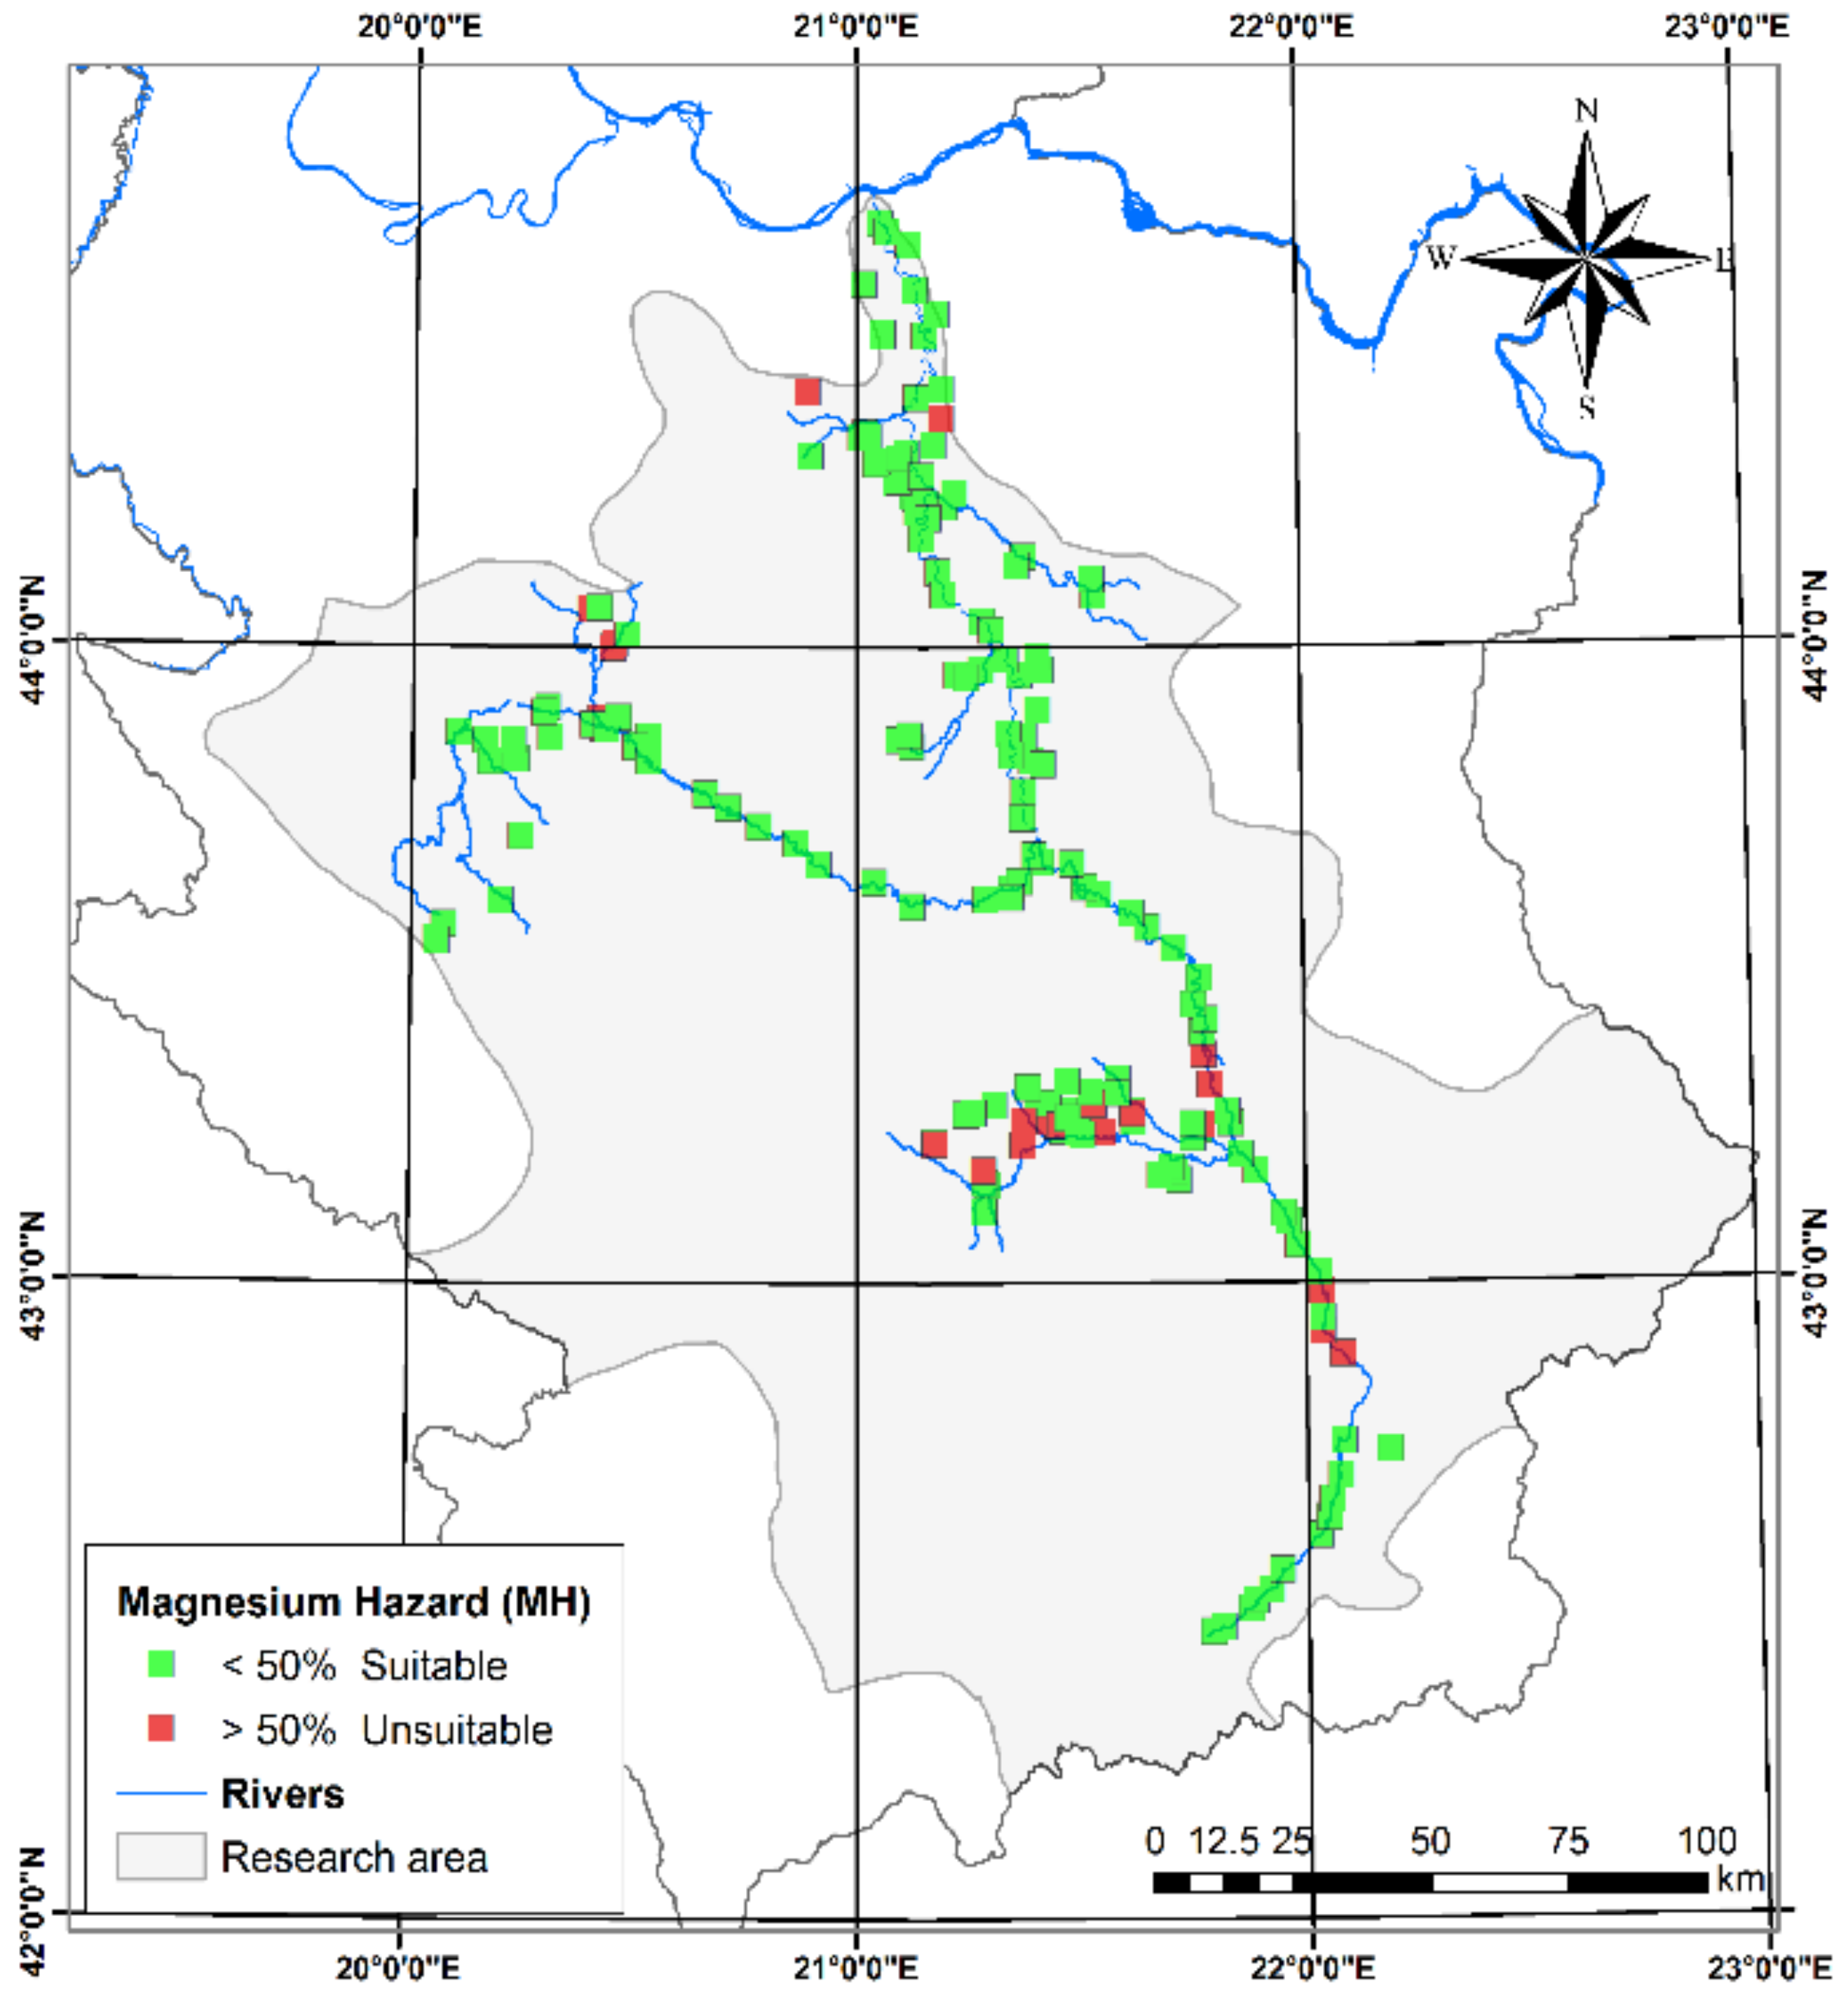
3.1.7. Magnesium Hazard (MH)

Szabolcs and Darab [68] proposed an assessment of the dangers of increased magnesium content as one of the indicators of the suitability of irrigation water.
For irrigation, the magnesium content also plays an important role, because the extreme magnesium content is a source of harmful effects on the soil. The risk of excess Mg2+ in water can be estimated by the ratio of magnesium (MH) and is calculated using Equation (6).
Water with a high content of magnesium often affects the properties of the soil on which it is applied, because with increased alkalinity there is a decrease in crop yield [46]. Carbonate and bicarbonate ions are responsible for high pH values since these anions are the main component affecting alkalinity [69]. Some 85.12% of the tested irrigation water samples corresponded to the suitable class, while 14.88% belonged to the non-compliant unsuitable class of irrigation water (Table 4). The spatial distribution of a certain MH index of tested irrigation water samples is shown in Figure 13.

3.1.8. Kelley Index (KI)

The Kelley index (KI) [70] is used to determine the suitability of water for irrigation. The levels of Na, Ca, and Mg in water are used to calculate the value of KI, using Equation (2) [46,70]. Increased concentrations of Na, Ca, and Mg in water pose an alkaline hazard [71]. KI values lower than one (KI < 1) indicate that excess sodium has been found in water [47,70,72]. The obtained KI values of the tested samples of irrigation water varied between 0.004 and 4.416 meq L−1 (Table 4). According to the obtained KI values, 93.95% of the irrigation water samples belonged to the “suitable” class, and 6.05% are categorized as “unsuitable”. The Kelley index was calculated using Equation (7).
The spatial distribution of a certain KI index of tested irrigation water samples is shown in Figure 14.

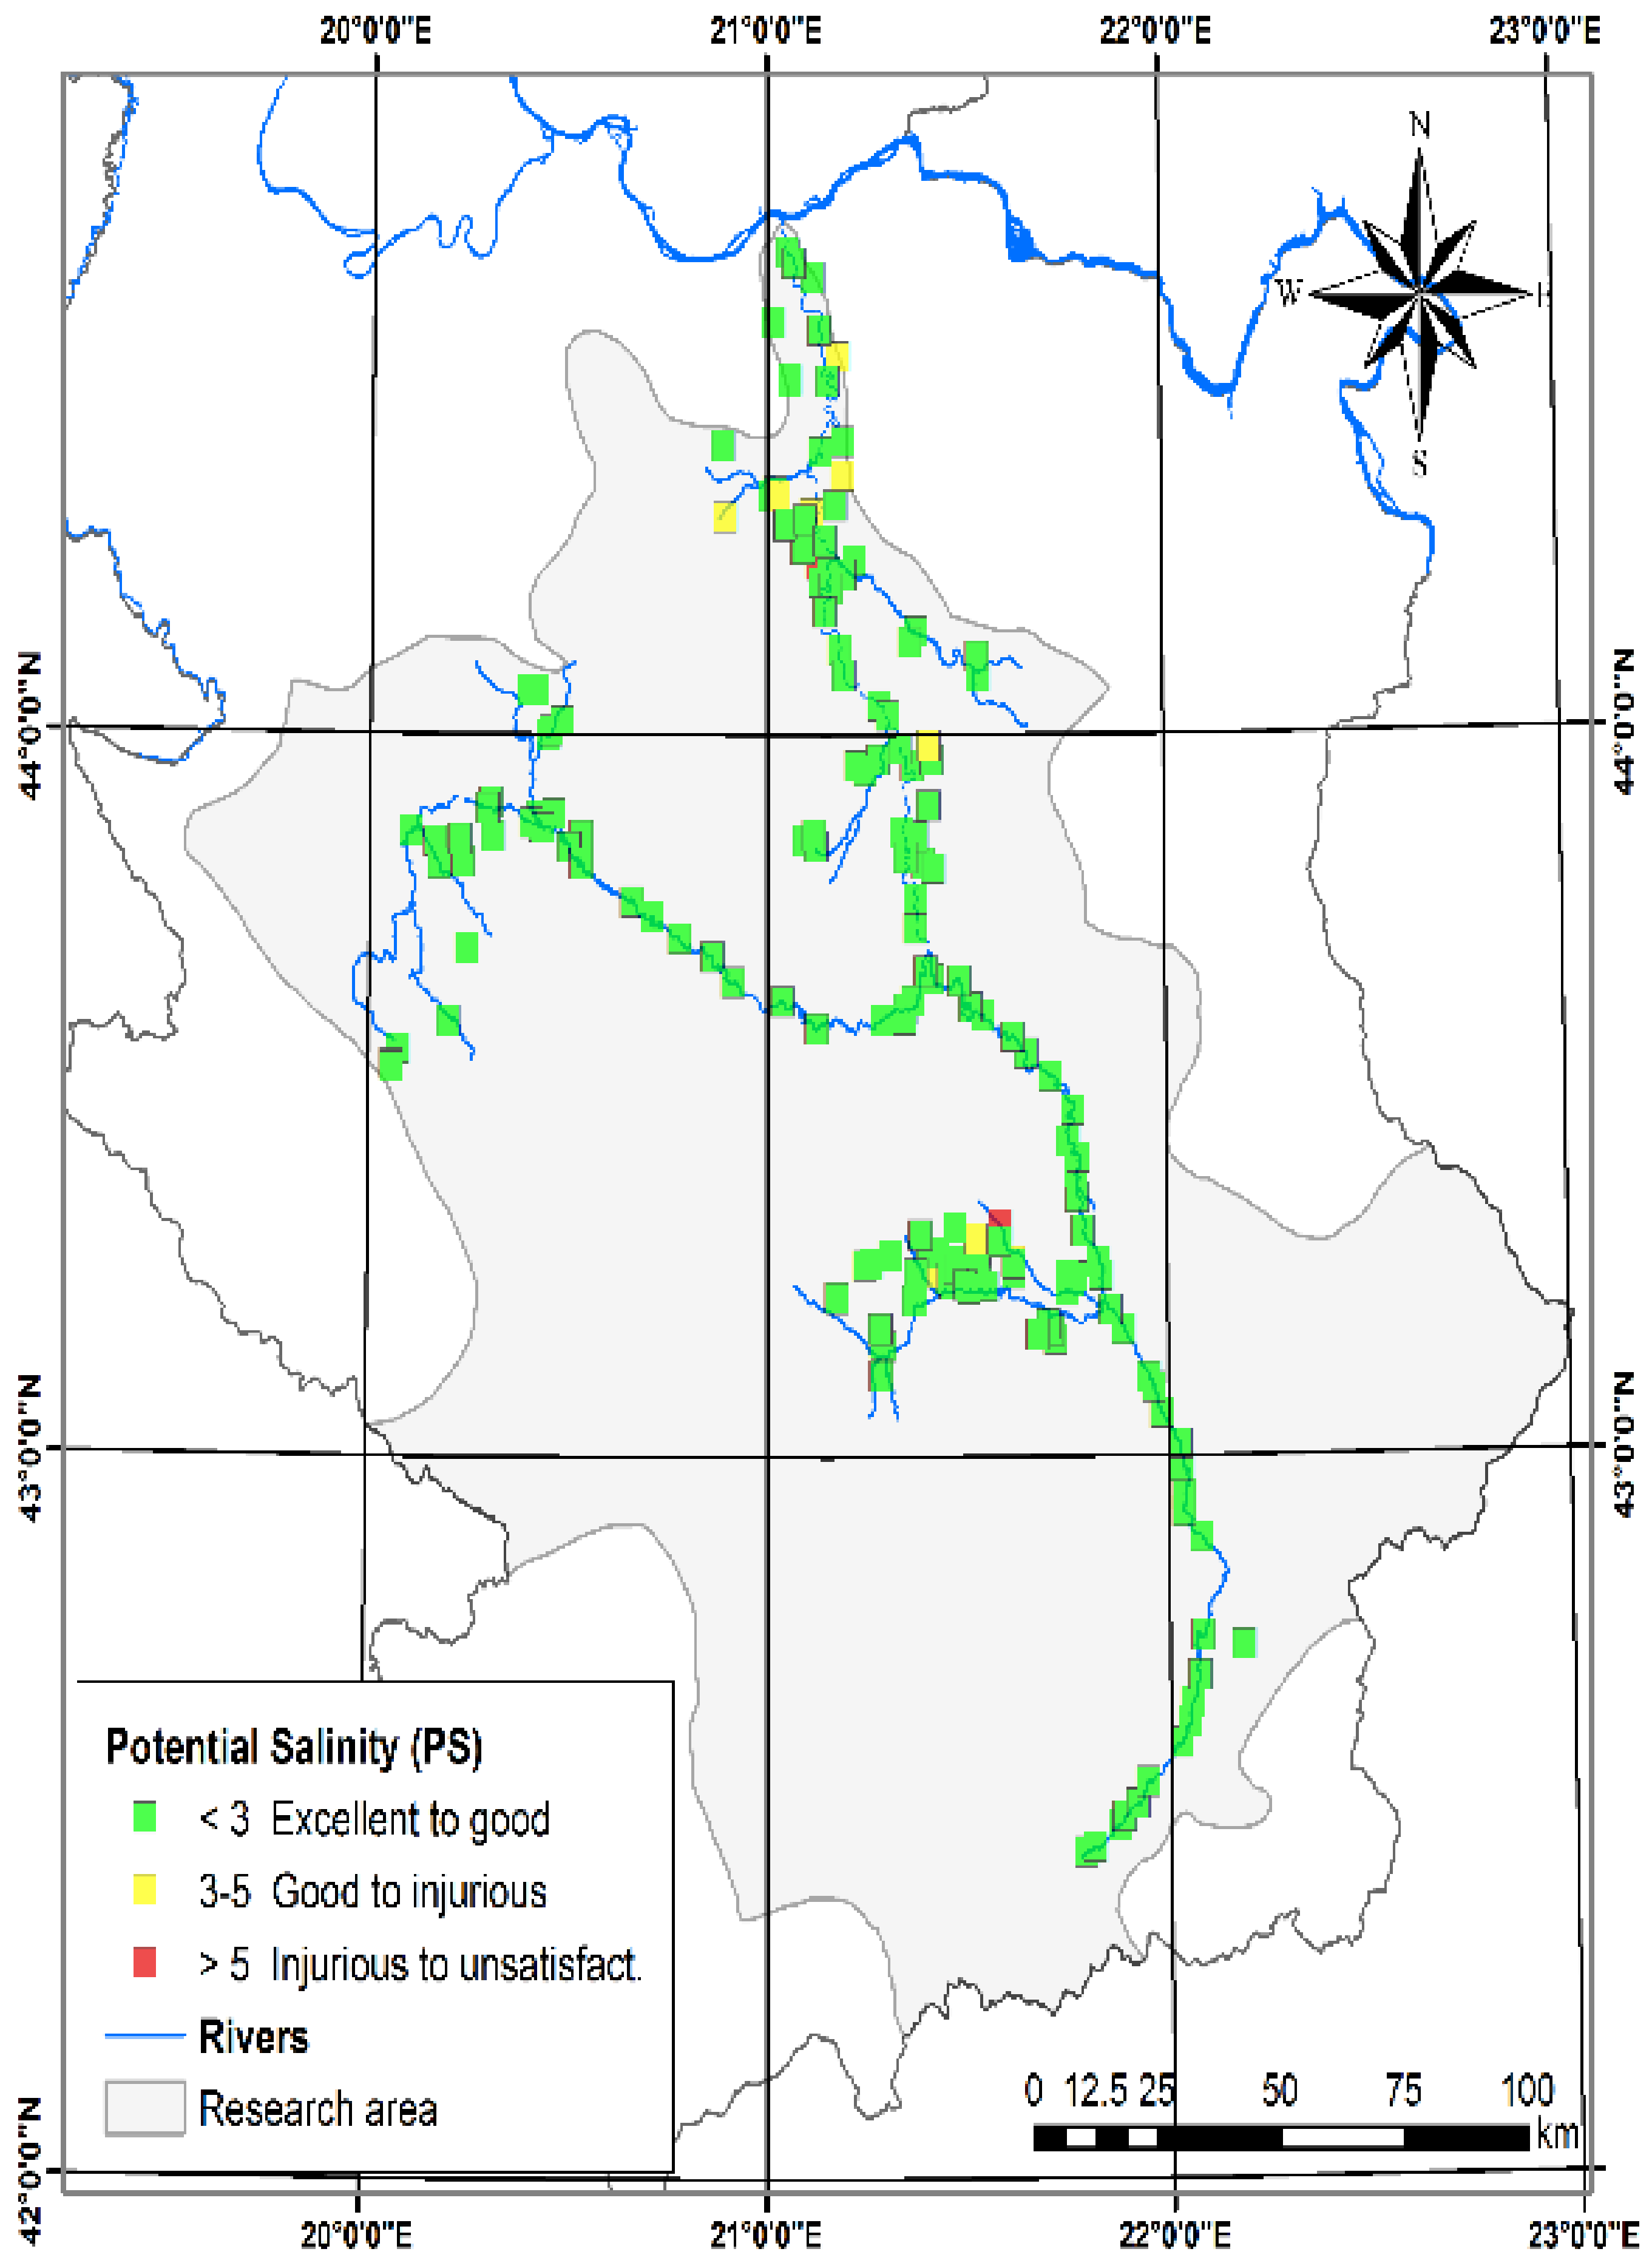
3.1.9. Potential Salinity (PS)

Potential salinity, determined as the sum of Cl and half-concentration of SO42− [29], is used as one of the classifications for assessing the suitability of water for irrigation. It is determined based on Equation (8).
In the examined irrigation water samples, 197 samples, i.e., 91.63% concerning the values of PS, were classified as excellent to good; 15 samples (6.98%) as good to injurious, and 3 samples (1.4%) as injurious to unsatisfactory (Table 4).
The spatial distribution of a particular PS of the tested irrigation water samples is shown in Figure 15.

3.1.10. USSL Salinity Diagram

Salinity diagram—the USSL diagram [27], represents the relationship between salinity hazards (expressed in EC values) and sodium content in water (expressed in terms of sodium absorption coefficient, SAR; concentrations in meq L−1). If the SAR value is in the range of 6 to 9, irrigation water will cause permeability problems in the types of clay soils that accumulate and swell [27]. He and Li [73] state that if the SAR values of irrigation water are less than 10 meq L−1, they are classified as “excellent”, for SAR values between 10 and 18 meq L−1, they are classified as “good”, and “suspicious” if the SAR values are between 18 and 26 meq L−1. Waters with an SAR value higher than 26 meq L−1 are classified as “inappropriate” [60,74].
The study area was classified into six zones, based on USSL diagrams (Figure 16), as follows: (1) C1S1, (2) C2S1, (3) C3S1, (4) C4S1, (5) C4S2, (6) C3S2. According to this diagram, if the clusters of samples were located in the regions C1S1 and C2S2, they could be considered as very good, i.e., a good category of irrigation water. If the samples were in category C3S1, they belonged to moderately suitable irrigation waters, due to the high risk of salinity. Samples in the C3S2 and C4S1 categories were rated as irrigation water of medium to poor quality, due to the high risk of salinization, and they are not suitable for use on heavy soils and salt-sensitive plants.
Samples from the C4S2 category belonged to the irrigation water of poor quality and could only be used on well-drained soils with caution to side effects. The USSL diagram indicates that the risk of salinization was expected in 8% of the tested irrigation water samples, and 82% of the samples could be considered as a very good or good category of irrigation water.

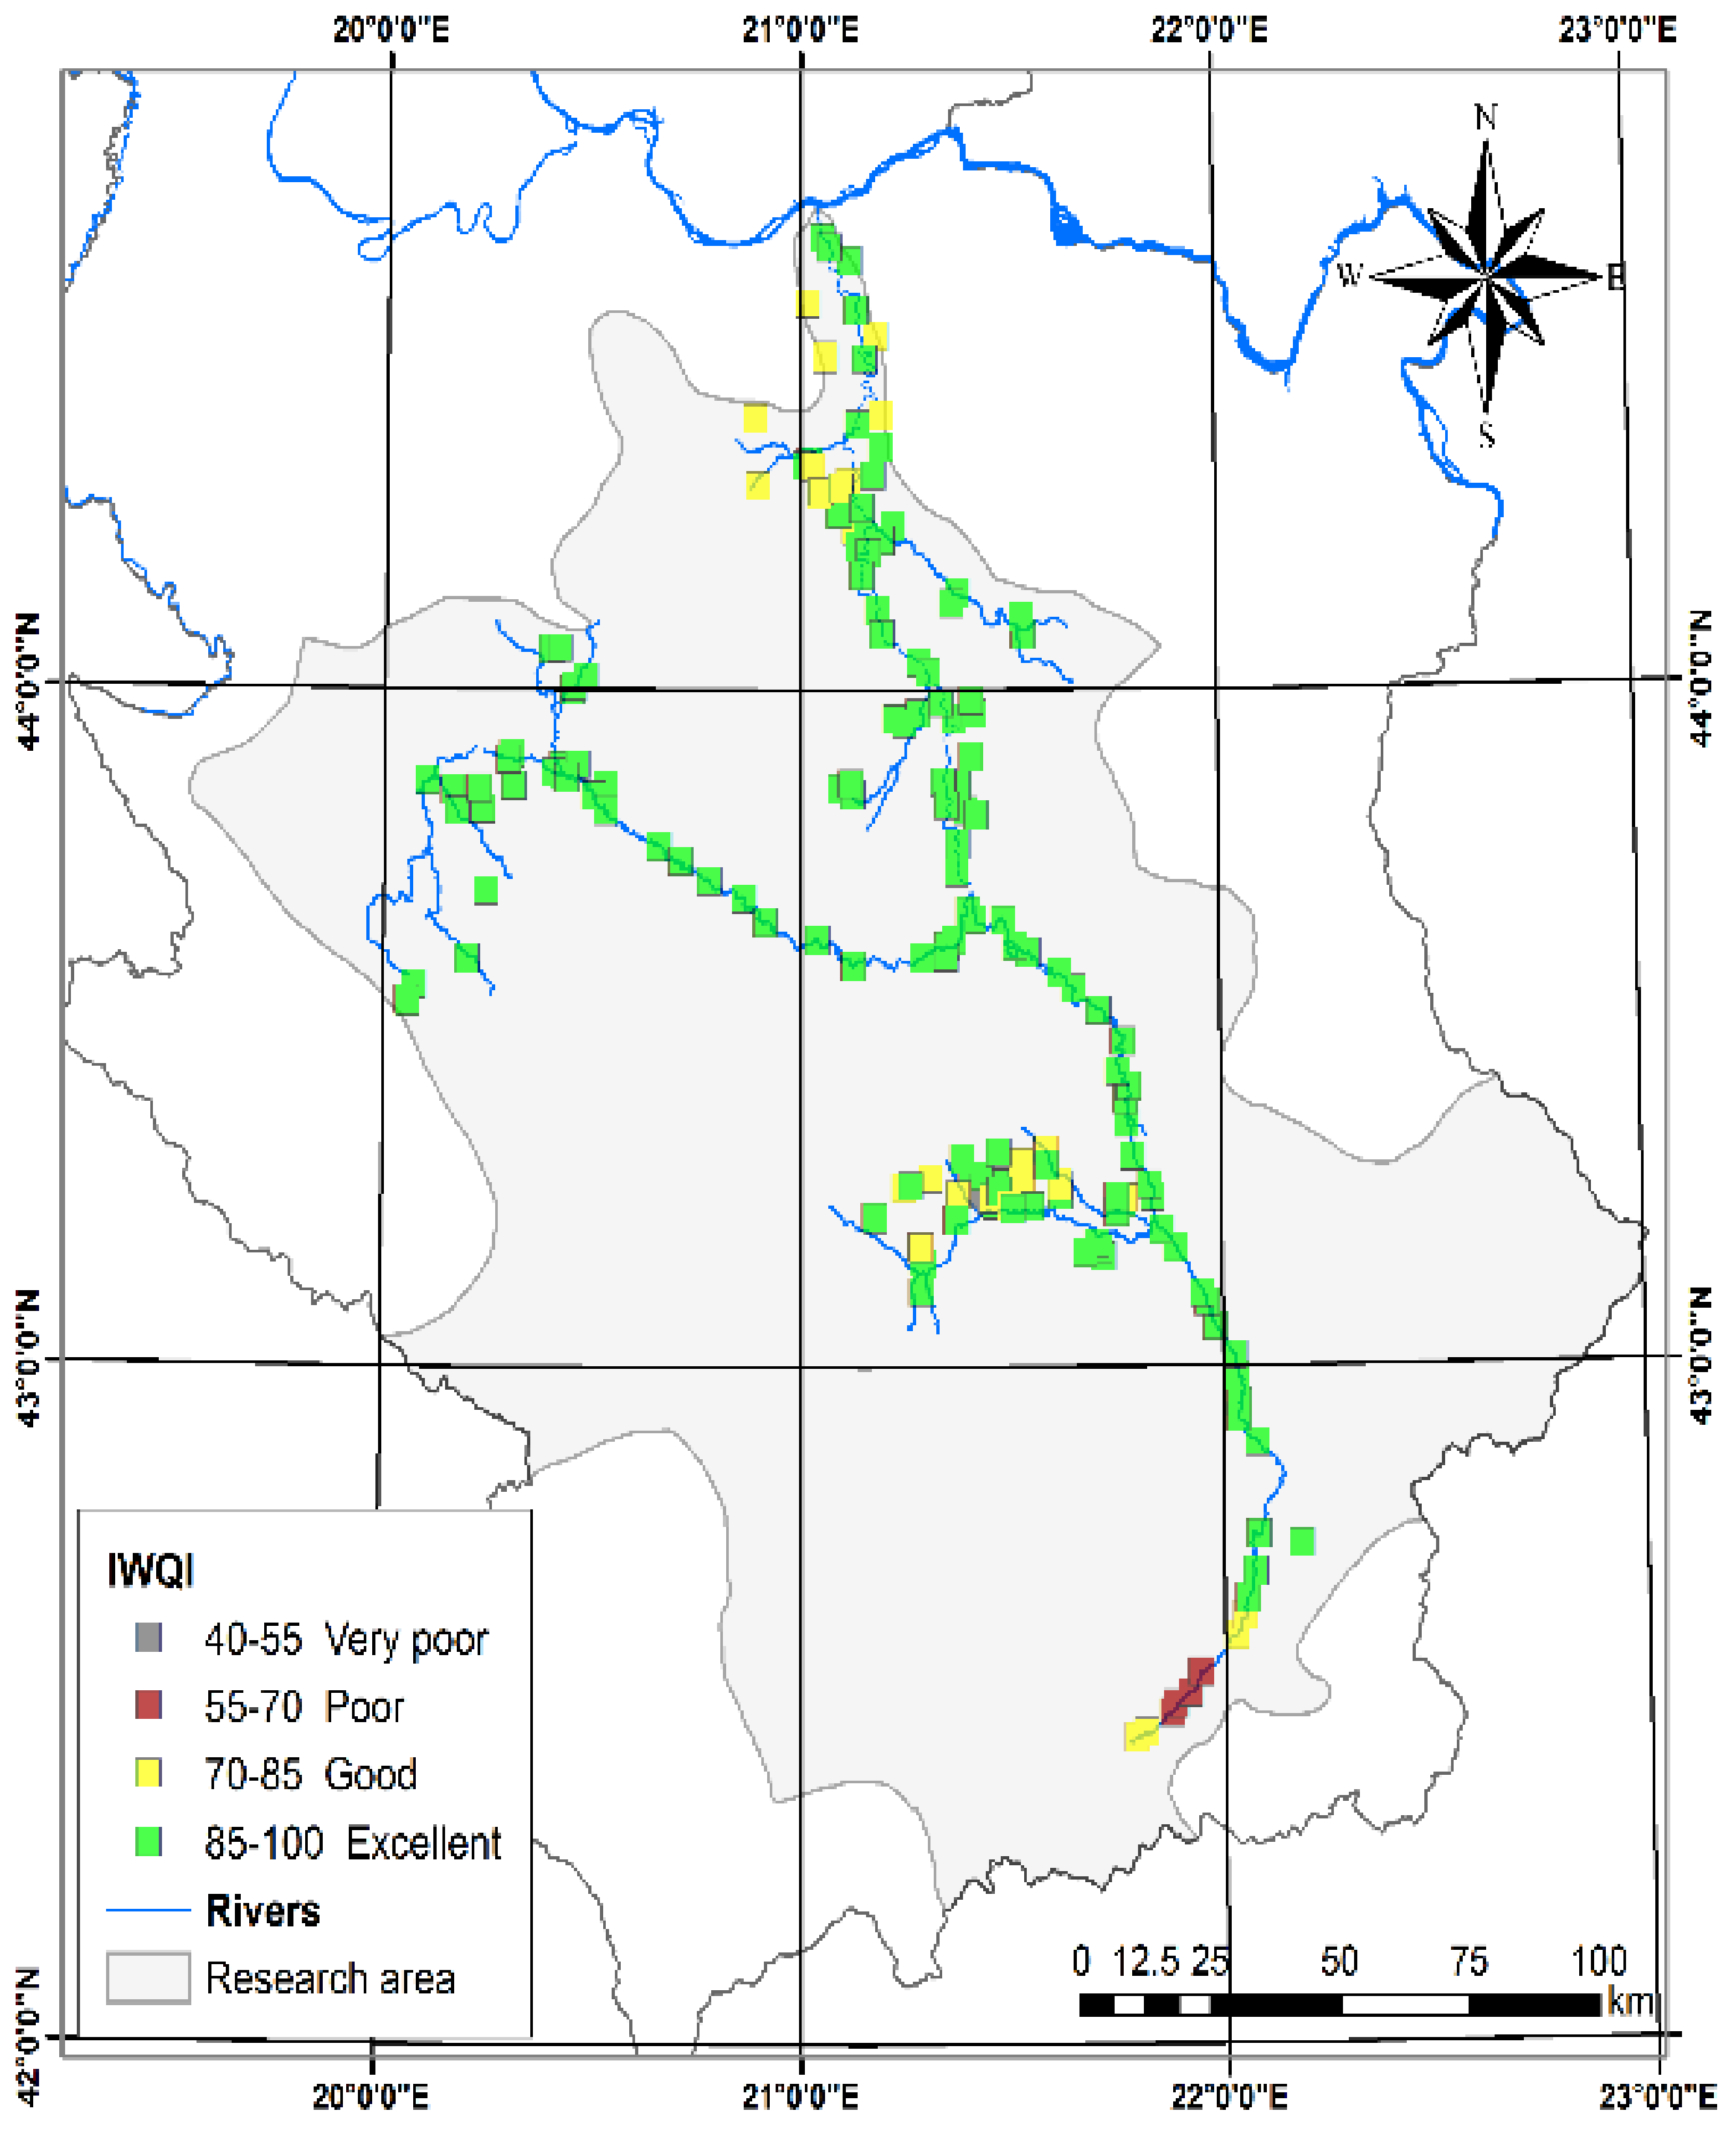
3.1.11. Irrigation Water Quality Index (IWQI)

The irrigation water quality index (IWQI) includes in the calculation only certain parameters of irrigation water quality based on the recommended limits for all soil types. Adimalla et al. [75] state that the IWQI method based on the analysis of irrigation water quality and its impact on soil and plants gives a clear categorization of the quality of applied water. It is based on the principle of comparing water quality parameters with specific standards, and defines irrigation water quality with a single value, thus avoiding water quality assessments that involve complex data intervals [11]. The irrigation water quality index is based on the recommended limits for continuous water use for all soil types [76,77] and indicates the following indicators of water quality for irrigation: salinity (which affects the availability of water to cultivated crops), permeability (which affects soil infiltration), toxicity (affects sensitive crops), and others. Based on two quality indicators, only certain irrigation water quality parameters were used for the IWQI calculation, as follows: electrical conductivity (EC), sodium adsorption ratio (SAR), and concentration of the ions such as sodium (Na+), chloride (Cl), and bicarbonate (HCO3) [24,78,79]. Based on the processed data of the estimated IWQI index, and the classification listed in Table 5, 164 samples of irrigation water, or 76.27%, were rated as excellent–no restriction water; 41 samples (19.07%) were estimated as good–low restriction water; 7 samples (3.26%) were rated as poor–moderate restriction water, and 3 samples (1.4%) as very poor–high restriction water. A graphical representation of the IWQI estimate is given in Figure 17.

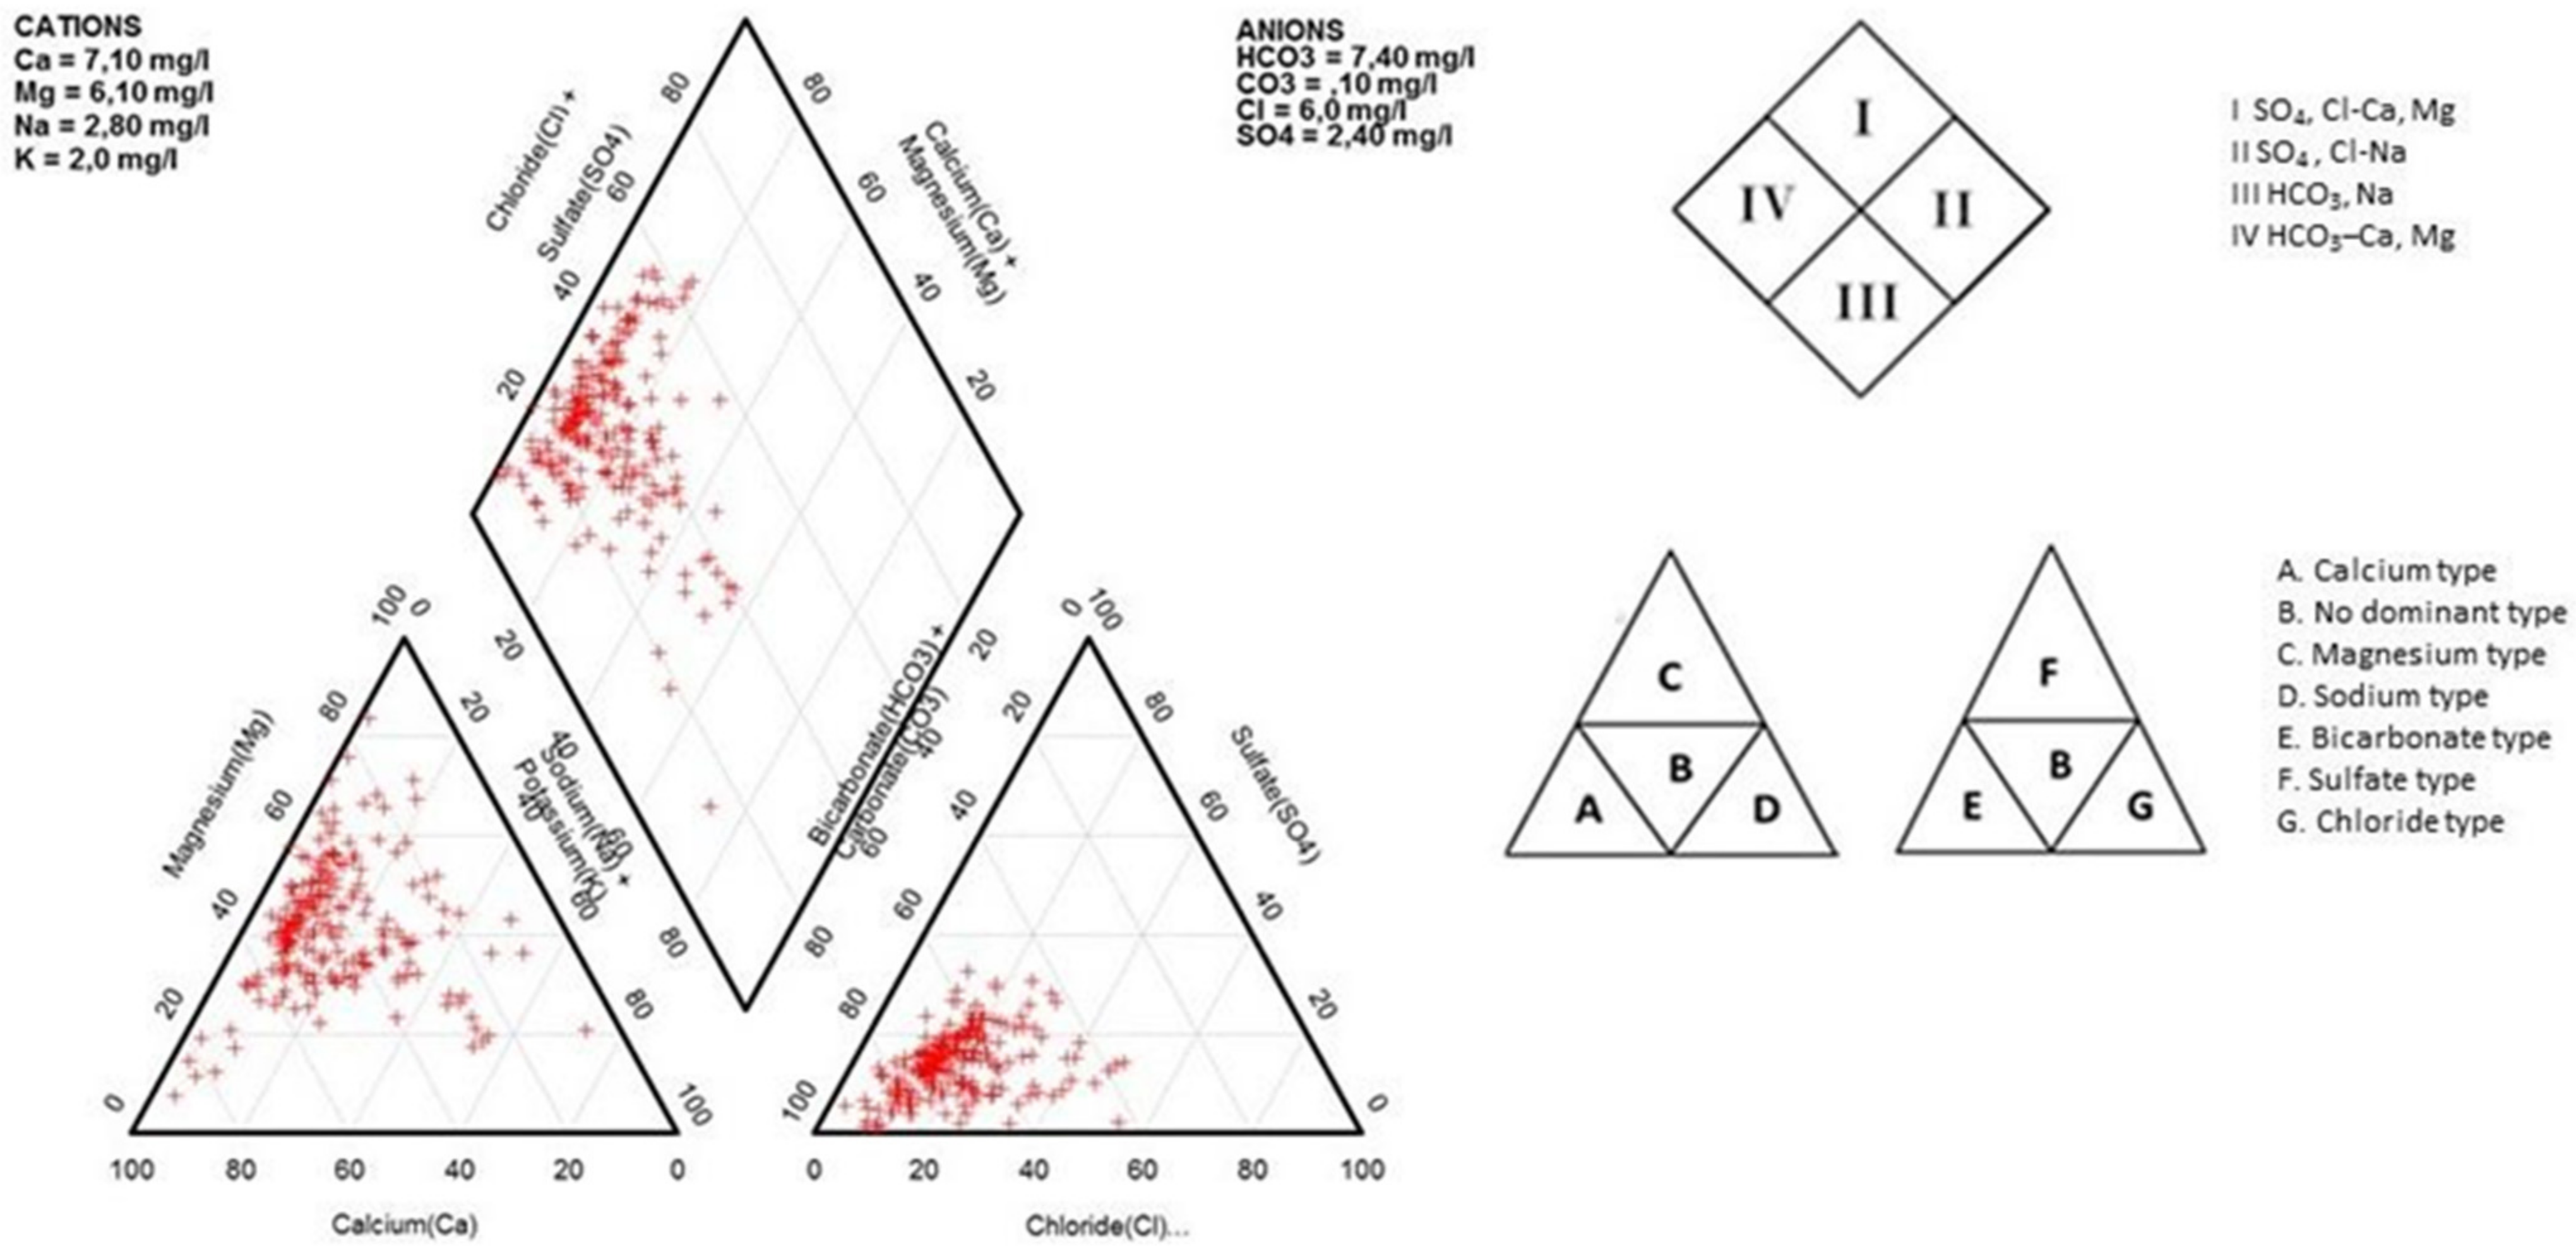
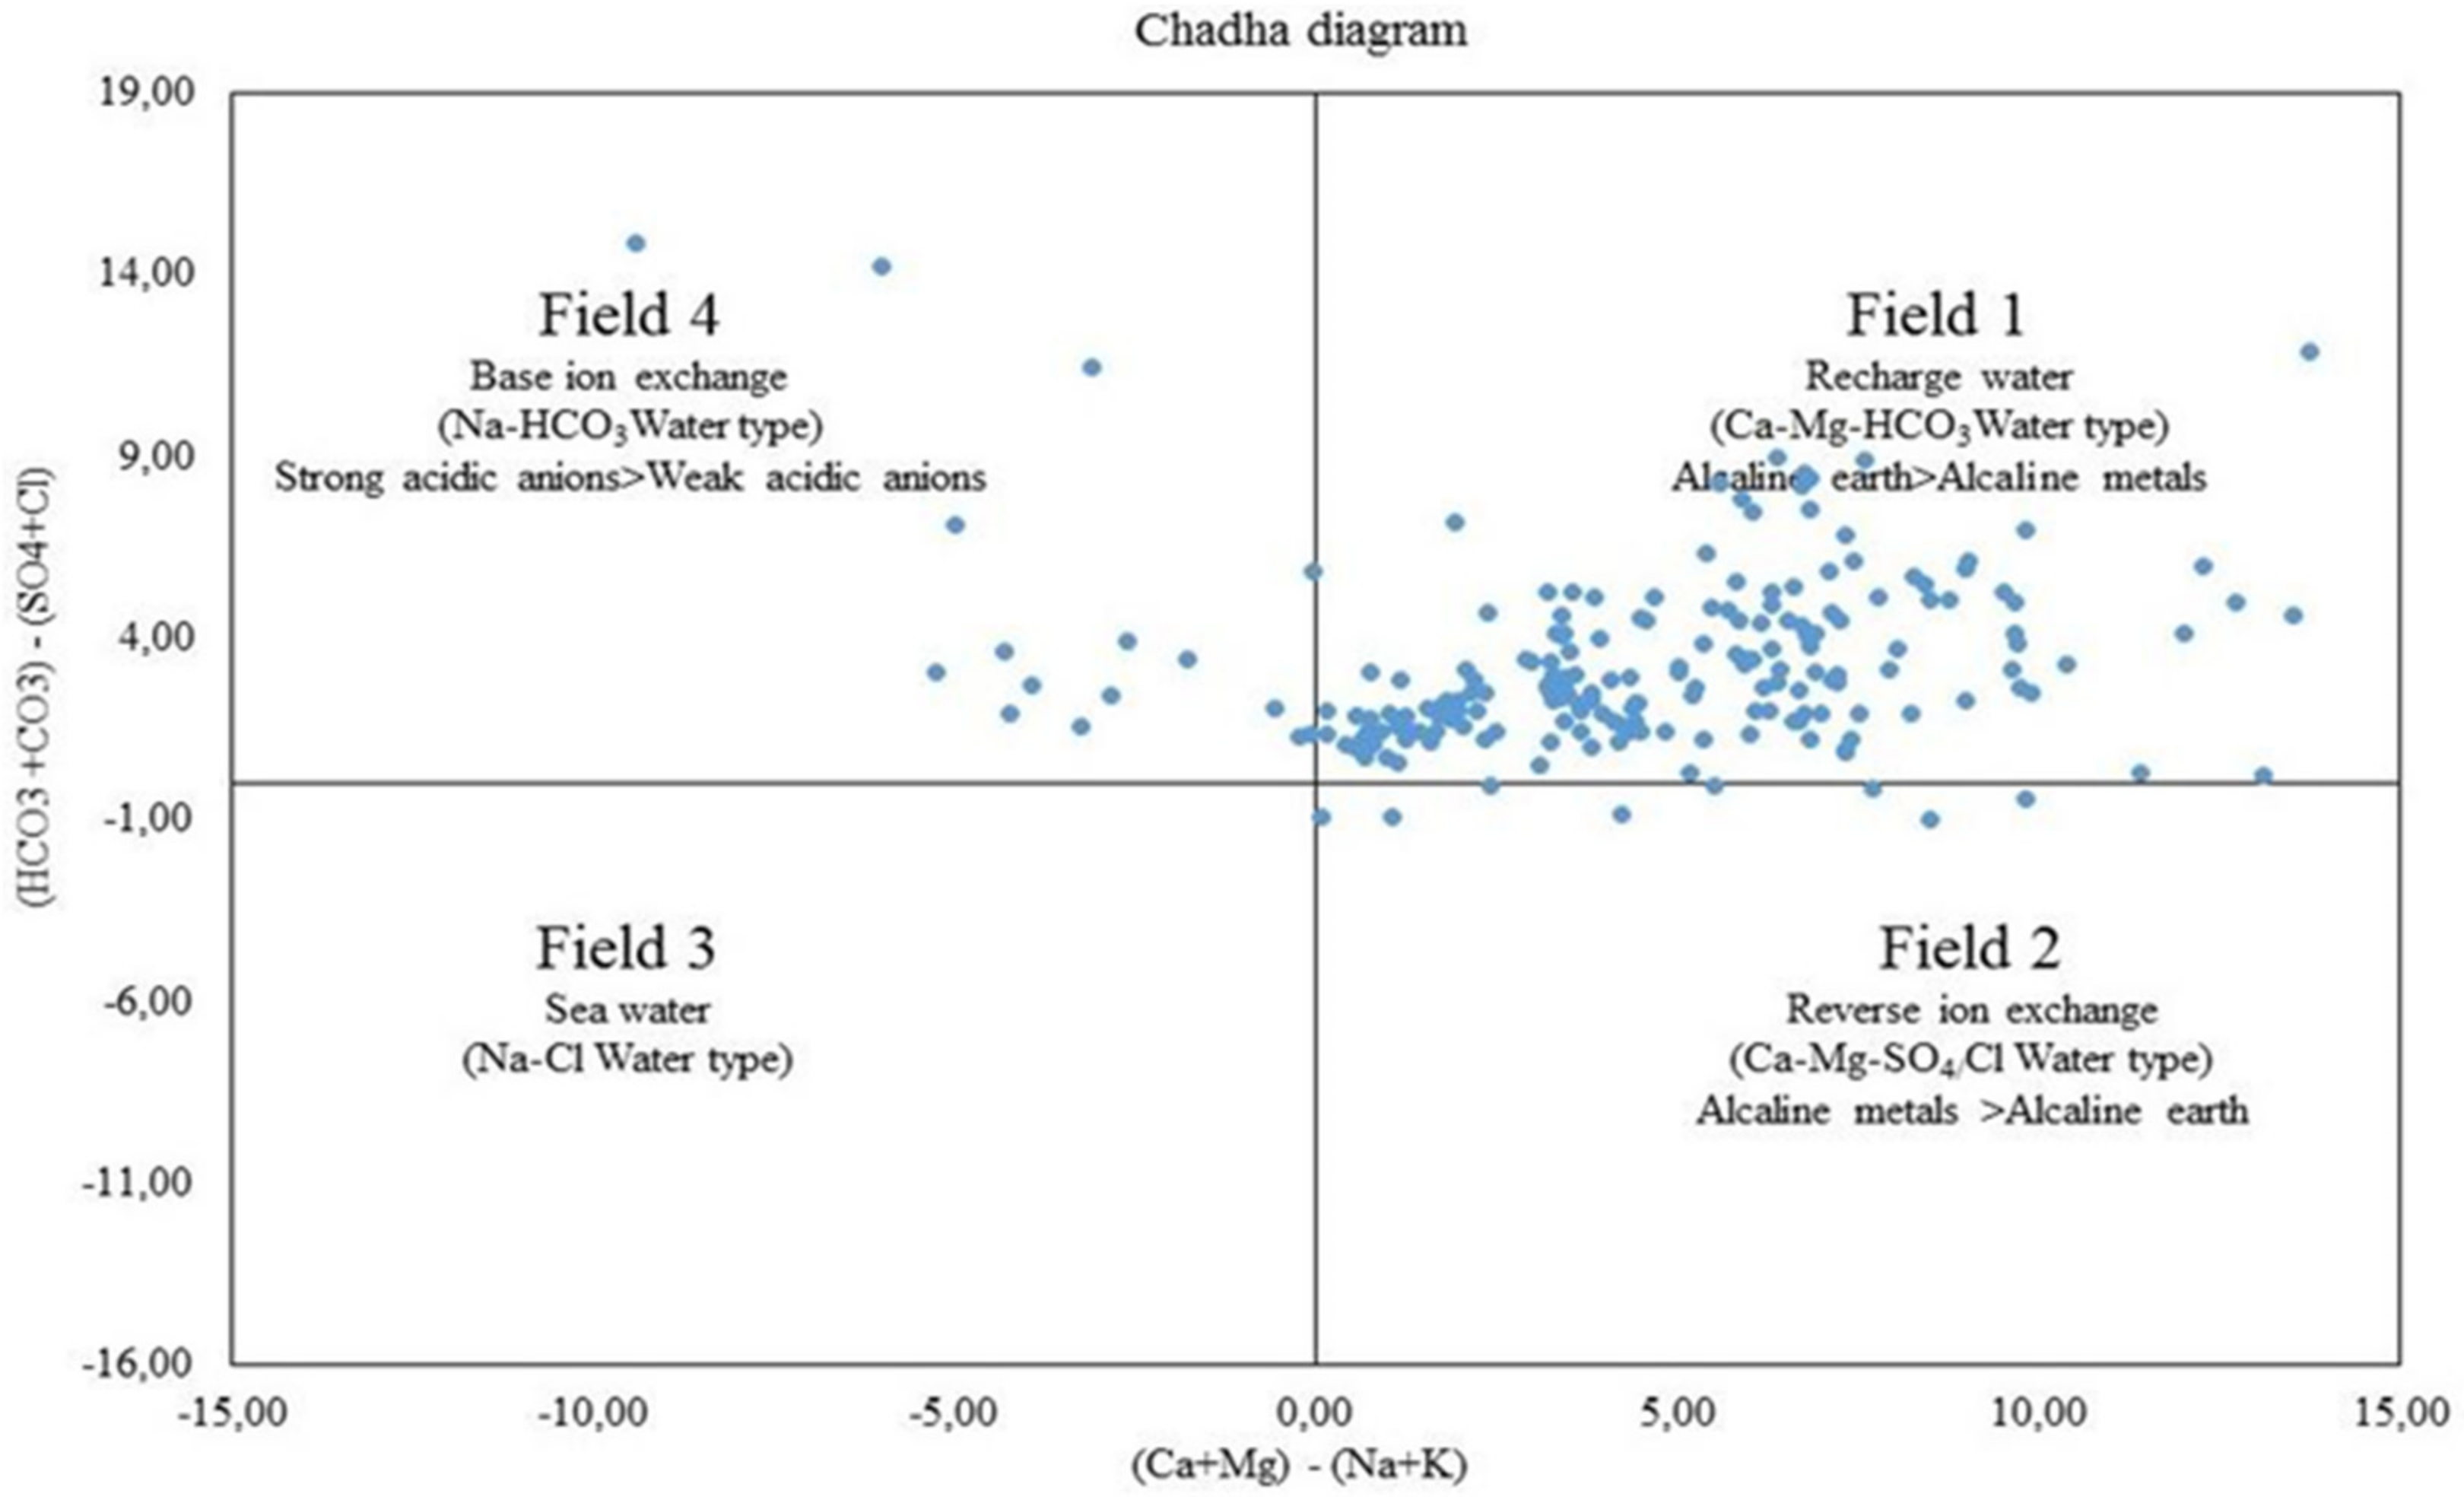
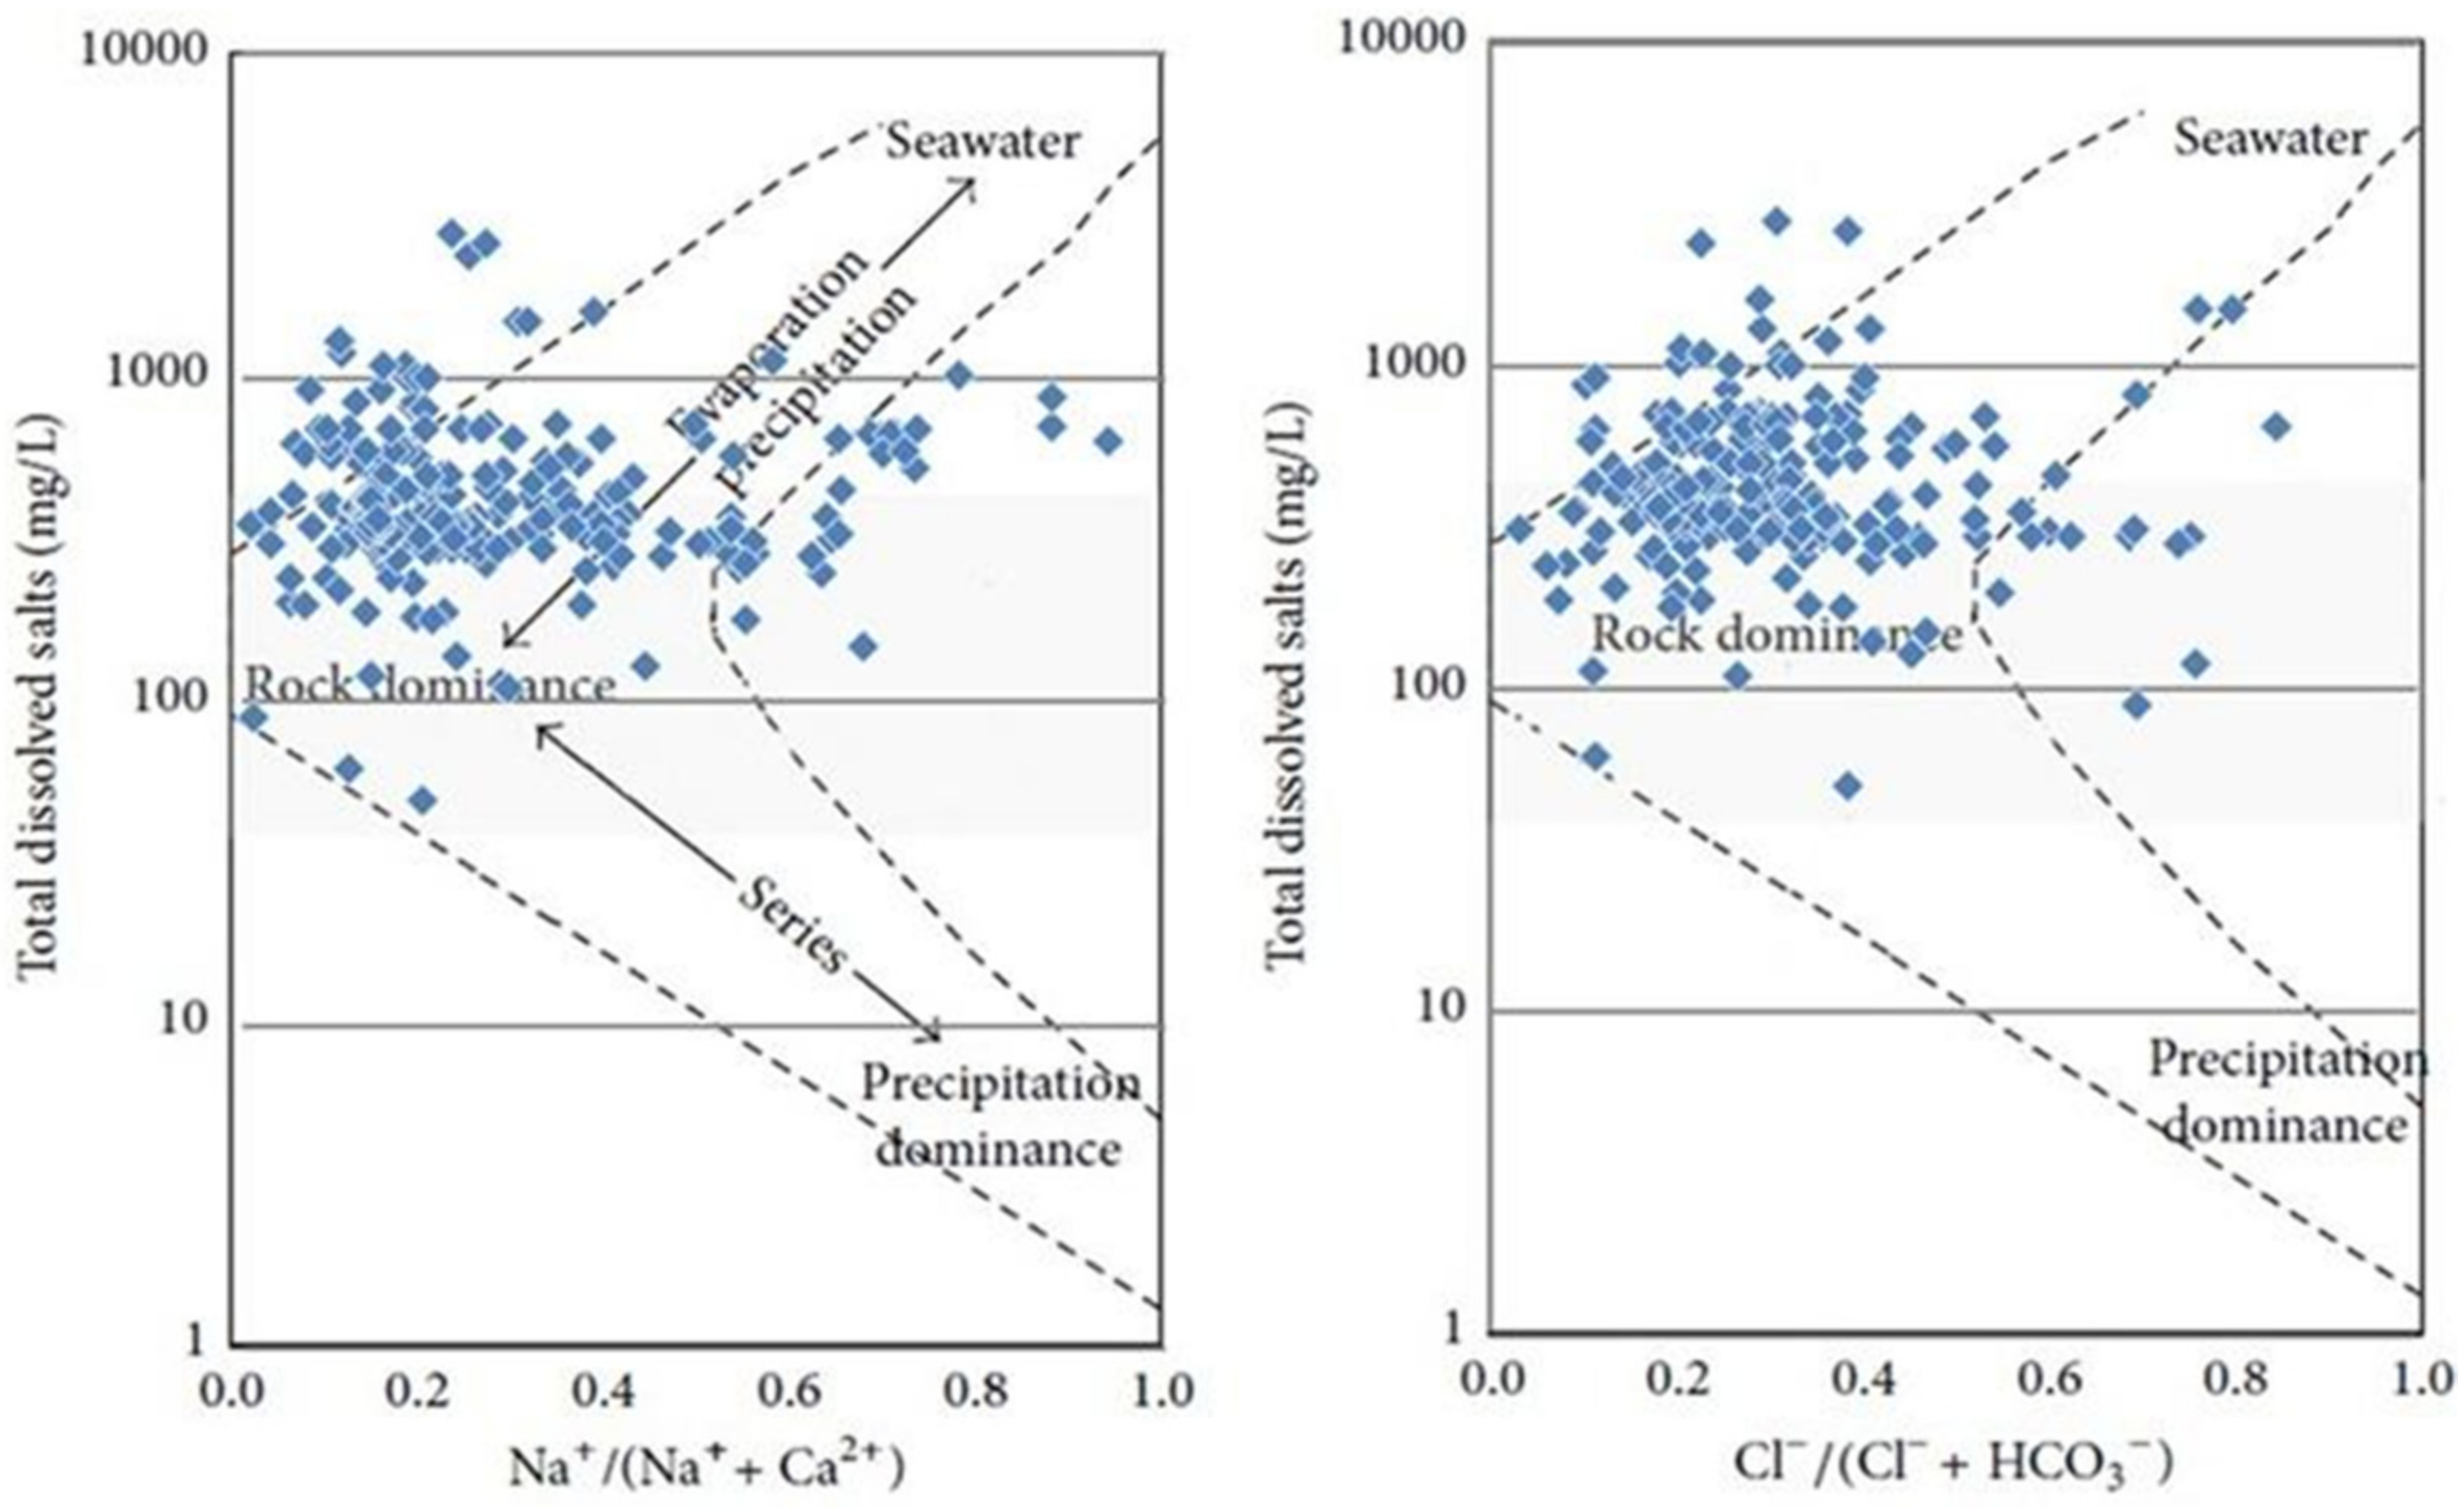
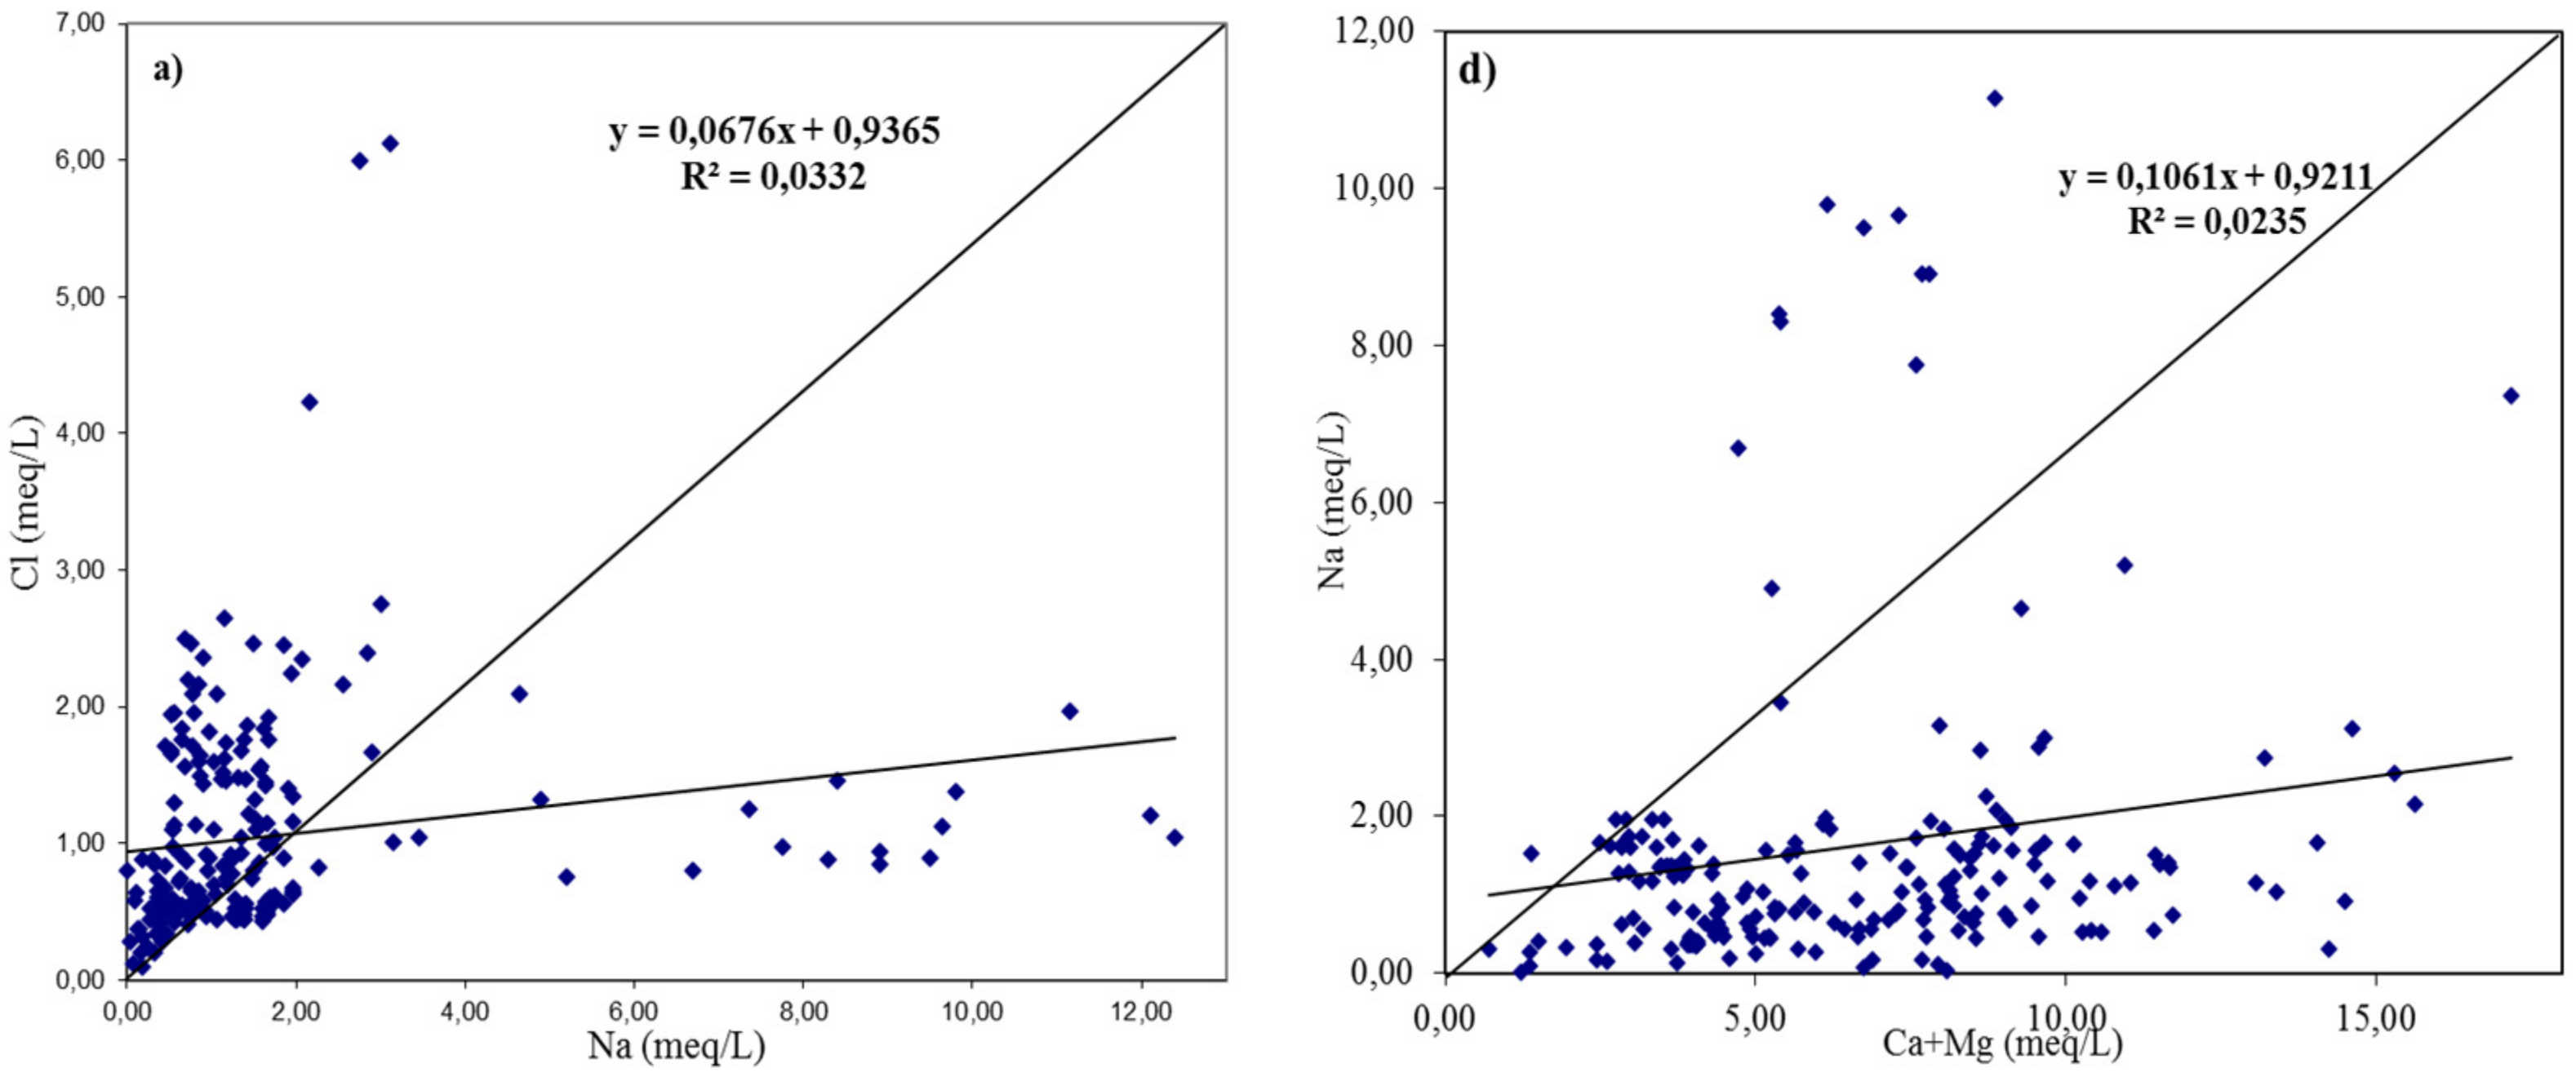
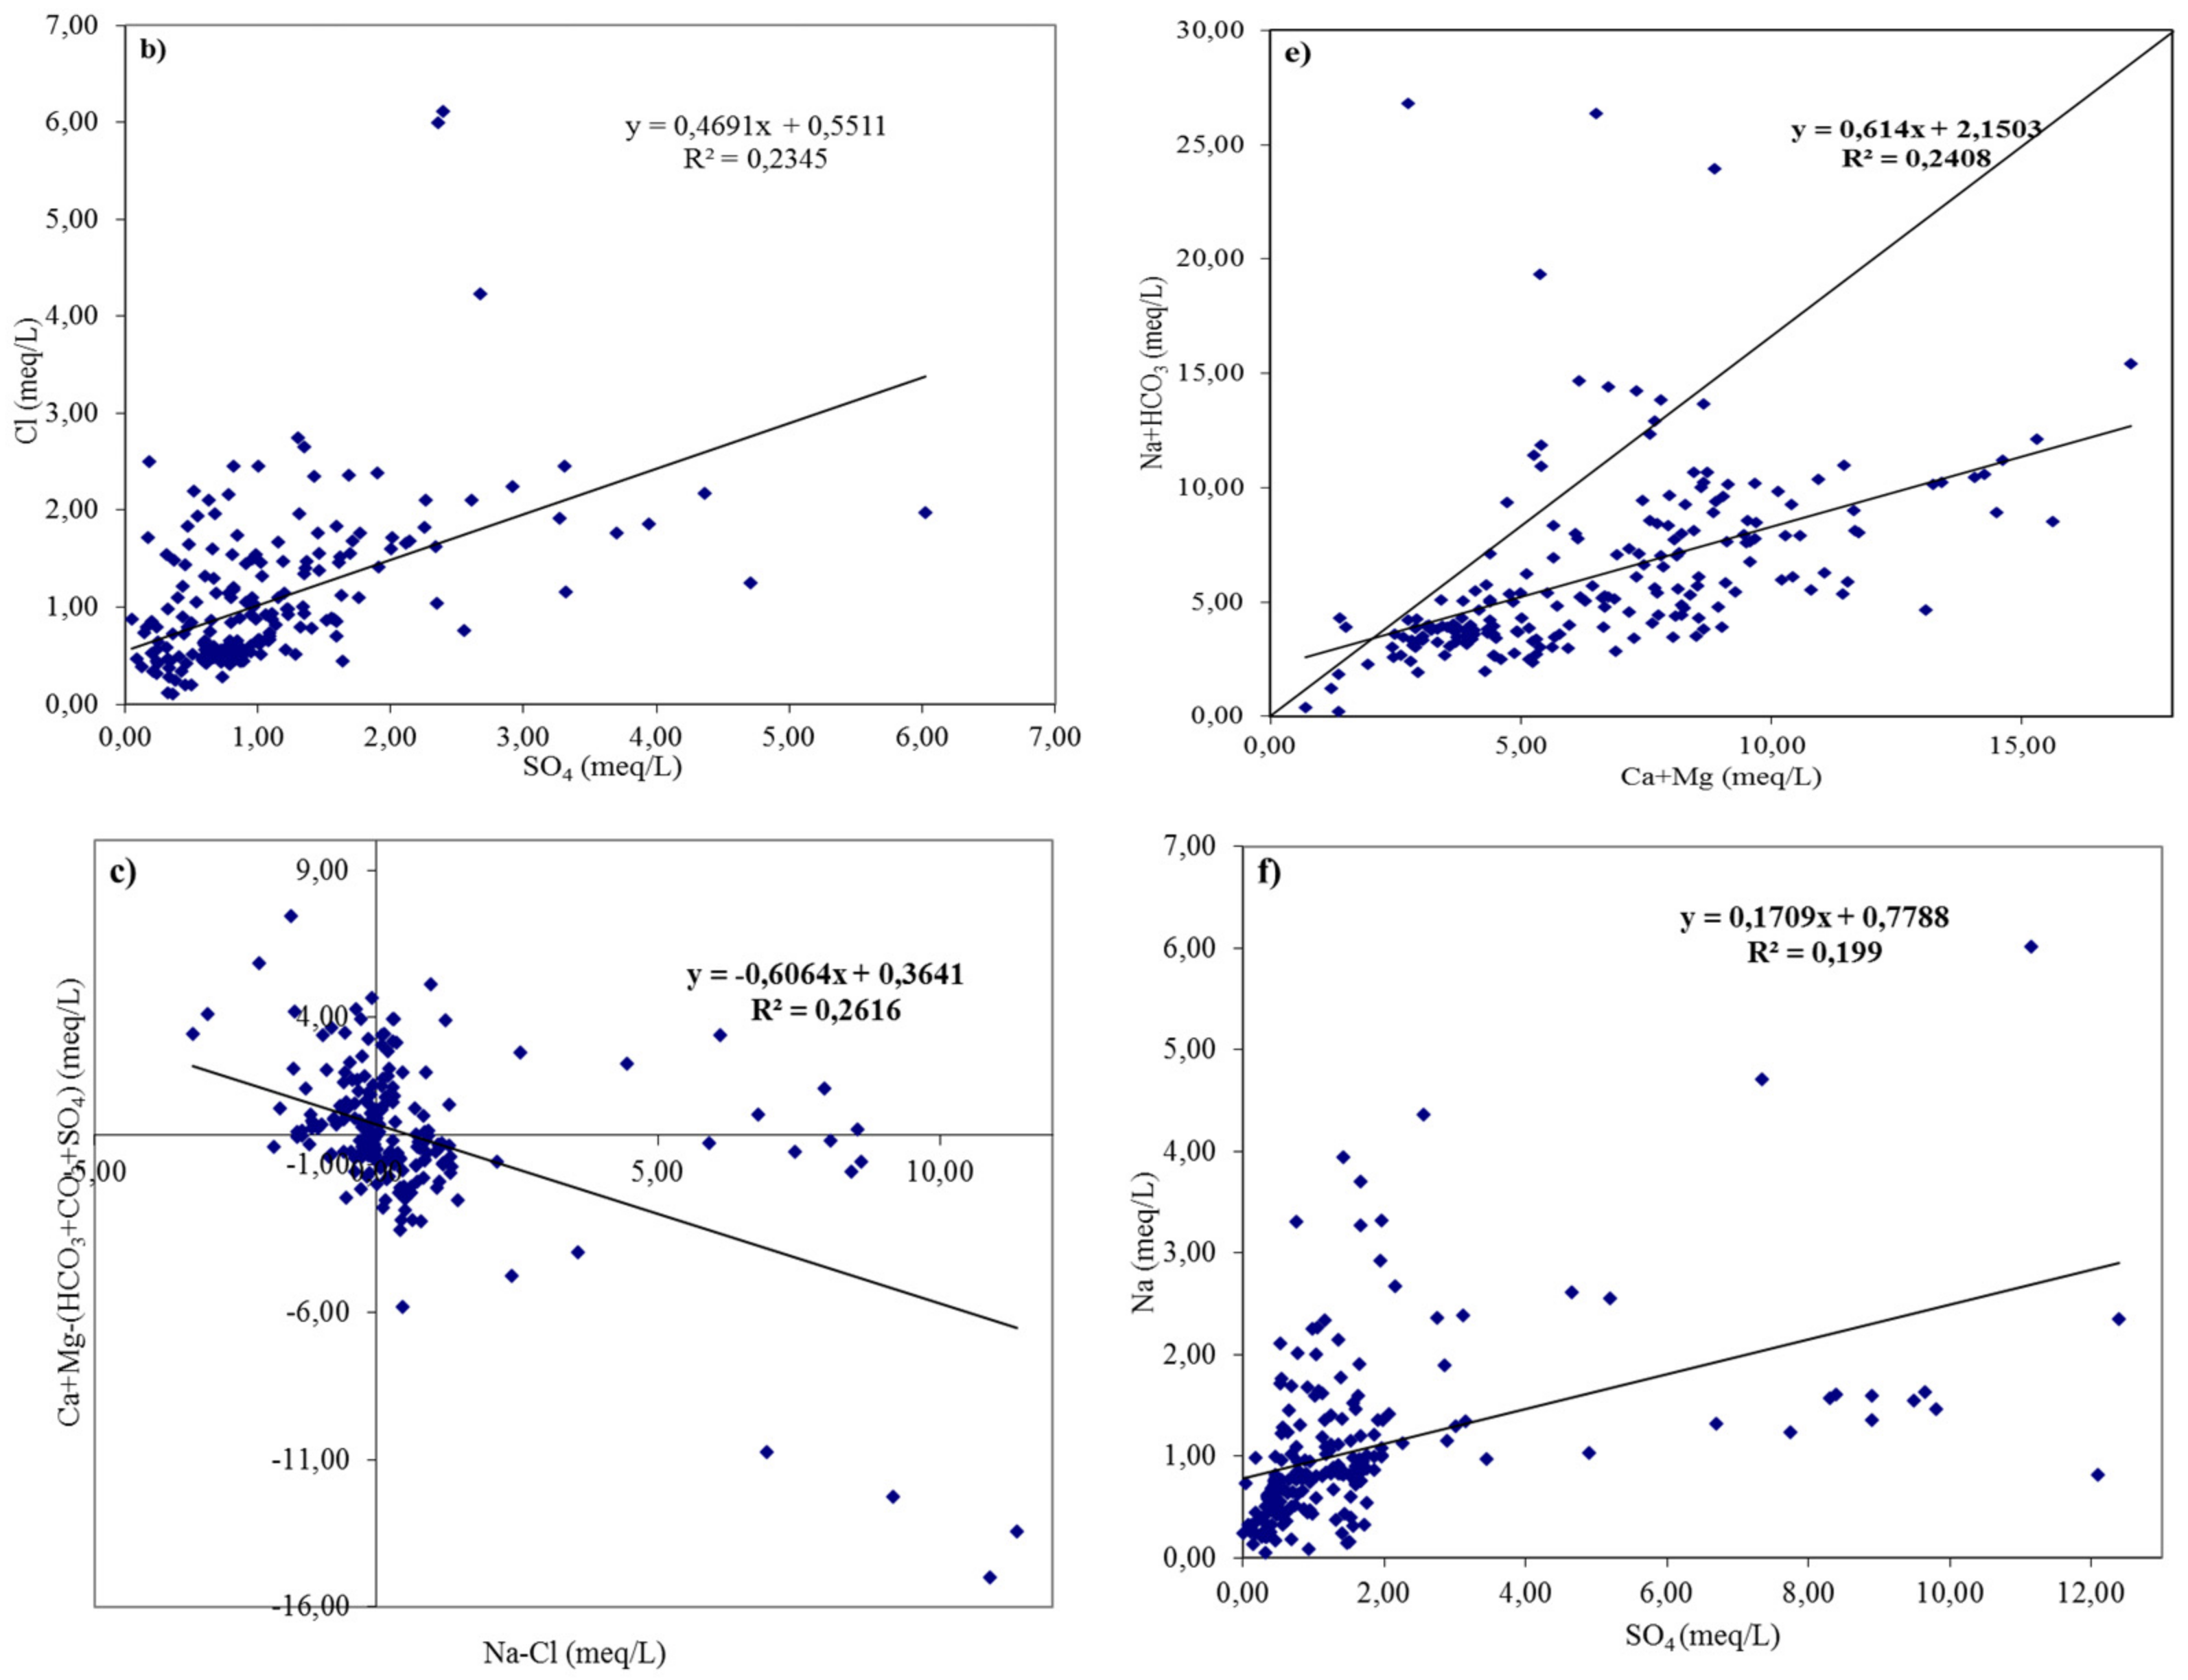
3.2. Geochemical Facies and Controlling Mechanisms

Most of the critical issues related to water hydrogeochemistry are often estimated based on the percentage concentrations of major cations and anions in meq L−1 in the [80] trilinear diagram. Piper’s trilinear diagram is presented in Figure 18. The geochemical classification of water mainly depends on the concentration of cation and anion ions and their correlation. The Piper diagram is a frequently used and very efficient method for classifying water based on the basic geochemical characteristics of the major ions [16]. The chemical data of the analyzed samples collected from the research area were plotted in Piper’s diagram (Figure 18). It was stated that there are three main hydrochemical types of tested samples of irrigation water, of which, type I: SO4, Cl-Ca, Mg, belonged to 6.98% (15 water samples); type III: HCO3, Na, belonged to 2.79% (6 water samples); type IV: HCO3-Ca, Mg, belonged to 90.23% (194 samples). Based on the cationic triangle, it was noticeable that most of the samples belonged to the mixed zone, 54.43% of samples, followed by Ca2+ type with 23.25% of samples, then Mg2+ type with 19.53% of samples, and Na+ K+ type with 2.79% of samples. In the part of the anionic triangle, most of the samples, 93.02%, belonged to the type HCO3, CO3, followed by the mixed type with 6.52% of the samples, and only 0.46% of the samples belonged to the type Cl. The occurrence of individual examples of irrigation water samples with increased chloride content might be the result of pollution by sewage waste and leaching of salt residues in the soil [81], i.e., from household wastewater and untreated industrial waste [82]. The high concentration of Ca and Mg can be explained by the dissolution of dolomite limestones and Ca-Mg silicates (amphiboles, pyroxenes, olivine, biotite). Sodium and potassium in the aqueous system are obtained by atmospheric precipitation, dissolution of evaporites, and decomposition of silicates such as albite, anorthite, orthoclase, and microcline. The high concentration of K in some analyzed samples of irrigation water could be interpreted as a contribution of anthropogenic activities.
In this paper, Chadha’s diagram [83] was applied to interpret the hydrogeochemical properties of irrigation waters (Figure 19). It is formed by plotting the difference in meq L−1 between earth-alkaline (Ca2+ + Mg2+) and alkali metals (Na+ + K+) on the X-axis, and the difference in meq L−1 between weakly acidic anions (HCO3 + CO32−) and strong acid anions (Cl + SO42−) on the Y-axis [84,85]. Each of the four fields formed by the above diagram has its hydrochemical significance. Field-1 (type Ca+–HCO3) indicates samples with recharging water filling capacity; Field-2 describes reverse ion exchange samples (Ca+–Mg+–Cl type); Field-3 indicates saltwater samples of outer members (type Na+–Cl); Field-4 represents the description of the base ion exchange samples (type Na+–HCO3) [86]. The largest number of analyzed samples of irrigation water belonged to Field 1 (90.24%), followed by Field 4 (6.97%), and then Field 2 (2.79%), which was as per the findings from the Piper’s diagram.
Hydrochemical variability, among other things, can be shown by the Gibbs diagram, which shows the relationship between groundwater chemistry and aquifer lithology [87]. Based on this diagram, three main natural mechanisms can be found: the dominance of evaporation, the dominance of rocks, and the dominance of precipitation [30,88,89].
The Gibbs diagram can indicate the origin of solutes and hydrogeochemical processes [30]. It is a set of semi-logarithmic diagrams with the ratio of anions and cations (Na+/(Na+ + Ca2+) and C1/(C1 + HCO3), shown on the X-axis and TDS on the Y-axis (Figure 20). The diagram thus summarizes the most important natural mechanisms for controlling the chemical properties of water, i.e., precipitation control mechanisms, rock–geological substrate-control mechanisms, and evaporation-control mechanisms.
Although the Gibbs diagram can be used to determine the role of natural factors, it cannot exclude anthropogenic activities on the chemical properties of water. The Gibbs diagram also has some limitations. Water pollutants originating from anthropogenic activities such as mining, metallurgy and chemical industry, municipal communal services with their actions and contributions, can change the hydrochemical composition of water and increase the concentration of pollutants in water, such as Cl, SO42− and TDS [90,91,92]. In addition, people change the hydrodynamic properties of water during the exploitation of water resources and thus affect the interactions of water and geological substrate (rocks) or the intensity of evaporation and change the concentration of individual elements.
Geochemical processes and their control mechanisms affect water quality and their suitability for irrigation. The similarities between the analyzed physicochemical components of the collected irrigation water samples were analyzed and shown graphically (Figure 21).
The relationship between Na+ and Cl is very important in identifying the potential occurrence of salinization (Figure 22). The correlation coefficient of the examined, listed parameters shows a low correlation ratio (R2 = 0.03).
The same can be concluded from the relationship SO42− vs. Cl (Figure 22), where the correlation ratio was determined (R2 = 0.23), then from the ratio Na+-Cl vs. Ca2++Mg2+-(HCO3+CO32−+SO42−), Figure 22, where the correlation coefficient was determined (R2 = 0.26). Figure 22 shows the ratio Na+ vs. Ca2++Mg2+, where the correlation coefficient was determined (R2 = 0.02). The correlation coefficient (R2 = 0.24) was determined from the ratio Ca2+ + Mg2+ vs. Na+ + HCO3−, Figure 22, while from the ratio Na+ vs. SO42− the correlation coefficient (R2 = 0.19) was determined, Figure 22.
Based on the conducted analysis, it can be concluded that there is no significant correlation between the analyzed parameters and that the probable disposal of untreated wastewater either from industry or anthropogenic origin in some samples leads to increased concentrations of Ca2+, which is observed in some samples of irrigation water.

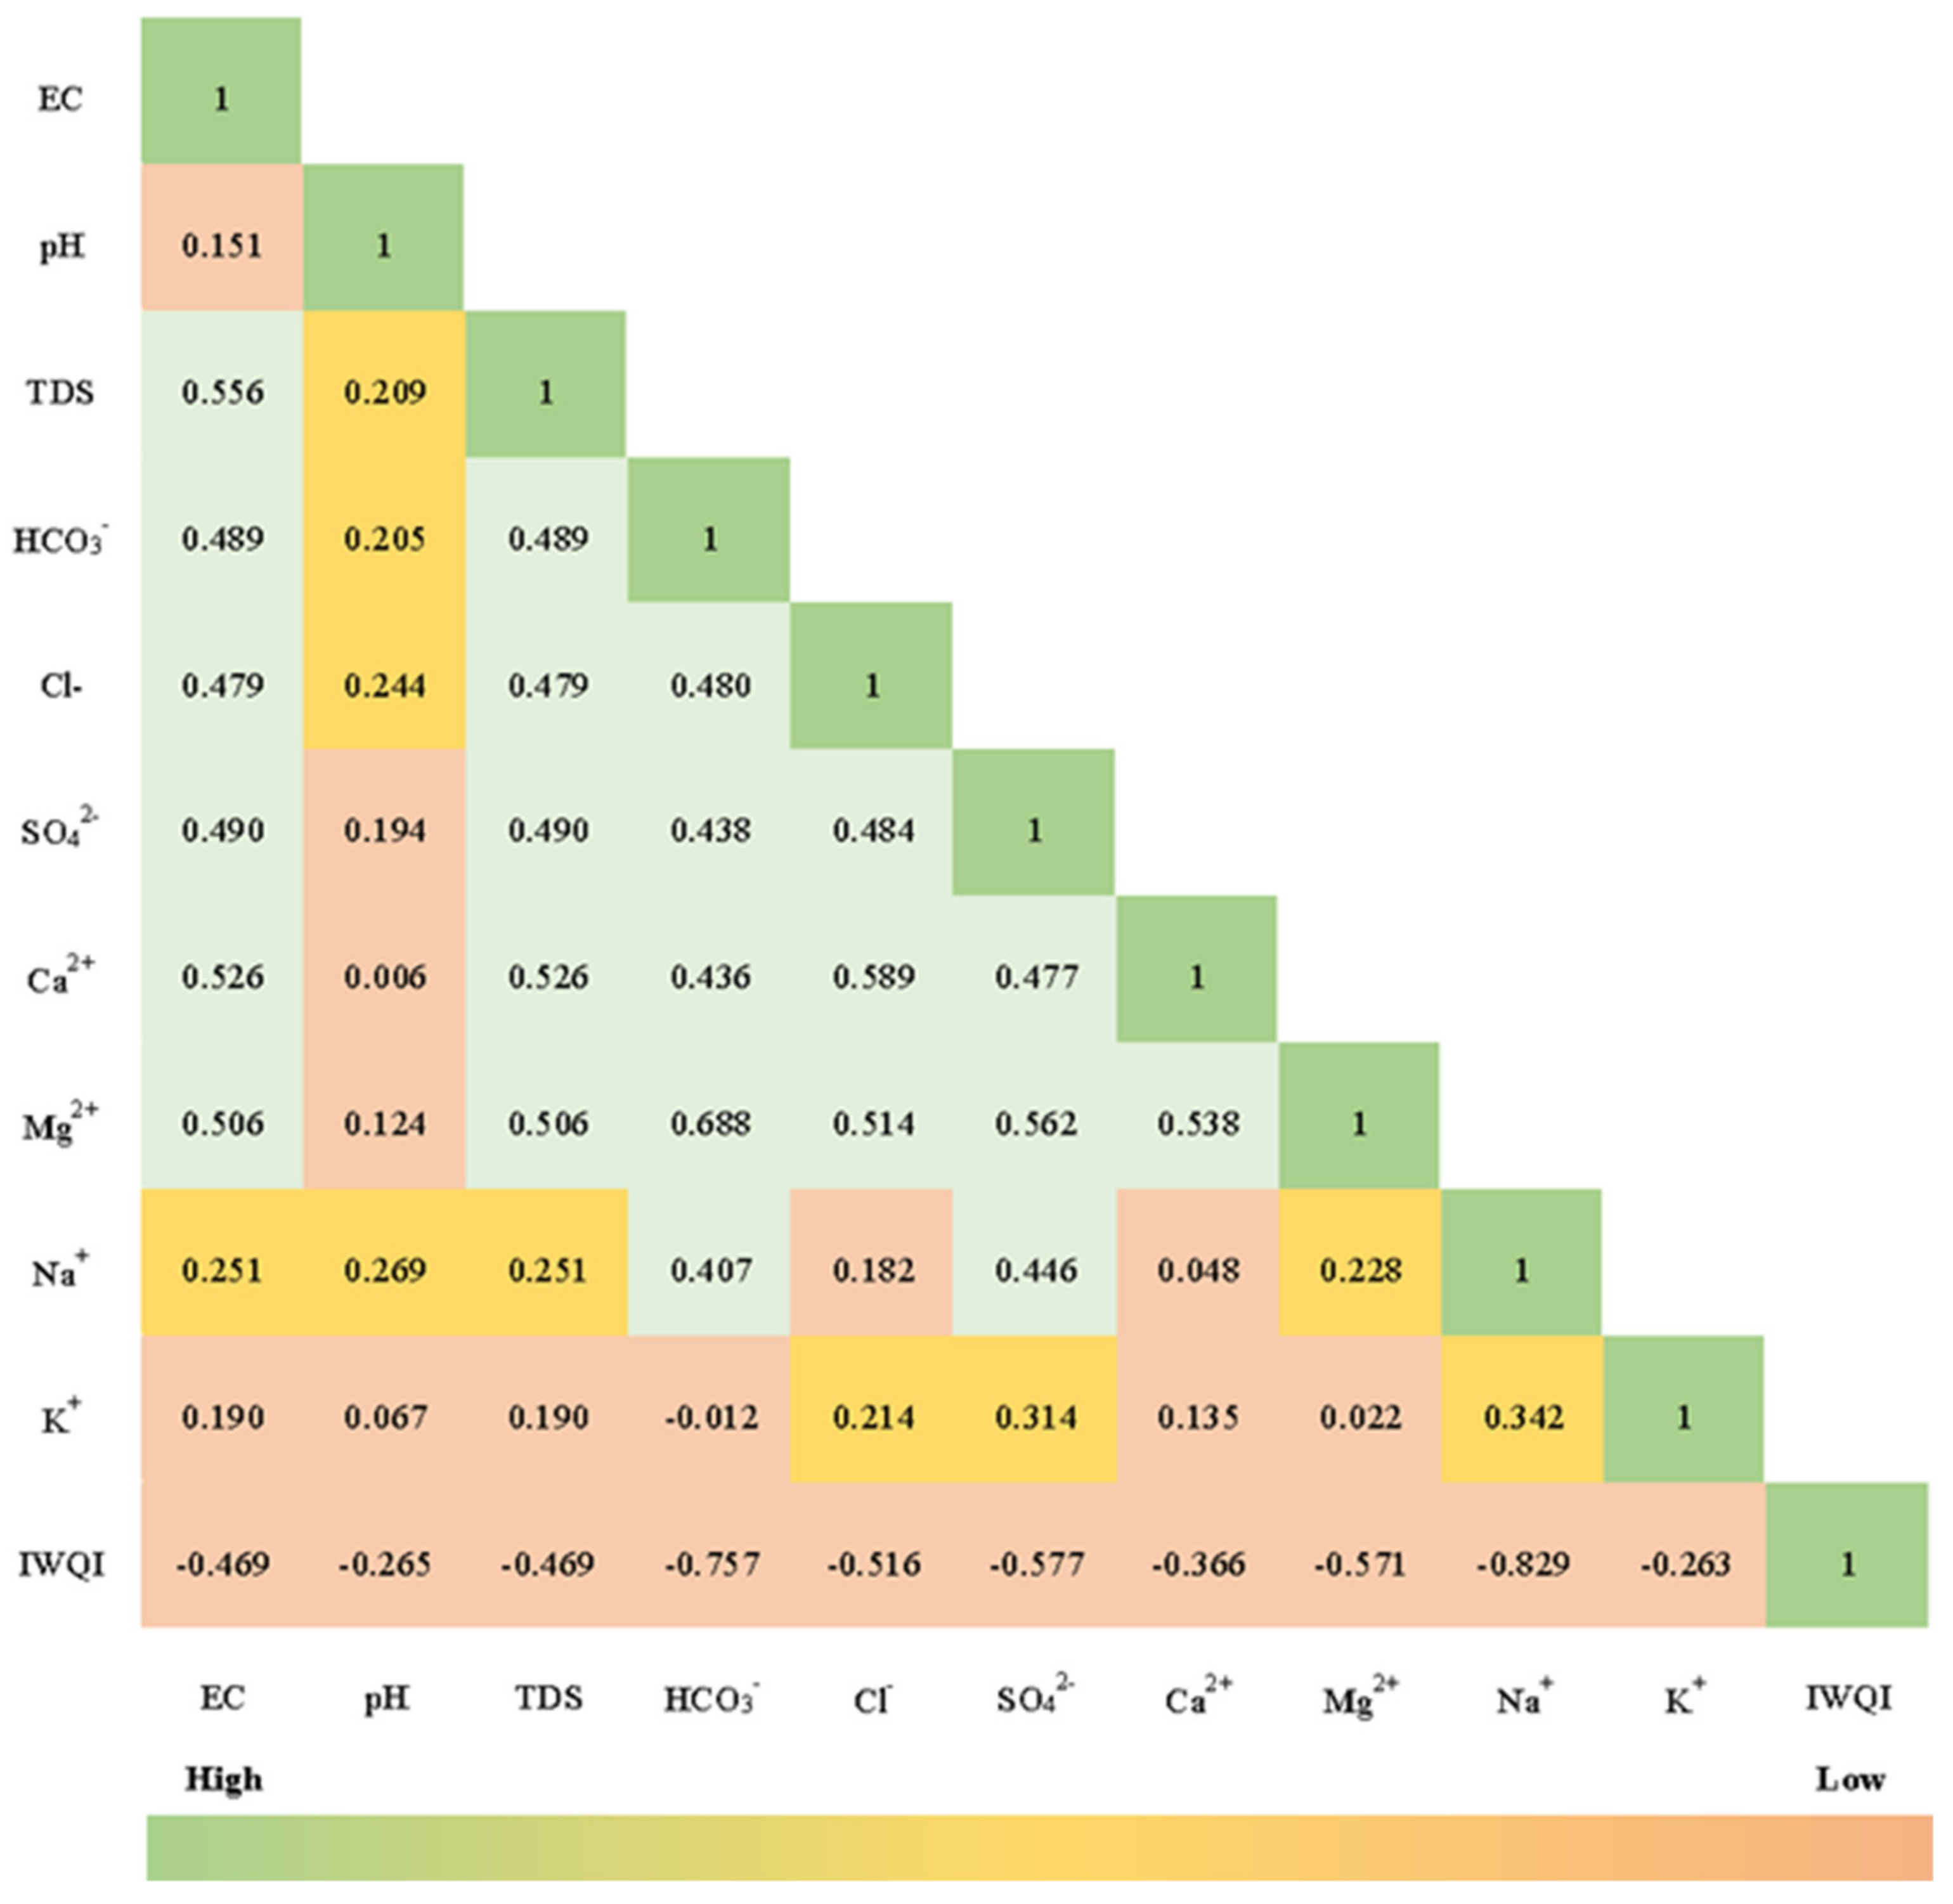
3.3. Multivariate Statistical Analysis

Groundwater quality is affected by various physicochemical variables and the degree of correlation between them can be assessed using a correlation matrix (Figure 22). The relationship between the two variables is established by estimating the correlation coefficient. Pearson was the first to develop this correlation analysis. A positive strong correlation represents the same sources of certain ions, while a weak correlation represents the sources of independent ions [93]. Analysis of the interdependence of variables was carried out by calculating linear Pearson correlation coefficients. It has been assumed that the regression modeling of the potential usefulness of the selected variable (explanatory) to model another variable (explained variable) determines the absolute value of the high correlation coefficient between these two variables. The statistical analysis usually assumes that if the correlation coefficient is >0.9, a very strong linear dependence exists; 0.7–0.9—significant linear dependence; 0.4–0.7—moderate linear dependence; 0.2–0.4—distinct linear dependence, but low; <0.2—no linear dependence [12].
The obtained results also imply moderate linear dependence for EC-TDS; EC-HCO3; EC-Cl; EC-SO4; EC-Ca; EC-Mg; TDS-HCO3; TDS-Cl; TDS- SO4; TDS-Ca; TDS-Mg; HCO3−Cl; HCO3-SO4; HCO3-Ca; HCO3-Mg; HCO3-Na; Cl-SO4; Cl-Ca; Cl-Mg; SO4-Ca; SO4-Mg; SO4-Na; Ca-Mg; end for EC-Na; EC-K; pH-TDS; pH- HCO3; pH-Cl; pH-Na; TDS-Na; Cl-Na; SO4-K; Mg-Na; Na-K distinct linear dependence, while for the rest of observed parameters there is no linear dependence (Figure 22).
The ion of Cl shows a moderate correlation with Mg2+, which indicates the possible leaching of secondary salts. The combination of SO42− with Ca2+ and Mg2+ can lead to the formation of insoluble salts such as CaSO4 and MgSO4, and the irrigation of arable soil with water containing these salts can cause their deposition on the surface and worsen its salinity, which affects the ecological environment of certain parts of the research area.
The correlation coefficients of TDS with HCO3, Cl, SO42−, Ca2+ and Mg2+ were higher than 0.4, which suggests that these five ions were dominant in the samples of tested irrigation water. Among these pairs, the correlation coefficient of HCO3− and Mg2+ was the highest.
Several multivariate methods have been included in cluster analysis to identify the right groups of data sets, with similar groups belonging to the same class [94,95]. In cluster analysis, groups are divided based on similarity levels, and a dendrogram is formed where observations are combined. Cluster analysis (CA) was applied to determine the sources of changes in water resource quality by combining primary variables into a new set of variables. The results of the CA’s basic physical and chemical parameters are presented (Figure 23). Two types of grouping were singled out, with the following parameters grouped in the same, Cluster I: CO32, Na+, K+, pH, and the others in Cluster II, which was divided into two subclusters representing EC, Mg2+, HCO3− in one group and Cl, Ca2+, TDS, SO42− in the other group.
The obtained results confirm that in the tested samples of water for irrigation the dominant cations were Ca2+, Mg2+, Na+, and K+, i.e., HCO3, SO42−, CCO32− were the dominant anions. These data are in agreement with the Piper diagram due to the effects of evaporation, weather, and anthropogenic influences. The interaction between geological substrate and water presented in Gibbs and Chadha’s diagrams was also confirmed.

4. Conclusions

The assessment of the suitability of 215 tested irrigation water samples in the research area was performed based on the assessment of the hydrochemical results through the classifications SAR, Na%, RSC, PI, EC, TDS, MH, KI, PS, TH, IWQI. Most of the tested samples were suitable for irrigation and only a small number of samples were not suitable for the application.
Using the irrigation water quality index (IWQI), which was assessed based on comparing irrigation water quality parameters with specific standards with one value, it was determined that 95.34% of the tested samples were ranked as excellent and good, while poor and very poor were recorded in 4.66% of samples. By presenting the obtained results through Wilcox, Doneen, and USSL diagrams, the obtained results of observations were confirmed. The Piper’s diagram showed that the dominant type of irrigation water in the study area was HCO3-Ca, Mg, which was found in 90.23% of the tested samples.
Based on Chadha’s diagram, it was found that 90.21% of the tested irrigation water samples belong to the Ca2+-HCO3 type, followed by 6.97% samples of the Na+-HCO3 type, and 2.79% samples of the Ca2+-Mg2+Cl type, which is as per Piper’s diagram. The Gibbs diagram determined that there was no significant correlation between the analyzed parameters and that the probable disposal of untreated wastewater, either from industry or anthropogenic origin, led to increased concentrations of Ca2+ in some samples of irrigation water.
Industrial and intensive agricultural production, as well as anthropogenic pollution by the inflow from urban domestic sewage near the sampling site, were most likely the cause of inadequate quality irrigation water samples.
The graphical presentation of each of the examined parameters highlights the risk zones based on which it is possible to propose the application of some of the measures that will contribute to mitigating or eliminating identified deficiencies and problems. This will improve the current reporting approach and provide a basis for monitoring the quality of irrigation water in existing and planned irrigation systems.
This paper emphasizes the need to establish a real-time monitoring system for irrigation water quality at the research site. As the study area is characterized by intensive agricultural production, as such, it requires the establishment of continuous monitoring and risk management through tools for generating rapid reports, which would be primarily useful to policymakers and decision-makers on the use of irrigation water of the appropriate quality. It can be concluded that reporting can be carried out using the irrigation water quality index (IWQI).

Author Contributions

Conceptualization, R.P., A.S.-S., J.M. and Z.D.; fieldwork, R.P., A.S.-S. and J.M.; methodology, R.P., Z.D., H.M. and D.J.; software, D.J.; validation, A.S.-S., J.M. and Z.D.; formal analysis, J.M. and Z.D.; investigation, R.P., A.S.-S., J.M. and Z.D.; resources, R.P., A.S.-S., J.M., D.J., D.V. and Z.D.; data curation, R.P. and D.J.; writing—original draft preparation, R.P. and A.S.-S.; writing—review and editing, R.P., A.S.-S., J.M., D.J. and Z.D.; supervision, R.P.; project administration, R.P. All authors have read and agreed to the published version of the manuscript.

Funding

The study was financially supported by the Ministry of Education and Science of the Republic of Serbia, Project 451-03-68/2022-14/200011.

Institutional Review Board Statement

Not applicable.

Informed Consent Statement

Not applicable.

Data Availability Statement

All data are provided as tables and figures.

Acknowledgments

Ministry of Agriculture, Water Management and Forestry, Agricultural Land Administration, Republic of Serbia.

Conflicts of Interest

The authors declare that they have no known competing financial interest or personal relationships that could have appeared to influence the work reported in this paper.

References

  1. Pivić, R.; Dinić, Z.; Stanojković Sebić, A. Irrigation Water Quality of Drina River in Republic of Serbia; LAP Lambert Academic Publishing, OmniScriptum GmbH & Co KG: Sunnyvale, CA, USA; Saarbrücken, Germany, 2017; p. 84. [Google Scholar]
  2. Pivić, R.; Stanojković Sebić, A.; Maksimović, J.; Dinić, D. Soils of central Serbia areas and quality of available water for irrigation. Serbian Academy of Sciences and Arts. In Rational Use of Land and Water in Serbia, Proceedings of the III Scientific Meeting of the Department of Chemical and Biological Sciences, Banja Koviljaca, Serbia, 25 September 2020; Serbian Academy of Sciences and Arts: Belgrade, Serbia, 2020; pp. 71–87. (In Serbian) [Google Scholar]
  3. Statistical Office of the Republic of Serbia. Report of Irrigation in 2021; Statistical Office Republic of Serbia: Belgrade, Serbia, No. 002-year LXXII; 2021. (In Serbian) [Google Scholar]
  4. Ramakrishnaiah, C.R.; Adashiv, C.; Ranganna, G. Assessment of water quality index for the groundwater in Tumkur Taluk, Karnataka State, India. E-J. Chem. 2009, 6, 523–530. [Google Scholar] [CrossRef] [Green Version]
  5. Ayers, R.S.; Westcot, D.W. Water Quality for Agriculture; FAO Irrigation and Drainage Paper: Rome, Italy, 1985; p. 29. [Google Scholar]
  6. Mirabbasi, R.; Mazloumzadeh, S.M.; Rahnama, M.B. Evaluation of irrigation water quality using fuzzy logic. Res. J. Environ. Sci. 2008, 2, 340–352. [Google Scholar] [CrossRef] [Green Version]
  7. Yıldız, S.; Karakuş, C.B. Estimation of irrigation water quality index with development of an optimum model: A case study. Environ. Dev. Sustain. 2020, 22, 4771–4786. [Google Scholar] [CrossRef]
  8. Carpenter, S.R.; Caraco, N.F.; Correll, D.L.; Howarth, R.W.; Sharpley, A.N.; Smith, V.H. Nonpoint pollution of surface waters with phosphorus and nitrogen. Ecol. Appl. 1998, 8, 559–568. [Google Scholar] [CrossRef]
  9. Jarvie, H.P.; Whitton, B.A.; Neal, C. Nitrogen and phosphorus in east coast British rivers: Speciation, sources and biological significance. Sci. Total Environ. 1998, 210–211, 79–109. [Google Scholar] [CrossRef]
  10. Simeonova, V.; Stratisb, J.A.; Samarac, C.; Zachariadisb, G.; Voutsac, D.; Anthemidis, A.; Sofonioub, M.; Kouimtzisc, T. Assessment of the surface water quality in Northern Greece. Water Res. 2003, 37, 4119–4124. [Google Scholar] [CrossRef]
  11. Ghazaryan, K.; Chen, Y. Hydrochemical assessment of surface water for irrigation purposes and its influence on soil salinity in Tikanlik oasis, China. Environ. Earth Sci. 2016, 75, 383. [Google Scholar] [CrossRef]
  12. Amezketa, E. An integrated methodology for assessing soil salinization, a pre-condition for land desertification. J. Arid. Environ. 2006, 67, 594–606. [Google Scholar] [CrossRef]
  13. Singh, S.; Ghosh, N.C.; Gurjar, S.; Krishan, G.; Kumar, S.; Berwal, P. Index-based assessment of suitability of water quality for irrigation purpose under Indian conditions. Environ. Monit. Assess. 2018, 190, 29. [Google Scholar] [CrossRef]
  14. Singh, A.K.; Mondal, G.C.; Kumar, S.; Singh, T.B.; Tewary, B.K.; Sinha, A. Major ion chemistry, weathering processes and water quality assessment in upper catchment of Damodar River basin, India. Environ Geol. 2008, 54, 745–758. [Google Scholar] [CrossRef]
  15. Etteieb, S.; Cherif, S.; Tarhouni, J. Hydrochemical assessment of water quality for irrigation: A case study of the Medjerda River in Tunisia. Appl. Water Sci. 2017, 7, 469–480. [Google Scholar] [CrossRef] [Green Version]
  16. Zhang, W.; Ma, L.; Abuduwaili, J.; Ge, Y.; Issanova, G.; Saparov, G. Hydrochemical characteristics and irrigation suitability of surface water in the Syr Darya River, Kazakhstan. Environ. Monit. Assess. 2019, 191, 572. [Google Scholar] [CrossRef] [PubMed] [Green Version]
  17. Gad, M.; El-Hattab, M. Integration of water pollution indices and DRASTIC model for assessment of groundwater quality in El Fayoum Depression, Western Desert, Egypt. J. Afr. Earth Sci. 2019, 158, 103554. [Google Scholar] [CrossRef]
  18. Hem, J.D. Study and Interpretation of the Chemical Characteristics of Natural Water; Department of the Interior, US Geological: Alexandria, VA, USA, 1985; Volume 2254, pp. 117–120.
  19. Cieszynska, M.; Wesolowski, M.; Bartoszewicz, M.; Michalska, M.; Nowacki, J. Application of physicochemical data for water-quality assessment of watercourses in the Gdansk Municipality (South Baltic coast). Environ. Monit. Assess. 2012, 184, 2017–2029. [Google Scholar] [CrossRef] [PubMed] [Green Version]
  20. Li, P.; Wu, J.; Qian, H. Assessment of groundwater quality for irrigation purposes and identification of hydrogeochemical evolution mechanisms in Pengyang County, China. Environ. Earth Sci. 2013, 69, 2211–2225. [Google Scholar] [CrossRef]
  21. Fakhre, A. Evaluation of hydrogeochemical parameters of groundwater for suitability of domestic and irrigational purposes: A case study from central Ganga Plain, India. Arab. J. Geosci. 2014, 7, 4121–4131. [Google Scholar] [CrossRef]
  22. Saeedi, M.; Abessi, O.; Sharifi, F.; Meraji, H. Development of groundwater quality index. Environ. Monit. Assess. 2010, 163, 327–335. [Google Scholar] [CrossRef]
  23. Meireles, A.; Andrade, E.M.; Chaves, L.; Frischkorn, H.; Crisostomo, L.A. A new proposal of the classification of irrigation water. Rev. Cienc. Agron. 2010, 413, 349–357. [Google Scholar] [CrossRef] [Green Version]
  24. Abbasnia, A.; Radfard, M.; Mahvi, A.H.; Nabizadeh, R.; Yousefi, M.; Soleimani, H.; Alimohammadi, M. Groundwater quality assessment for irrigation purposes based on irrigation water quality index and its zoning with GIS in the villages of Chabahar, Sistan and Baluchistan, Iran. Data Brief 2018, 19, 623–631. [Google Scholar] [CrossRef]
  25. Batarseh, M.; Imreizeeq, E.; Tilev, S.; Al Alaween, M.; Wael Suleiman, W.; Al Remeithi, A.M.; Al Tamimi, M.K.; Al Alawneh, M. Assessment of groundwater quality for irrigation in the arid regions using irrigation water quality index (IWQI) and GIS-Zoning maps: Case study from Abu Dhabi Emirate, UAE. Groundw. Sustain. Dev. 2021, 14, 100611. [Google Scholar] [CrossRef]
  26. Hussein, H.A.; Ricka, A.; Kuchovsky, T.; El Osta, M.M. Groundwater hydrochemistry and origin in the south-eastern part of Wadi El Natrun, Egypt. Arab. J. Geosci. 2017, 10, 170–184. [Google Scholar] [CrossRef]
  27. Richards, L.A. Diagnosis and Improvement of Saline Alkali Soils. In Agriculture Handbook; US Department of Agriculture: Washington, DC, USA, 1954; Volume 60, p. 160. [Google Scholar]
  28. Wilcox, L.V. Classification and Use of Irrigation Waters; U.S. Department of Agriculture: Washington, DC, USA, 1955; p. 367.
  29. Doneen, L.D. Notes on Water Quality in Agriculture. Published as a Water Science and Engineering; Department of Water Sciences and Engineering, University of California: Oakland, CA, USA, 1964; Volume 4001. [Google Scholar]
  30. Gibbs, R.J. Mechanisms controlling world water chemistry. Science 1970, 170, 10881. [Google Scholar] [CrossRef] [PubMed]
  31. Gad, M.; El Osta, M. Geochemical controlling mechanisms and quality of the groundwater resources in El Fayoum Depression, Egypt. Arab. J. Geosci. 2020, 13, 861. [Google Scholar] [CrossRef]
  32. Kamtchueng, B.T.; Fantong, W.Y.; Wirmvem, M.J. Hydrogeochemistry and quality of surface water and groundwater in the vicinity of Lake Monoun, West Cameroon: Approach from multivariate statistical analysis and stable isotopic characterization. Environ. Monit. Assess. 2016, 188, 524. [Google Scholar] [CrossRef]
  33. Rakotondrabe, F.; Ngoupayou, J.R.; Mfonka, Z. Water quality assessment in the Betare-Oya gold mining area (East-Cameroon): Multivariate statistical analysis approach. Sci. Total Environ. 2018, 610, 831–844. [Google Scholar] [CrossRef] [PubMed]
  34. Li, P.; Tian, R.; Liu, R. Solute geochemistry and multivariate analysis of water quality in the Guohua Phosphorite Mine, Guizhou Province, China. Expo. Health 2019, 11, 81–94. [Google Scholar] [CrossRef]
  35. Tanasijević, Đ.; Antonović, G.; Aleksić, Ž.; Pavićević, N.; Filipović, Đ.; Spasojević, M. The Soils of the West and Northwestern Serbia; Institute of Soil Science in Topčider: Belgrade, Serbia, 1966. (In Serbian) [Google Scholar]
  36. Tanasijević, Đ.; Antonović, G.; Kovačević, R.; Aleksić, Ž.; Pavićević, N.; Filipović, Đ.; Jeremić, M.; Vojinović, Ž.; Spasojević, M. The Soils of the Velika Morava and Mlava basin; Institute of Soil Science in Topčider: Belgrade, Serbia, 1965. (In Serbian) [Google Scholar]
  37. IUSS Working Group WRB. World Reference Base for Soil Resources 2014. International Soil Classification System for Naming soils and Creating Legends for Soil Maps. Update 2015; World Soil Resources Reports; FAO: Rome, Italy, 2015; Volume 106. [Google Scholar]
  38. Z1.111:1987; Measurement of pH—Potentiometric Method. Institute for Standardization of Serbia SRPS: Belgrade, Serbia, 1987.
  39. SRPS EN 27888:1993; Determination of Electrical Conductivity. Institute for Standardization of Serbia SRPS: Belgrade, Serbia, 1993.
  40. APHA. Standard Methods for the Examination of Water and Wastewater, 18th ed.; Greenberg, A.E., Clesceri, L.S., Eaton, A.D., Eds.; American Public Health Association: Washington, DC, USA, 1992. [Google Scholar]
  41. Rhoades, J.D.; Kandiah, A.; Mashali, M. The Use of Saline Waters for Crop Production—FAO Irrigation & Drainage Paper; FAO: Rome, Italy, 1992; Volume 48. [Google Scholar]
  42. ISO 11885:2007; Water Quality—Determination of Selected Elements by Inductively Coupled Plasma Optical Emission Spectrometry (ICP-OES). ISO: Geneva, Switzerland, 2007.
  43. APHA. Standard Methods for the Examination of Water and Wastewater, 21st ed.; American Public Health Association/American Water Works Association/Water Environment Federation: Washington, DC, USA, 2005.
  44. Li, P.; Zhang, Y.; Yang, N.; Jing, L.; Yu, P. Major ion chemistry and quality assessment of groundwater in and around a mountainous tourist town of China. Expo. Health 2016, 8, 239–252. [Google Scholar] [CrossRef]
  45. Deutsch, W.J. Groundwater Geochemistry Fundamentals and Application to Contamination; Lewis Publishers: Boca Raton, FL, USA, 1997. [Google Scholar]
  46. Raghunath, H.M. Groundwater, 2nd ed.; Wiley Eastern Ltd.: New Delhi, India, 1987; p. 563. [Google Scholar]
  47. Kelley, W.P. Use of saline irrigation water. Soil Sci. 1963, 95, 385–391. [Google Scholar] [CrossRef]
  48. Durfor, C.N.; Becker, E. Public Water Supplies of the 100 Largest Cities in the United States. Water Supply Paper; Government Publishing Office: Washington, DC, USA, 1964; Volume 1812, pp. 343–346. [CrossRef]
  49. Begum, A.; Harikrishna, R. Study on the Quality of Water in Some Streams of Cauvery River. J. Chem. 2008, 2, 377–384. [Google Scholar] [CrossRef] [Green Version]
  50. Narsimha, A.; Sudarshan, V. Contamination of fluoride in groundwater and its effect on human health: A case study in hard rock aquifers of Siddipet, Telangana State, India. Appl. Water Sci. 2017, 7, 2501–2512. [Google Scholar] [CrossRef] [Green Version]
  51. Adimalla, N.; Venkatayogi, S. Geochemical characterization and evaluation of groundwater suitability for domestic and agricultural utility in semi-arid region of Basara, Telangana State, South India. Appl. Water Sci. 2018, 8, 44. [Google Scholar] [CrossRef] [Green Version]
  52. Sharma, D.A.; Rishi, M.S.; Keesari, T. Evaluation of groundwater quality and suitability for irrigation and drinking purposes in southwest Punjab, India using hydrochemical approach. Appl. Water Sci. 2017, 7, 3137–3150. [Google Scholar] [CrossRef] [Green Version]
  53. Almeida, C.; Quintar, S.; González, P.; Mallea, M. Assessment of irrigation water quality. A proposal of a quality profile. Environ. Monit. Assess. 2008, 142, 149–152. [Google Scholar] [CrossRef] [PubMed]
  54. Todd, D.K. Groundwater Hydrology, 1st ed.; John Wiley and Sons, Inc.: Hoboken, NJ, USA, 1960; p. 336. [Google Scholar]
  55. González-Acevedo, Z.I.; Padilla-Reyes, D.A.; Ramos-Leal, J.A. Quality assessment of irrigation water related to soil salinization in Tierra Nueva, San Luis Potosí, Mexico. Rev. Mex. De Cienc. Geológicas 2016, 33, 271–285. [Google Scholar]
  56. Rao, N.K.; Latha, P.S. Groundwater quality assessment using water quality index with a special focus on vulnerable tribal region of Eastern Ghats hard rock terrain, Southern India. Arab. J. Geosci. 2019, 12, 267. [Google Scholar] [CrossRef]
  57. Sutradhar, S.; Mondal, P. Groundwater suitability assessment based on water quality index and hydrochemical characterization of Suri Sadar Sub-division, West Bengal. Ecol. Inform. 2021, 64, 101335. [Google Scholar] [CrossRef]
  58. Vasanthavigar, M.; Srinivasamoorthy, K.; Prasanna, M.V. Evaluation of groundwater suitability for domestic, irrigational, and industrial purposes: A case study from Thirumanimuttar river basin, Tamilnadu, India. Environ Monit Assess. 2012, 184, 405–420. [Google Scholar] [CrossRef]
  59. Taloor, A.K.; Pir, R.A.; Adimalla, N.; Ali, S.; Manhas, D.S.; Roy, S.; Singh, A.K. Spring water quality and discharge assessment in the Basantar watershed of Jammu Himalaya using geographic information system (GIS) and water quality Index (WQI). Groundw. Sustain. Dev. 2020, 10, 100364. [Google Scholar] [CrossRef]
  60. Salifu, M.; Aidoo, F.; Hayford, M.S.; Adomako, D.; Asare, E. Evaluating the suitability of groundwater for irrigational purposes in some selected districts of the Upper West region of Ghana. Appl. Water Sci. 2017, 7, 653–662. [Google Scholar] [CrossRef]
  61. Eaton, F.M. Significance of carbonates in irrigation waters. Soil Sci. 1950, 69, 123–134. [Google Scholar] [CrossRef]
  62. Singaraja, C. Relevance of water quality index for groundwater quality evaluation: Thoothukudi District, Tamil Nadu, India. Appl. Water Sci. 2017, 7, 2157–2173. [Google Scholar] [CrossRef]
  63. Ravikumar, P.; Mehmood, M.A.; Somasheka, R.K. Water quality index to determine the surface water quality of Sankey tank and Mallathahalli lake, Bangalore urban district, Karnataka, India. Appl. Water Sci. 2013, 3, 247–261. [Google Scholar] [CrossRef] [Green Version]
  64. Rawat, K.S.; Singh, S.K.; Gautam, S.K. Assessment of groundwater quality for irrigation use: A peninsular case study. Appl. Water Sci. 2018, 8, 233. [Google Scholar] [CrossRef] [Green Version]
  65. Singh, K.K.; Tewari, G.; Kumar, S. Evaluation of groundwater quality for suitability of irrigation purposes: A Case Study in the Udham Singh Nagar, Uttarakhand. J. Chem. 2020, 2020, 6924026. [Google Scholar] [CrossRef]
  66. Li, P.; Wu, J.; Qian, H.; Zhang, Y.; Yang, N.; Jing, L.; Yu, P. Hydrogeochemical characterization of groundwater in and around a wastewater irrigated forest in the southeastern edge of the Tengger Desert, Northwest China. Expo. Health 2016, 8, 331–348. [Google Scholar] [CrossRef]
  67. El-Amier, Y.A.; Kotb, W.K.; Bonanomi, G.; Fakhry, H.; Marraiki, N.A.; Abd-ElGawad, A.M. Hydrochemical Assessment of the Irrigation Water Quality of the El-Salam Canal, Egypt. Water 2021, 13, 2428. [Google Scholar] [CrossRef]
  68. Szabolcs, I.; Darab, C. The Influence of Irrigation Water of High Sodium Carbonate Content of Soils. In Proceedings of the 8th International Congress of ISSS, Bucharest, Romania, 31 August–9 September 1964; Volume II, pp. 803–812. [Google Scholar]
  69. Keesari, T.; Kulkarni, U.P.; Deodhar, A.; Ramanjaneyulu, P.S.; Sanjukta, A.K.; Kumar, U.S. Geochemical characterization of groundwater from an arid region in India. Environ. Earth Sci. 2014, 71, 4869–4888. [Google Scholar] [CrossRef]
  70. Kelley, W.P. Permissible Composition and Concentration of Irrigated Waters. Proc. Am. Soc. Civ. Eng. 1940, 66, 607–613. [Google Scholar]
  71. Dhembare, A.J. Assessment of water quality indices for irrigation of Dynaneshwar Dam Water, Ahmednagar, Maharashtra, India. Arch. Appl. Sci. Res. 2012, 4, 348–352. [Google Scholar]
  72. Sundaray, S.K.; Nayak, B.B.; Bhatta, D. Environmental studies on river water quality with reference to suitability for agricultural purposes: Mahanadi river estuarine system, India—A case study. Environ. Monit. Assess. 2009, 155, 227–243. [Google Scholar] [CrossRef]
  73. He, S.; Li, P. A MATLAB based graphical user interface (GUI) for quickly producing widely used hydrogeochemical diagrams. Geochemistry 2019, 80, 125550. [Google Scholar] [CrossRef]
  74. Sadashivaiah, C.; Ramakrishnaiah, C.; Ranganna, G. Hydrochemical analysis and evaluation of groundwater quality in tumkur taluk, Karnataka state, India. Int. J. Environ. Res. Publ. Health 2008, 5, 158–164. [Google Scholar] [CrossRef] [PubMed]
  75. Adimalla, N.; Taloor, A.K. Hydrogeochemical investigation of groundwater quality in the hard rock terrain of South India using Geographic Information System (GIS) and groundwater quality index (GWQI) techniques. Groundw. Sustain. Dev. 2020, 10, 100288. [Google Scholar] [CrossRef]
  76. Stoner, J.D. Water-Quality Indices for Specific Water Uses; Department of the Interior, Geological Survey: Arlington, VA, USA, 1978; p. 12. [CrossRef] [Green Version]
  77. Bortolini, L.; Maucieri, C.; Borin, M. A tool for the evaluation of irrigation water quality in the arid and semi-arid regions. Agronomy 2018, 8, 23. [Google Scholar] [CrossRef] [Green Version]
  78. Spandana, M.P.; Suresh, K.R.; Prathima, B. Developing an irrigation water quality index for vrishabavathi command area. Int. J. Eng. Res. Technol. 2013, 2, 821–830. [Google Scholar]
  79. Zaman, M.; Shahid, S.A.; Heng, L. Irrigation Water Quality. In Guideline for Salinity Assessment, Mitigation and Adaptation Using Nuclear and Related Techniques; Springer International Publishing: Cham, Switzerland, 2018; p. 113. [Google Scholar] [CrossRef] [Green Version]
  80. Piper, A.M. A graphic procedure in the geochemical interpretation of water-analyses. EOS Trans. Am. Geophys. Union. 1944, 25, 914–928. [Google Scholar] [CrossRef]
  81. Appelo, C.A.J.; Postma, D.; Balkema, A.A. Geochemistry, Groundwater and Pollution; Balkema, A.A., Ed.; Cambridge University Press: Rotterdam, The Netherlands, 1993; p. 536. [Google Scholar]
  82. El Osta, M.; Milad Masoud, M.; Alqarawy, A.; Elsayed, S.; Gad, M. Groundwater Suitability for Drinking and Irrigation Using Water Quality Indices and Multivariate Modeling in Makkah Al-Mukarramah Province, Saudi Arabia. Water 2022, 14, 483. [Google Scholar] [CrossRef]
  83. Chadha, D.K. A proposed new diagram for geochemical classification of natural waters and interpretation of chemical data. Hydrogeol. J. 1999, 7, 431–439. [Google Scholar] [CrossRef]
  84. Varol, S.; Davraz, A. Assessment of geochemistry and hydrogeochemical processes in groundwater of the Tefenni plain (Burdur/Turkey). Environ. Earth Sci. 2014, 71, 4657–4673. [Google Scholar] [CrossRef]
  85. Roy, A.; Keesari, T.; Mohokar, H.; Sinha, U.K.; Bitra, S. Assessment of groundwater quality in hard rock aquifer of central Telangana state for drinking and agriculture purposes. Appl. Water Sci. 2018, 8, 124. [Google Scholar] [CrossRef] [Green Version]
  86. Chen, J.; Huang, Q.; Lin, Y.; Fang, Y.; Qian, H.; Liu, R.; Ma, H. Hydrogeochemical Characteristics and Quality Assessment of Groundwater in an Irrigated Region, Northwest China. Water 2019, 11, 96. [Google Scholar] [CrossRef] [Green Version]
  87. Xu, P.; Feng, W.; Qian, H.; Zhang, Q. Hydrogeochemical Characterization and Irrigation Quality Assessment of Shallow Groundwater in the Central-Western Guanzhong Basin, China. Int. J. Environ. Res. Public Health 2019, 16, 1492. [Google Scholar] [CrossRef] [PubMed] [Green Version]
  88. Wu, J.; Li, P.; Qian, H. Hydrochemical characterization of drinking groundwater with special reference to fluoride in an arid area of China and the control of aquifer leakage on its concentrations. Environ. Earth Sci. 2015, 73, 8575–8588. [Google Scholar] [CrossRef]
  89. Nurlan, S.S. Current hydroecological state of the lower watercourse of Syrdarya and use of her resources of the drain. Astrakhan Bull. Ecol. Educ. 2017, 2, 50–55. [Google Scholar]
  90. Issanova, G.; Jilili, R.; Abuduwaili, J.; Kaldybayev, A.; Saparov, G.; Yong Xiao, G. Water availability and state of water resources within water-economic basins in Kazakhstan. Paddy Water Environ. 2018, 16, 183–191. [Google Scholar] [CrossRef]
  91. Karlykhanov, O.K.; Toktaganova, G.B. The assessment of irrigated land salinization in the Aral Sea Region. Int. J. Environ. Sci. Educ. 2016, 11, 7946–7960. [Google Scholar]
  92. Pearson, K. Mathematical Contributions to the Theory of Evolution. III. Regression, Heredity, and Panmixia. Philos. Trans. R. Soc. A Math. Phys. Eng. Sci. 1896, 187, 253–318. [Google Scholar] [CrossRef] [Green Version]
  93. Islam, A.R.M.T.; Mamun, A.A.; Rahman, M.M.; Zahid, A. Simultaneous comparison of modified-integrated water quality and entropy weighted indices: Implication for safe drinking water in the coastal region of Bangladesh. Ecol. Indic. 2020, 113, 106229. [Google Scholar] [CrossRef]
  94. Danielsson, Å.; Cato, I.; Carman, R.; Rahm, L. Spatial clustering of metals in the sediments of the Skagerrak/Kattegat. Appl. Geochem. 1999, 14, 689–706. [Google Scholar] [CrossRef]
  95. Lattin, J.M.; Carroll, J.D.; Green, P.E.; Green, P.E. Analyzing Multivariate Data; Thomson Brooks/Cole: Pacific Grove, CA, USA, 2003. [Google Scholar]
Figure 1. Study area with locations of sampling points.
Agronomy 12 01177 g001
Figure 2. Geological map of the study area.
Agronomy 12 01177 g002
Figure 3. Pedological map of the study area.
Agronomy 12 01177 g003
Figure 4. Spatial distribution maps of EC.
Agronomy 12 01177 g004
Figure 5. Spatial distribution maps of TDS.
Agronomy 12 01177 g005
Figure 6. Spatial distribution maps of TH.
Agronomy 12 01177 g006
Figure 7. Spatial distribution of SAR.
Agronomy 12 01177 g007
Figure 8. The plot of sodium percentage versus electrical conductivity [26].
Agronomy 12 01177 g008
Figure 9. Spatial distribution of Na %.
Agronomy 12 01177 g009
Figure 10. Spatial distribution of RSC.
Agronomy 12 01177 g010
Figure 11. Doneen classification of irrigation water quality based on PI.
Agronomy 12 01177 g011
Figure 12. Spatial distribution of PI.
Agronomy 12 01177 g012
Figure 13. Spatial distribution of MH.
Agronomy 12 01177 g013
Figure 14. Spatial distribution of KI.
Agronomy 12 01177 g014
Figure 15. Spatial distribution of PS.
Agronomy 12 01177 g015
Figure 16. USSL diagram of water samples.
Agronomy 12 01177 g016
Figure 17. Spatial distribution of IWQI.
Agronomy 12 01177 g017
Figure 18. Piper’s diagram for water samples.
Agronomy 12 01177 g018
Figure 19. Geochemical classification based on Chadha’s diagram.
Agronomy 12 01177 g019
Figure 20. Gibbs diagram: (a) TDS vs. Na/(Na+Ca); (b) Cl/(Cl+HCO3).
Agronomy 12 01177 g020
Figure 21. Major cation and anion relationships with ionic ratios (a) Na+ vs. Cl, (b) SO42− vs. Cl, (c) Na+-Cl vs. Ca2++Mg2+-(HCO3+CO32−+SO42−), (d) Na+ vs. Ca2++Mg2+, (e) Ca2++Mg2+ vs. Na++HCO3−, (f) Na+ vs. SO42− on water samples.
Agronomy 12 01177 g021aAgronomy 12 01177 g021b
Figure 22. Correlation matrix of hydrochemical parameters.
Agronomy 12 01177 g022
Figure 23. Cluster analysis (CA) for water physiochemical parameters for major ions.
Agronomy 12 01177 g023
Table 1. Irrigation water quality parameters and their proposed limiting values.
qiECSARNaClHCO3
(μS m−1)((mmol L−1)0.5)(meq L−1)(meq L−1)(meq L−1)
85–100[200–750)[2–3)[2–3)[1–4)[1–1.5)
60–85[750–1500)[3–6)[3–6)[4–7)[1.5–4.5)
35–60[1500–3000)[6–12)[6–9)[7–10)[4.5–8.5)
0–35EC < 200 orSAR < 2 orNa < 2 orCl < 1 orHCO3 < 1 or
EC ≥ 3000SAR ≥ 12Na ≥ 9Cl ≥ 10HCO3 ≥ 8.5
Table 2. The weights of the IWQI parameters.
ParametersWi
[EC]0.211
[Na]0.204
[HCO3]0.202
[Cl]0.194
[SAR]0.189
Total1
Table 3. Physicochemical water characteristics.
ParametersUnitRangeMean STDEV
pH/6.20–8.907.73±0.47
ECµSm−120–2260650.91±370.02
TDSmg L−150–2800497.42±359.76
CO32−meq L−10.00–14.704.47±2.49
HCO3meq L−10.00–3.600.83±0.56
Clmeq L−10.10–6.121.04±0.80
SO42−meq L−10.05–6.021.05±0.82
Ca2+meq L−10.46–11.033.85±1.84
Mg2+meq L−10.16–10.912.54±1.71
K+meq L−10.01–12.41.60±2.15
Na+meq L−10.01–4.300.48±0.53
Table 4. Irrigation water suitability.
Classification PatternSample RangeCategoriesRangesDescriptionNumber of SamplesSample (%)
Min.MaxMeanSTDEV
Sodium absorption ratio (SAR) [27]0.0110.340.931.27Excellent0–10Don’t have sodium hazard21499.53
Good10–18Low sodium hazard10.47
Fair18–26Harmful for almost all types of soils
Poor>26Unsuitable for irrigation
Percent sodium (% Na) [28]0.4951.8918.809.86Excellent0–20Excellent for irrigation13663.26
Good20–40Good for irrigation7233.49
Permissible40–60Permissible for irrigation73,26
Doubtful60–80Doubtful for irrigation
Unsuitable>80Unsuitable for irrigation
Residual sodium carbonate (RSC) [27]−8.7914.16−1.082.62Good<1.25Generally safe for irrigation19791.63
Medium1.25–2.5Marginal as an irrigation source
Bad>2.5Generally not suitable for irrigation without improvement188.37
Permeability index (PI) [29]0.071.190.480.17Class-I>75Good for irrigation20193.49
Class-II25–75Suitable for irrigation94.19
Class-III<25Unsuitable for irrigation52.33
Electrical conductivity (EC, µS cm−1) [28]20.002260.00650.91370.02Good250–750Medium salinity water13562.79
Permissible750–2250High-salinity water7936.74
Doubtful2250–5000Doubtful for irrigation10.47
Unsuitable>5000Unsuitable for irrigation
Total dissolved salts (TDS, mg L−1) [27]50.00280000497.42359.76Excellent<150Low salinity hazard83.72
Good150–500Permissible for irrigation13462.33
Fair500–1500Doubtful for irrigation6932.09
Poor>1500Unsuitable for irrigation41.86
Magnesium Hazard (MH) [46]4.9477.6838.3512.55MH<50%Suitable17385.12
MH>50%Unsuitable3214.88
Kelly’s Index (KI) [47]0.004.420.290.42KI<1Suitable20293.95
KI>1Unsuitable136.05
Potential Salinity (PS) (meq L−1) [29]0.287.321.571.06PS<3.0Excellent to good19791.63
PS3.0–5.0Good to injurious156.98
PS>5.0Injurious to unsatisfactory31.4
Total Hardness (TH) (meq L−1) [48]0.7017.176.383.11TH0–60Soft215100
TH61–120Moderate
TH121–180Hard
TH>181Very hard
IWQI [23]52.9699.4289.559.19ClassI85–100Excellent 16476.27
ClassII70–85Good4119.07
ClassIII55–70Poor73.26
ClassIV40–55Very poor31.4
ClassV0–40Unsuitable
Table 5. Classification of water quality for investigated sites based on IWQI.
IWQI Exploitation RestrictionsRecommendation
SoilCrops
(85–100) No restriction (NR)Water can be used for almost all types of soil. Soil is exposed to lower risks of salinity/sodicity problemsNo toxicity risk for most plants
(70–85) Low restriction (LR)Irrigated soils with a light texture or moderate permeability can be adapted to this range. To avoid soil sodicity in heavy textures, soil leaching is recommended.Elevated risks for salt sensitive plants
(55–70) Moderate restriction (MR)The water in this range would be better used for soils with moderate to high permeability values. Moderate leaching of salts is highly recommended to avoid soil degradation.Plants with moderate tolerance to salts may be grow
(40–55) High restriction (HR)This range of water can be used in soils with high permeability without compact layers. High frquency irrigation scheduleSuitable for irrigation of plants with moderate to high tolerance to salts with special salinity control practices, except water with low Na, Cl and HCO3 values
(0–40)Severe restrictionUsing this range of water for irrigaion under normal conditions should be avoided.Only plants with high salt tolerance, except for waters with extremely low values of Na, Cl and HCO3.
Publisher’s Note: MDPI stays neutral with regard to jurisdictional claims in published maps and institutional affiliations.

