Article

Genetic Mapping and Candidate Gene Prediction of a QTL Related to Early Heading on Wild Emmer Chromosome 7BS in the Genetic Background of Common Wheat

1
The Key Laboratory for Quality Improvement of Agricultural Products of Zhejiang Province, College of Advanced Agricultural Sciences, Zhejiang A&F University, Hangzhou 311300, China
2
Tonglu County Agricultural Technology Extension Centre, Hangzhou 311500, China
*
Author to whom correspondence should be addressed.
Agronomy 2022, 12(5), 1089; https://doi.org/10.3390/agronomy12051089
Submission received: 16 March 2022 / Revised: 21 April 2022 / Accepted: 25 April 2022 / Published: 29 April 2022
(This article belongs to the Special Issue Wheat Agronomic and Quality Responses to Environmental Impacts)

Abstract

:
Heading date (HD) is an essential agronomic objective in wheat conventional breeding. Field experiments from several years and locations indicated that the chromosome arm substitution line (CASL) of wild emmer chromosome 7BS in the genetic background of common wheat var. Chinese Spring (CS) always showed a substantially earlier HD than CS planted in different seasons; usually about 8 d earlier than CS grown under a normal autumn sowing season. CASL7BS consistently showed a much earlier HD than CS when treated for vernalization under a long or short photoperiod and then grown under a short or long photoperiod in the growth room. CASL7BS showed faster spike development than CS at the stages before the glume stage when grown under long days, and depicted relatively rapid growth at all stages when grown under short days. To map the early gene in CASL7BS, F2 plants from the cross of CASL7BS and CS were planted in the field and growth room, forming two mapping populations (P1 and P2, respectively). According to the HD distribution of P1, the HD was most likely regulated by a dominant gene. A QTL was detected consistently in the distal region of about 8.94 cM flanked by C268 and C309 with LOD scores of 5–8, explaining 9.14 and 12.35% of the phenotypic variation in the two mapping populations. The QTL was further narrowed down to an interval between ZAFU058724 and ZAFU061354 of 58–61 Mb based on the HD and genotype of F3 and F4 families. A total of 41 genes were located in this region, and eleven of them were thought to be the candidate genes based on the gene functions. According to the HD and mapping location, the QTL identified in this study was a new gene associated with flowering, which will be helpful in understanding the mechanism of wheat flowering and for breeding an early wheat variety.

1. Introduction

Wheat (Triticum aestivum L.) is the world’s most important food crop. It undergoes a series of stages during its growth and development, including seedling emergence, tillering, stem elongation, booting, heading, and grain filling. Heading date (HD) is a critical period determining wheat regional adaptability and distribution [1,2]. Flower organs at the different developmental stages are more prone to environmental stresses, such as low temperature, drought, and high temperature that halt spike structure and development [3]. Wheat varieties with suitable heading stages and life cycles can effectively avoid or resist the environmental stress in the region, maximizing production potential and improving yield stability [2,4,5]. Therefore, HD is also one of the essential agronomic characters in wheat breeding programs.
Many studies have shown that vernalization, photoperiod response, and earliness per se are three important genetic mechanisms controlling wheat HD. However, some studies have investigated autonomous pathways that are independent of photoperiod and flowering time [6], allowing wheat to adapt to various environmental stresses [7,8]. The heading date of wheat is determined by a tangled interaction of genes that regulate growth habits and earliness. Three major categories of genes, namely vernalization and photoperiod genes (Ppd and Vrn), and earliness per se genes (Eps), have been identified as the major genetic factors responsible for the diverse ecotypes of wheat cultivars [2,9,10]. The vernalization phenomenon has been extensively studied, and four vernalization genes, Vrn-1, Vrn-2, Vrn-3, and Vrn-4 have been identified. Most Vrn genes have been cloned with obvious functions [11,12]. A study conducted by Xu et al. [13] found that early vernalization induced the expression of VAS (a novel transcript of TaVRN1), which regulates the expression of TaVrn1, causing early flowering in wheat. A gene promoter is a key element in gene expression regulation; bioinformatics analysis of three vernalization genes reported the presence of conserved cis-acting elements in promoter regions of Vrn-1, Vrn-2, and TAFT1 genes. Expression of two chromatin methylation markers (H3K4me3 and H3K27) at the promoter regions during vernalization in winter wheat depicted that TaVRN1 and TaFT1 are up-regulated associated with an increased level of the activator H3K4me3 with no change in the level of the repressor H3K27me3. It was concluded that the flowering transition induced by vernalization in winter wheat is associated with histone methylation at the promoter level of TaVRN1 and TaFT1 [14]. Similar results have been reported in Arabidopsis, where TaVRN1 overexpression promoted early flowering and altered plant development from the vegetative to the flowering stage [15]. Ppd genes located on chromosomes of group 2 (Ppd-A1, Ppd-B1, and Ppd-D1) were studied extensively [16,17]. The Ppd-B1 on chromosome 2B was found to be an essential gene affecting wheat HD through gene copy number variation and indel mutation in promoters [18]. The key photoperiod gene Ppd2 was discovered on wheat chromosome 2B using homozygous recombinant lines derived from a hybrid between CS and the substitution line CS (Marquis 2B) [19]. The ppd-d1 is the least sensitive to photoperiod and can induce wheat flowering regardless of the length of daylight, followed by ppd-b1 and ppd-a1 [20,21]. The gene ppd-b2, located on chromosome 7BS, can induce wheat flowering only under long day (LD) conditions. The Ppd-D1a allele, which induces early flowering in the short day (SD) or LD conditions, had a 2 kb deletion upstream of the coding region, linked with misexpression of the 2D pseudo-response regulator (PRR) gene, showing that photoperiod insensitivity was due to the activation of a known photoperiod pathway regardless of day length [22]. A study conducted by Diaz et al. (2012) found no candidate mutation/variation in the (Ppd-B1 alleles) or vernalization requirement (Vrn-A1 alleles), but an increased copy number of genes. Alleles with an increased copy number of Ppd-B1 and Vrn-A1 confer an early flowering day-neutral phenotype and an increased requirement for vernalization, respectively. Similarly, the photoperiod response gene Ppd-B2 located on chromosome 7BS was found to be overexpressed under a long day photoperiod and associated with high grain protein content [23]. Similar results were reported by Wang et al. [24].
When the requirements of vernalization and photoperiod are fully met in terms of the number of days to heading, the differences in wheat HD due to variety differences are referred to as earliness per se [25]. To date, many studies have revealed that wheat earliness is controlled by multiple genes with minor effects [1,2], which can be determined only when the requirements for vernalization and photoperiod response are fully met [1,2]. Early maturity study is more difficult to examine than photoperiod and vernalization research. Thus far, only three QTL related to early maturity, Eps-Am1, Eps-3Am [26], and Eps-D1, have been mapped on chromosomes 1A and 3A in Triticum monococcum L. and chromosome 1D in common wheat, and candidate genes have been identified [27]. Eps-3Am has a candidate gene similar to Arabidopsis LUX/PCL1, impacting young spike development by modifying the circadian clock. MODIFIER OF TRANSCRIPTION 1 (MOT1) and FTSH PROTEASE 4 (FTSH4) were found to be the candidate genes for Eps-Am1 [28]. An Eps gene (Eps-D1) was recently identified in the Eps-Am1 homologous region of the long arm of common wheat chromosome 1D by association analysis, gene mapping, and bioinformatics. Based on the difference in gene expression between the mutant and wild type, it was inferred that common wheat EARLY FLOWERING 3-D1 (TaELF3-D1) was its candidate gene) [27]. The molecular mechanisms by which Eps-Am1 regulates early wheat spikelets’ developmental processes that affect the HD are poorly understood. Earlier studies suggested that temperature-mediated early maturation genes promote wheat spikelet development [29,30]. Therefore, early maturity genes of wheat are a class of heat-sensitive genes that can regulate wheat growth and development by interacting with temperature, so the molecular mechanism of their regulation needs further study.
Wild emmer (Triticum turgidum L. subsp. dicoccoides, TTD) is a tetraploid wheat species with two genomes, A and B. It is the ancestor of cultivated hexaploid and tetraploid wheat. Numerous studies have shown that TTD is a valuable gene pool having essential traits such as disease resistance, tolerance to abiotic adversities, high seed protein content, good quality, rich in amino acids, trace elements, and early maturity [31,32,33]. Therefore, TTD can be exploited as a valuable germplasm resource to improve wheat agronomic traits [34]. A set of chromosome arm substitution lines (CASLs) of wild emmer wheat on the background of the common wheat variety CS have been created in the laboratory of Dr. Feldman at the Weizmann Institute of Science in Israel [35]. The chromosome composition and agronomic traits of these CASLs were systematically investigated, and some CASLs were found to carry excellent genes from TTD, such as early maturity, powdery mildew resistance, high protein content, and large seed size [36,37,38].
Several field experiments conducted over the years have shown that CASL7BS consistently heads 6–8 days earlier than CS under normal fall sowing conditions. Two F2 populations derived from the cross between CASL7BS and CS were planted in the field and growth room. An HD dominant QTL explaining more than 9.14% of the phenotypic variation was mapped on the segment between SSR markers of C268 and C390 on chromosome 7BS to discover the genes related to the early heading of CASL7BS. The inflorescences of CASL7BS always developed faster than CS under different light and temperature conditions. Therefore, we inferred that the mapped QTL might be related to earliness per se. This new gene associated with flowering has great significance in studying the molecular mechanism and genetic law of wheat heading.

2. Materials and Methods

2.1. Plant Materials

The plant materials used were Chinese Spring wheat (CS), chromosome arm substitution line CASL7BS, their F2 population and some F2:3, F3:4 lines. This study also included a wild emmer accession TTD140, which was used to create the CASLs. To develop the CASLs, TTD140 was crossed with the CS ditelosomic lines and the resulting F1 was backcrossed with the CS ditelosomic lines 6–7 times, followed by selfing once. The monotelosomic plants were selected based on the chromosome compositions in each generation [35]. Theoretically, only one chromosome arm in each CASL was replaced by the corresponding TTD chromosome arm, and the remaining chromosomes should be CS. For example, in CASL7BS, only the short arm of chromosome 7B is from TTD140, while the rest are from CS.

2.2. Genome and Transcriptome Sequencing for Checking the Chromosome Constitution

Total RNA and genome DNA of leaf tissue for CASL7BS were extracted using the RNAprep Pure Plant Kit and Plant Genomic DNA Kit (TianGen Biotech., Beijing, China), respectively. Then, the RNA and DNA concentrations were measured by a Thermo Scientific™ NanoDrop™ spectrophotometer (Thermo Scientific, Wilmington, DE, USA), and the cDNA and DNA libraries were prepared using the KAPA HyperPrep and mRNA HyperPrep kit protocols, respectively (KAPA Biosystems (A Roche company), Wilmington, MA, USA). After quality check, all libraries were subjected to sequencing with paired-end 150-bp reads on an Illumina HiSeq 2000 system at Beijing Nuohe Zhiyuan Technology Co., Ltd.
The RNA-Seq and DNA-seq analyses were performed on a Linux system as the following processes. Firstly, the obtained raw reads were subjected to a quality check and then filtered by fastp v0.19.5 [39] for removing the terminal adaptor sequences and low-quality reads. Secondly, the clean reads of RNA and DNA samples were aligned to the reference genome (IWGSC RefSeq v.1.0) (https://urgi.versailles.inra.fr/download/iwgsc/IWGSC_RefSeq_Assemblies/v1.0/, accessed on 6 October 2021) [40] using Hisat2 [41] and the “mem” subcommand of BWA v0.7.12 [42], respectively. Thirdly, samtools v1.3 [43] was used to convert the SAM files to BAM files and sort them. Fourthly, after removing the multi-mapping reads, Markduplicates module of GATK4.0 [44] was used to mark the duplicate reads resulting from the PCR amplification process. Finally, HaplotypeCaller module of GATK4.0 was used for variant calling, and the SNPs and Indels were hard filtered with variantfiltration using the settings –filterExpression “QD < 2.0 || MQ < 40.0 || FS > 60 || SOR > 3.0 || MQRankSum < −12.5 || ReadPosRankSum < −8.0” and “QD < 2.0 || FS > 200.0 || SOR > 10.0 || MQRankSum < −12.5 || ReadPosRankSum < −8.0”.

2.3. Experiment for Vernalization and Photoperiod Response

Two layers of germination papers were laid down in the germination boxes and soaked to saturation with tap water. Seeds were arranged evenly on the germination paper. The germination boxes containing seedlings were incubated in the refrigerator at 4–7 °C after the first true leaf emerged 1–2 cm from the coleoptile at room temperature. The seedlings were subjected to vernalization for 10, 20, and 30 d, respectively, in long (16 h of light/8 h of darkness, LD) and short days (8 h of light/16 h of darkness, SD). The seeds without cold treatment were used as the control. After vernalization, the seedlings were transplanted into the pots containing soil, to grow in LD and SD growth rooms (LD: 16 h light/8 h darkness, SD: 8 h light/16 h darkness; average temperature 20–25 °C). Two plants of CS and CASL7BS, were planted in a randomized complete block design to ensure the consistency of their growth conditions. When half of the wheat spike had emerged from the flag leaf, the day was recorded as the heading time, and the days from sowing to heading were recorded as HD. The parents’ average HD was calculated by the standard deviation method.

2.4. Observation of Wheat Young Spike Development

Based on the vernalization and photoperiod experiments described above, two parents were grown under the controlled light and temperature conditions with the most significant difference in the HD stage. The seeds of CASL7BS and CS were first germinated as in the vernalization and photoperiod test. Of the seedlings with the first true leaf at 1–2 cm, some of them were transferred directly to soil pots in an LD growth room (without vernalization), and the remaining were kept in a short day refrigerator (8 h light/16 h dark, 20–25 °C) for 20 d. Young spikes were peeled out when the seedlings reached the three leaves stage and were observed under a stereomicroscope at a 2–3 d intervals. Images were taken by a digital camera equipped with a stereomicroscope. Young spike development was divided into eight periods from growth cone initiation development to spike formation: elongation, uni-ribbing, di-ribbing, guard glume differentiation, florets primordium differentiation, androgynophore differentiation, connective formation, and tetrad formation.

2.5. Field and Growth Room Experiment of the F2 Population from a Cross between CASL7BS and CS

The F2 population and their parents were planted in the field at Lin’an, Zhejiang (30.25° N, 119.72° E, 44.2 m above sea level) during the regular sowing season (November 16) of 2016 and in the growth room in 2017. In the field trial, seedlings were first grown in germination boxes. When the first true leaf grew 1–2 cm high, seedlings of uniform growth were selected and planted in the field in double rows of 12 m per plot, with plant and row spacing of 0.15 m and 0.5 m respectively. For the growth room trials, the plants were first vernalized in the germination boxes for 15 d under SD and then transplanted into pots in the growth room, with four plants in each pot under LD (16 h light/8 h dark, 18–25 °C). When plants had grown to the point where the spike was almost ready to emerge, each plant was numbered for the later recording of heading time. Heading time was recorded when the spike was 1/2 out of the flag leaf, and the number of days between sowing and heading time was recorded as the HD of wheat in days.

2.6. Map Construction and QTL Mapping

Leaves were taken before heading, and genomic DNA was extracted using the cetyl trimethylammonium bromide (CTAB) method [45]. The SSR markers used in this study were derived from the published genetic map of chromosome 7BS collected on the GrainGenes 2.0 website (three pairs are SSR of wmc series, three pairs of gwm series, and one pair of the barc series, https://wheat.pw.usda.gov/GG3/, accessed on 10 June 2021). In addition, the sequence between markers wmc323 and wmc335 in the CS genome (https://wheat-urgi.versailles.inra.fr, accessed on 10 June 2021) was extracted and the SSR sites were identified using MISA software (http://misaweb.ipk-gatersleben.de/, accessed on 10 June 2021). The number of dinucleotide repeats not less than six, the number of triplets, quadruple, and pentanucleotide repeats not less than 5 times were standards for the identification of SSRs. The SSR primers were designed in bulk using Primer 3.0 software (https://primer3.org/, accessed on 10 June 2021), and the specificity of the primers was verified using ePCR. SSR markers were subjected to PCR to determine polymorphism between CASL7BS and CS using BIOTAQ DNA Polymerase with the following PCR procedure: 96 °C for 2 min, followed by 35 cycles each comprising 95 °C for 30 s, annealing temperature for 30 s, and 72 °C for 30 s, and a final extension at 72 °C for 5 min. All markers were separated on 12% polyacrylamide gel stained with ethidium bromide.
The QTL IciMapping V4.0 software [46] was used to analyze the HD and SSR genotyping data, and Inclusive Composite Interval Mapping (ICIM) [47,48] was used to construct a genetic linkage map. The PIN value was set to 0.001, the whole chromosome 7B was scanned for the target trait in 1 cM steps, and the LOD value was determined by permutation 1000 times. A QTL locus is considered to exist at that location when the calculated LOD value is greater than 2.5. The QTL was named according to the nomenclature “Q + trait name abbreviation + chromosome number” [10].

3. Results

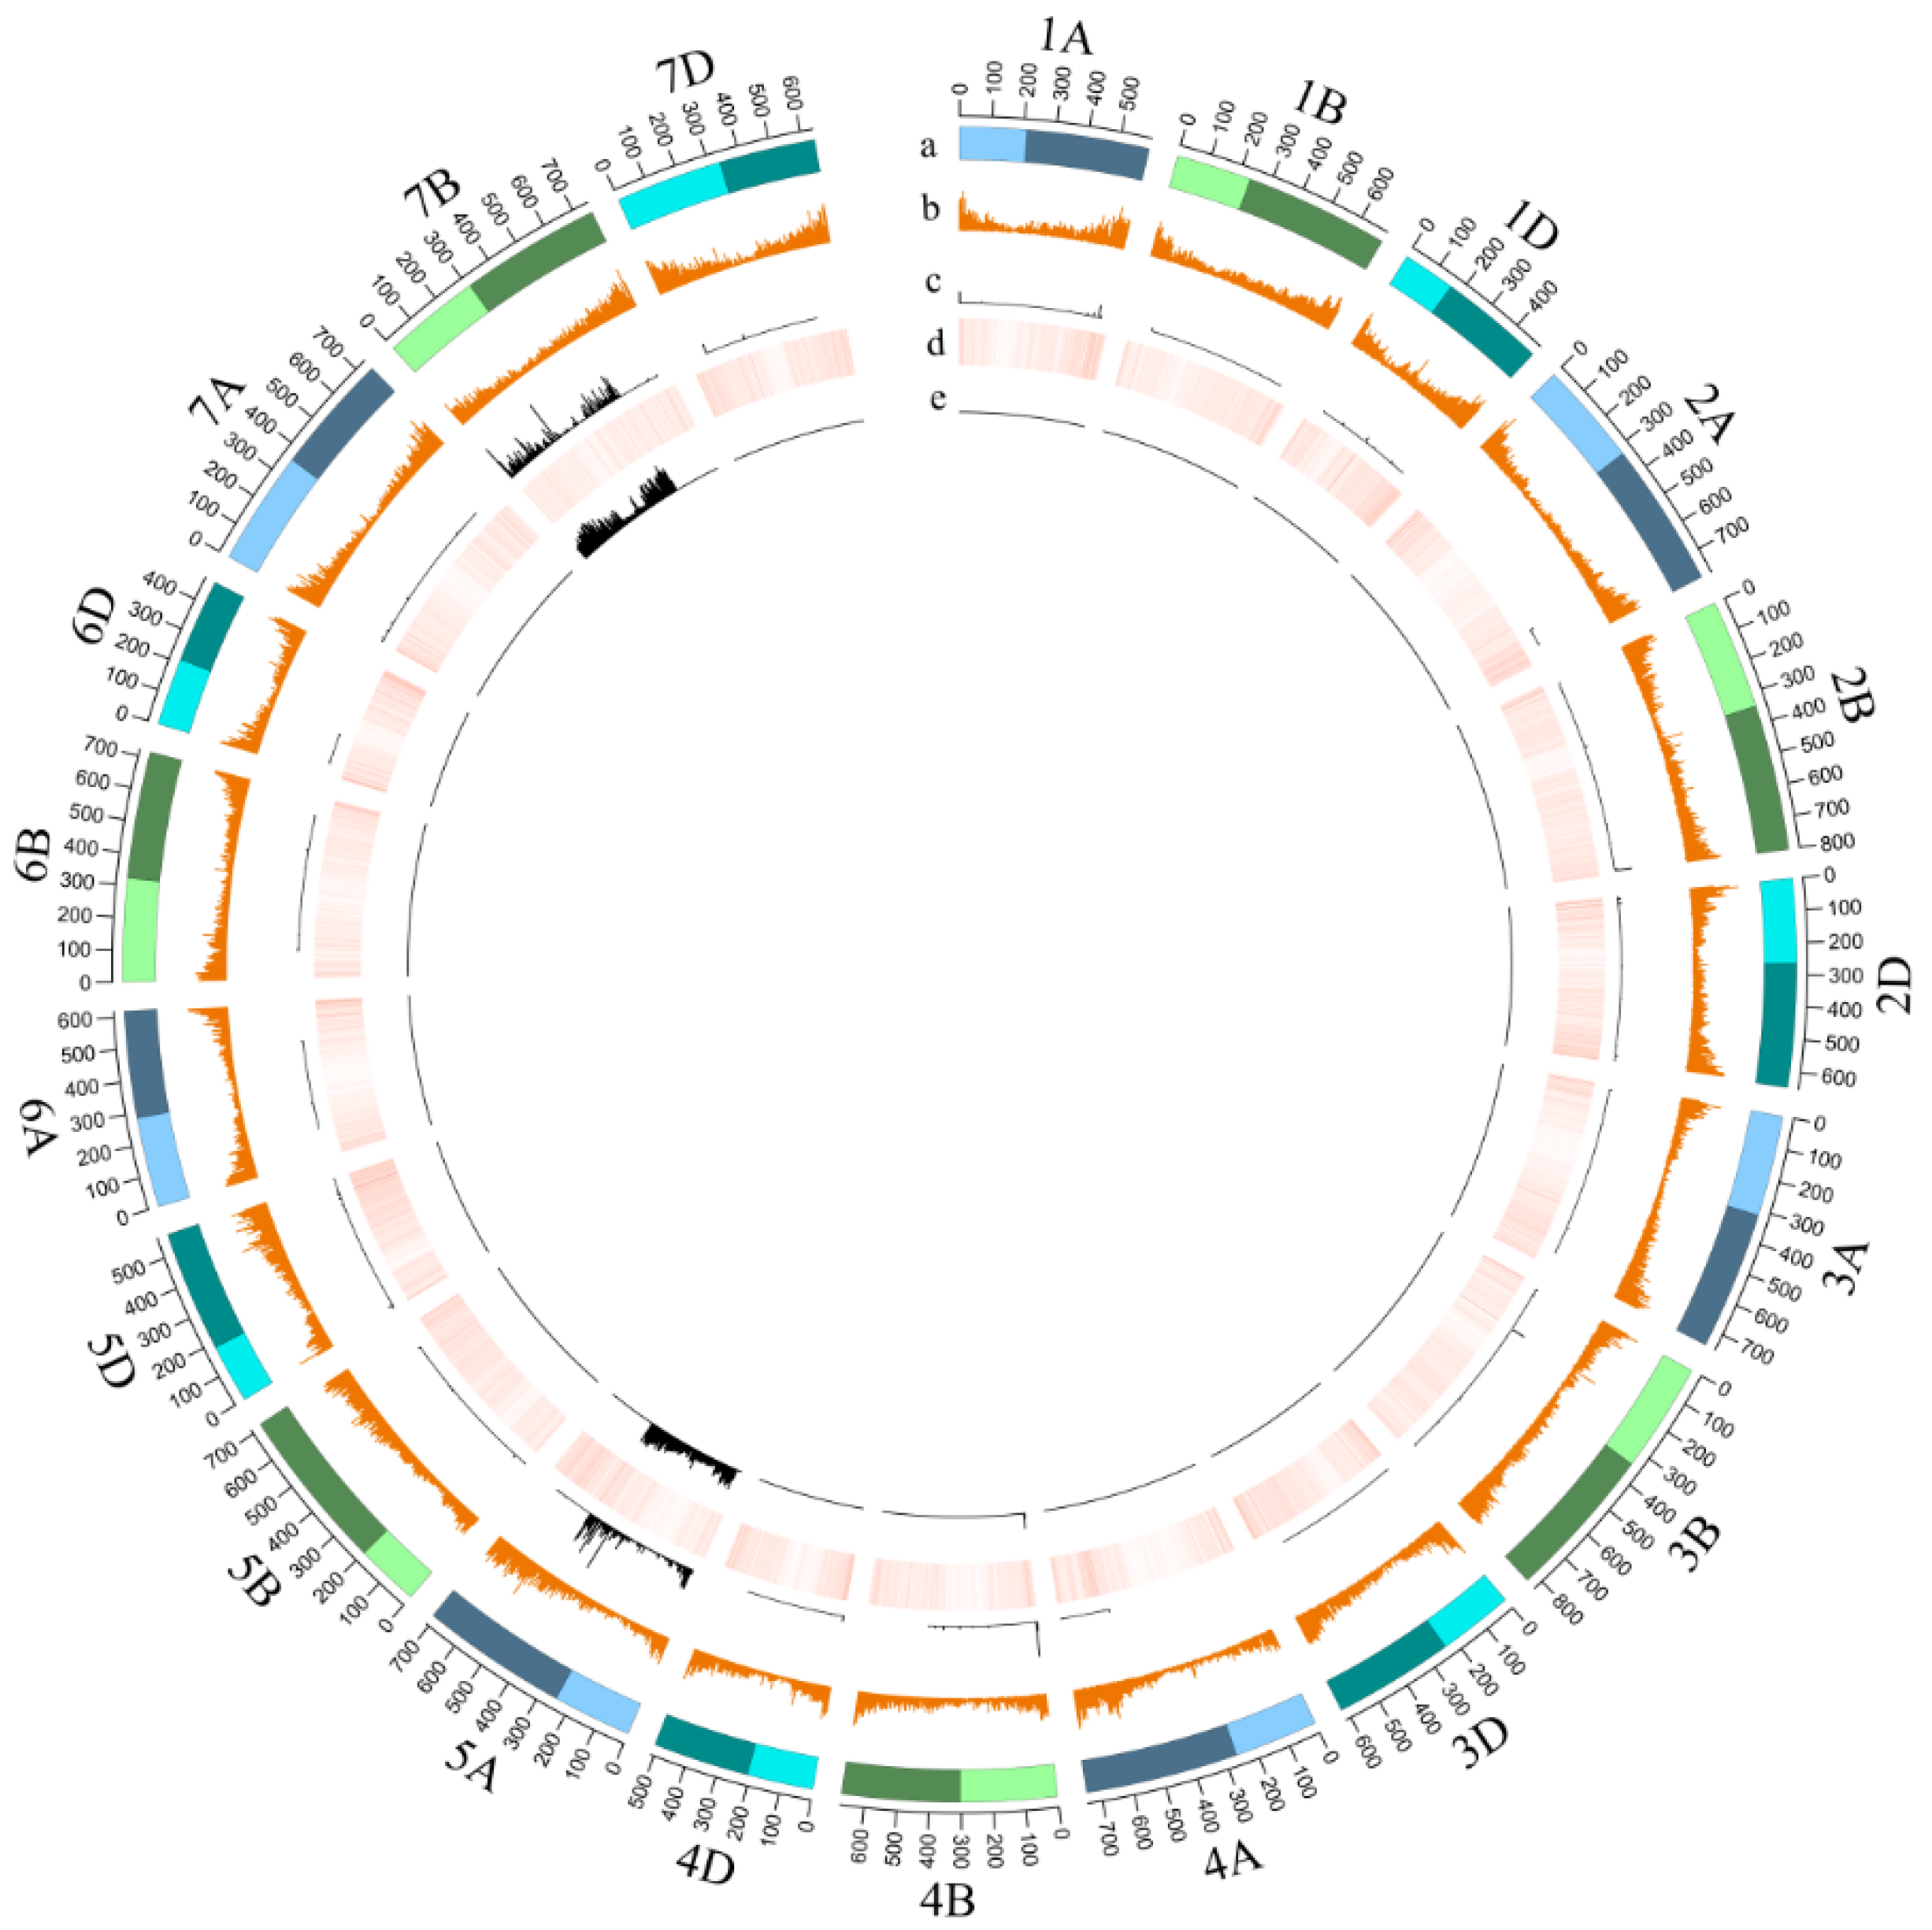
3.1. Chromosome Constitution of CASL7BS Identified by Transcriptome and Genome Sequencing

Quality testing of both transcriptomic RNA and DNA sequences from resequencing indicated that both sequences belonged to Class A and met the requirements for further analysis. RNA-seq analysis showed that the number of genes expressed in the CS preserved in our laboratory was consistent with the CS reference genome sequence, and there were few base differences, i.e., few SNPs between them. This indicated that CS preserved in our laboratory could be used further in this study. High quality SNPs of CASL7BS were mainly distributed in the 20–500 Mb segment of chromosome 5A and the 0–530 Mb segment of chromosome 7B (Figure 1). The SNP distribution from resequencing was consistent with RNA-seq, which was also mainly enriched on chromosomes 5A and 7B (Figure 2). It revealed that most of the chromosomal segments enriched by high quality SNPs were probably derived from wild emmer wheat chromosomes.
To further corroborate the constitution of chromosome 7B in CASL7BS, 27 polymorphic SSR markers (Supplementary Materials Table S1) were used. Their band type was found to be the same as TTD140, but different from CS (Figure S1), suggesting that the chromosomal segment where these markers are located is derived from TTD140. The region between C2 and C2119 from 36,49–529,840,399 bp where these markers were mainly located matched the pure SNP-enriched segments from resequencing and RNA-seq. Therefore, the 0–530 Mb segment of chromosome 7B in CASL7BS had been replaced by wild emmer, and the remaining 530–750 Mb segment was the un-replaced one from CS (Figure 2).
Resequencing and transcriptomic data indicated that the high quality SNPs were also enriched in the non-targeted arm in CASL7BS, but mainly in chromosome 5A. Based on resequencing data, 18 pairs of primers for detecting indel (Table S2) were developed in the 36–495 Mb interval of chromosome 5A to confirm the presence of TTD140 chromosomal fragments. The findings revealed that wild emmer wheat chromosomal fragments exist on chromosome 5A, but the genotype of the marker on the replacement fragments does not correlate with the HD phenotype, implying that genes controlling HD do not exist on chromosome 5A.

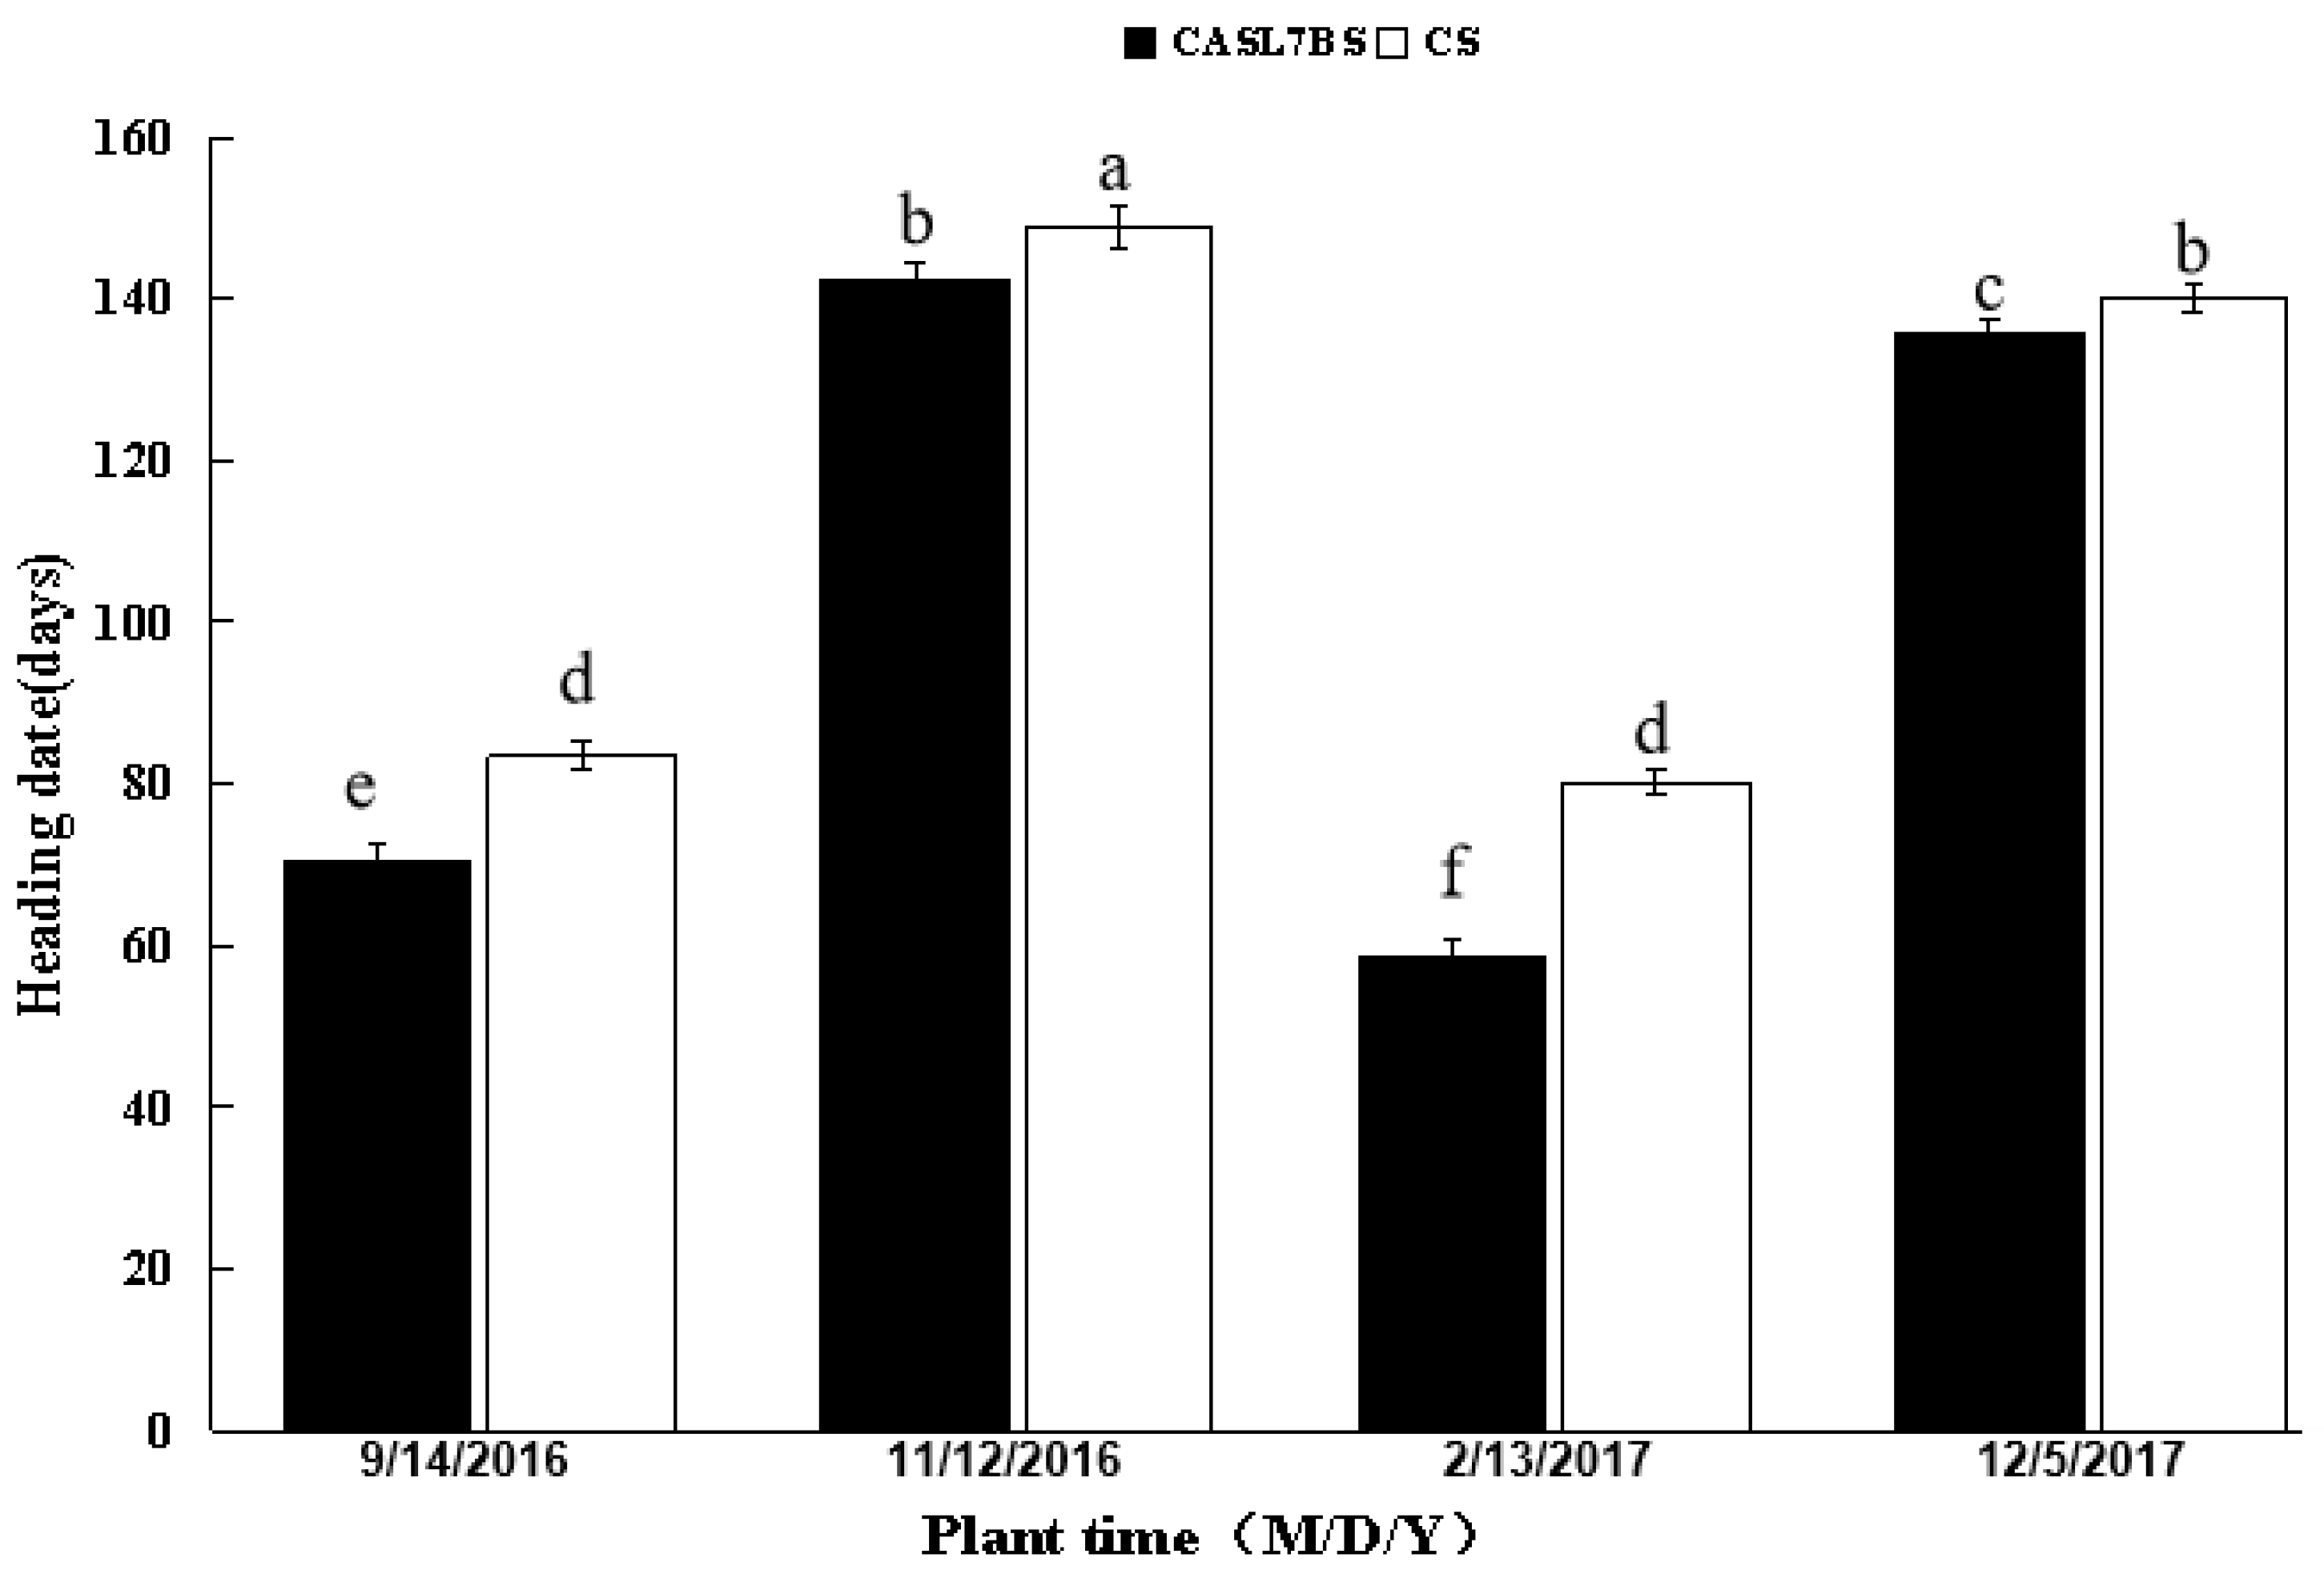
3.2. Consistent Early Heading of CASL7BS Compared to CS in Different Environments

In our previous experiments, CASL7BS always displayed earlier HD, about 6–8 d, than CS under a normal autumn sowing season. In this study, CASL7BS and CS were planted on 14 September and 12 November 2016 in the greenhouse and field, and 13 February and 5 December of 2017 in the growth room and field, respectively. In the corresponding experiments, HD of CASL7BS was 70.5, 142.5, 58.7, and 135.5 d, respectively, which were 13.3, 6.2, 21.3, and 4.6 d earlier than CS (p < 0.05), indicating that CASL7BS heads earlier than CS in different growing seasons and conditions, especially in the greenhouse and growth room (Figure 3).

3.3. Different Responses of CS and CASL7BS to Vernalization and Photoperiod

Experiments for vernalization and photoperiod effect were designed to elucidate the relationship between environmental conditions and HD. Overall, as in the field and greenhouse, CASL7BS consistently heads earlier than CS under all vernalization and photoperiod experiments (Figure 4). CS must be vernalized for about 20 and 30 d if grown under SD, otherwise, it will not head properly. However, CASL7BS can head either grown under LD and SD after different times of vernalization treatment in LD and SD, or even without vernalization. When grown under SD after vernalization for 20 d in LD, CS was able to head normally; the average HD was 116.3 d, while CASL7BS heads in only 67.2 d, with a difference of 49.2 d. When CASL7BS started to head, CS was still in the booting stage (Figure 5a). Under long day without vernalization, CASL7BS had an average HD of 58.7 d, while CS had an average HD of 80 d, a significant difference of about 21.3 d. When CASL7BS was in the booting stage, CS was still in the status of jointing (Figure 5b).
Interestingly, when CASL7BS was grown under LD, prolonged vernalization seemed to hinder the development of its young spikes and prolong HD. For example, CASL7BS headed at 58.7 d without vernalization, but it headed at 68.6 d after 30 d of vernalization, a significant difference of 10 d between the two treatments (Figure 4).

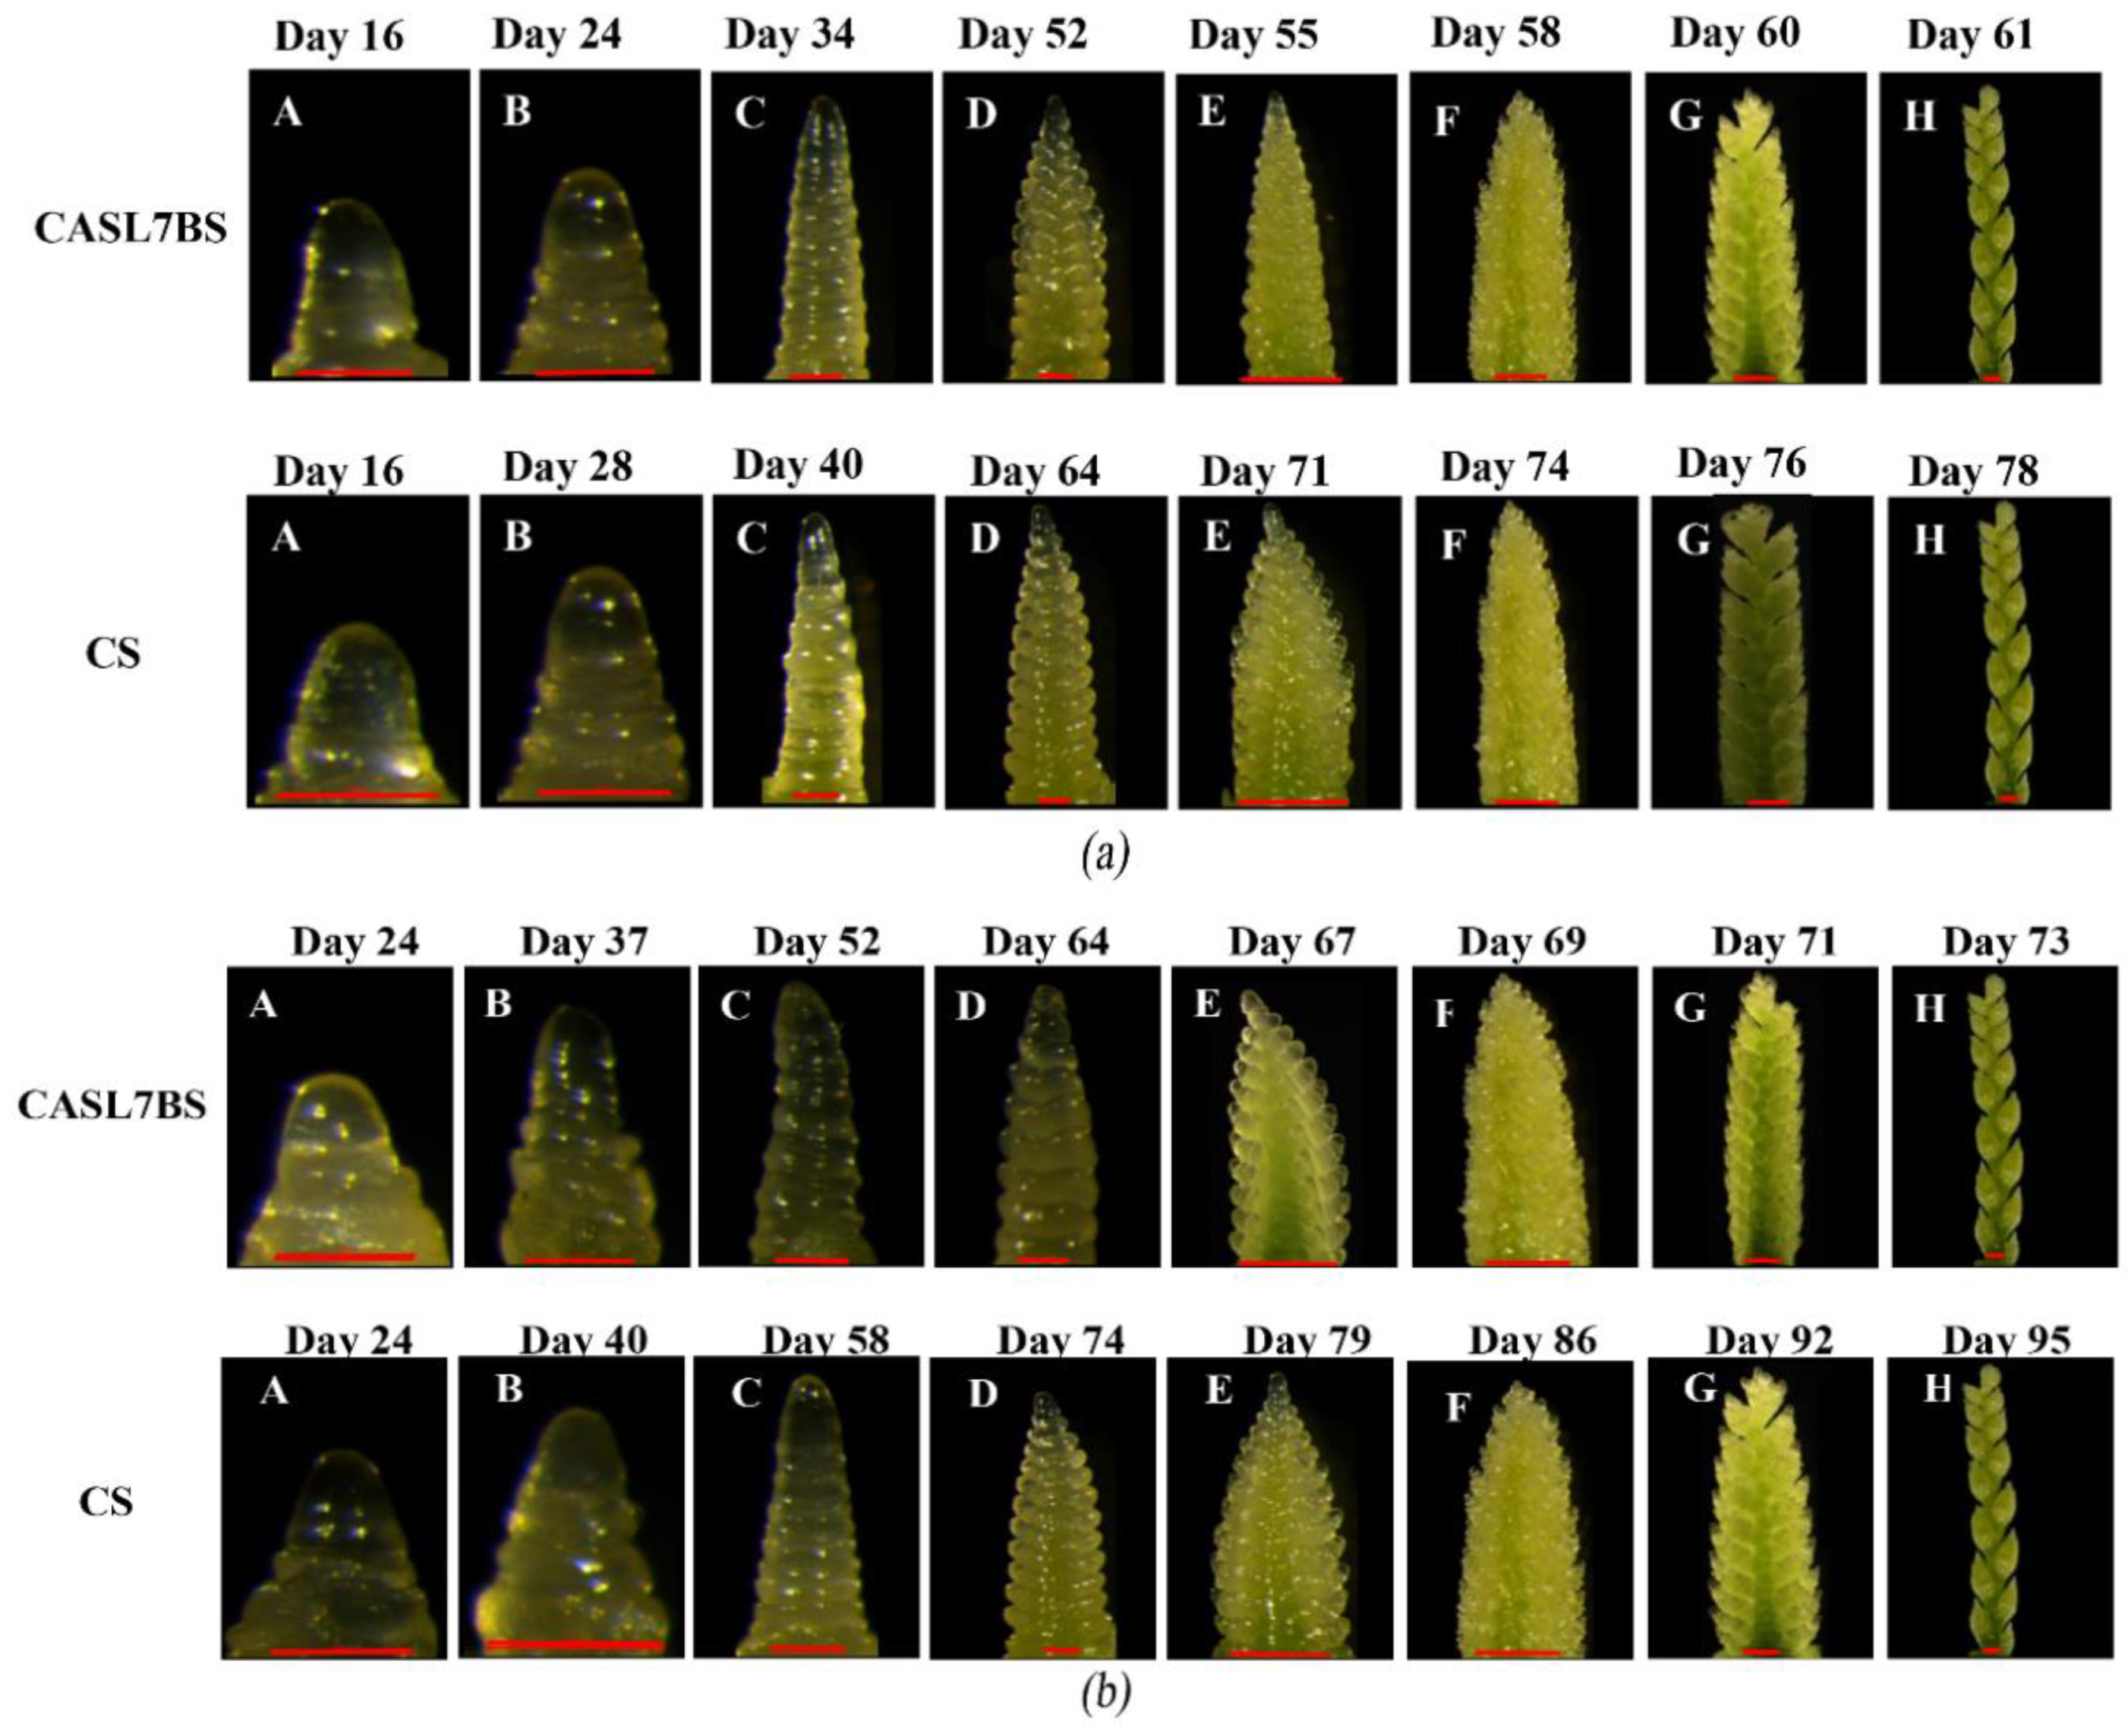
3.4. Comparison of Young Spike Development between CS and CASL7BS

Based on the above light–temperature response experiments, seedlings growing under LD but no vernalization, and under SD after LD vernalization for 20 d (4–7 °C, 16 h light/8 h dark) were used for observation of young spike development. Growing under LD without vernalization, CASL7BS and CS entered the elongation period almost at the same time, about 16 d after germination (A in Figure 6a). They stayed the longest time in the two ridge stage, which lasted about 18 and 24 d, respectively. The developmental differences in this period influenced the final heading time (Table 1). From elongation to glume protuberances stage, CASL7BS and CS lasted 39 and 55 d, respectively, and the young spike of CASL7BS developed significantly faster than CS during these four periods. They entered the florescence primordium differentiation phase between 55 and 71 d after germination and completed spike development rapidly. When grown under SD after LD vernalization for 20 d, CASL7BS developed faster than CS in all eight periods. Both CASL7BS and CS stayed longer in the elongation and single ridge stages (Figure 7b, Table 1), while staying less time in the two ridge stage than that growing LD without vernalization, indicating that vernalization promoted the emergence and passage of the two ridge stage. CASL7BS and CS entered the tetrad stage 65 and 90 d after germination, respectively, and it took 51 and 76 d to complete the entire differentiation process. The experiments showed that CASL7BS differentiated faster than CS under both photoperiods. Both could complete the subsequent differentiation period more quickly after the two ridge stage. It was observed that the wheat material grew faster under LD than SD, indicating that LD can promote young spike differentiation.

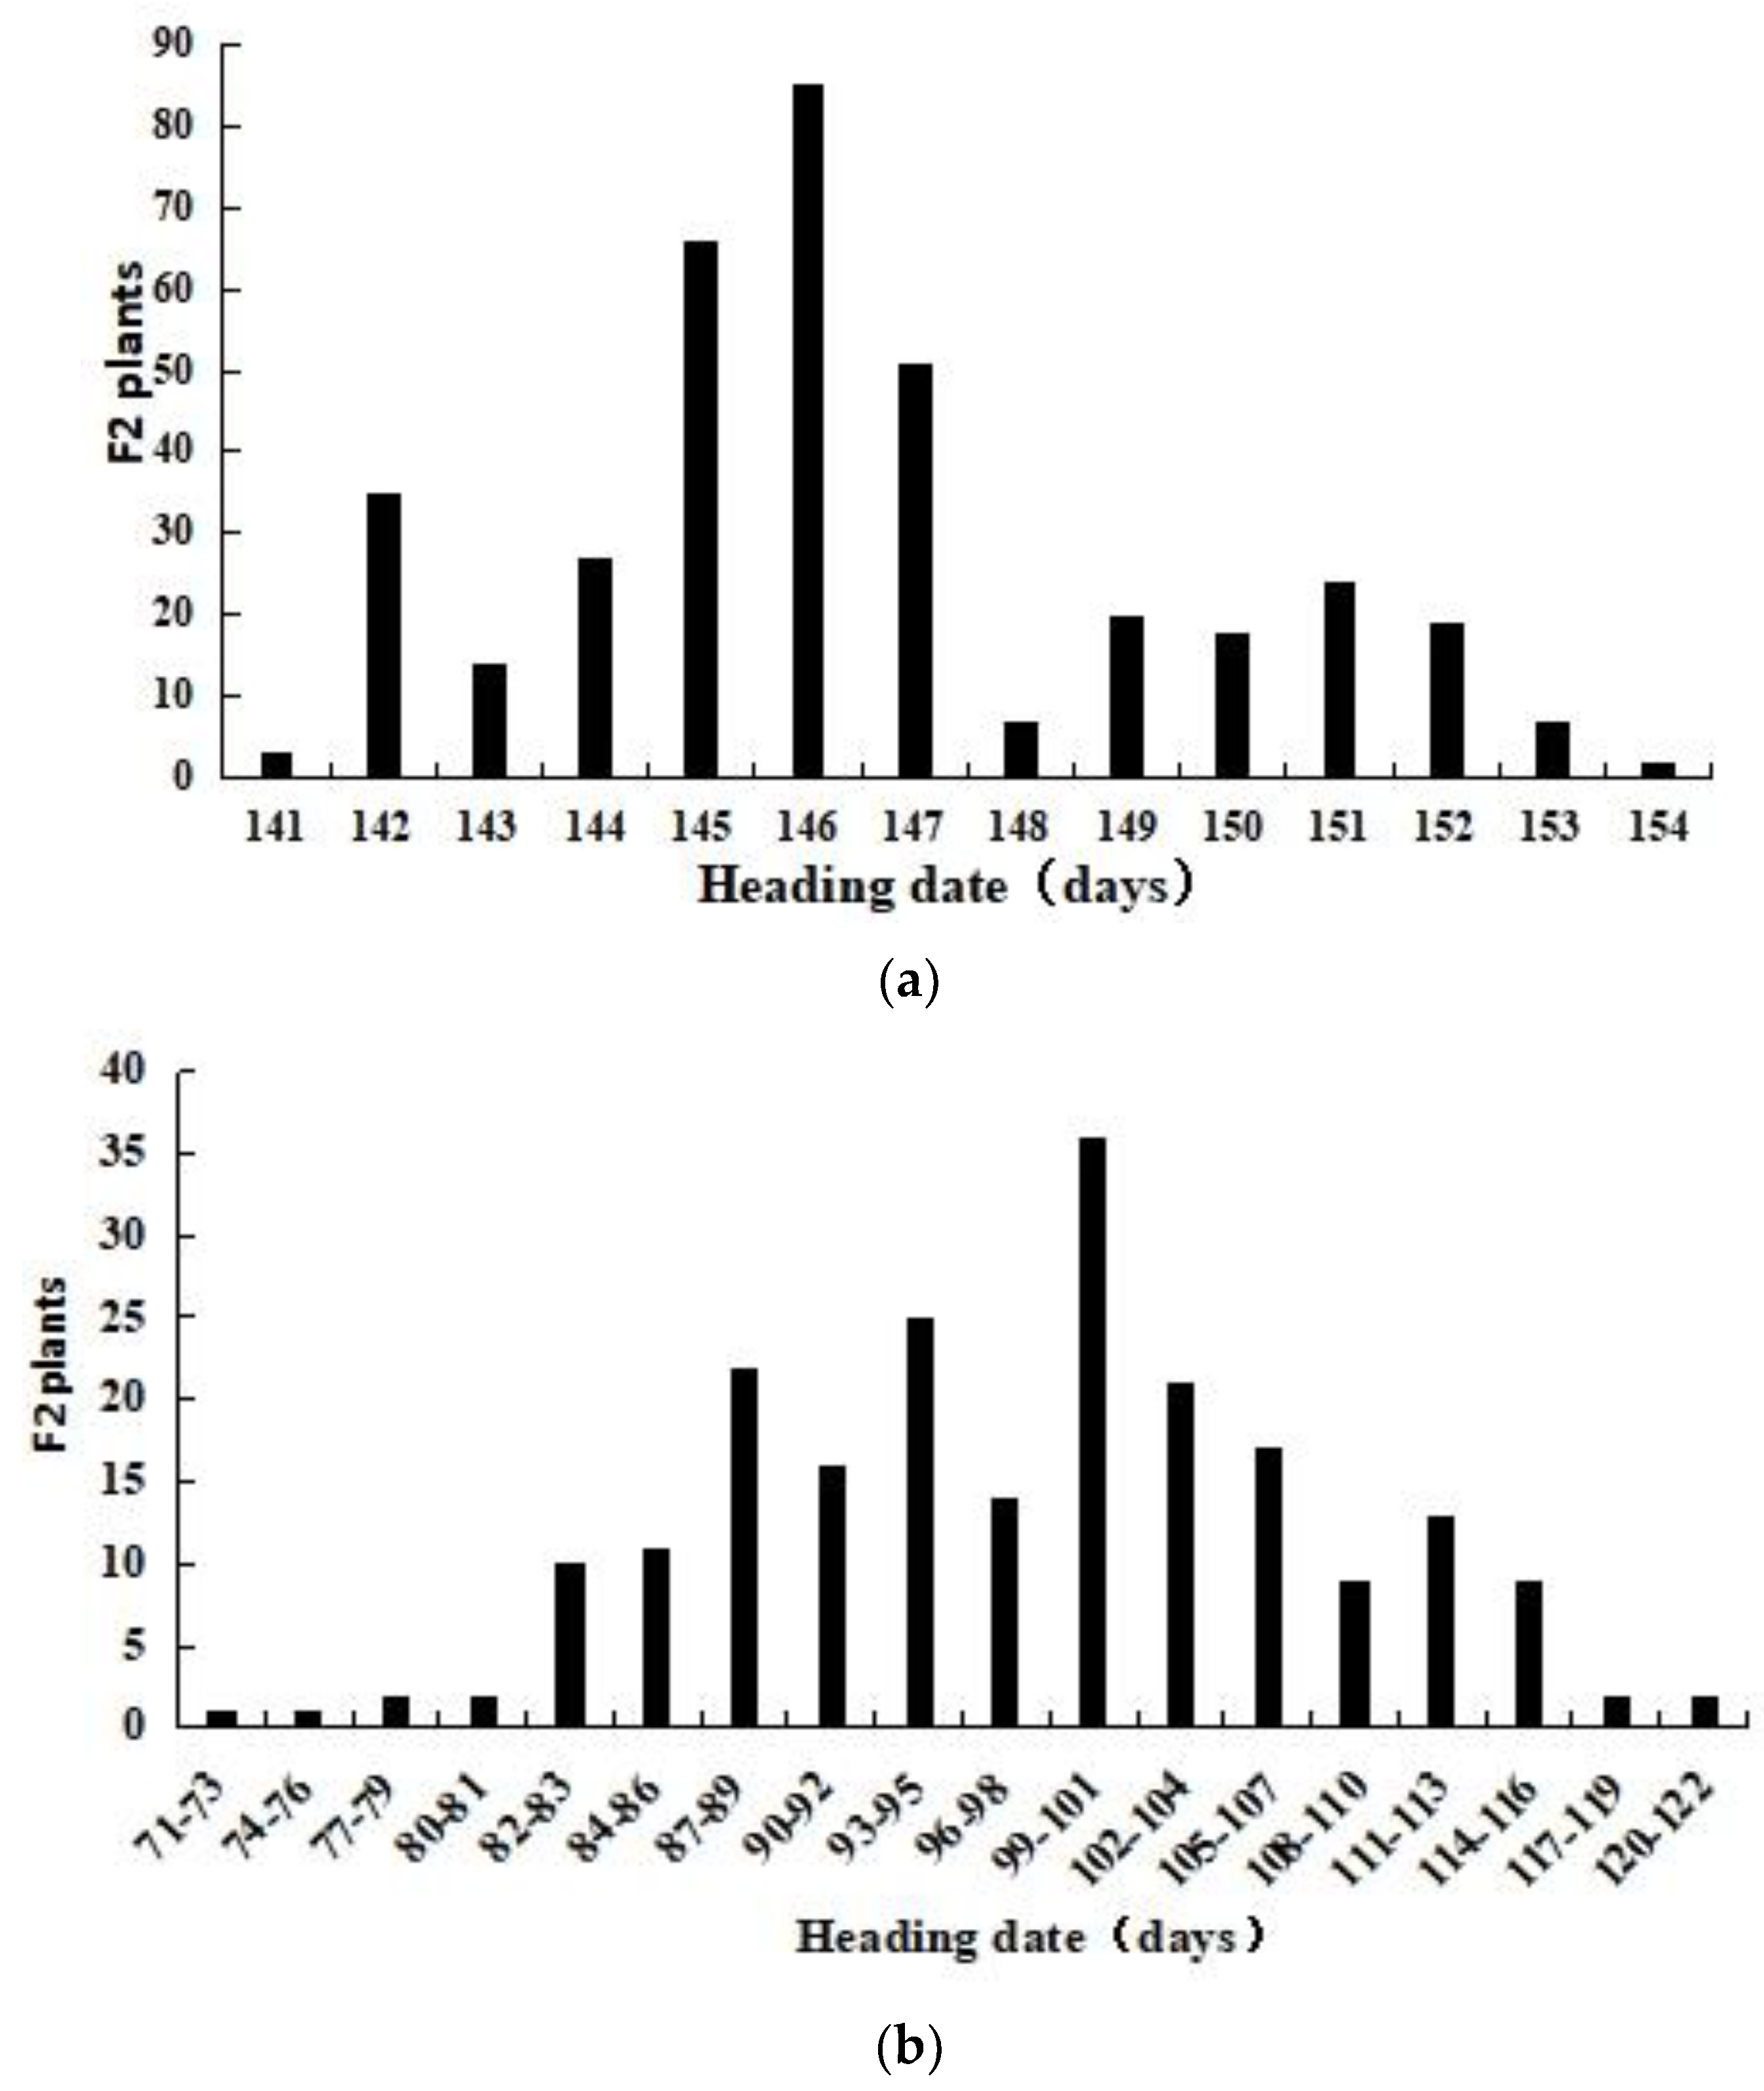
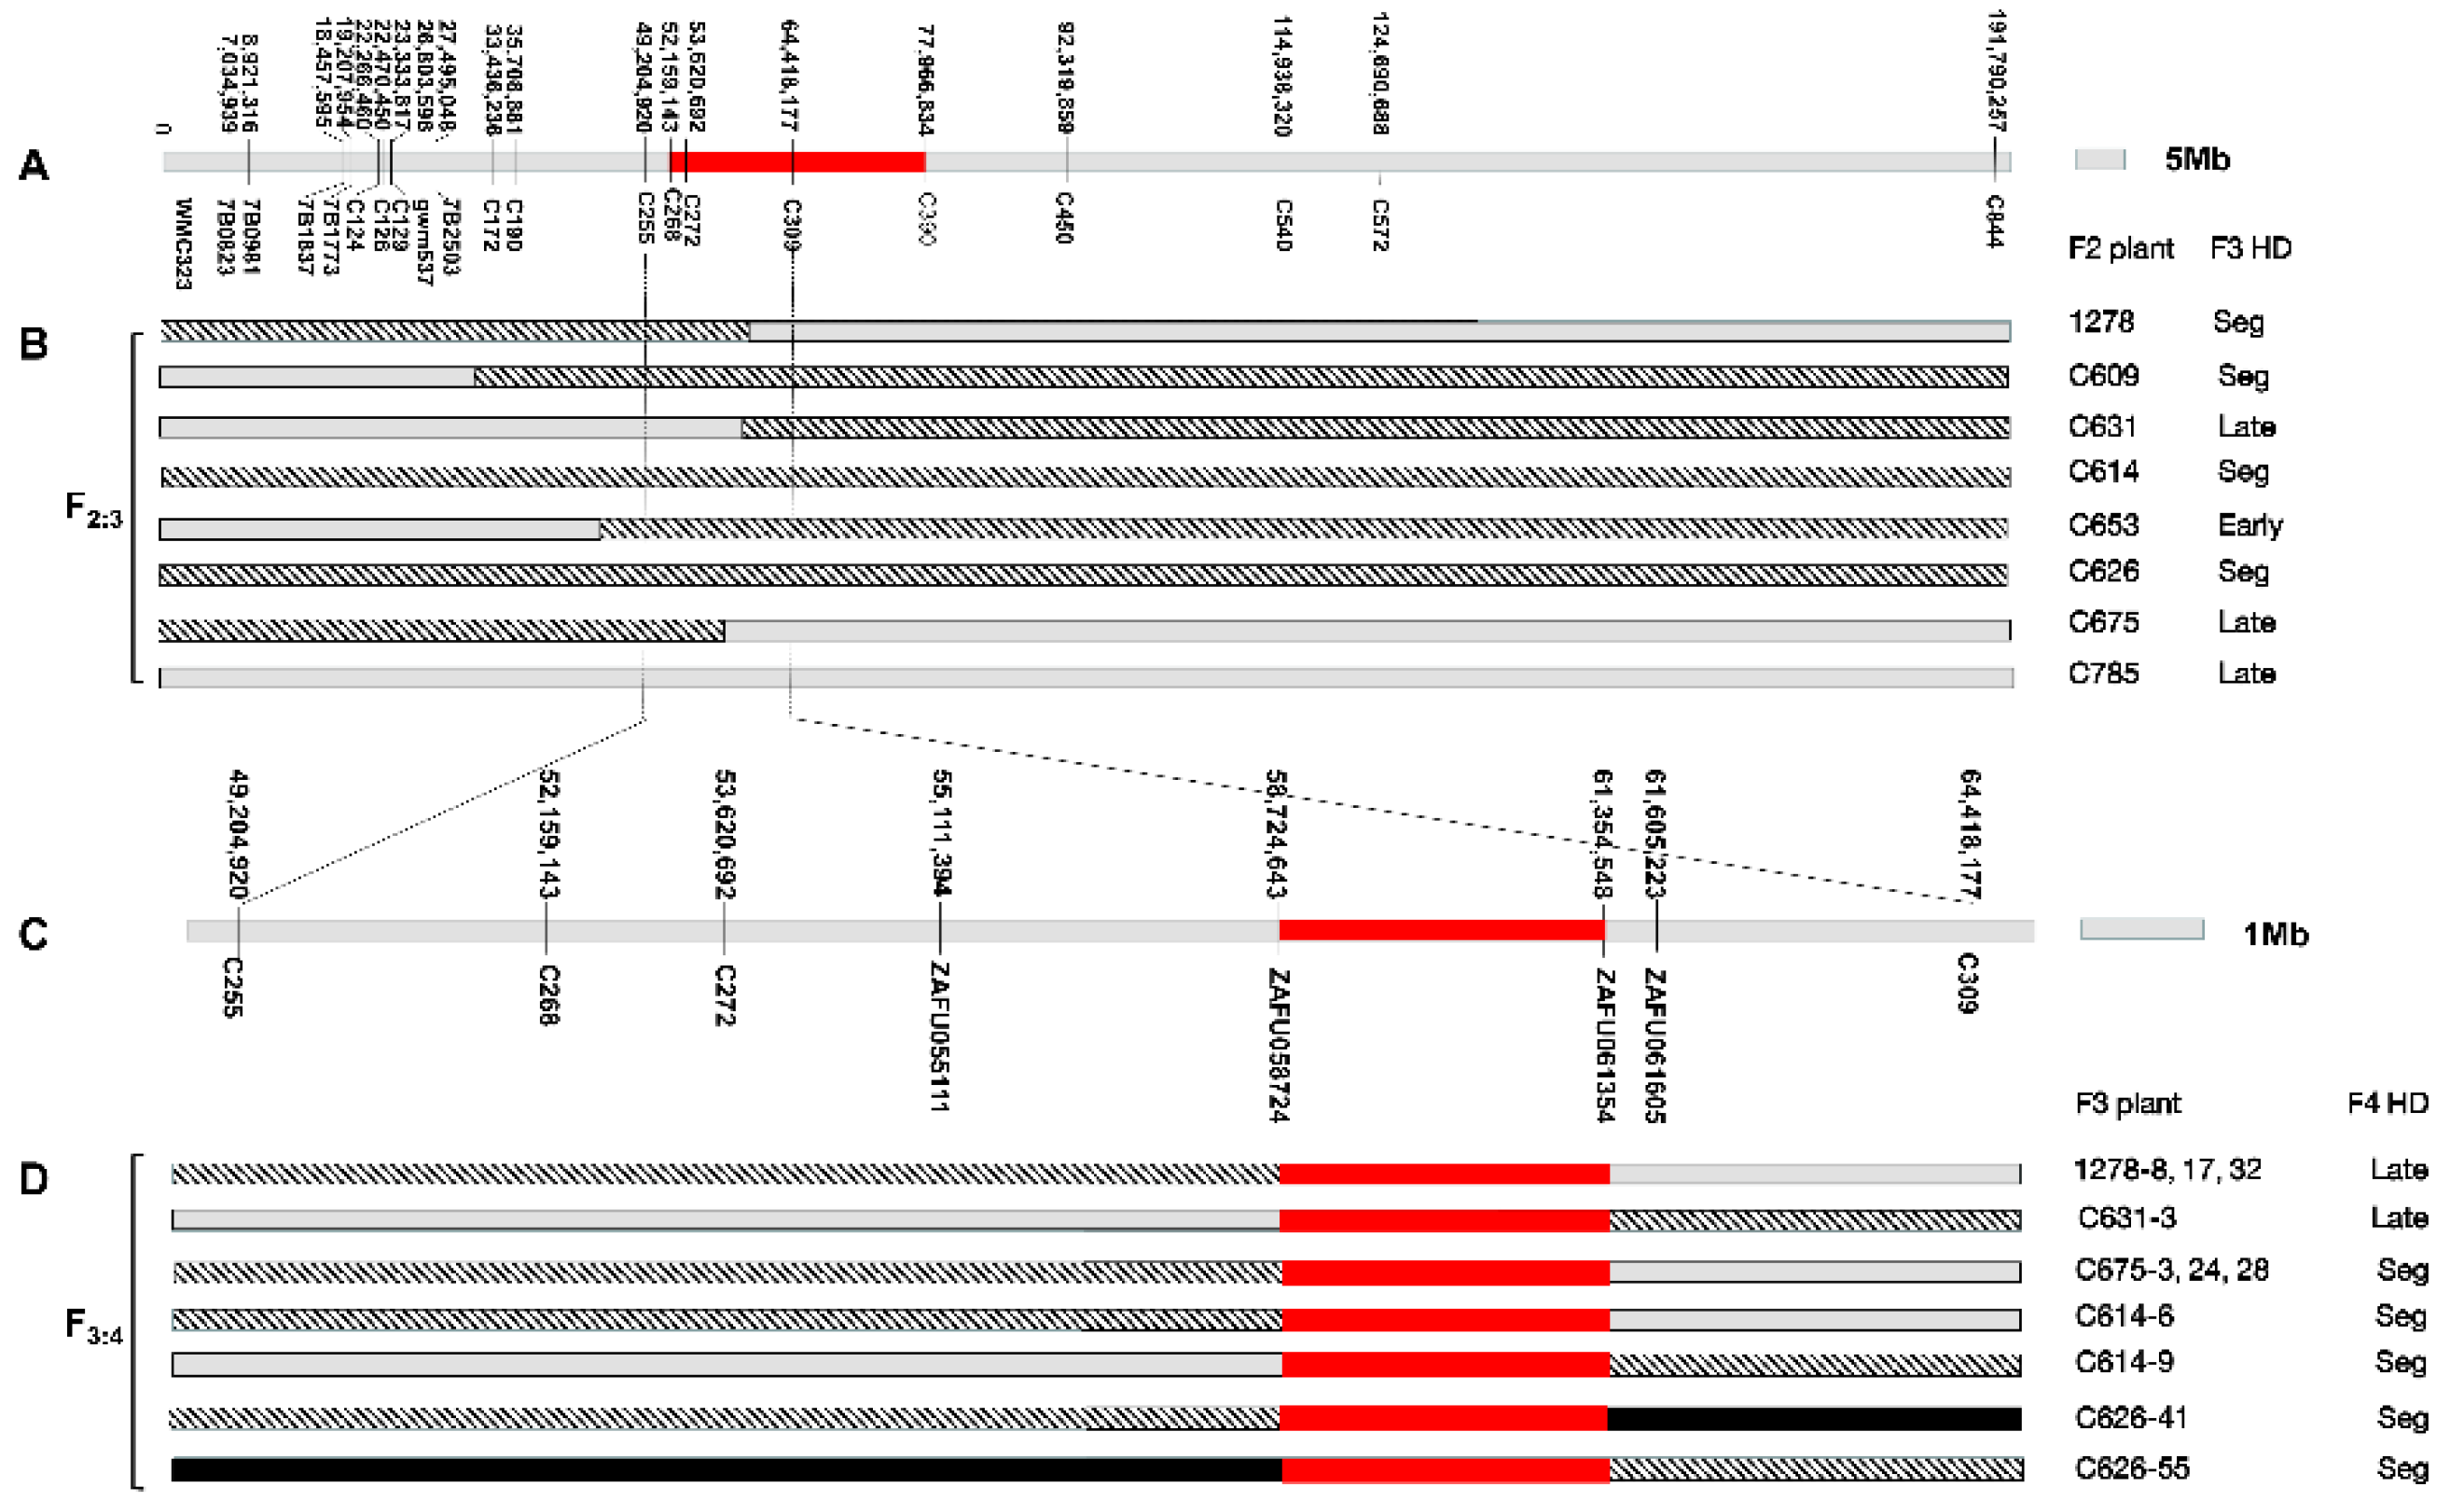
3.5. Genetic Mapping of the QTL Related to Early HD in CASL7BS Using F2 Population Derived from a Cross between CASL7BS and CS

(1) Heading date analysis: The difference in HD between the two parents was about 6 d when grown under normal planting season and was about 22 d in the growth room, reaching the level of significant difference in both environments (Table 2). These results suggest that CASL7BS consistently performs an earlier heading date than CS in both environments. The average HD of parents significantly shortened, from 142 to 58 d for CASL7BS and 148 to 80 d for CS, under normal autumn sowing in the field (12 November 2016) to the early spring sowing in the growth room (13 February 2017). This result indicates that missing a period of low temperatures in the field during winter could accelerate wheat young spike development and heading in the growth room. Conversely, low temperatures will slow down its development process.
The HD of 378 F2 plants in the P1 population had a span of 14 d (141–154 days), with an average HD of 146 d (Figure 7a, Table 2). The HD of 278 plants, accounting for 73.5% of the total population, were mainly concentrated in 142–147 d, while late-maturing F2 plants (148–154 d) accounted for 26.5% of the total, indicating that the early HD of CASL7BS is controlled by a dominant gene(s). The HD of 213 F2 plants in the P2 population ranged from 69 to 122 d, with a difference of 52 d and an average of 98 d. Most of the F2 plants had an HD of 82–116 d. This population showed continuous variation in HD and was close to a normal distribution (Figure 7b, Table 2), indicating that the HD of (CASL7BS × CS) F2 population is a quantitative trait controlled by multiple genes.
(2) Mapping of HD-related QTL in CASL7BS by the comparison of chromosome constitution in CASL7BS and 7BL: A total of 233 Mb of DNA sequences between wmc323 and wmc335 on chromosome 7B were screened to develop more markers for the detection of HD QTL. Altogether, 4137 SSR loci were detected according to SSR screening criteria, and 416 primer pairs were designed, of which 19 pairs were found to be polymorphic (14 pairs in the C series and 5 pairs in the 7B series). In addition, another 7 pairs of published SSR markers (wmc series, gwm series, and barc series) were selected (Table S3).
As well as analyzing the chromosome composition of CASL7BS using resequencing and RNA-seq, we used the above 26 SSR marker to identify the chromosome composition of 7B in CASL7BS and CASL7BL. Seventeen SSR markers in the wmc323-C390 interval of CASL7BL showed the same banding patterns as CS but differed from TTD, while CASL7BS had the same banding patterns as TTD, indicating that the chromosomes in this segment of CASL7BL are derived from CS rather than TTD, while CASL7BS is from TTD. Nine SSR markers in interval C450-GWM333 of CASL7BS and 7BL had band types identical to TTD140 but differed from CS, depicting that this segment of CASL7BS and 7BL is derived from TTD. Therefore, CASL7BS proved to carry TTD fragments between wmc323 and GWM333, and the segment of C450-GWM333 is a common one in CASL7BS and CASL7BL (Figure 8a). Since CASL7BS headed earlier than CASL7BL, it is inferred that the associated QTL was located in region wmc323-C450, a region unique to CASL7BS.
(3) Construction of genetic linkage maps and QTL mapping: To further locate the HD-related QTL carried by CASL7BS, a genetic map consisting of 26 SSR markers spanning 85.2 cM was constructed using the P1 population (Figure 8c and Figure S2a). On this basis, the HD-related QTL with an LOD value 7.68, comprising a phenotypic variance of 9.14%, was identified in combination with the HD phenotype between markers C268 and C390 with a genetic distance of 8.94 cM (Table 3). A genetic map spanning 58.7 cM with an average distance of 2.26 cM between markers was constructed using the P2 population (Figure 8d and Figure S2b), and a QTL with an LOD of 5.75 and a phenotypic variation contribution of 12.35% was located in a 6.39 cM region between markers C255 and C309 in combination with HD data (Table 3). The QTL intervals for both populations are generally consistent, with the P1 interval being larger than and covering the P2 interval, so the maximum interval for this QTL should be in the interval of 8.94 cM between C268 and C390 (Figure 8b). The marker order of the two genetic images was identical, except for a difference in the order of C255 in the middle of the P1 map. A comparison of the genetic map with the CS reference genome revealed that the order of the markers of the genetic linkage maps was consistent with those on the physical map, except for markers 7B1837 and 7B1773. Therefore, the identified HD-related QTL were present in a ~25 Mb segment between 52,159,143–77,966,834 bp.

3.6. Further Narrowing down the HD-Related QTL to about 3 Mb Region of Chromosome 7BS Using F3 and F4 Families

To further narrow down the above QTL interval, eight F2 plants (Table 4, Figure 9a) were selected based on the genotype of the QTL region. Progeny of F2 (F3 families) were planted in an LD (16 h light/8 h dark, 25/20 °C) growth room in autumn 2019 after 15 d of vernalization. Two parents showed considerable variation in HD, with an average difference of 30 d (Table 4). There was significant variation in the HD among different F3 families and among individual plants of the same F3 family. Still, overall, there were three types of F2:3 families: early (C653), late (C631, C675, and C685), and varied (C609, C614, C626, and 1278) (Table 4, Figure S3). The HD in a particular early or late F2:3 family varied relatively little. Still, the average HD between the early and late families was very conspicuous, while the HD of varied types almost covered the HD of both the early and late families. As a result of these findings, we can conclude that the genotype of F2 plants producing early F3 families is the same as TTD. The F2 plants producing the late F3 families were genotyped the same as CS, and the F2 plants having very different HD in F3 families were heterozygous (Figure 9).
According to this result, the QTL region can be narrowed down to C272–C309. The indel markers were designed in this QTL region based on the resequencing data of the two parents to further fine map this QTL. (Table S4). Based on F2 plant genotypes and the HD of F3 families, the HD-related QTL was narrowed down to a 3 Mb interval between ZAU058724 and ZAFU061354 58–61 Mb. (Figure 9). To further validate this locus, 1–3 F3 plants were selected from each of the above five F2 plants to form the F4 families, which were sown in pots in November 2020, and the HD and marker analysis again confirmed this HD-related region (Figure S4).

3.7. Candidate Gene Prediction

Following comparison with the CS reference genome sequence, it was found that a nearly 3 Mb segment (58–61 Mb) contained 41 genes (Table S5), 9 of which were glutamate receptors. These genes belong to the ion channel protein family and play an active function in intracellular ion homeostasis. Three are glutathione S-transferase encoding glutathione transferase and affecting flower color. The remaining 29 play various roles and are involved in a variety of metabolic pathways, 11 of them (TraesCS7B01G054700, 55100, 55500, 55700, 55900, 56000, 56300, 56400, 56500, 56700, and 58600) may be candidate genes for QTL related to HD identified, because their Arabidopsis and rice homologous genes have been shown to regulate flowering time (Table S5).

4. Discussion

Many studies on HD-related QTL mapping in wheat have been conducted, with a particular emphasis on photoperiod genes on homologous chromosome 2 and vernalization genes on homologous chromosome 5. However, few studies have been conducted on chromosome 7BS, except for the VRN-B3 gene. The VRN3 locus was first identified on wheat chromosome 7BS [49]. This gene was induced by vernalization and LD to promote flowering in wheat [49]. Yan et al. [50] cloned the wheat TaFT (i.e., VRN3) gene using the published HvFT sequence and found that the gene co-segregated with the molecular marker UCW99 in the region between ABC158-GWM569. In addition, some authors have also localized some HD loci in the regions of Xgwm569-Xbarc1005 [51], Xgwm537-Xgwm333 [1], and wmc0396-wmc0517 [52] on chromosome 7B. In 2009 a photoperiodic gene Ppd-B2 was identified on chromosome 7BS between Xgwm0255-Xgwm0537 [23], which induces flowering in wheat only under LD conditions [53].
In this study, QTL mapping repeated an HD QTL between SSR markers C268 and C390 (52–77 Mb), which is not in the exact physical location as the vernalization, photoperiod QTL/gene mentioned above. Together with the temperature and light response, we speculated that the QTL identified may be a novel locus. Under field or growth room conditions, CASL7BS headed about 6 d and 22 d earlier than CS. Furthermore, when grown in the growth room, the average HD of both CS and CASL7BS was significantly shorter than when grown in the field during the regular season. The main reason for the significantly faster HD in the growth room compared to the field is the absence of 2–3 months of cold winter as in the field area (December to February, average daily temperature below 15 °C). The higher temperatures during the seedling stage in the growth room (5–10 °C higher than in the field) contributed to faster growth and earlier HD. We inferred that CASL7BS carries an earliness per se gene (Eps), which is less sensitive than that of CS, enabling CASL7BS to meet its temperature requirements easily.
Eps genes in common wheat have received far less research than vernalization and photoperiod genes. Preliminary studies have shown that Eps genes affecting HD are present on multiple chromosomes of common wheat and that their effects are minor and difficult to trace out. The impacts of Eps genes can only be seen when the combined effect of vernalization and photoperiod genes are excluded [25]. Two candidate genes for Eps (Eps-Am1 and Eps-3Am) were cloned on chromosomes 1A and 3A in T. monococcum [26,54], but little is known about their molecular mechanisms in regulating young spike development and heading date. Only one Eps gene (Eps-D1) has been identified so far in common wheat on the long arm of chromosome 1D in the Eps-Am1 homologous region [27].
CASL7BS young spikes developed faster than CS in all eight periods in this study, whether growing under LD without vernalization or SD after 20 days of vernalization. The young spikes of CASL7BS transitioned more quickly than those of CS from the elongation to the glume protuberances stage when grown under LD without vernalization. The young spike development was completed in 47 and 66 d, respectively, while the entire development process took 51 and 76 d under SD after 20 d of vernalization. These results indicated that CASL7BS and CS could complete young spike development regardless of the vernalization conditions and growth environment (under long and short day light). The spikes of CASL7BS developed significantly faster than those of CS. It is clear that the TTD gene(s) can promote young spike development resulting in an earlier HD than that of CS, but its molecular mechanism in regulating early young spike development requires further investigation. Repeated experiments under different conditions showed that CASL7BS always headed earlier than CS, indicating that the TTD early HD gene is ideal for studying the mechanism of early flowering and maturity in wheat and is an excellent gene resource for breeding early maturing wheat. The precise localization and cloning of this gene are of great importance in revealing its molecular mechanisms.
Although the HD QTL was coarsely localized in this study and the localization interval was large, with 41 candidate genes, eleven of these genes may be associated with flowering or floral development. In particular, the TraesCS7B01G054700 gene, a member of the Tetratricopeptide repeat (TPR)-like superfamily of proteins, was found to have delayed flowering in mutants of the Arabidopsis homolog ATPRP39-1, and further studies revealed that this gene might function as an articulated protein in mRNA processing events [6]. TraesCS7B01G056300 is an NAC structural domain-containing transcription factor. The Arabidopsis homolog LOV1 has been shown to act similarly to known flowering genes such as FCA, FY, and FLK to affect FLC, SOC1, and FT transcript levels in shoots and, thus, flowering time through an autonomous pathway in Arabidopsis [55]. Similarly, another study explored tissue-specific misexpression of wild type and Gibberellic Acid (GA)-insensitive (dellaΔ17) DELLA proteins and reported that, GA altered the floral transition by promoting the expression of flowering time integrator genes such as FLOWERING LOCUS T (FT) and TWIN SISTER OF FT (TSF) in leaves independent of CONSTANS (CO) and GIGANTEA (GI) under long days [56]. In addition, GA signaling promotes flowering independent of photoperiod through regulating SQUAMOSA PROMOTER BINDING PROTEIN-LIKE (SPL) genes in both the leaves and at the shoot meristem. The rice homolog OsNAC2 negatively regulates plant height and flowering time by controlling GA pathway genes [57]; TraesCS7B01G056400 is a ring finger protein, and COP1 is also an E3 ubiquitin ligase that affects flowering by regulating photoperiodic proteins [58]. The gibberellin pathway is an important signaling pathway that governs plant flowering. GA signaling regulates plant development through the GA-GID1-DELLA module, in which GID1 receives gibberellin signals and promotes the degradation of DELLA proteins, releasing active transcription factors that regulate plant flowering [59]. TraesCS7B01G058600 is a gibberellin receptor protein (GID1). Therefore, it may play a role in the regulation of flowering in wheat, but little research has been conducted in wheat, and further studies on the function and mechanism of this gene are necessary. TraesCS7B01G056000 encodes glycosyltransferase; the Arabidopsis homolog UGT87A2 is a putative family 1 glycosyltransferase gene, which was mutated to show late flowering in both long- and short-day shade [24]. Still, vernalization treatments and gibberellin promoted flowering in the mutant. Complementing the mutant with the wild type, flowering returned to normal. Interestingly, FLOWERING LOCUS C expression was increased in the mutant and normalized in the complementary strain, thus inferring that UGT87A2 regulates flowering time through the flowering repressor gene FLOWERING LOCUS C [24]. In summary, our work made an effort to elucidate the genes underpinning early heading in wheat to foster future breeding programs for early maturing wheat varieties.

Supplementary Materials

The following supporting information can be downloaded at: https://www.mdpi.com/article/10.3390/agronomy12051089/s1, Figure S1: PCR fragment of SSR marker wmc335 indicating that both CASL7BS and 7BL display the same banding pattern as TTD but differ from CS, Figure S2: Mapping of QTL related to heading date in P1 (A) and P2 (B) populations of (CASL7BS × CS) F2, Figure S3: Distribution of heading date in different F3 families, Figure S4: Distribution of heading date in 11 F4 families, which were corresponding to the data given in Figure 9, Table S1: SSR markers used in identification of chromosome constitution of 7B in CASL7BS, Table S2: Indel markers on chromosome 5A developed based on DNA resequencing, Table S3: Information of polymorphic SSR makers on chromosome 7B used for mapping the QTL related to heading date, Table S4: Information of indel markers developed based on resequenced sequences in the region of mapped HD-related QTL, Table S5: Genes in the region of QTL related to HD on Chinese Spring reference genome.

Author Contributions

Conceptualization, J.R.; methodology, F.L., M.C. and X.H.; investigation, F.L., M.C. and S.W.; resources, Y.Z. and H.Z.; data curation, F.L. and J.R.; writing—original draft preparation, F.L., M.C. and J.R.; writing—review and editing, M.Y.; supervision, J.R.; project administration, J.R.; funding acquisition, J.R. All authors have read and agreed to the published version of the manuscript.

Funding

This research was funded by the Zhejiang Provincial Natural Science Foundation of China (LY19C060003) and the National Natural Science Foundation of China (32001537, 31671684).

Institutional Review Board Statement

Not applicable.

Informed Consent Statement

Not applicable.

Data Availability Statement

Not applicable.

Acknowledgments

The CASLs and their parents (CS and TTD 140) were kindly provided by M. Feldman at Weizmann Institute of Science, Israel.

Conflicts of Interest

The authors declare no conflict of interest. The funders had no role in the design of the study; in the collection, analyses, or interpretation of data; in the writing of the manuscript, or in the decision to publish the results.

References

  1. Lin, F.; Xue, S.L.; Tian, D.G.; Li, C.J.; Cao, Y.; Zhang, Z.Z.; Zhang, C.Q.; Ma, Z.Q. Mapping chromosomal regions affecting flowering time in a spring wheat RIL population. Euphytica 2008, 164, 769–777. [Google Scholar] [CrossRef]
  2. Kamran, A.; Iqbal, M.; Spaner, D. Flowering time in wheat (Triticum aestivum L.): A key factor for global adaptability. Euphytica 2014, 197, 1–26. [Google Scholar] [CrossRef]
  3. Shenoda, J.E.; Sanad, M.N.M.E.; Rizkalla, A.A.; El-Assal, S.; Ali, R.T.; Hussein, M.H. Effect of long-term heat stress on grain yield, pollen grain viability and germinability in bread wheat (Triticum aestivum L.) under field conditions. Heliyon 2021, 7, e07096. [Google Scholar] [CrossRef] [PubMed]
  4. Slafer, G.; Calderini, D.; Miralles, D. Yield Components and Compensation in Wheat: Opportunities for Further Increasing Yield Potential; CIMMYT: Mexico City, Mexico, 1996; pp. 101–133. [Google Scholar]
  5. Stelmakh, A.F. Genetic systems regulating flowering response in wheat. In Wheat: Prospects for Global Improvement, Proceedings of the 5th International Wheat Conference, Ankara, Turkey, 10–14 June 1996; Braun, H.J., Altay, F., Kronstad, W.E., Beniwal, S.P.S., McNab, A., Eds.; Springer: Dordrecht, The Netherlands, 1997; pp. 491–501. [Google Scholar]
  6. Wang, C.; Tian, Q.; Hou, Z.; Mucha, M.; Aukerman, M.; Olsen, O.A. The Arabidopsis thaliana AT PRP39-1 gene, encoding a tetratricopeptide repeat protein with similarity to the yeast pre-mRNA processing protein PRP39, affects flowering time. Plant Cell Rep. 2007, 26, 1357–1366. [Google Scholar] [CrossRef] [PubMed]
  7. Nishida, H.; Yoshida, T.; Kawakami, K.; Fujita, M.; Long, B.; Akashi, Y.; Laurie, D.A.; Kato, K. Structural variation in the 5′ upstream region of photoperiod-insensitive alleles Ppd-A1a and Ppd-B1a identified in hexaploid wheat (Triticum aestivum L.), and their effect on heading time. Mol. Breed. 2013, 31, 27–37. [Google Scholar] [CrossRef]
  8. Zhou, Y.; Chen, Z.; Cheng, M.; Chen, J.; Zhu, T.; Wang, R.; Liu, Y.; Qi, P.; Chen, G.; Jiang, Q.; et al. Uncovering the dispersion history, adaptive evolution and selection of wheat in China. Plant Biotechnol. J. 2018, 16, 280–291. [Google Scholar] [CrossRef] [PubMed]
  9. Distelfeld, A.; Li, C.; Dubcovsky, J. Regulation of flowering in temperate cereals. Curr. Opin. Plant Biol. 2009, 12, 178–184. [Google Scholar] [CrossRef] [Green Version]
  10. Chen, F.; Gao, M.; Zhang, J.; Zuo, A.; Shang, X.; Cui, D. Molecular characterization of vernalization and response genes in bread wheat from the Yellow and Huai Valley of China. BMC Plant Biol. 2013, 13, 199. [Google Scholar] [CrossRef] [Green Version]
  11. Yan, L.; Loukoianov, A.; Blechl, A.; Tranquilli, G.; Ramakrishna, W.; SanMiguel, P.; Bennetzen, J.L.; Echenique, V.; Dubcovsky, J. The wheat VRN2 gene is a flowering repressor down-regulated by vernalization. Science 2004, 303, 1640–1644. [Google Scholar] [CrossRef] [Green Version]
  12. Yoshida, T.; Nishida, H.; Zhu, J.; Nitcher, R.; Distelfeld, A.; Akashi, Y.; Kato, K.; Dubcovsky, J. Vrn-D4 is a vernalization gene located on the centromeric region of chromosome 5D in hexaploid wheat. Theor. Appl. Genet. 2010, 120, 543–552. [Google Scholar] [CrossRef] [Green Version]
  13. Xu, S.; Dong, Q.; Deng, M.; Lin, D.; Xiao, J.; Cheng, P.; Xing, L.; Niu, Y.; Gao, C.; Zhang, W.; et al. The vernalization-induced long non-coding RNA VAS functions with the transcription factor TaRF2b to promote TaVRN1 expression for flowering in hexaploid wheat. Mol. Plant 2021, 14, 1525–1538. [Google Scholar] [CrossRef] [PubMed]
  14. Diallo, A.O.; Ali-Benali, M.A.; Badawi, M.; Houde, M.; Sarhan, F. Expression of vernalization responsive genes in wheat is associated with histone H3 trimethylation. Mol. Genet. Genom. 2012, 287, 575–590. [Google Scholar] [CrossRef] [PubMed]
  15. Adam, H.; Ouellet, F.; Kane, N.A.; Agharbaoui, Z.; Major, G.; Tominaga, Y.; Sarhan, F. Overexpression of TaVRN1 in Arabidopsis promotes early flowering and alters development. Plant Cell Physiol. 2007, 48, 1192–1206. [Google Scholar] [CrossRef] [PubMed] [Green Version]
  16. Butterworth, K.; Reid, A.; Sayers, L.; Worland, A.J. A comparison of the pleiotropic effects of photoperiod insensitive genes Ppd-A1, Ppd-B1 and Ppd-D1 in a Mercia winter wheat background. Ann. Wheat News 2001, 47, 230–231. [Google Scholar]
  17. Shaw, L.M.; Turner, A.S.; Laurie, D.A. The impact of photoperiod insensitive Ppd-1a mutations on the photoperiod pathway across the three genomes of hexaploid wheat (Triticum aestivum). Plant J. 2012, 71, 71–84. [Google Scholar] [CrossRef]
  18. Zhou, W.; Wu, S.; Ding, M.; Li, J.; Shi, Z.; Wei, W.; Guo, J.; Zhang, H.; Jiang, Y.; Rong, J. Mapping of Ppd-B1, A major candidate gene for late heading on wild emmer chromosome arm 2bs and assessment of its interactions with early heading QTLs on 3AL. PLoS ONE 2016, 11, e0147377. [Google Scholar] [CrossRef] [Green Version]
  19. Scarth, R.; Law, C.N. The location of the photoperiod gene, Ppd2 and an additional genetic factor for ear-emergence time on chromosome 2B of wheat. Heredity 1983, 51, 607–619. [Google Scholar] [CrossRef]
  20. Worland, A.J.; Börner, A.; Korzun, V.; Li, W.M.; Petrovíc, S.; Sayers, E.J. The influence of photoperiod genes on the adaptability of European winter wheats. Euphytica 1998, 100, 385–394. [Google Scholar] [CrossRef]
  21. Royo, C.; Dreisigacker, S.; Alfaro, C.; Ammar, K.; Villegas, D. Effect of Ppd-1 genes on durum wheat flowering time and grain filling duration in a wide range of latitudes. J. Agric. Sci. 2016, 154, 612–631. [Google Scholar] [CrossRef] [Green Version]
  22. Beales, J.; Turner, A.; Griffiths, S.; Snape, J.W.; Laurie, D.A. A pseudo-response regulator is misexpressed in the photoperiod insensitive Ppd-D1a mutant of wheat (Triticum aestivum L.). Theor. Appl. Genet. 2007, 115, 721–733. [Google Scholar] [CrossRef]
  23. Khlestkina, E.K.; Giura, A.; Röder, M.S.; Börner, A. A new gene controlling the flowering response to photoperiod in wheat. Euphytica 2009, 165, 579–585. [Google Scholar] [CrossRef]
  24. Wang, B.; Jin, S.H.; Hu, H.Q.; Sun, Y.G.; Wang, Y.W.; Han, P.; Hou, B.K. UGT87A2, an Arabidopsis glycosyltransferase, regulates flowering time via FLOWERING LOCUS C. New Phytol. 2012, 194, 666–675. [Google Scholar] [CrossRef] [PubMed]
  25. Kato, K.; Wada, T. Genetic analysis and selection experiment for narrow-sense earliness in wheat by using segregating hybrid progenies. Breed. Sci. 1999, 49, 233–238. [Google Scholar] [CrossRef]
  26. Gawroński, P.; Ariyadasa, R.; Himmelbach, A.; Poursarebani, N.; Kilian, B.; Stein, N.; Steuernagel, B.; Hensel, G.; Kumlehn, J.; Sehgal, S.K.; et al. A Distorted Circadian Clock Causes Early Flowering and Temperature-Dependent Variation in Spike Development in the Eps-3Am Mutant of Einkorn Wheat. Genetics 2014, 196, 1253–1261. [Google Scholar] [CrossRef] [Green Version]
  27. Zikhali, M.; Wingen, L.U.; Griffiths, S. Delimitation of the Earliness per se D1 (Eps-D1) flowering gene to a subtelomeric chromosomal deletion in bread wheat (Triticum aestivum). J. Exp. Bot. 2015, 67, 287–299. [Google Scholar] [CrossRef] [Green Version]
  28. Gawroński, P.; Schnurbusch, T. High-density mapping of the earliness per se-3Am (Eps-3Am) locus in diploid einkorn wheat and its relation to the syntenic regions in rice and Brachypodiumdistachyon L. Mol. Breed. 2012, 30, 1097–1108. [Google Scholar] [CrossRef]
  29. Bullrich, L.; Appendino, M.; Tranquilli, G.; Lewis, S.; Dubcovsky, J. Mapping of a thermo-sensitive earliness per se gene on Triticum monococcum chromosome 1Am. Theor. Appl. Genet. 2002, 105, 585–593. [Google Scholar] [CrossRef]
  30. van Beem, J.; Mohler, V.; Lukman, R.; van Ginkel, M.; William, M.; Crossa, J.; Worland, A.J. Analysis of genetic factors influencing the developmental rate of globally important CIMMYT wheat cultivars. Crop Sci. 2005, 45, 2113–2119. [Google Scholar] [CrossRef]
  31. Feldman, M.; Millet, E.; Abbo, S.; Balfourier, F.; Perretant, M. Exploitation of wild emmer wheat to increase yield and protein content in durum and common wheat. In Proceedings of the Genetic Resources Section Meeting of EUCARPIA, Clermont-Ferrand, France, 15–18 March 1994; pp. 151–161. [Google Scholar]
  32. Nevo, E. Genomic diversity in nature and domestication. In Plant Diversity Evolution: Genotypic Phenotypic Variation in Higher Plants; CABI ebook: Lismore, NSW, Australia, 2005; pp. 287–315. [Google Scholar]
  33. Xie, W.; Nevo, E. Wild emmer: Genetic resources, gene mapping and potential for wheat improvement. Euphytica 2008, 164, 603–614. [Google Scholar] [CrossRef]
  34. Ahmadi, H.; Nazarian, F. The inheritance and chromosomal location of morphological traits in wild wheat, Triticum turgidum L. ssp. dicoccoides. Euphytica 2007, 158, 103–108. [Google Scholar] [CrossRef]
  35. Millet, E.; Rong, J.K.; Qualset, C.O.; McGuire, P.E.; Bernard, M.; Sourdille, P.; Feldman, M. Production of chromosome-arm substitution lines of wild emmer in common wheat. Euphytica 2013, 190, 1–17. [Google Scholar] [CrossRef]
  36. Zhou, Y.; Cao, H.; Hou, M.; Nirasawa, S.; Tatsumi, E.; Foster, T.J.; Cheng, Y. Effect of konjac glucomannan on physical and sensory properties of noodles made from low-protein wheat flour. Food Res. Int. 2013, 51, 879–885. [Google Scholar] [CrossRef]
  37. Sinclair-Waters, M.; Bradbury, I.R.; Morris, C.J.; Lien, S.; Kent, M.P.; Bentzen, P. Ancient chromosomal rearrangement associated with local adaptation of a postglacially colonized population of Atlantic Cod in the northwest Atlantic. Mol. Ecol. 2018, 27, 339–351. [Google Scholar] [CrossRef]
  38. Yu, S.; Wu, J.; Wang, M.; Shi, W.; Xia, G.; Jia, J.; Kang, Z.; Han, D. Haplotype variations in QTL for salt tolerance in Chinese wheat accessions identified by marker-based and pedigree-based kinship analyses. Crop J. 2020, 8, 1011–1024. [Google Scholar] [CrossRef]
  39. Chen, S.; Zhou, Y.; Chen, Y.; Gu, J. fastp: An ultra-fast all-in-one FASTQ preprocessor. Bioinformatics 2018, 34, i884–i890. [Google Scholar] [CrossRef]
  40. Appels, R.; Eversole, K.; Stein, N.; Feuillet, C.; Keller, B.; Rogers, J.; Pozniak, C.J.; Choulet, F.; Distelfeld, A.; Poland, J.; et al. Shifting the limits in wheat research and breeding using a fully annotated reference genome. Science 2018, 361, eaar7191. [Google Scholar]
  41. Kim, D.; Paggi, J.M.; Park, C.; Bennett, C.; Salzberg, S.L. Graph-based genome alignment and genotyping with HISAT2 and HISAT-genotype. Nat. Biotechnol. 2019, 37, 907–915. [Google Scholar] [CrossRef]
  42. Li, H.; Durbin, R. Fast and accurate short read alignment with Burrows-Wheeler transform. Bioinformatics 2009, 25, 1754–1760. [Google Scholar] [CrossRef] [Green Version]
  43. Li, H.; Handsaker, B.; Wysoker, A.; Fennell, T.; Ruan, J.; Homer, N.; Marth, G.; Abecasis, G.; Durbin, R. The Sequence Alignment/Map format and SAMtools. Bioinformatics 2009, 25, 2078–2079. [Google Scholar] [CrossRef] [Green Version]
  44. McKenna, A.; Hanna, M.; Banks, E.; Sivachenko, A.; Cibulskis, K.; Kernytsky, A.; Garimella, K.; Altshuler, D.; Gabriel, S.; Daly, M.; et al. The Genome Analysis Toolkit: A MapReduce framework for analyzing next-generation DNA sequencing data. Genome Res. 2010, 20, 1297–1303. [Google Scholar] [CrossRef] [Green Version]
  45. Yu, G.; Hatta, A.; Periyannan, S.; Lagudah, E.; Wulff, B.B.H. Isolation of Wheat Genomic DNA for Gene Mapping and Cloning. In Wheat Rust Diseases. Methods in Molecular Biology; Periyannan, S., Ed.; Humana Press: New York, NY, USA, 2017; Volume 1659, pp. 207–213. [Google Scholar]
  46. Meng, L.; Li, H.; Zhang, L.; Wang, J. QTL IciMapping: Integrated software for genetic linkage map construction and quantitative trait locus mapping in biparental populations. Crop J. 2015, 3, 269–283. [Google Scholar] [CrossRef] [Green Version]
  47. Law, C.N.; Wolfe, M.S. Location of genetic factors for mildew resistance and ear emergence time on chromosome 7B of wheat. Can. J. Genet. Cytol. 1966, 8, 462–470. [Google Scholar] [CrossRef]
  48. Li, S.; Wang, J.; Zhang, L. Inclusive Composite Interval Mapping of QTL by Environment Interactions in Biparental Populations. PLoS ONE 2015, 10, e0132414. [Google Scholar] [CrossRef] [PubMed] [Green Version]
  49. Kosová, K.; Prášil, I.T.; Vítámvás, P. The relationship between vernalization-and photoperiodically-regulated genes and the development of frost tolerance in wheat and barley. Biol. Plant. 2008, 52, 601. [Google Scholar] [CrossRef]
  50. Yan, L.; Fu, D.; Li, C.; Blechl, A.; Tranquilli, G.; Bonafede, M.; Sanchez, A.; Valarik, M.; Yasuda, S.; Dubcovsky, J. The wheat and barley vernalization gene VRN3 is an orthologue of FT. Proc. Natl. Acad. Sci. USA 2006, 103, 19581–19586. [Google Scholar] [CrossRef] [PubMed] [Green Version]
  51. Maccaferri, M.; Sanguineti, M.C.; Corneti, S.; Ortega, J.L.A.; Salem, M.B.; Bort, J.; DeAmbrogio, E.; del Moral, L.F.G.; Demontis, A.; El-Ahmed, A.; et al. Quantitative trait loci for grain yield and adaptation of durum wheat (Triticum durum Desf.) across a wide range of water availability. Genetics 2008, 178, 489–511. [Google Scholar] [CrossRef] [Green Version]
  52. Bennett, D.; Izanloo, A.; Edwards, J.; Kuchel, H.; Chalmers, K.; Tester, M.; Reynolds, M.; Schnurbusch, T.; Langridge, P. Identification of novel quantitative trait loci for days to ear emergence and flag leaf glaucousness in a bread wheat (Triticum aestivum L.) population adapted to southern Australian conditions. Theor. Appl. Genet. 2012, 124, 697–711. [Google Scholar] [CrossRef]
  53. Dubcovsky, J.; Lijavetzky, D.; Appendino, L.; Tranquilli, G.E. Comparative RFLP mapping of Triticum monococcum genes controlling vernalization requirement. Theor. Appl. Genet. 1998, 97, 968–975. [Google Scholar] [CrossRef] [Green Version]
  54. Chen, A.; Dubcovsky, J. Wheat tilling mutants show that the vernalization gene VRN1 down-regulates the flowering repressor VRN2 in leaves but is not essential for flowering. PLoS Genet. 2012, 8, e1003134. [Google Scholar] [CrossRef] [Green Version]
  55. Yoo, S.Y.; Kim, Y.; Kim, S.Y.; Lee, J.S.; Ahn, J.H. Control of flowering time and cold response by a NAC-domain protein in Arabidopsis. PLoS ONE 2007, 2, e642. [Google Scholar] [CrossRef]
  56. Ando, E.; Ohnishi, M.; Wang, Y.; Matsushita, T.; Watanabe, A.; Hayashi, Y.; Fujii, M.; Ma, J.F.; Inoue, S.-I.; Kinoshita, T. TWIN SISTER OF FT, GIGANTEA, and CONSTANS Have a Positive but Indirect Effect on Blue Light-Induced Stomatal Opening in Arabidopsis. Plant Physiol. 2013, 162, 1529–1538. [Google Scholar] [CrossRef] [Green Version]
  57. Chen, X.; Lu, S.; Wang, Y.; Zhang, X.; Lv, B.; Luo, L.; Xi, D.; Shen, J.; Ma, H.; Ming, F. OsNAC2 encoding a NAC transcription factor that affects plant height through mediating the gibberellic acid pathway in rice. Plant J. 2015, 82, 302–314. [Google Scholar] [CrossRef]
  58. Jang, K.; Gil Lee, H.; Jung, S.-J.; Paek, N.-C.; Seo, P.J. The E3 Ubiquitin Ligase COP1 Regulates Thermosensory Flowering by Triggering GI Degradation in Arabidopsis. Sci. Rep. 2015, 5, 12071. [Google Scholar] [CrossRef]
  59. Galvão, V.C.; Horrer, D.; Küttner, F.; Schmid, M. Spatial control of flowering by DELLA proteins in Arabidopsis thaliana. Development 2012, 139, 4072–4082. [Google Scholar] [CrossRef] [Green Version]
Figure 1. Distribution of expressed genes and SNPs on chromosomes in CASL7BS based on the transcriptome and resequencing data. a: The length of chromosome and the position of centromere in wheat. The dark part is the long arm of the chromosome, and the light part is the short arm of the chromosome, the labels of 1A to 7D are the chromosome names of wheat, i.e. 1A is for chromosome 1A of wheat; b: the distribution of wheat annotated genes on chromosomes; c: the distribution of homozygous SNP detected by transcriptome data on the chromosome of CASL7BS; d: the distribution of the expressed genes on the chromosome of CASL7BS; e: the distribution of homozygous SNP detected by resequencing data on the chromosome of CASL7BS.
Agronomy 12 01089 g001
Figure 2. Distribution of homozygous SNPs between CS and TTD140 on chromosomes 5A (A) and 7B (B) in CASL7BS based on resequencing (above). The structure of chromosomes 5A and 7B identified by SSR are presented below. The black fragment represents the DNA segment from TTD140 and the white one from CS.
Agronomy 12 01089 g002
Figure 3. Heading date of CASL7BS and Chinese Spring (CS) planted in greenhouse and field in 2016, growth room, and field in 2017. Letters on the columns indicate the significance of HD difference at p < 0.05.
Agronomy 12 01089 g003
Figure 4. Heading date of CASL7BS and CS under different vernalization and photoperiod treatments. Arrows on the top of the white bars represent that the plants still do not head after growing for 120 d, which cannot be analyzed for significant difference. SS: vernalization and grown under short day; SL: vernalization under short day, but grown under long day; LS: vernalization under long day, but grown under short day (SD); LL: vernalization and grown under long day (LD). LD: 16 h light/8 h dark; SD: 8 h light/16 h dark. The letters represent the significance at p < 0.05.
Agronomy 12 01089 g004
Figure 5. Plants of CASL7BS and CS under different vernalization and photoperiod conditions. (a): No vernalization and grown under LD; (b): vernalization for 20 days and grown under short day. Two plants of CASL7BS (left) and CS (right) were planted in the same pot.
Agronomy 12 01089 g005
Figure 6. Young spikes in the different developmental stages of CASL7BS and CS. (a): No vernalization and grown under LD (18–25 °C, 16 h light/8 h dark); (b): vernalization under LD (4–7 °C, 16 h light/8 h dark) for about 20 d, but grown under SD (18–25 °C, 8 h light/16 h dark). A. Elongation stage; B. single ridge stage; C. two ridge stage; D. glume protuberances stage; E. floret differentiation stage, F. pistil and stamen differentiation stage; G. connective formation stage; H. Tetrad formation stage. Scale bars from A–D were equal to 200 μm, those from E–F equal to 1 mm.
Agronomy 12 01089 g006
Figure 7. Frequency of the plants with different heading dates in the (CASL7BS × CS) F2 populations grown in the field during 2016–2017 named as P1 (a) and in the growth room named as P2 in 2017 (b).
Agronomy 12 01089 g007
Figure 8. Genetic maps and QTL regions were created using the heading date and genotype data from two (CASL7BS × CS) F2 populations. (A): Chromosome 7B indicating the chromosome structure in CASL7BS and 7BL. The region highlighted with yellow is the common TTD segment shared by CASL7BS and CASL7BL. (B): The physical map. The region highlighted with red indicates the location of the HD-related QTL. (C,D): Genetic map constructed by P1 and P2 mapping populations. The regions highlighted with black indicate the locations of the HD-related QTL.
Agronomy 12 01089 g008
Figure 9. Fine mapping of the QTL related to heading date using (CS × CASL7BS) F2:3 and F3:4 families. (A): Physical map correspondence to the genetic map of Figure 8c, Region highlighted with red corresponded to the QTL region of the genetic map. (B): Constitute of the chromosome segment corresponding to that from WMC323 to C844 in genetic map in some F2 plants. (C): Physical map of the region around the QTL mapped by using F2 data. Four new indel markers with prefix of ZAFU were added in this map. (D): Constitute of the chromosome segment in some F3 plants. The segment highlighted with red is the locations of HD-related QTL, which were determined by genotype of SSR/indel markers and HDs. Grey bars represented the CS chromosome segments, black TTD chromosome segments, and bars with strip lines heterozygote ones. “Later” means that the F2:3 or F3:4 families have the similar HD as CS on average, “Early” means that the F2:3 or F3:4 families have the similar HD as CASL7BS on average. “Seg” means that the plants in F2:3 or F3:4 families segregated for HD.
Agronomy 12 01089 g009
Table 1. Young spike development process of CASL7BS and Chinese Spring (CS).
Development StageLong DayShort Day
CASL7BSCSCASL7BSCS
Elongation stage8121316
Single ridge stage10121518
Two ridge stage18241216
Glume protuberances stage3735
Floret differentiation stage3327
Pistil and stamen differentiation stage2226
Connective formation stage1223
Tetrad formation stage2425
Total47665176
Note: The numbers in the table are the days of each young spike development stage.
Table 2. Heading date of the F2 plants and their parents (CASL7BS and Chinese Spring).
YearParentsF2 Population
Mean ± SD
(d)
Range (d)CV (%)Mean ± SD
(d)
Range (d)CV (%)
2016–2017
(field)
CASL7BS142.5 ± 1.87 b140–1451.31146.5 ± 2.89 a141–1542.0
CS148.8 ± 2.48 a146–1531.67
2017
(growth room)
CASL7BS58.7 ± 2.16 f56–623.6897.7 ± 9.87 c69–1224.1
CS80.2 ± 1.47 d78–821.83
Note: The letters following the number indicating the significant difference at p < 0.05. CV: Coefficient of Variance; SD: Standard Deviation.
Table 3. QTL detection of heading date by using (CASL7BS × CS) F2 population.
YearF2 PopulationIntervalDistance (cM)LODAdditivePhenotypic Contribution (%)
2016–2017 (field)P1C268–C3908.947.681.099.14
2017 (growth room)P2C272–C3094.925.754.9112.35
Table 4. Heading date of (CASL7BS × CS) F2:3 families.
F2:3 and ParentsF3 PlantsRange (d)Mean ± SD (d)CV%Heading Date
C6092073–8478.3 ± 3.34.22Segregation
C6312279–8983.4 ± 3.03.59Late
C6144567–9178.8 ± 6.48.07Segregation
C6533168–7672.3 ± 2.43.33Early
C6266967–8777.7 ± 5.97.57Segregation
C6752180–8783.9 ± 3.23.82Late
C7852777–8983.1 ± 3.54.15Late
12783468–8978.2 ± 7.79.89Segregation
CASL7BS1067–7168.3 ± 1.11.54Early
CS1095–10097.3 ± 1.61.60Late
Publisher’s Note: MDPI stays neutral with regard to jurisdictional claims in published maps and institutional affiliations.

