Article

Dense Planting with Reducing Nitrogen Rate Increased Nitrogen Use Efficiency and Translocated Nitrogen in Grains in Double-Cropped Rice

1
Hunan Provincial Key Laboratory of Farmland Pollution Control and Agricultural Resources Use, Hunan Provincial Key Laboratory of Plant Nutrition in Common University, College of Resources and Environment, Hunan Agricultural University, Changsha 410128, China
2
National Engineering Laboratory for Efficient Utilization of Soil and Fertilizer Resources, Changsha 410128, China
3
State Key Laboratory of Hybrid Rice, Hunan Agricultural University, Changsha 410128, China
4
Yueyang Agricultural Sciences Institute, Yueyang 414000, China
*
Authors to whom correspondence should be addressed.
Agronomy 2022, 12(5), 1090; https://doi.org/10.3390/agronomy12051090
Submission received: 12 January 2022 / Revised: 18 April 2022 / Accepted: 27 April 2022 / Published: 29 April 2022
(This article belongs to the Special Issue Nitrogen Cycle in Farming Systems)

Abstract

:
Nitrogen fertilization and planting density are two key factors that influence the yield of rice. Reducing nitrogen fertilizer input and increasing planting density will help to improve nitrogen use efficiency and stabilize yield. Field and 15N tracer method in plot experiments were conducted to study the trends of yield, nitrogen use efficiency (NUE) and nitrogen transfer of hybrid rice and conventional rice under dense planting with a reduced nitrogen rate (DPRN) and sparse planting with a high nitrogen rate (SPHN). Among the nitrogen in rice plants, the proportion of nitrogen from fertilizer under the DPRN was reduced by 1.8–13%. The late-season rice (LSR) had a higher rate of decrease compared with the early-season rice (ESR). The uptake efficiency of nitrogen fertilizer was significantly higher under the DPRN than that under the SPHN, with an increase of 7.7–21.9%. The accumulated nitrogen and translocated ratio under the DPRN before the heading stage were 6.1–10.8% and 2.0–9.6% higher than those under the SPHN, respectively. The yield did not change under different treatments. Those findings suggest that the DPRN could guarantee a stabilized yield while increasing the NUE and the amount of translocated nitrogen in the double-cropped rice system.

1. Introduction

The area of rice cultivated in China exceeds 30 million hectares, comprising approximately 30% of the total area of cultivated crops, and the rice yield was more than 200 million tons, comprising more than 40% of the total grain yield [1]. The rice per unit area in China is relatively high and approximately 1.5 times higher than that of the global average, which corresponds to a rate of application of nitrogen fertilizers, that is approximately 75% higher than the global average [2]. In China, as the fertility level of paddy fields is different, the recommended amount of nitrogen fertilizer of rice fields varied. Generally, the recommended nitrogen application rate is 120–180 kg ha−1, but the average nitrogen application rate of rice fields in China is 215 kg ha−1, far exceeding the recommended nitrogen application rate [2,3]. The extremely high rate of application of nitrogen fertilizer may contribute to a significant increase in rice yield, while there is a subsequent decrease in nitrogen use efficiency (NUE) [4]. NUE refers to the percentage of nutrients absorbed by crops from the applied fertilizer in the total amount of such nutrients in nitrogen fertilizer in the current season, which reflects the utilization efficiency of crops to nitrogen fertilizer. Partial factor productivity of applied N (PFPN) refers to the ratio of crop yield to nitrogen application rate, which reflects the comprehensive production capacity of soil nutrients and nitrogen application. It is not only an important index to measure the production capacity of nitrogen fertilizer, but also an important measurement standard to reasonably control fertilization under the condition of maintaining a certain rice yield. The agronomic efficiency of applied N (AEN) refers to the grain yield increased by the unit nitrogen application. Therefore, the agronomic efficiency of nitrogen fertilizer directly reflects the yield increasing potential of rice varieties under the condition of fertilization, and is positively correlated with the yield of rice varieties in a certain range. China is the largest consumer of nitrogen fertilizer, but the NUE is only 30–40%, which is 15–20% lower than that of the other major rice producers [5,6]. The high rate of application of nitrogen fertilizer to ensure grain yield has enormous economic and environmental costs, which are not consistent with sustainable development. The rate of application of nitrogen fertilizer merits reduction while maintaining the yield of grain. The yield of rice is closely related to the NUE [7], thus, it is important to take effective practices to improve the NUE to ensure a high yield of rice [8].
Planting density and the rate of application of nitrogen fertilizer are two key factors that influence the NUE and yield of rice [9,10]. With the cultivation and promotion of high-yield and fertilizer-tolerant rice cultivars and the reduction of rural labor, sparse planting with a high rate of N (SPHN) of rice is becoming a notable management practice [11,12]. Under sparse planting, higher base and tiller fertilizers are needed to promote tillering to compensate for the lack of basic seedlings, resulting in a common planting system of the SPHN [13,14]. Excessive nitrogen application under the SPHN not only reduces NUE but has adverse effects on biodiversity, human health, and climate, and even poses a substantial challenge to nitrogen cycle [15,16,17]. The excessive application of nitrogen is not suitable for rice planting system, but a direct reduction in the rate of application of nitrogen fertilizer may lead to a deficiency in nitrogen for crop growth, resulting in reduced yield [3,18]. Nitrogen management is particularly critical to rice production. The amount of nitrogen application determines the lower limit of rice yield, while the operation of nitrogen application period and the ratio of base, tiller and panicle fertilizer determine the upper limit of rice yield. In addition, a reasonable nitrogen application ratio is also of great significance to the quality and yield stability of double cropping rice. Increasing the proportion of nitrogen application in the later stage of rice growth can significantly optimize population quality, improve yield and nitrogen utilization efficiency. Additionally, the way of applying nitrogen fertilizer, the type of nitrogen fertilizer and the ratio of nitrogen fertilizer and other fertilizers also play a great role in the formation of rice yield. Nitrogen is very important to the nitrogen accumulation and yield formation of rice plants. Under a certain amount of nitrogen application, with the increase of nitrogen application, the nitrogen accumulation of rice plants is higher, but the yield does not increase all the time. Therefore, an optimized rate of application of nitrogen fertilizer should be obtained that considers both environmental demand and crop yield.
The optimized rate of application of nitrogen fertilizer is controlled by various factors, such as climate, soil conditions, and nitrogen demand by the plants. To obtain maximal economic benefits, an appropriate rate of application of nitrogen fertilizer is required [19]. A reduction in the rate of application of nitrogen fertilizer in SPHN may increase the NUE, but it is not effective at guaranteeing a high yield. Many agronomic characters of double cropping rice play an important role in the formation of yield. Within those agronomic characters, the role of tiller number, leaf area, effective panicle and grain number per panicle is particularly critical. The tillering ability and tillering panicle rate of rice are important factors affecting rice yield. The more the number of effective tillers, the higher the yield. Leaves are the main organ of rice photosynthesis. The size of leaf area determines the production and accumulation potential of dry matter per unit area in the early and middle stages of rice. The number of effective panicles and the number of grains per panicle directly determine the grain yield of rice, but the two are often negatively correlated. The reduction of nitrogen alone may result a decrease in the crop yield, setting rate, cereal quality, and stress tolerance [18]. The rate of application of a decreasing amount of nitrogen fertilizer and an increase in the dense planting are considered to be two effective management practice to ensure a stabilized yield of rice. Previous studies have demonstrated that increasing the planting density can mitigate the negative effects of reducing the amount of nitrogen fertilizer through an increase in the effective number of spikes per unit area and the number of grains per spike, and then maintaining or increasing the yield [14,20,21]. Most studies are limited to the changes in rice yield and components under dense planting with a reduction in nitrogen rate (DPRN). However, a comprehensive consideration of the changes in agronomic characteristics of rice, the translocation in rice, and the contribution of nitrogen fertilizer is absent.
This study aimed to investigate the effectiveness of the DPRN practice in the yield, NUE, and the agronomic traits based on field and microplot experiments. The effects of nitrogen accumulation in double-cropped rice on these variables were analyzed to provide more sufficient theoretical support for the practice. Given that the inherent factors of double-cropped rice may affect the effectiveness, a two-year field trial was conducted in Yong’an County to study the annual variation in yield, agronomic, and environmental impacts of rice seasons (early-season rice and late-season rice) and cultivars (hybrid and conventional rice). A microplot experiment was conducted in the same field plots to study the translocation of nitrogen fertilizer in rice plants through a 15N tracer method. Considering the lower fertility requirement of conventional rice compared with hybrid rice, we hypothesized that the conventional rice would be better adapted to the DPRN practice and more effective at improving the NUE and nitrogen translocation to compensate for the adverse effects of reduced nitrogen fertilization, thus, stabilizing or even increasing the yield. In addition, we expect that DPRN treatment will help to improve the population agronomic characters of double cropping rice, NUE and the nitrogen transport rate in double cropping rice plants, so as to achieve the stability of nitrogen accumulation and yield of aboveground population. Therefore, we chose a typical double cropping rice planting area to carry out the experiment. By comparing the differences between DPRN and SPHN, we verified our hypothesis, in order to explore the law of nitrogen accumulation, transport and stable yield of double cropping rice under DPRN.

2. Materials and Methods

2.1. Experimental Site

In 2018 and 2019, a field test was established in Yong’an County, Hunan Province, China (113°18′ E; 28°13′ N), and a microplot test was established in the same plot in 2019. Before the test setup, 20 cm soil samples were collected from the cultivated layer, and the physicochemical properties (Soil organic matter, pH, and nutrient levels) were determined [22]. Total N by the Kjeldahl N method; available N by alkaline hydrolysis diffusion; available P by colorimetry following extraction with 0.5 mol L−1 NaHCO3 (pH = 8.5); available K by flame photometry following extraction with 1 mol L−1 CH3COONH4 (pH = 7.0); pH by the use of deionized water to remove CO2 (1:1 soil/water, w/v); Soil organic matter was determined by the potassium dichromate external heating method. The soil texture was clay loam with total N 2.15 g kg−1, available N 170.33 mg kg−1, available P 26.81 mg kg−1, available K 154.91 mg kg−1, pH 6.30, and organic matter 38.88 g kg−1. The growth period of early-season rice (ESR) was from April to July and that of the late-season rice (LSR) was from July to November. The ESR cultivars were Zhuliangyou819 (ZLY819, hybrid rice) and Zhongjiazao17 (ZJZ17, conventional rice), and the LSR cultivars were Taiyou390 (TY390, hybrid rice) and Xiangwanxian13 (XWX13, conventional rice). The rice cultivars of this experiment received from the State Key Laboratory of Hybrid Rice in Hunan Agricultural University. These four kinds of rice are typical local rice varieties. The growth cycle of early rice is 120 days and that of late rice is 150 days.

2.2. Experimental Design

A two-year field test was conducted in a split-plot design with N fertilizer and planting density treatment as the main plot and cultivar as the secondary zone. In consideration of the nitrogen fertilizer and planting density, this experiment included DPRN and SPHN treatments with three replicated plots (30 m2 per plot). Based on the results of previous research and local habitual fertilization, we set two treatments: DPRN and SPHN, where SPHN treatment is the habitual treatment, and the nitrogen application amount of the SPHN treatment came from the comprehensive consideration of local soil fertility levels and farmer habit fertilization [14,20,23]. Meanwhile, we set up two non-nitrogen treatments as the control group, dense planting with non nitrogen rate (DPNN) and sparse planting with non nitrogen rate (SPNN), respectively. DPNN does not apply nitrogen, and the planting density and other management are consistent with DPRN. SPNN does not apply nitrogen, and the planting density and other management are consistent with SPHN. In the DPRN treatment, the nitrogen fertilizer for ESR and LSR was applied at 120 kg N ha−1 and the planting density was 364,000 plants ha−1 (spacing 25 × 11 cm) named DPRN–E and DPRN–L, respectively. In this experiment, the LSR under the SPHN treatment increased the fertilized amounts and reduced the planting density based on the local conditions. During the SPHN treatment, the amount of nitrogen fertilizer applied for the ESR was 150 kg N ha−1 with a density of 286,000 plants ha−1 (spacing 25 × 14 cm) named SPHN-E, and that for the LSR was 165 kg N ha−1 with a density of 235,000 plants ha−1 (spacing 25 × 17 cm) named DPHN-L. Urea was used as the source of nitrogen fertilizer. In the DPRN treatment, the rate of application of base fertilizer (the day before transplanting), tiller fertilizer (7 days after transplanting), and panicle fertilizer (the day before heading) of the ESR and LSR were 60, 36, and 24 kg N ha−1, respectively. In the SPHN treatment, the rate of application of base fertilizer, tiller fertilizer, and panicle fertilizer of the ESR were 75, 45, and 30 kg N ha−1, respectively, and those for the LSR were 82.5, 49.5, and 33 kg N ha−1, respectively.
The seeds were sown in seedbeds for seedling development. The sowing dates for the ESR were 25 March (2018) and 30 March (2019). The 27-day-old seedlings were transplanted on 21 April 2018, and the 29-day-old seedlings were transplanted to the field trial area on 28 April 2019, with two plants per hole. The dates for the LSR were sown on 24 June (2018), and 28 June (2019). Thirty-day-old seedlings were transplanted on 23 July 2018, and 28-day-old seedlings were transplanted to the field trial on 26 July 2019, with one plant per hole. Phosphorus fertilizer (75 kg P2O5 ha−1, fused calcium-magnesium phosphate) was applied as the base fertilizer. Potassium fertilizer (150 kg K2O ha−1, KCl) was applied as the base fertilizer and spike fertilizer at a ratio of 1:1. In 2019, a microplot experiment was arranged in the field experiment. Microplots of 1.35 m × 1.05 m were established in the middle of each plot (DPRN and SPHN treatments) of the field experiment, and 12 microplots were separated with sealed plastic sheets to separate water and fertilizer. Each microzone was replaced with 15N urea (5.10% isotope abundance, provided by the Shanghai Institute of Chemical Technology [Shanghai, China]). The application of fertilizer and the rice planting density in the microzones were consistent with those in the plots. Pesticides were used to prevent pests and diseases, and the weeding was done manually to avoid a reduction in yield.

2.3. Sampling and Measurement

From 10 days after seedling transplantation to the jointing stage, a row was fixed for each treatment, and its position was marked. The number of tillers was counted every 5 days. At the stages of jointing, heading, and grain-filling, 20 flag leaves (or the strongest leaves in absence of flag leaves) were randomly selected from each plot, and the SPAD value of leaves was measured using a chlorophyll meter (SPAD-502Plus, KONICA MINOLTA, Inc., Chiyoda City, Japan). Five representative rice plants were taken from each plot at the stages of jointing, heading, and filling, and all the leaves were cut off to determine the leaf area by the coefficient method (leaf area = leaf length × leaf width × 0.75). The leaf area index (LAI) was then calculated.
In two years of field trials, the aboveground parts of five rice plants were taken from each plot at the stages of tillering, jointing, heading, filling, and maturity, and then washed and divided into stems, leaves, and spikes. Samples were heated at 105 °C for 30 min to deactivate the enzymes and then dried to a constant weight in an oven at 65 °C and weighed. The nitrogen content was determined using a Kjeldahl nitrogen analyzer (VAP50), and the overall accumulation of nitrogen was calculated from the accumulation of dry matter. At the maturity stage of the ESR and LSR, a 5 m2 area was harvested from the center of plots to determine the yield (avoiding the sampling area), which was converted to a 14% moisture content yield. The samples were manually threshed, and solid and empty grains were separated by a wet cleaning method. Three sets of 30 g samples were collected randomly and counted from the solid grains. The solid and empty grains were dried at 70 °C to a constant weight to calculate the total number of grains per spike, the seed setting rate and the 1000-seed weight. The NUE was calculated as previously described by Xie et al. (2019) [14].
N U E = N 1 N 2 N
N1 represents nitrogen accumulation of aboveground plants in nitrogen application area;
N2 represents nitrogen accumulation of aboveground plants in non nitrogen application area;
N represents nitrogen application amount.
P F P N = Y 1 N
Y1 represents yield of nitrogen application area;
N represents nitrogen application amount.
A E N = Y 1 Y 2 N
Y1 represents yield of nitrogen application area;
Y2 represents yield in non nitrogen application area;
N represents nitrogen application amount.
In 2019, five rice plants were collected from the microplot before the double-cropped rice was headed. The dry matter mass and total plant nitrogen were measured. The content of 15N in the plant, measured by mass spectrometry (EA-IRMS), was used to calculate the total amount of nitrogen fertilizer in the plant. The remaining rice plants in the microplot was transplanted in exchange with the same area of rice outside the plot to ensure same density. Five plants were collected from each microzone at the heading, filling, and maturity stages, to measure their dry matter weight, total nitrogen, and in-plant nitrogen fertilizer.
N F = C × D A
NF represents Amount of nitrogen from fertilizer in each period of double cropping rice plant;
C represents 15N content of plant in each period;
D represents dry matter weight;
A represents 15N abundance (5.10%).
P F = N F N
PF represents proportion of nitrogen from fertilizer in rice plant;
NF represents Amount of nitrogen from fertilizer in each period of double cropping plant;
N represents total nitrogen accumulation of plant.
N A = C 1 × D 1 A
NA represents the amount of nitrogen absorption in the panicle (maturity stage);
C1 represents 15N content of rice panicle at harvest period in micro area;
D1 represents dry matter weight rice panicle;
A represents 15N abundance (5.10%).
N T = N P N A
NT represents the amount of nitrogen translocation in the panicle (maturity stage);
NP represents total nitrogen accumulation in panicle (maturity stage);
NA represents the amount of nitrogen absorption in the panicle (maturity stage).

2.4. Data Analysis

Data were summarized using Microsoft Excel 2016 (Redmond, WA, USA). An analysis of variance (ANOVA) was analyzed using the DPS software (v. 9.01). Least significant (LSD) test at the 5% significance level was applied to compare the mean for each variable, and the histograms were plotted using GraphPad Prism 7 (San Diego, CA, USA).

3. Results

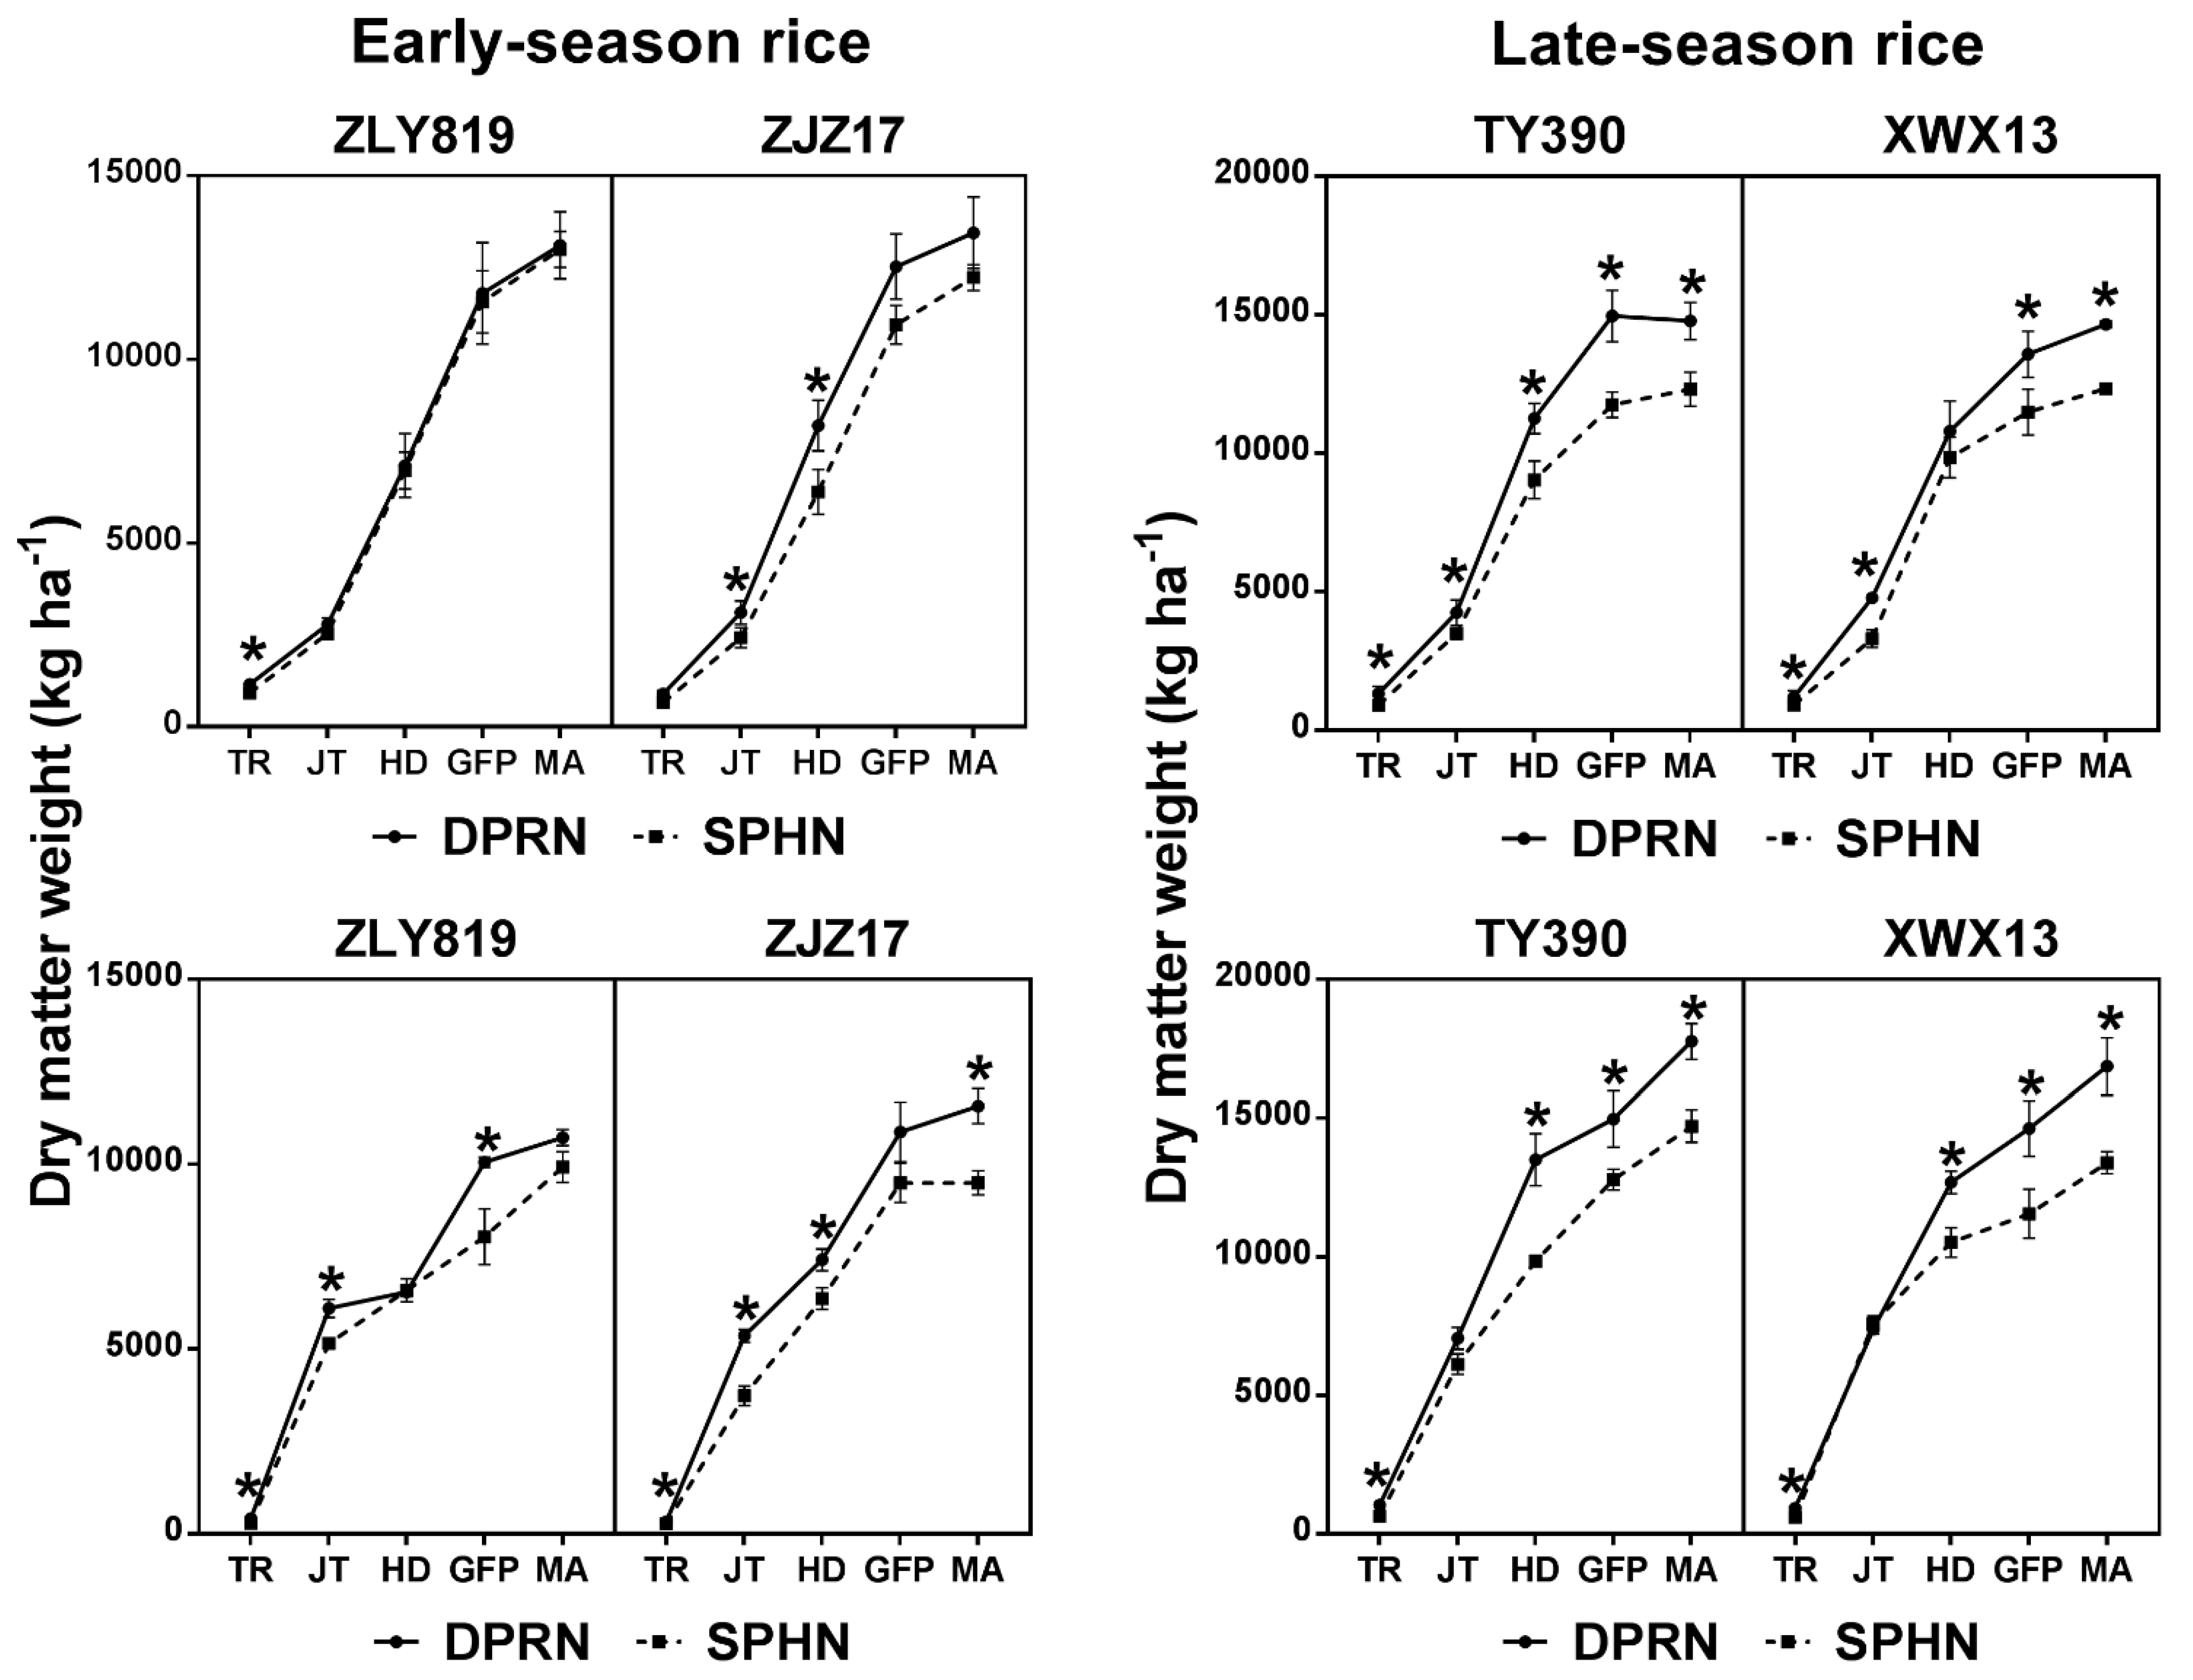
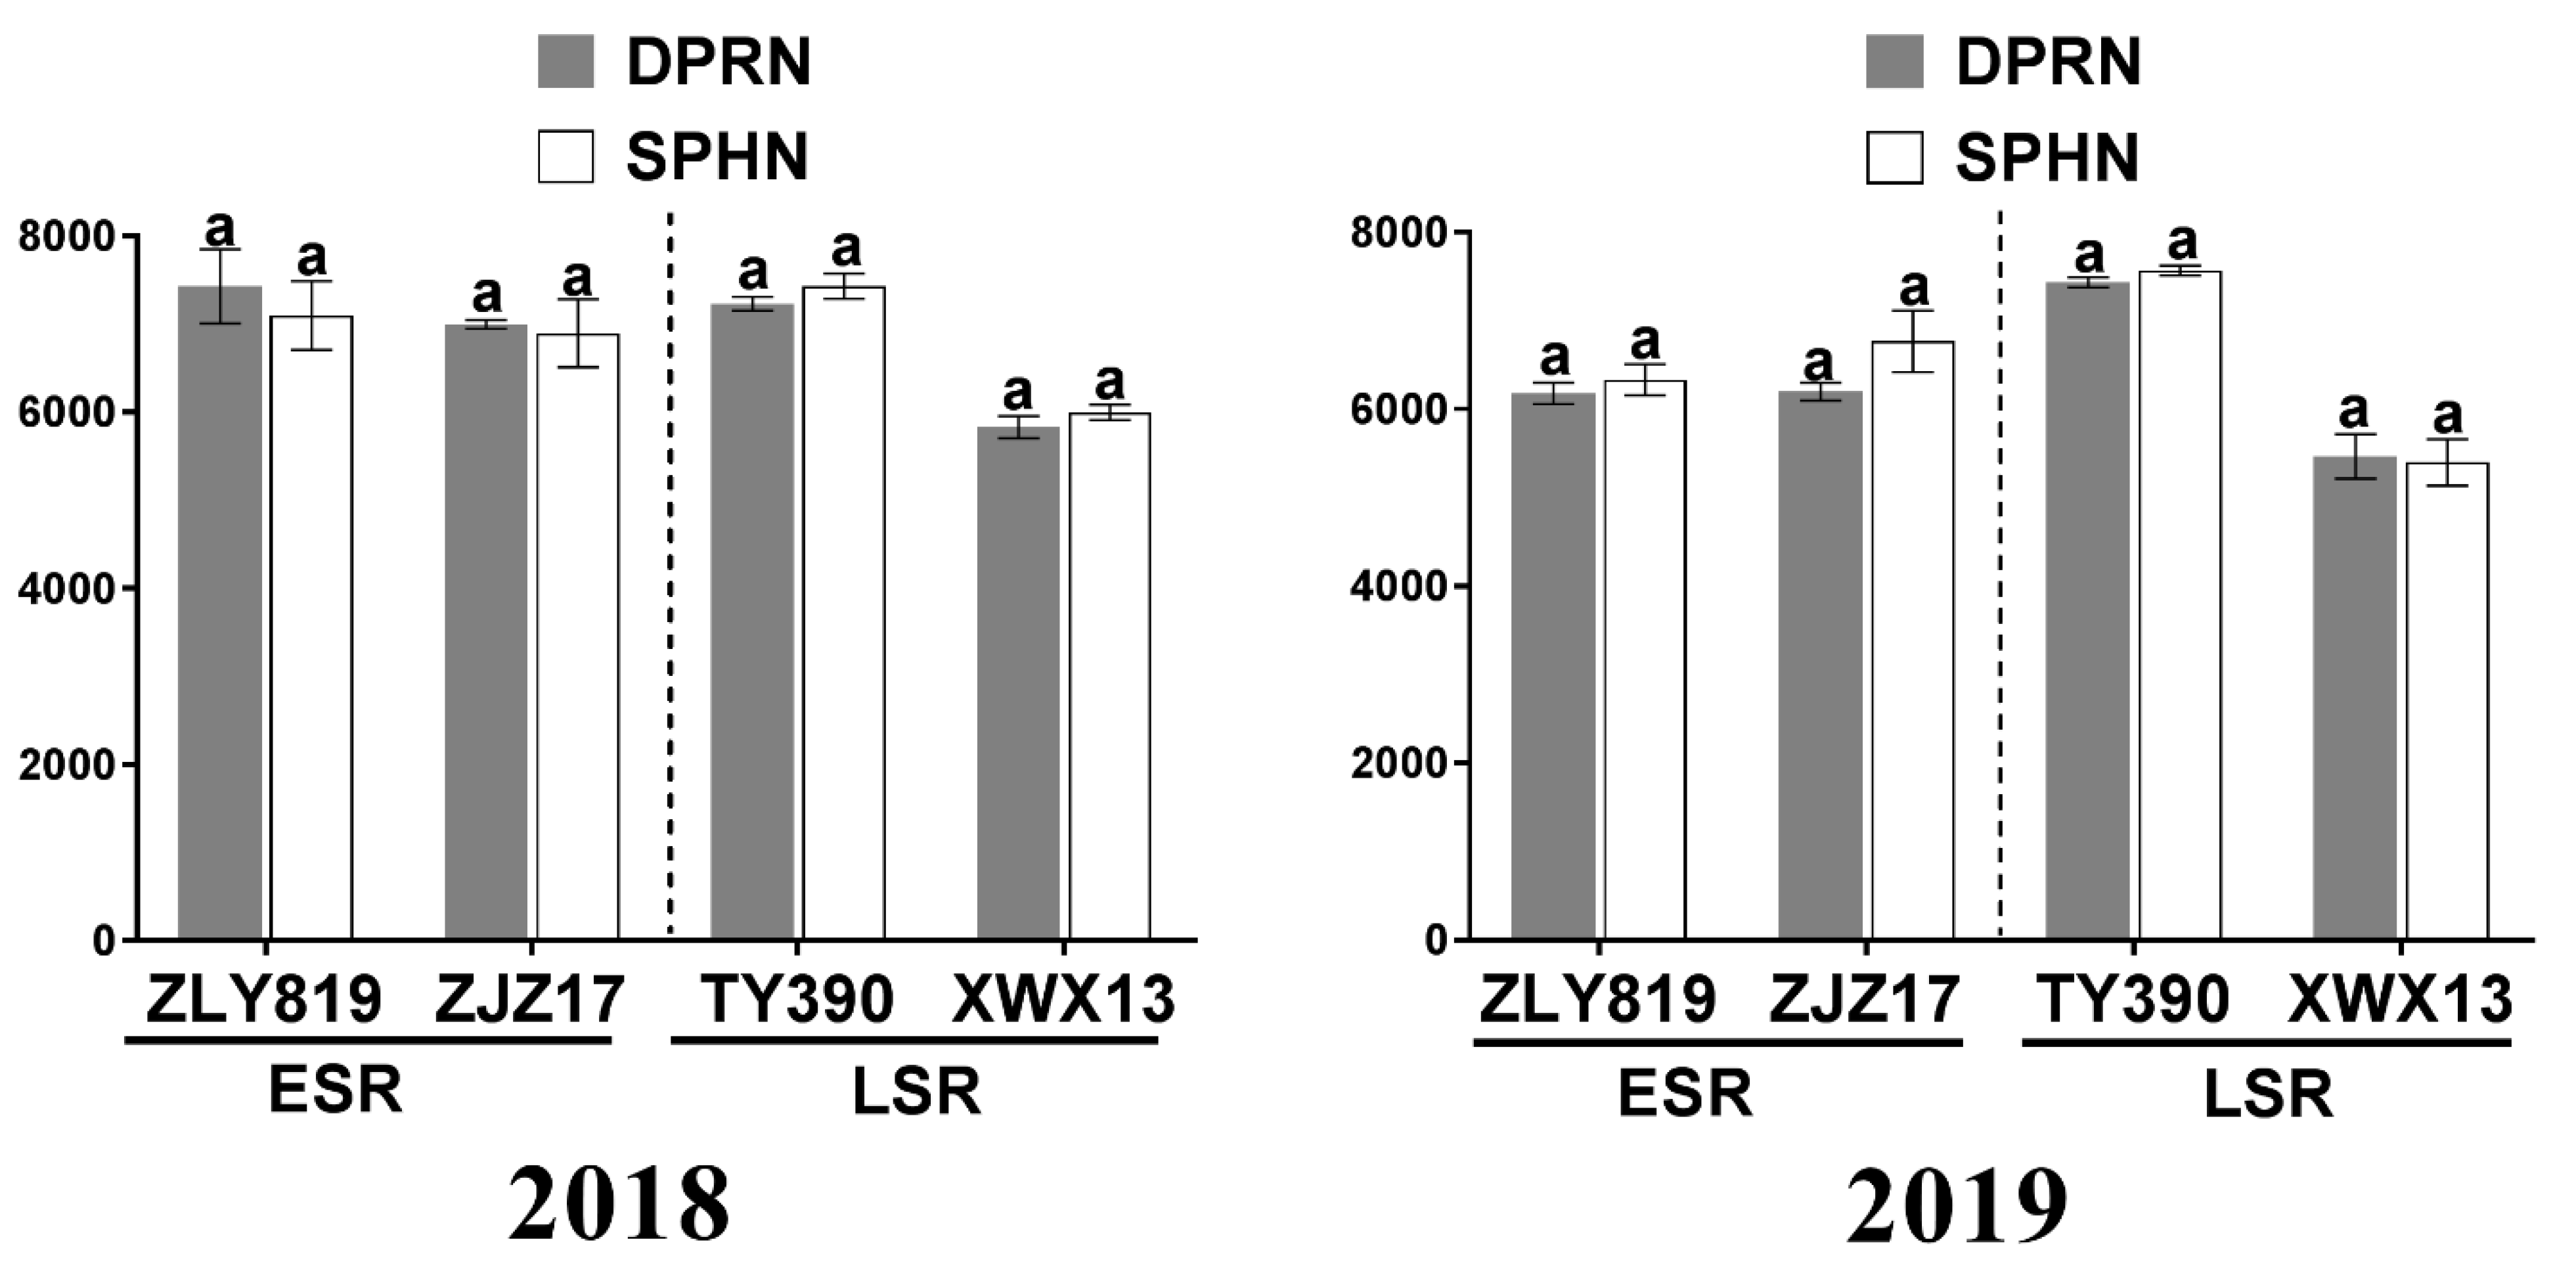
3.1. Rice Growth Status and Grain Yield

The number of tillers was significantly higher under DPRN than under SPHN in double-cropped rice. A significant difference in the number of tillers between DPRN and SPHN existed in the early tillering stage, but the difference gradually decreased during the late tillering stage. After the tiller growth, the number of tillers in ESR and LSR under the DPRN was 15–57% and 30–70% higher than that of the SPHN, respectively. However, there was no significant difference in the number of tillers between cultivars (Figure S1). The chlorophyll SPAD value of the DPRN was slightly lower than that of the SPHN (p > 0.05). The chlorophyll content of the DPRN and SPHN decreased from the heading to filling stages, and the difference between seasons and cultivars was insignificant (Figure S2). The LAI of the LSR cultivar XWX13 at the jointing stage in 2018, LSR cultivar TY390 at the filling stage, and XWX13 at the filling stage in 2019 under the DPRN were higher than those under the SPHN (p < 0.05). The LAI of the LSR cultivar TY390 at the heading stage in 2019 under the DPRN was lower than that under the SPHN (p < 0.05). Under the DPRN, the LAI of the conventional rice was higher than that of the hybrid rice (Figure 1).
The accumulation of dry matter was higher in the DPRN than that in the SPHN in double-cropped rice (Figure 2). In the ESR, the accumulation of dry matter of the DPRN differed significantly with that of the SPHN at the tillering stage for ZLY819 in 2018; jointing and heading stages for ZJZ17; tillering, jointing and filling stages for ZLY819 in 2019; and the tillering, jointing, heading and maturity stages in 2019 for ZJZ17. For the LSR, the difference between five stages of the TY390 in 2018, four stages (tillering, jointing, filling, and maturity) of the XWX13, four stages (tillering, heading, filling, and maturity) of the TY390 in 2019 and four stages (tillering, heading, filling and maturity) of the XWX13 reached significant levels. In terms of cultivars, both hybrid and conventional rice exhibited an increase in the accumulation of dry matter under the DPRN, and the levels of most of the rice stages were significant. The dry matter quality of double-cropped rice significantly correlated with the treatments and rice seasons, and the difference in rice seasons contributed to the difference in dry matter between treatments (Table 1).
The effective spike number of the DPRN was higher than that of the SPHN (Table S1). Only the difference between LSR XWX13 in 2018, ESR ZLY819, LSR TY390, and LSR XWX13 in 2019 were significant. The effective spike number of the LSR was higher than that of the ESR, and the effective spike number of the hybrid rice was higher than that of the conventional rice (Table 1). The number of grains per spike in the DPRN of the LSR TY390 (2018) and the ESR ZLY819 (2019) was higher than that of the SPHN (p < 0.05). The number of grains per spike in the DPRN of the LSR TY390 and XWX13D (2019) were lower than those of the SPHN (p < 0.05). Under the DPRN, there was no difference between cultivars. The average seed setting rate of two-year ESR (85.4%) was higher than that of the LSR (80.4%), and there was no difference between the rice seasons and cultivars (Table S1). The 1000 grain weight of the conventional cultivars was higher than that of the hybrid cultivars (Table 1). The harvest index of the DPRN was significantly higher than that of the SPHN for ESR ZJZ17 in 2019 (Table S1). There was no significant difference in yield between the DPRN and SPHN. The two-year average yield of the LSR XWX13 was 5675 kg ha−1, which was lower than the average value of the LSR (6642 kg ha−1) (Figure 3).

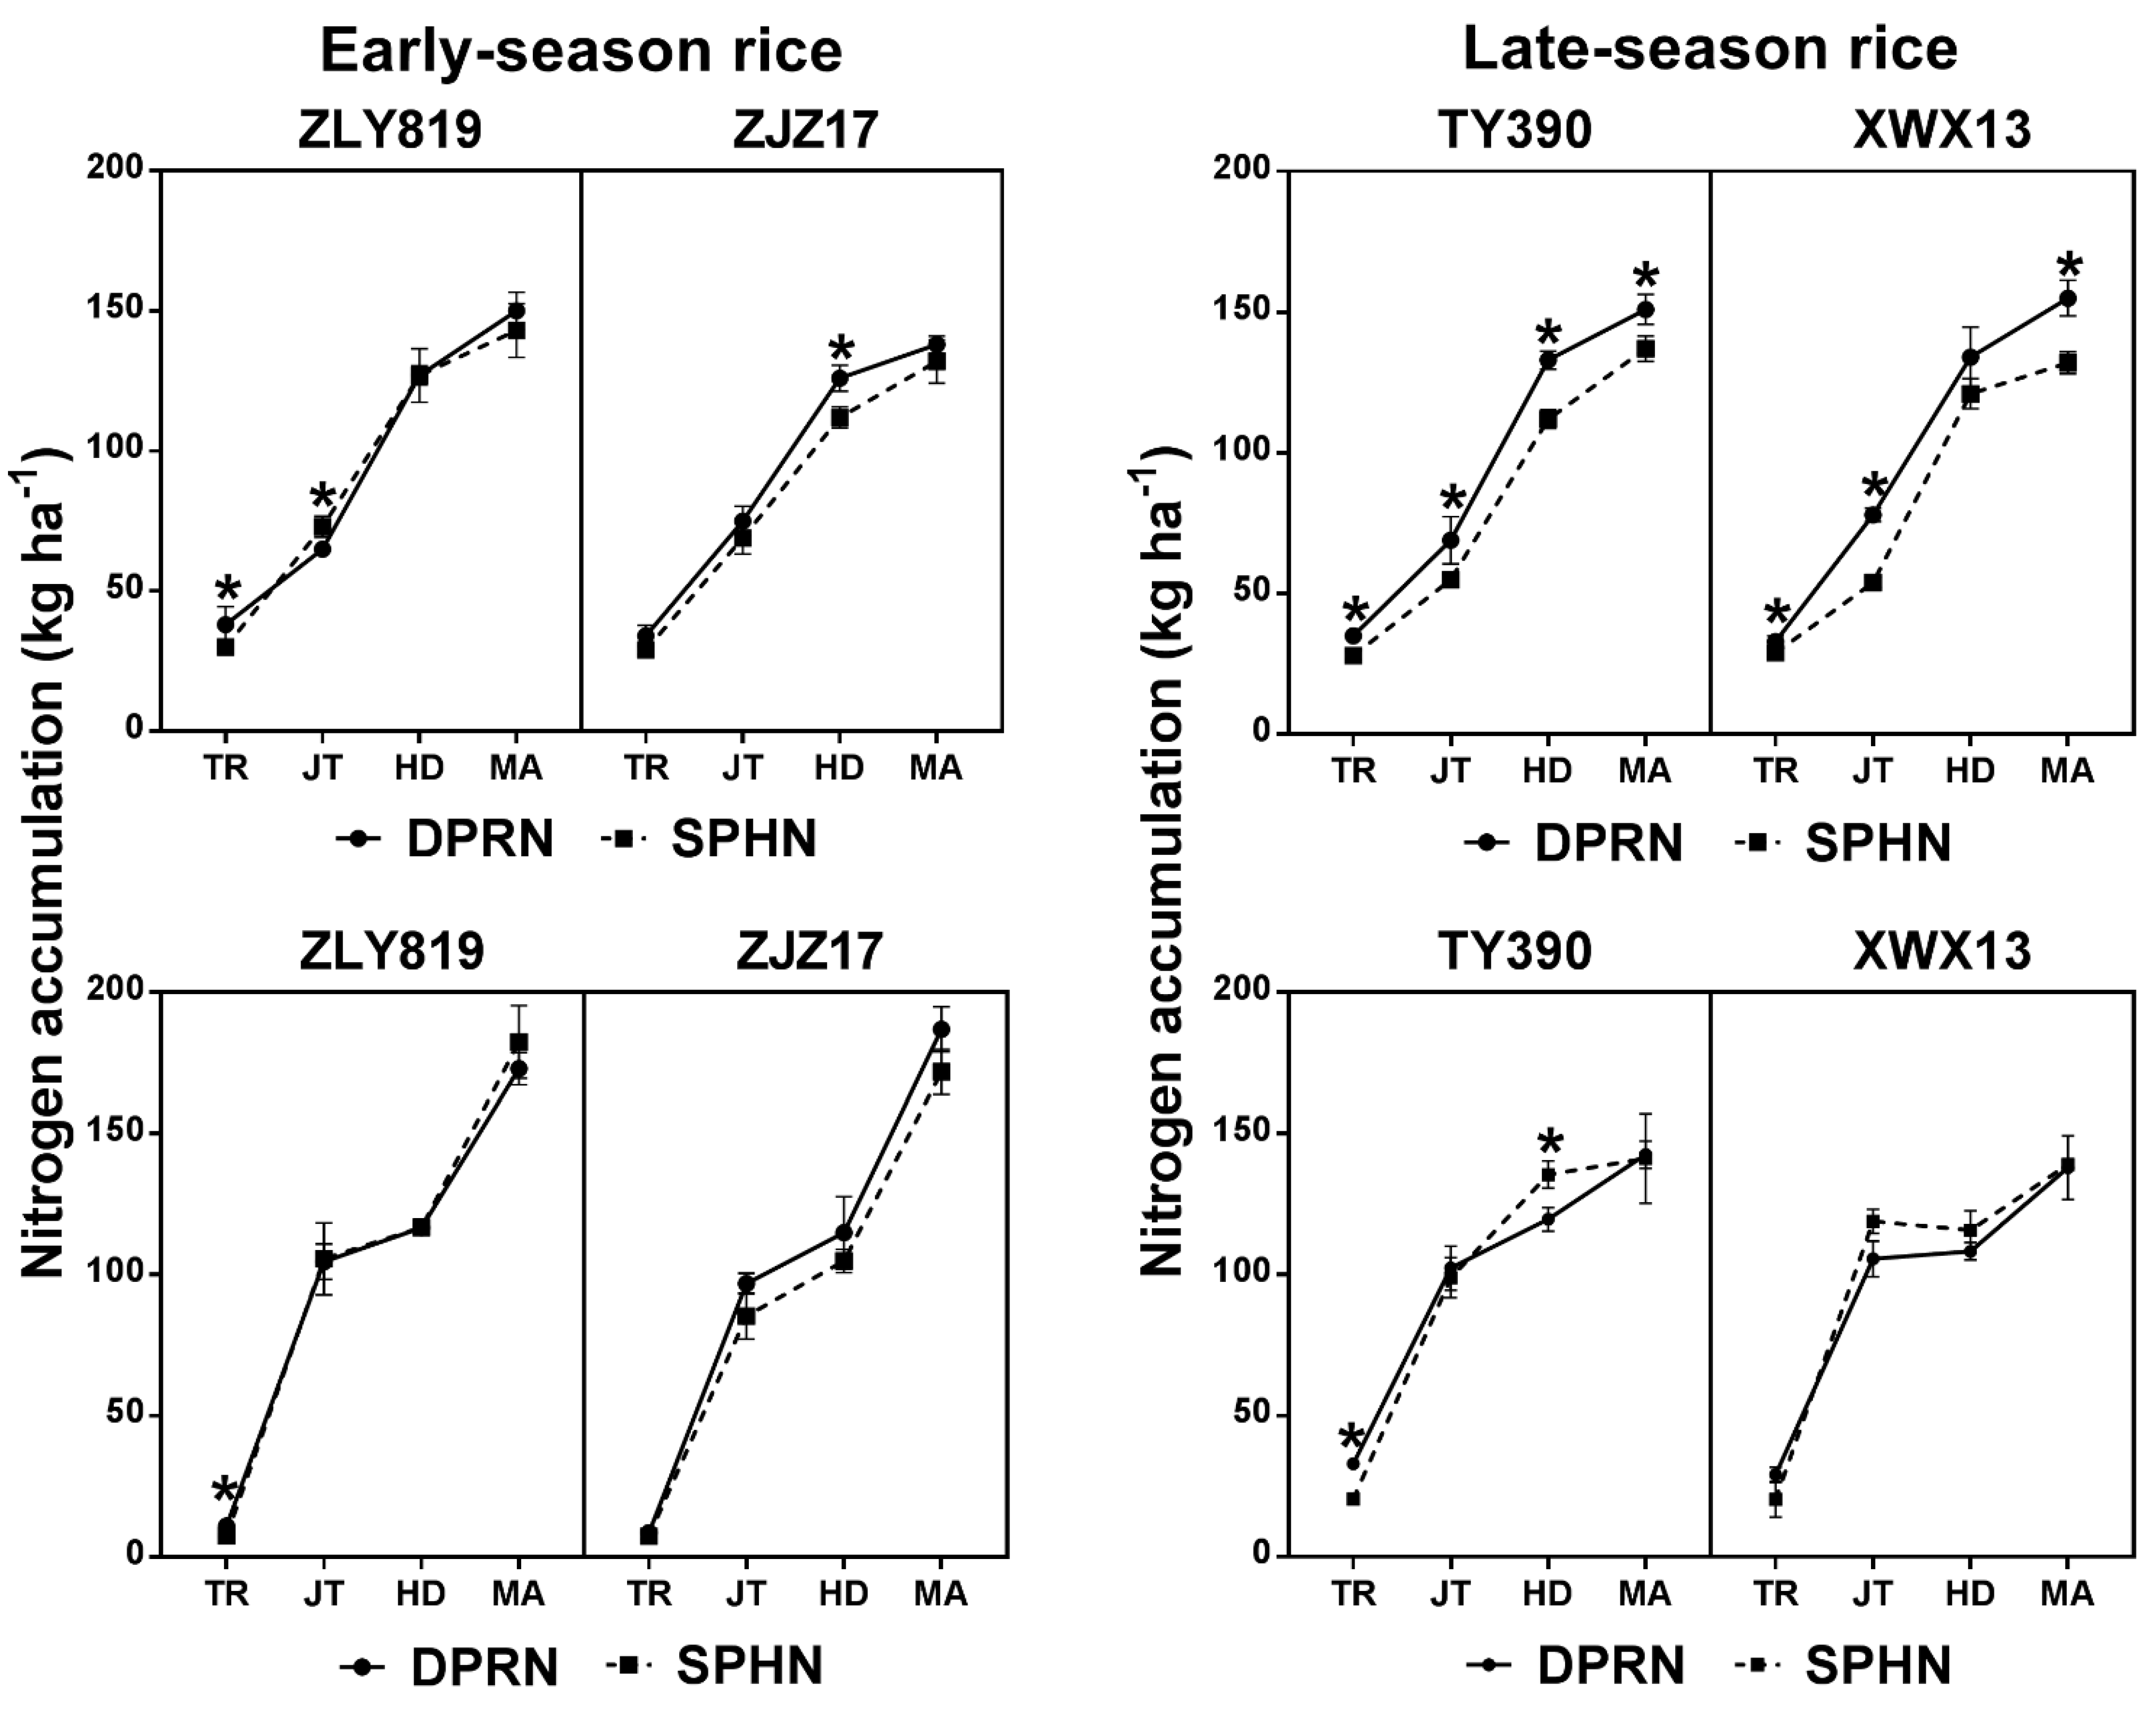
3.2. Nitrogen Accumulation in Plant and NUE

The accumulation of nitrogen to the DPRN was higher than that of the SPHN with the exception of the jointing stage of ESR ZLY819 in 2018 and the heading stage of LSR TY390 in 2019. For the ESR, the accumulation of nitrogen at the tillering stage of ZLY819 and the heading stage of ZJZ17 in 2018, and tillering stage of ZLY819 in 2019 under the DPRN was higher than that of the SPHN (p < 0.05). In terms of the LSR, the accumulation of nitrogen of the DPRN at the tillering, jointing, heading and maturity stages of TY390 and the tillering, jointing, maturity stages of XWX13 in 2018, and the tillering stage of TY390 in 2019, were higher than those of the SPHN (p < 0.05; Figure 4).
Compared with the SPHN, the NUE and partial factor productivity of applied N (PFPN), and the agronomic efficiency of applied N (AEN) increased in the DPRN (Table 2). The NUE of the DPRN was significantly higher than that of the SPHN, with the lowest increase for ESR ZLY819 in 2019 and the highest increase for LSR TY390 in 2018 (7.7–21.9%). There was no significant difference between rice seasons and cultivars. The PFPN of the DPRN was higher than that of SPHN, and the difference between the ESR in 2018 and the LSR in 2019 was significant, but there was no significant difference between rice seasons and cultivars. The AEN of the DPRN was significantly higher than that of the SPHN for both cultivars of the ESR in 2018, and the AEN of the DPRN was significantly lower than that of the SPHN for LSR XWX13 in 2018. The harvest index of the DPRN was slightly higher than that of SPHN. The average harvest index of the ESR (0.69) increased by 6.25% compared with that of the LSR (0.65).

3.3. Transport and Distribution of Nitrogen in Plants and the Contribution of Nitrogen Fertilizer

The amount and proportion of nitrogen absorbed before heading towards the spike were determined by a microplot experiment with 15N isotope labeling technique. The source of nitrogen in the spike was also analyzed. Before heading, the nitrogen that accumulated in vegetative organs (stems and leaves) was transported to reproductive organs (spikes). Compared with the SPHN, the amount and proportion of nitrogen transport in the DPRN increased by 2.0–9.6% and 6.1–10.8%, respectively. In terms of the source of nitrogen in the spike at maturity stage, in four cultivars of ESR and LSR, the proportion of nitrogen absorbed and transported to the vegetative organs before heading increased by 6.6–12.7% in the DPRN compared with the SPHN (Table 3). This indicated that the growth of spike depended more on nitrogen from vegetative organs when nitrogen input was reduced.
The proportion of nitrogen from nitrogen fertilizer in the nitrogen that accumulated in the aboveground parts of double-cropped rice was determined using the 15N labeling technique. Compared with the SPHN, the proportion of nitrogen from fertilizer in the aboveground tissues decreased after harvesting at the maturity stage in the DPRN (Table 4). The difference between the SPHN and DPRN of the ESR ZLY819 and ZJZ17 did not reach a significant level, with a decrease of 1.8% and 5.5%, respectively, while that of the LSR TY390 and XWX13 reached a significant level, with a decrease of 13% and 12.4%, respectively. The amount of fertilizer nitrogen under the DPRN decreased in both the LSR and ESR cultivars. The proportion of nitrogen from fertilizer in the aboveground tissues both before heading and after heading of the DPRN was lower than that of the SPHN. There was a significant difference between the SPHN and DPRN of the LSR. The proportion of nitrogen fertilizer from the LSR TY390 and XWX13 decreased by 6.5% and 7.3% before heading, respectively. The proportion of nitrogen fertilizer from the LSR TY390 and XWX13 decreased by 2.4% and 5.5% after heading, respectively. The decrease of nitrogen fertilizer in the LSR cultivars of the DPRN was higher than that of the ESR, while there was no significant difference between cultivars. The proportion of nitrogen fertilizer in the total nitrogen accumulation of the DPRN decreased before heading, after heading, and throughout the growth period compared with those of SPHN, and the difference between treatments of the LSR was significant.

4. Discussion

4.1. Study on High Yield for Double-Cropped Rice under the DPRN

After tillering, the tiller number of the DPRN was higher than that of the SPHN, suggesting that, under a reduction in the rate of application of nitrogen fertilizer, double-cropped rice had a group advantage and compensated for the individual disadvantage through reasonable dense planting, while increasing the population tiller number (Figure S1). In combination with yield, the tiller numbers increased by 15–70% when the rate of application of nitrogen fertilizer was reduced by 20–27% in the DPRN. Previous studies have shown that the rice tiller group can be regulated by density, and the number of tillers increased as the density increased [9,24]. The chlorophyll SPAD values in 2018 and 2019 were slightly lower in the DPRN than those in the SPHN treatment (Figure S2). Previous studies have shown that after reaching the optimal rate of application of nitrogen fertilizer, the individual chlorophyll content of rice gradually decreased as the rate decreased. However, a proper reduction in the rate of application was not significant, and it did not affect the yield [25].
The LAI of double-cropped rice significantly increased in the jointing-heading stage and decreased in the heading-filling stage, which might be attributed to the fact that the nutrient translocation was more noticeable during the later stages of rice growth, and the nutrients in leaves were transferred to grains in large quantities during the filling stage, resulting in a decrease in the LAI (Figure 1). A previous study showed that the leaf area of a single rice plant decreased owing to a reduction in the application of nitrogen and increased planting density [26]. A decrease in the amount of nitrogen fertilizer caused a reduction in the uptake of nutrients of individual plants, and dense planting led to intensified competition for light and growth space among individuals [27]. However, the increased density also improved the utilization of low light and growth space by rice population, and then increased the light, space, and NUE. These changes would contribute to a population advantage to offset the negative effects of the DPRN and maintain yield [27,28]. A study by Zhao et al. (2015) [28] found that a large amount of nutrients was transferred from the rice leaves to grains during the filling stage, resulting in a significant decrease in the LAI, which was consistent with our findings [29]. That is, the adverse effect of 20–27% reduction of nitrogen fertilizer input is offset by the increase of rice population. The leaf area of individual rice plant decreases, but the population leaf area increases. The accumulation of dry matter by double-cropped rice rapidly increased during the early stage and slowly increased during the middle and late stages. The accumulation of dry matter under the DPRN treatment was higher than that under the SPHN treatment. The reduction in the rate of application of nitrogen fertilizer led to a decrease in nitrogen content in rice plants, but a higher accumulation of dry matter caused by the reduction in the rate of application rate may provide an important basis for rice yield. A study by Fageria et al. (2008) [30] indicated that the yield of rice is positively related to rate of application of nitrogen fertilizer and the accumulation of dry matter. There was no significant difference in the adaptability of different varieties under DPRN, which showed that different varieties were suitable for DPRN cultivation.

4.2. Study on NUE Enhancement in Double-Cropped Rice under the DPRN

The NUE during the DPRN was higher than that under the SPHN (Table 2), suggesting that double-cropped rice significantly improved its uptake of nitrogen fertilizer and utilization efficiency. Studies on rice have shown that an appropriate DPRN is conducive to obtaining a group advantage and thus, avoiding the risks caused by changes in cropping practices [31]. The AEN of the DPRN of the LSR XWX13 in 2018 was lower than that of the SPHN, and the yield of the DPRN of the LSR XWX13 in 2018 was also lower than that of the SPHN. This could partially explain the slight decrease in yields. Beyond that, the AEN under the DPRN was higher than that of the SPHN. Overall, DPRN-driven improvement in the NUE of nitrogen fertilizer was an important factor in maintaining the nutritional requirement of the double-cropped rice. Nitrogen is very important to the nitrogen accumulation and yield formation of rice plants. With the increase of nitrogen application, the nitrogen accumulation of rice plants is higher, but the yield does not increase all the time. When the nitrogen application exceed a certain amount, it is not conducive to the absorption of nitrogen by the plant, which leads to the reduction of nitrogen use efficiency, but also not conducive to the transfer of nitrogen to grains, that is, too high nitrogen input will reduce nitrogen use efficiency. In this study, reducing the application of nitrogen fertilizer improved the nitrogen use efficiency, and increasing the planting density increased the number of rice populations, so the nitrogen accumulation of the population is maintained. Additionally, soil nitrogen is an important source of nitrogen for double-cropped rice. The nitrogen accumulation of DPRN in double cropping rice was not significantly lower than that of SPHN. An important reason was the improvement of nitrogen use efficiency in double cropping rice. However, it is not enough to only improve the utilization efficiency of nitrogen fertilizer. Double cropping rice population must obtain nitrogen sources from other ways, and this way is likely to be the nitrogen supply capacity of soil itself. Previous studies found that 30–50% of the nitrogen fertilizer applied remains in the soil after fertilization each season [32,33,34]. Improving the utilization of residual soil nitrogen could improve the NUE in current crop [35]. Sufficient nutrients must be supplied to ensure crop growth. When the external supply of nitrogen decreased to a certain level, the plants self-regulate, such as evolving genotypes for the efficient use of nutrients and reducing the nutrient supply to non-essential parts of the plant, while ensuring the supply for vital organs or increasing other ways to obtain nutrients [36,37].

4.3. Allocation of Nitrogen Translocation in Rice Plants under the DPRN

A microplot experiment showed that the transport ratio of double-cropped rice under the DPRN was significantly higher than that under the SPHN (Table 3). This finding indicated that the translocation of nitrogen from vegetative organs, such as stems and leaves, to reproductive organs would be increased after the DPRN. The reduction in supply of external nitrogen fertilizer would facilitate the translocation of nitrogen in rice aboveground. An appropriate reduction of nitrogen supply could help to increase the starch and non-structural carbohydrate (NSC) content in rice stems and leaves before the heading stage [38]. Low nitrogen promotes an increase in the activities of enzymes, such as AGPase, in the plant stems and then increases the accumulation and reuse of starch and the NSC in stems and leaves, which contributes to the mitigation of the negative effects caused by a reduction in nitrogen and the sustainability of rice production [38]. The jointing stage is a critical period in the rice supply strategy, and nitrogen uptake during this stage plays a decisive role in the formation of grain yield [39]. In this study, the nitrogen from pre-heading transport in spike increased, while the nitrogen absorbed after the heading was reduced under the DPRN. Compared with the SPHN, the overall accumulation of nitrogen in rice population under the DPRN did not change. The transport proportion of double cropping rice under DPRN is significantly higher than that under SPHN treatment, which indicates that under DPRN cultivation, double cropping rice will increase the transfer of nitrogen from vegetative organs such as stems and leaves to reproductive organs, and the reduction of external nitrogen supply will promote the nitrogen transport in the aboveground part of rice. The nitrogen in rice plants is mostly transported in the form of starch and NSC, that is, DPRN cultivation will improve the transport of starch and NSC. Those findings suggest that when double-cropped rice is planted under the DPRN, the gradient supply and full utilization of nutrients in the early stage were important, while appropriate field management practice should be taken during the later stage to promote nutrient translocation and reuse.
Compared with the SPHN, the rice nitrogen from the fertilizer decreased in the DPRN, and the decrease was more pronounced in the LSR than in the ESR (Table 4). Studies have shown that the rate of application of nitrogen fertilizer is not a determinant of yield formation in double-cropped rice, while the accumulation of nitrogen and the NUE of the plant are critical to yield formation; a reduction in the amount of nitrogen fertilizer might not be the cause of a reduction in the accumulation nitrogen of the plant [40]. From our results, the overall accumulation of nitrogen of the double-cropped rice in the DPRN was not significantly lower than that in the SPHN, suggesting that the accumulation of nitrogen by rice could be partially derived from other sources, such as soil nitrogen. Nitrogen sources, such as nitrogen fixed by soil microorganisms, wet- and dry-deposition nitrogen, and watershed nitrogen [41,42,43] will be discussed as part of our continued research.

5. Conclusions

The DPRN practice could maintain rice yield by increasing the transfer of nitrogen to the spike, reducing the demand for nitrogen fertilizer, and increasing the NUE of plant. The population effective spike number, population tiller number, and the accumulation of dry matter increased significantly under the DPRN. The DPRN practice did not influence the accumulation of nitrogen by the population but decreased the proportion of nitrogen in the rice that accumulated from fertilizer. The DPRN practice could cause an increase in the proportion of nitrogen that accumulated and transferred to the spikes before heading. The NUE, PFPN, and AEN all increased in the DPRN, and the NUE had the highest increase, followed by the PFPN. This is consistent with our research hypothesis. The reduction of nitrogen input will reduce the nitrogen absorption of individual rice plants, but the increase of density will increase the number of rice groups, so as to maintain the overall nitrogen accumulation of rice, improve the utilization efficiency of nitrogen fertilizer, and ensure that the nutritional supply of rice groups is not affected. Under the joint action of nitrogen reduction and density increase, the yield of rice does not decrease. Those findings suggest that the DPRN practice can maintain the yield stability of double-cropped rice and improve the plant NUE under the background of a reduced nitrogen fertilization.

Supplementary Materials

The following supporting information can be downloaded at: https://www.mdpi.com/article/10.3390/agronomy12051090/s1, Figure S1: Tiller dynamic of double-cropped rice under different treatments in 2018 and 2019. Figure S2: Chlorophyll content (SPAD) of the double-cropped rice under different treatments in 2018 and 2019. Table S1: The effective spike, grains per spike, seed setting rate (%), the 1000 grain weight, and the harvest index of the double-cropped rice under different treatments in 2018 and 2019.

Author Contributions

Z.L., H.S., M.H. and Z.P. conceptualized the project, investigated, collected, and analyzed the original draft of data; H.S. and G.L. project administration and supervision; Z.L., graph editing; Z.L., H.S. and G.L., review and editing; Z.Z., Z.P., Z.Y. and T.S. field and lab help. All authors have read and agreed to the published version of the manuscript.

Funding

This research was supported by a project supported by the National Key Research and Development Program of China (2017YFD0301503).

Institutional Review Board Statement

The study did not require ethical approval.

Informed Consent Statement

The study did not involve humans.

Data Availability Statement

All data generated or analyzed during this study are included in this published article.

Acknowledgments

We thank Wei Cao, Ming Zhang, and Yu Tan for help with conducting these field and microplot experiments and related measurements. We are grateful to Yinhang Xia and Shifu He for timely help with data analysis.

Conflicts of Interest

The authors declare no conflict of interest.

References

  1. Zhou, C.; Huang, Y.; Jia, B.; Wang, S.; Wang, Y. Optimization of nitrogen rate and planting density for improving the grain yield of different rice genotypes in northeast China. Agronomy 2019, 9, 555. [Google Scholar] [CrossRef] [Green Version]
  2. Zhang, H.; Yu, C.; Kong, X.; Hou, D.; Gu, J.; Liu, L.; Wang, Z.; Yang, J. Progressive integrative crop managements increase grain yield, nitrogen use efficiency and irrigation water productivity in rice. Field Crops Res. 2018, 215, 1–11. [Google Scholar] [CrossRef]
  3. Yin, Y.; Ying, H.; Xue, Y.; Zheng, H.; Zhang, Q.; Cui, Z. Calculating socially optimal nitrogen (N) fertilization rates for sustainable N management in China. Sci. Total Environ. 2019, 688, 1162–1171. [Google Scholar] [CrossRef] [PubMed]
  4. Peng, S.; Buresh, R.J.; Huang, J.; Zhong, X.; Zou, Y.; Yang, J.; Wang, G.; Liu, Y.; Hu, R.; Tang, Q.; et al. Improving nitrogen fertilization in rice by site-specific N management. A review. Agron. Sustain. Dev. 2010, 30, 649–656. [Google Scholar] [CrossRef]
  5. Wu, M.; Liu, M.; Liu, J.; Li, W.-T.; Jiang, C.-Y.; Li, Z.-P. Optimize nitrogen fertilization location in root-growing zone to increase grain yield and nitrogen use efficiency of transplanted rice in subtropical China. J. Integr. Agric. 2017, 16, 2073–2081. [Google Scholar] [CrossRef]
  6. Meng, X.; Li, Y.; Zhang, Y.; Yao, H. Green manure application improves rice growth and urea nitrogen use efficiency assessed using 15 N labeling. Soil Sci. Plant Nutr. 2019, 65, 1–8. [Google Scholar] [CrossRef]
  7. Ju, C.; Buresh, R.J.; Wang, Z.; Zhang, H.; Liu, L.; Yang, J.; Zhang, J. Root and shoot traits for rice varieties with higher grain yield and higher nitrogen use efficiency at lower nitrogen rates application. Field Crops Res. 2015, 175, 47–55. [Google Scholar] [CrossRef]
  8. Chu, G.; Chen, S.; Xu, C.; Wang, D.; Zhang, X. Agronomic and physiological performance of indica/japonica hybrid rice cultivar under low nitrogen conditions. Field Crops Res. 2019, 243, 107625. [Google Scholar] [CrossRef]
  9. Clerget, B.; Bueno, C.; Domingo, A.J.; Layaoen, H.L.; Vial, L. Leaf emergence, tillering, plant growth, and yield in response to plant density in a high-yielding aerobic rice crop. Field Crops Res. 2016, 199, 52–64. [Google Scholar] [CrossRef]
  10. Zhu, X.; Zhang, J.; Zhang, Z.; Deng, A.; Zhang, W. Dense planting with less basal nitrogen fertilization might benefit rice cropping for high yield with less environmental impacts. Eur. J. Agron. 2016, 75, 50–59. [Google Scholar] [CrossRef]
  11. Chen, S.; Yin, M.; Zheng, X.; Liu, S.; Chu, G.; Xu, C.; Wang, D.; Zhang, X. Effect of dense planting of hybrid rice on grain yield and solar radiation use in southeastern China. Agron. J. 2019, 111, 1229–1238. [Google Scholar] [CrossRef] [Green Version]
  12. Kakar, K.; Nitta, Y.; Asagi, N.; Komatsuzaki, M.; Shiotsu, F.; Kokubo, T.; Xuan, T.D. Morphological analysis on comparison of organic and chemical fertilizers on grain quality of rice at different planting densities. Plant. Prod. Sci. 2019, 22, 510–518. [Google Scholar] [CrossRef]
  13. Chen, Y.; Peng, J.; Wang, J.; Fu, P.; Hou, Y.; Zhang, C.; Fahad, S.; Peng, S.; Cui, K.; Nie, L.; et al. Crop management based on multi-split topdressing enhances grain yield and nitrogen use efficiency in irrigated rice in China. Field Crops Res. 2015, 184, 50–57. [Google Scholar] [CrossRef]
  14. Xie, X.; Shan, S.; Wang, Y.; Cao, F.; Chen, J.; Huang, M.; Zou, Y. Dense planting with reducing nitrogen rate increased grain yield and nitrogen use efficiency in two hybrid rice varieties across two light conditions. Field Crops Res. 2019, 236, 24–32. [Google Scholar] [CrossRef]
  15. Stein, L.Y.; Klotz, M.G. The nitrogen cycle. Curr. Biol. 2016, 26, R94–R98. [Google Scholar] [CrossRef] [Green Version]
  16. Stevens, C.J. Nitrogen in the environment. Science 2019, 363, 578–580. [Google Scholar] [CrossRef] [Green Version]
  17. Xiao, J.; Wang, Q.; Ge, X.; Zhu, L.; Wu, J. Defining the ecological efficiency of nitrogen use in the context of nitrogen cycling. Ecol. Indic. 2019, 107, 105493. [Google Scholar] [CrossRef]
  18. Lan, Y.; Sui, X.; Wang, J.; Duan, Q.; Li, T. Effects of nitrogen application rate on protein components and yield of low-gluten rice. Agriculture 2021, 11, 302. [Google Scholar] [CrossRef]
  19. Zhang, K.; Yang, D.; Greenwood, D.J.; Rahn, C.R.; Thorup-Kristensen, K. Development and critical evaluation of a generic 2-D agro-hydrological model (SMCR_N) for the responses of crop yield and nitrogen composition to nitrogen fertilizer. Agric. Ecosyst. Environ. 2009, 132, 160–172. [Google Scholar] [CrossRef] [Green Version]
  20. Huang, M.; Yang, C.; Ji, Q.; Jiang, L.; Tan, J.; Li, Y. Tillering responses of rice to plant density and nitrogen rate in a subtropical environment of southern China. Field Crops Res. 2013, 149, 187–192. [Google Scholar] [CrossRef]
  21. Xie, X.B.; Zhou, X.F.; Jiang, P.; Chen, J.N.; Zou, Y.B. Effect of low nitrogen rate combined with high plant density on grain yield and nitrogen use efficiency in super rice. Acta Agron. Sin. 2015, 41, 1591–1602, (In Chinese with English Abstract). [Google Scholar] [CrossRef]
  22. Zhang, Y.; Yan, J.; Rong, X.; Han, Y.; Yang, Z.; Hou, K.; Zhao, H.; Hu, W. Responses of maize yield, nitrogen and phosphorus runoff losses and soil properties to biochar and organic fertilizer application in a light-loamy fluvo-aquic soil—ScienceDirect. Agric. Ecosyst. Environ. 2021, 314, 107433. [Google Scholar] [CrossRef]
  23. Huang, M.; Chen, J.; Cao, F.; Zou, Y. Increased hill density can compensate for yield loss from reduced nitrogen input in machine-transplanted double-cropped rice. Field Crops Res. 2017, 221, 333–338. [Google Scholar] [CrossRef]
  24. Ao, H.; Peng, S.; Zou, Y.; Tang, Q.; Visperas, R.M. Reduction of unproductive tillers did not increase the grain yield of irrigated rice. Field Crops Res. 2010, 116, 108–115. [Google Scholar] [CrossRef]
  25. Cao, X.; Zhong, C.; Sajid, H.; Zhu, L.; Zhang, J.; Wu, L.; Jin, Q. Effects of watering regime and nitrogen application rate on the photosynthetic parameters, physiological characteristics, and agronomic traits of rice. Acta Physiol. Plant. 2017, 39, 135. [Google Scholar] [CrossRef]
  26. Xiong, D.; Wang, D.; Liu, X.; Peng, S.; Huang, J.; Li, Y. Leaf density explains variation in leaf mass per area in rice between cultivars and nitrogen treatments. Ann. Bot. 2016, 117, 963–971. [Google Scholar] [CrossRef] [Green Version]
  27. Liu, X.-J.; Cao, Q.; Yuan, Z.-F.; Liu, X.; Wang, X.-L.; Tian, Y.-C.; Cao, W.-X.; Zhu, Y. Leaf area index based nitrogen diagnosis in irrigated lowland rice. J. Integr. Agric. 2018, 17, 111–121. [Google Scholar] [CrossRef] [Green Version]
  28. Zhao, Y.; Xi, M.; Zhang, X.; Lin, Z.; Ding, C.; Tang, S.; Liu, Z.; Wang, S.; Ding, Y. Nitrogen effect on amino acid composition in leaf and grain of japonica rice during grain filling stage. J. Cereal Sci. 2015, 64, 29–33. [Google Scholar] [CrossRef]
  29. Jing, Q.; Dai, T.; Jiang, D.; Zhu, Y.; Cao, W. Spatial distribution of leaf area index and leaf N content in relation to grain yield and nitrogen uptake in rice. Plant. Prod. Sci. 2007, 10, 136–145. [Google Scholar] [CrossRef]
  30. Fageria, N.K.; Santos, A.B.; Cutrim, V.A. Dry matter and yield of lowland rice genotypes as influence by nitrogen fertilization. J. Plant Nutr. 2008, 31, 788–795. [Google Scholar] [CrossRef]
  31. Zheng, H.; Chen, Y.; Chen, Q.; Li, B.; Zhang, Y.; Jia, W.; Mo, W.; Tang, Q. High-density planting with lower nitrogen application increased early rice production in a double-season rice system. Agron. J. 2020, 112, 205–214. [Google Scholar] [CrossRef] [Green Version]
  32. Zhu, Z.L.; Chen, D.L. Nitrogen fertilizer use in China—Contributions to food production, impacts on the environment and best management strategies. Nutr. Cycl. Agroecosyst. 2002, 63, 117–127. [Google Scholar] [CrossRef]
  33. Ju, X.-T.; Liu, X.-J.; Pan, J.-R.; Zhang, F.-S. Fate of N-15-labeled urea under a winter wheat-summer maize rotation on the North China Plain. Pedosphere 2007, 17, 52–61. [Google Scholar] [CrossRef]
  34. Sun, B.; Shen, R.-P.; Bouwman, A.F. Surface N balances in agricultural crop production systems in China for the period 1980–2015. Pedosphere 2008, 18, 304–315. [Google Scholar] [CrossRef]
  35. Kawachi, T.; Sueyoshi, K.; Nakajima, A.; Yamagata, H.; Sugimoto, T.; Oji, Y. Expression of asparagine synthetase in rice (Oryza sativa) roots in response to nitrogen. Physiol. Plant. 2002, 114, 41–46. [Google Scholar] [CrossRef]
  36. Ikeda, S.; Sasaki, K.; Okubo, T.; Yamashita, A.; Terasawa, K.; Bao, Z.; Liu, D.; Watanabe, T.; Murase, J.; Asakawa, S. Low Nitrogen Fertilization Adapts Rice Root Microbiome to Low Nutrient Environment by Changing Biogeochemical Functions. Microbes Environ. 2014, 29, 50–59. [Google Scholar] [CrossRef] [Green Version]
  37. Chien, P.S.; Chiang, C.B.; Wang, Z.; Chiou, T.J. MicroRNA-mediated signaling and regulation of nutrient transport and utilization. Curr. Opin. Plant Biol. 2017, 39, 73–79. [Google Scholar] [CrossRef]
  38. Li, G.; Hu, Q.; Shi, Y.; Cui, K.; Nie, L.; Huang, J.; Peng, S. Low nitrogen application enhances starch-metabolizing enzyme activity and improves accumulation and translocation of non-structural carbohydrates in rice stems. Front. Plant Sci. 2018, 9, 1128. [Google Scholar] [CrossRef]
  39. Zhou, W.; Lv, T.; Zhang, P.; Huang, Y.; Chen, Y.; Ren, W. Regular nitrogen application increases nitrogen utilization efficiency and grain yield in Indica hybrid rice. Agron. J. 2016, 108, 1951–1961. [Google Scholar] [CrossRef]
  40. Xu, L.; Yuan, S.; Wang, X.; Yu, X.; Peng, S. High yields of hybrid rice do not require more nitrogen fertilizer than inbred rice: A meta-analysis. Food Energy Secur. 2021, 10, e276. [Google Scholar] [CrossRef]
  41. Yoshinaga, I.; Miura, A.; Hitomi, T.; Hamada, K.; Shiratani, E. Runoff nitrogen from a large sized paddy field during a crop period. Agric. Water Manag. 2007, 87, 217–222. [Google Scholar] [CrossRef]
  42. Berlin, M.; Kumar, G.S.; Nambi, I.M. Numerical modelling on transport of nitrogen from wastewater and fertilizer applied on paddy fields. Ecol. Model. 2014, 278, 85–99. [Google Scholar] [CrossRef]
  43. Xia, X.; Zhang, S.; Li, S.; Zhang, L.; Wang, G.; Zhang, L.; Wang, J.; Li, Z. The cycle of nitrogen in river systems: Sources, transformation, and flux. Environ. Sci. Processes Impacts 2018, 20, 863–891. [Google Scholar] [CrossRef] [PubMed]
Figure 1. Leaf area index (LAI) of double-cropped rice under different treatments in 2018 and 2019. Data points represent treatment means (n = 3), and different letters indicate significant differences (p < 0.05). DPRN–E represents dense planting with a reduced nitrogen rate in early-season rice; SPHN−E represents sparse planting with a high nitrogen rate in early-season rice; DPRN−L represents dense planting with a reduced nitrogen rate in late-season rice; SPHN-L represents sparse planting with a high nitrogen rate in late-season rice. ZLY 819 (hybrid rice) and ZJZ17 (conventional rice) belong to the early-season rice cultivar; TY 390 (hybrid rice) and XWX 13 (conventional rice) belong to the late-season rice cultivar. JT represents the jointing stage; HD represents the heading stage; GFP represents the grain filling period; * represents significances at p < 0.05.
Agronomy 12 01090 g001
Figure 2. Dry matter weight of double-cropped rice under different treatments in 2018 and 2019. Data points represent treatment means (n = 3), and different letters indicate significant differences (p < 0.05). DPRN represents dense planting with a reduced nitrogen rate; SPHN represents sparse planting with a high nitrogen rate; ZLY 819 (hybrid rice) and ZJZ17 (conventional rice) belong to early-season rice cultivar; TY 390 (hybrid rice) and XWX 13 (conventional rice) belong to late-season rice cultivar. TR represents the tillering stage; JT represents the jointing stage; HD represents the heading stage; GFP represents the grain filling period; MA represents the maturity stage; * represents significances at p < 0.05.
Agronomy 12 01090 g002
Figure 3. The grain yield of double-cropped rice under different treatments in 2018 and 2019. Data points represent treatment means (n = 3), and different letters indicate significant differences (p < 0.05). DPRN represents dense planting with a reduced nitrogen rate; SPHN represents sparse planting with a high nitrogen rate; ZLY 819 (hybrid rice) and ZJZ17 (conventional rice) belong to early-season rice cultivar; TY 390 (hybrid rice) and XWX 13 (conventional rice) belong to late-season rice cultivar.
Agronomy 12 01090 g003
Figure 4. Nitrogen accumulation of double-cropped rice under different treatments in 2018 and 2019. Data points represent treatment means (n = 3), and different letters indicate significant differences (p < 0.05). DPRN–E represents dense planting with a reduced nitrogen rate in early-season rice; SPHN–E represents sparse planting with a high nitrogen rate in early-season rice; DPRN–L represents dense planting with a reduced nitrogen rate in late-season rice; SPHN–L represents sparse planting with a high nitrogen rate in late-season rice. ZLY 819 (hybrid rice) and ZJZ17 (conventional rice) belong to early-season rice cultivar; TY 390 (hybrid rice) and XWX 13 (conventional rice) belong to late-season rice cultivar. TR represents the tillering stage; JT represents the jointing stage; HD represents the heading stage; MA represents the maturity stage; * represents significances at p < 0.05.
Agronomy 12 01090 g004
Table 1. The variance in grain yield, dry matter weight, effective spike, spikelet per panicle, 1000 grain weight, and nitrogen use efficiency caused by the treatments, rice season, and cultivar.
GY
(kg ha−1)
DMW
(kg ha−1)
ES
m−2
GS−1GW
(g)
NUE
(%)
Treatments (T)0.73 ns15.9 **64.09 **0.01 ns0.14 ns52.51 **
Rice season (R)1.32 ns34.67 **8.03 **6.23 *0.14 ns0.08 ns
Cultivar (C)37.05 **0.31 ns10.24 **0.46 ns4.88 *0.09 ns
T × R0.01 ns1.96 ns7.12 *1.06 ns0.57 ns0.74 ns
T × C0.02 ns1.12 ns0.01 ns0.03 ns0.01 ns0.68 ns
R × C38.49 **0.01 ns2.07 ns15.92 **3.01 ns0.25 ns
T × R × C0.31 ns0.38 ns0.18 ns0.5 ns0.13 ns0.05 ns
GY represents grain yield; DMW represents dry matter weight; ES represents effective spike; GS represents grains per spike; GW represents 1000 grain weight; NUE represents nitrogen use efficiency. * represents significances at p < 0.05; ** represents significances at p < 0.01; ns represents no significant. Bold font represents significant difference.
Table 2. Nitrogen use efficiency of the double-cropped rice under different treatments in 2018 and 2019.
YearsSeasonCultivarTreatmentNUE
(%)
PFPN
(kg kg−1)
AEN
(kg kg−1)
N Index of Harvest
2018ESRZLY819DPRN−E54.6 a61.9 a28.3 a0.76 a
SPHN−E33.2 b47.3 b19.8 b0.70 a
ZJZ17DPRN−E52.4 a58.3 a25.8 a0.75 a
SPHN−E44.2 b46.0 b21.8 b0.65 a
LSRTY390DPRN−L54.3 a60.2 a14.7 a0.69 a
SPHN−L32.4 b49.5 b13.5 a0.69 a
XWX13DPRN−L49.7 a48.6 a6.4 b0.62 a
SPHN−L31.9 b40.0 b10.0 a0.60 a
2019ESRZLY819DPRN−E56.8 a49.4 a15.8 a0.69 a
SPHN−E49.1 b42.2 a14.0 a0.65 a
ZJZ17DPRN−E55.6 a51.7 a15.8 a0.68 a
SPHN−E42.9 b45.1 a17.8 a0.67 a
LSRTY390DPRN−L60.5 a61.8 a17.8 a0.71 a
SPHN−L48.2 b47.7 b17.0 a0.69 a
XWX13DPRN−L59.5 a45.6 a10.6 a0.61 a
SPHN−L47.9 b32.7 b7.3 a0.59 a
Data points represent treatment means (n = 3), and different letters indicate significant difference between DPRN and SPHN treatments (p < 0.05). ESR represents the early-season rice; LSR represents the late-season rice. DPRN−E represents dense planting with a reduced nitrogen rate in early-season rice; SPHN–E represents sparse planting with a high nitrogen rate in early-season rice; DPRN–L represents dense planting with a reduced nitrogen rate in late-season rice; SPHN−L represents sparse planting with a high nitrogen rate in late-season rice. NUE represents the nitrogen use efficiency for grain production; PFPN represents the partial factor productivity of applied nitrogen fertilizer. AEN represents the response agronomic efficiency of applied nitrogen. Bold font represents significant difference.
Table 3. The amount and proportion of nitrogen absorbed before heading towards the spike and source of nitrogen in the spike at maturity stage.
SeasonCultivarTreatmentNitrogen Absorbed before Heading to SpikeNitrogen Source in
Spike at Maturity Stage
Transferred
Proportion
(%)
Transferred Amount
(kg hm−2)
Transferred
Proportion before Heading
(%)
Absorbed
Proportion after Heading
(%)
Transferred
Amount before Heading
(kg hm−2)
Absorbed
Amount after Heading
(kg hm−2)
ESRZLY819DPRN−E68.973.169.5 30.5 80.5 35.3
SPHN−E65.166.762.9 37.1 75.544.4
ZJZ17DPRN−E76.464.265.734.370.6 36.9
SPHN−E74.460.553.0 47.0 67.6 59.9
LSRTY390DPRN−L65.861.366.9 33.167.4 33.3
SPHN−L58.655.357.6 42.4 60.8 44.7
XWX13DPRN−L59.957.577.7 22.3 63.3 18.2
SPHN−L50.353.470.329.7 59.8 25.2
ESR represents the early-season rice; LSR represents the late-season rice. DPRN represents the dense planting with a reduced nitrogen rate; SPHN represents the sparse planting with a high nitrogen rate.
Table 4. The amount and proportion of rice accumulated nitrogen from nitrogen fertilizer in the nitrogen that accumulated in the aboveground parts of double-cropped rice.
MaturityBefore HeadingAfter Heading
SeasonCultivarTreatmentProportion of Nitrogen Fertilizer
(%)
Amount of Nitrogen Fertilizer
(kg hm−2)
Proportion of Nitrogen Fertilizer
(%)
Amount of Nitrogen Fertilizer
(kg hm−2)
Proportion of Nitrogen Fertilizer
(%)
Amount of Nitrogen Fertilizer
(kg hm−2)
ESRZLY819DPRN−E52.3 a87.6 a58.6 a68.1 a38.1 a19.5 a
SPHN−E54.1 a79.1 a56.4 a58.8 a45.1 a20.3 a
ZJZ17DPRN−E39.7 a72.1 a52.3 a50.7 a25.0a17.3 a
SPHN−E45.2 a64.4 a56.7 a48.2 a24.8 a16.2 a
LSRTY390DPRN−L47.0 b76.9 a52.5 b60.5 a31.4 b16.4 a
SPHN−L60.0 a79.5 a59.0 a65.2 a33.8 a14.3 a
XWX13DPRN−L48.1 b71.4 a49.1 b55.8 a39.7 b15.6 a
SPHN−L60.5 a84.2 a56.4 a71.2 a45.2 a13.0 a
Data points represent treatment means (n = 3), and different letters indicate significant differences (p < 0.05). ESR represents the early-season rice; LSR represents the late-season rice. DPRN–E represents dense planting with a reduced nitrogen rate in early-season rice; SPHN–E represents sparse planting with a high nitrogen rate in early-season rice; DPRN–L represents dense planting with a reduced nitrogen rate in late-season rice; SPHN–L represents sparse planting with a high nitrogen rate in late-season rice. Bold font represents significant difference.
Publisher’s Note: MDPI stays neutral with regard to jurisdictional claims in published maps and institutional affiliations.

