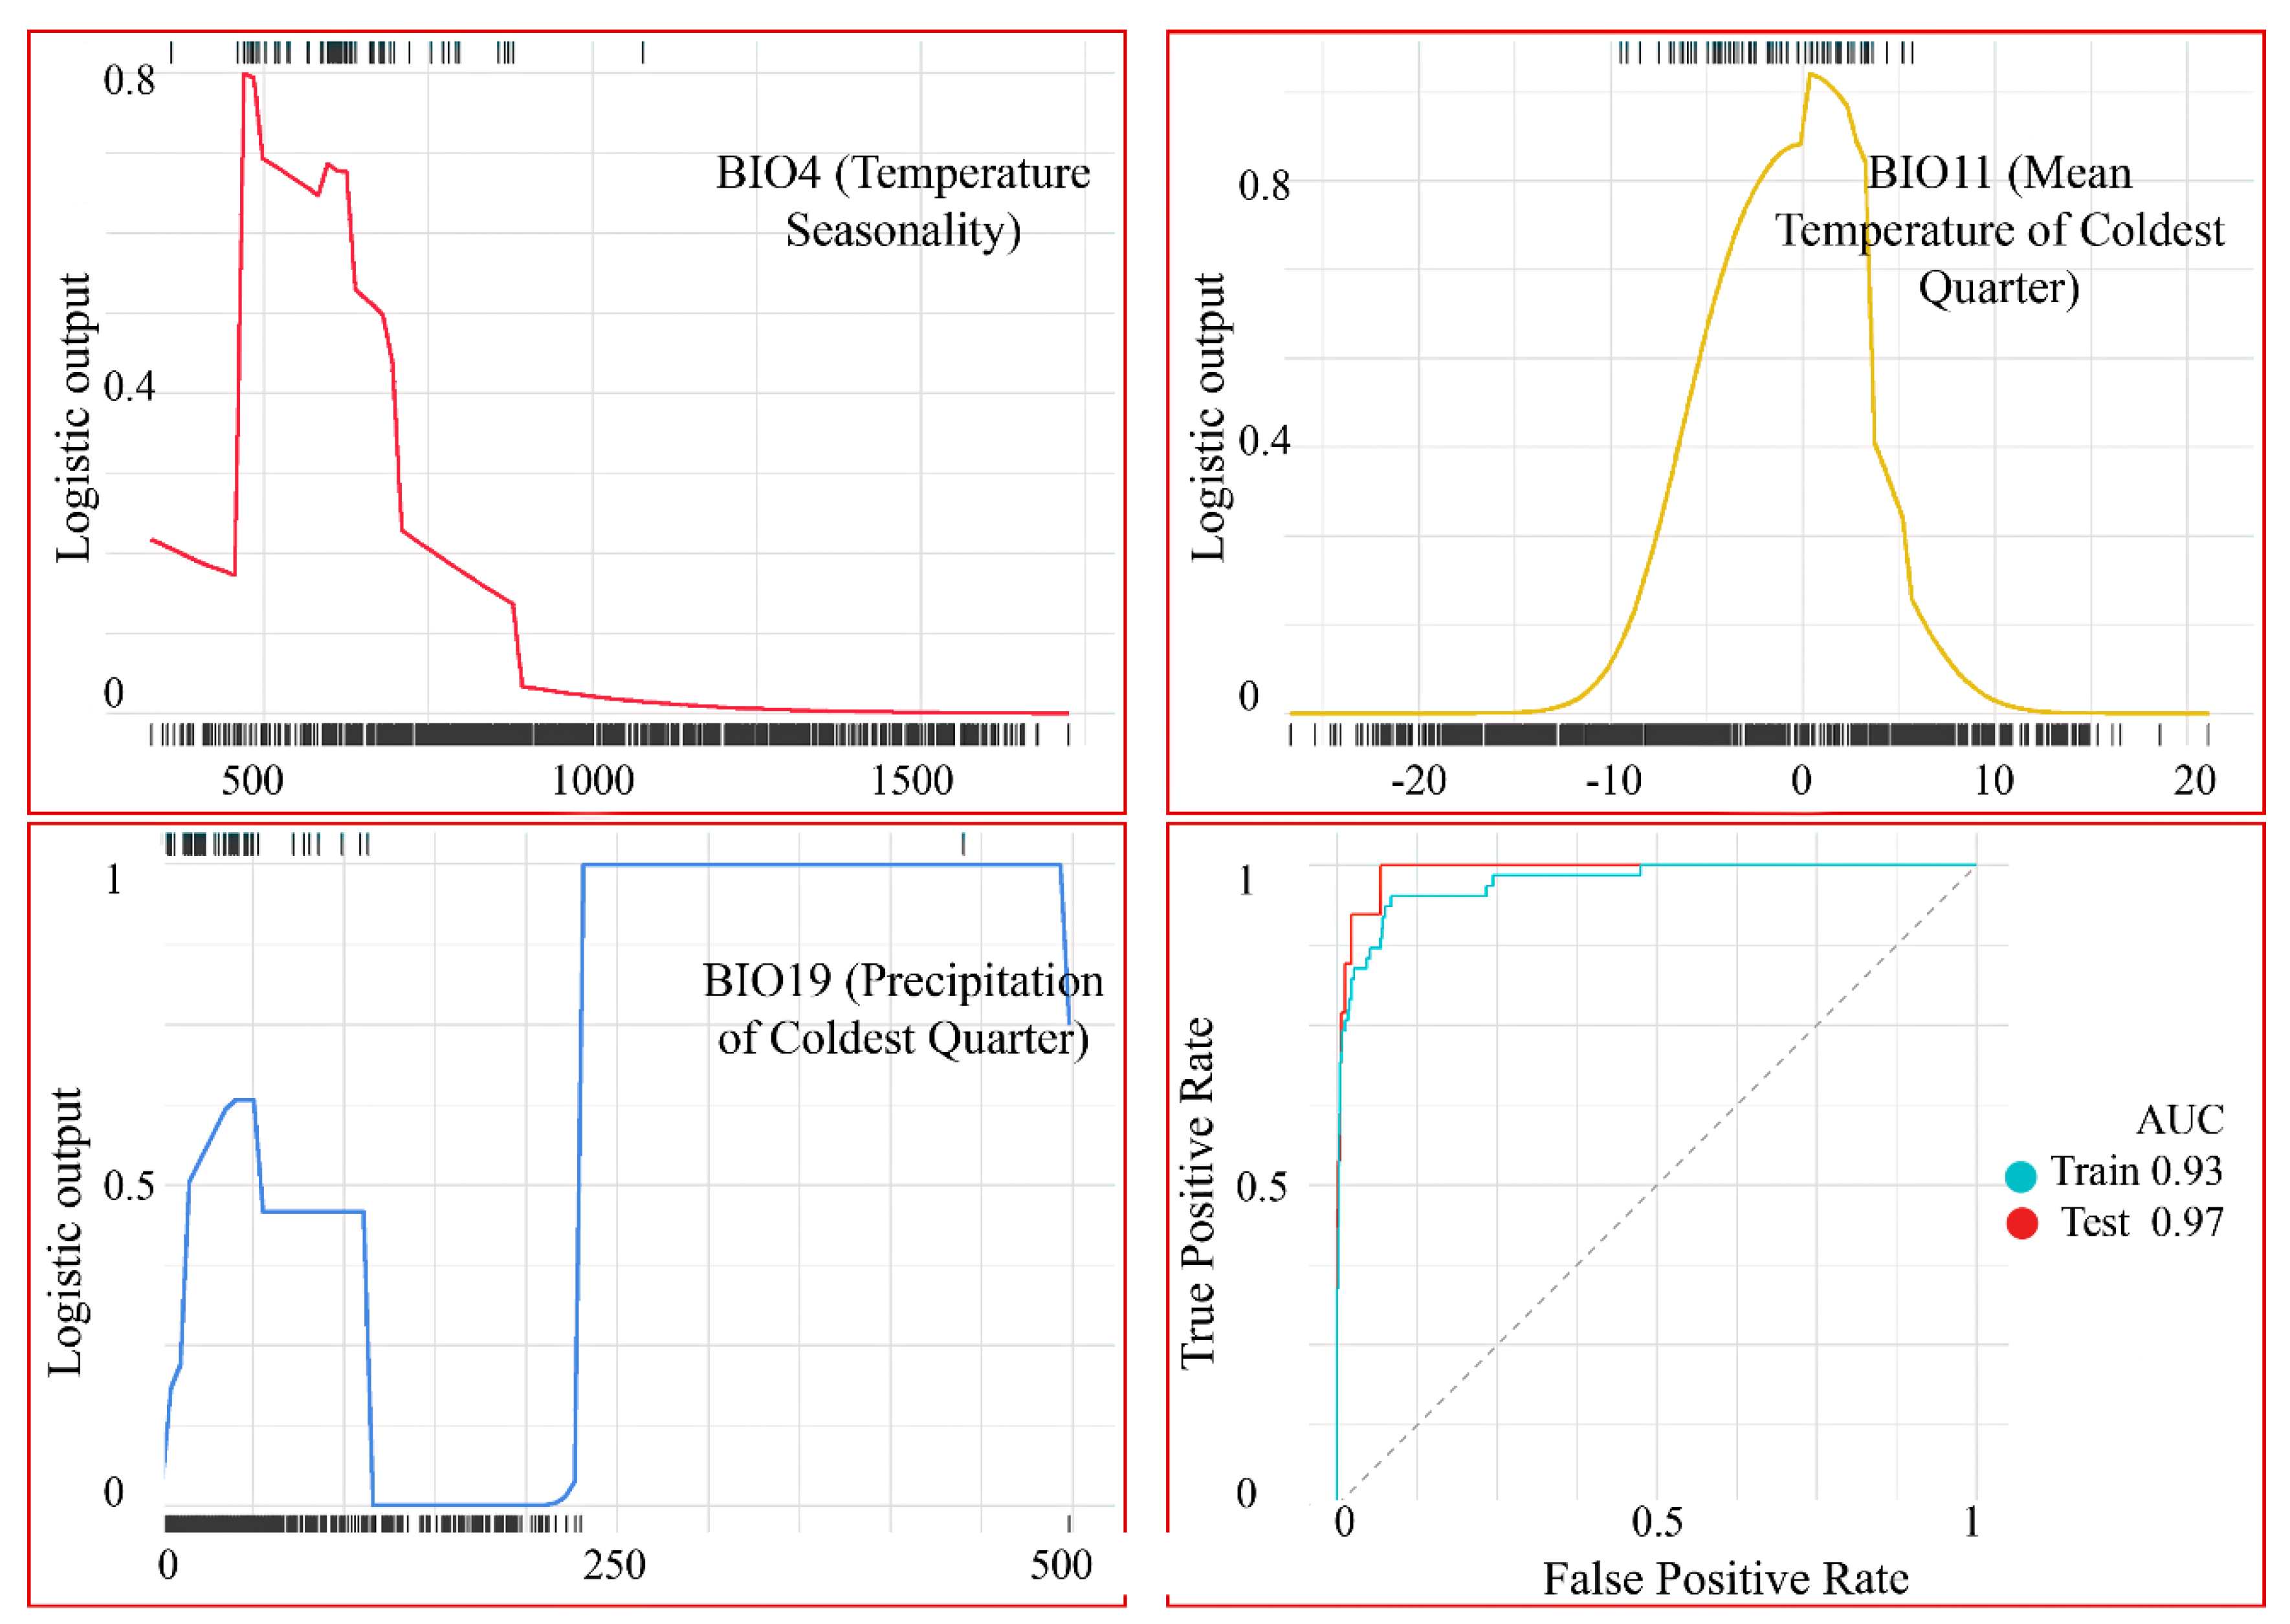
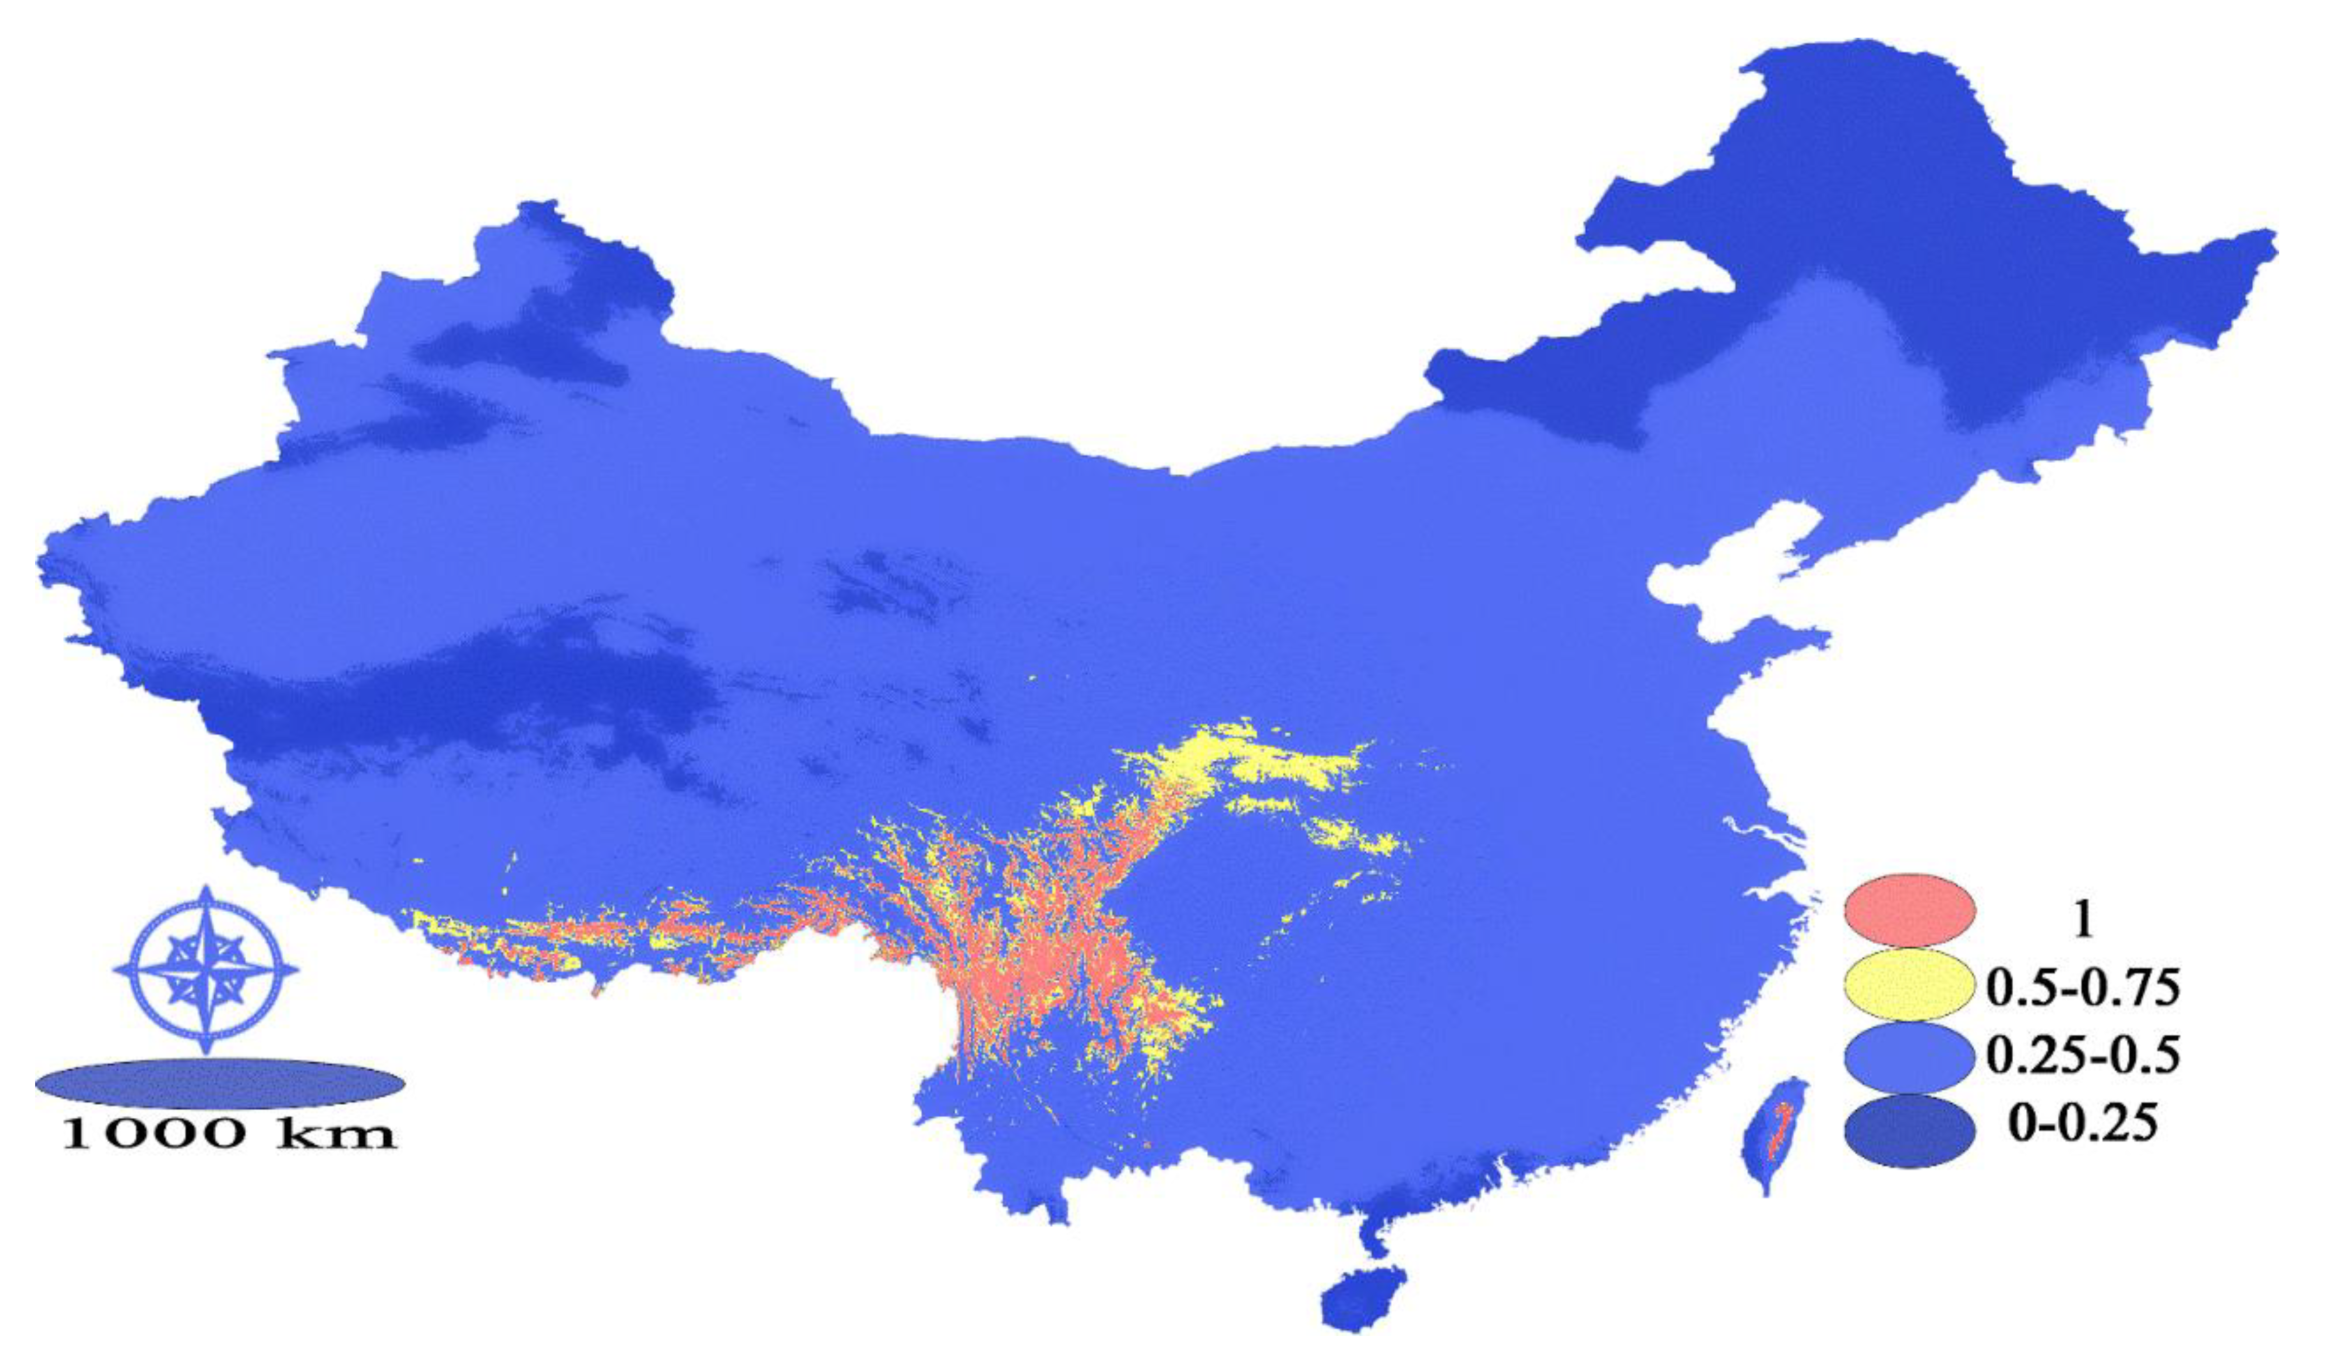
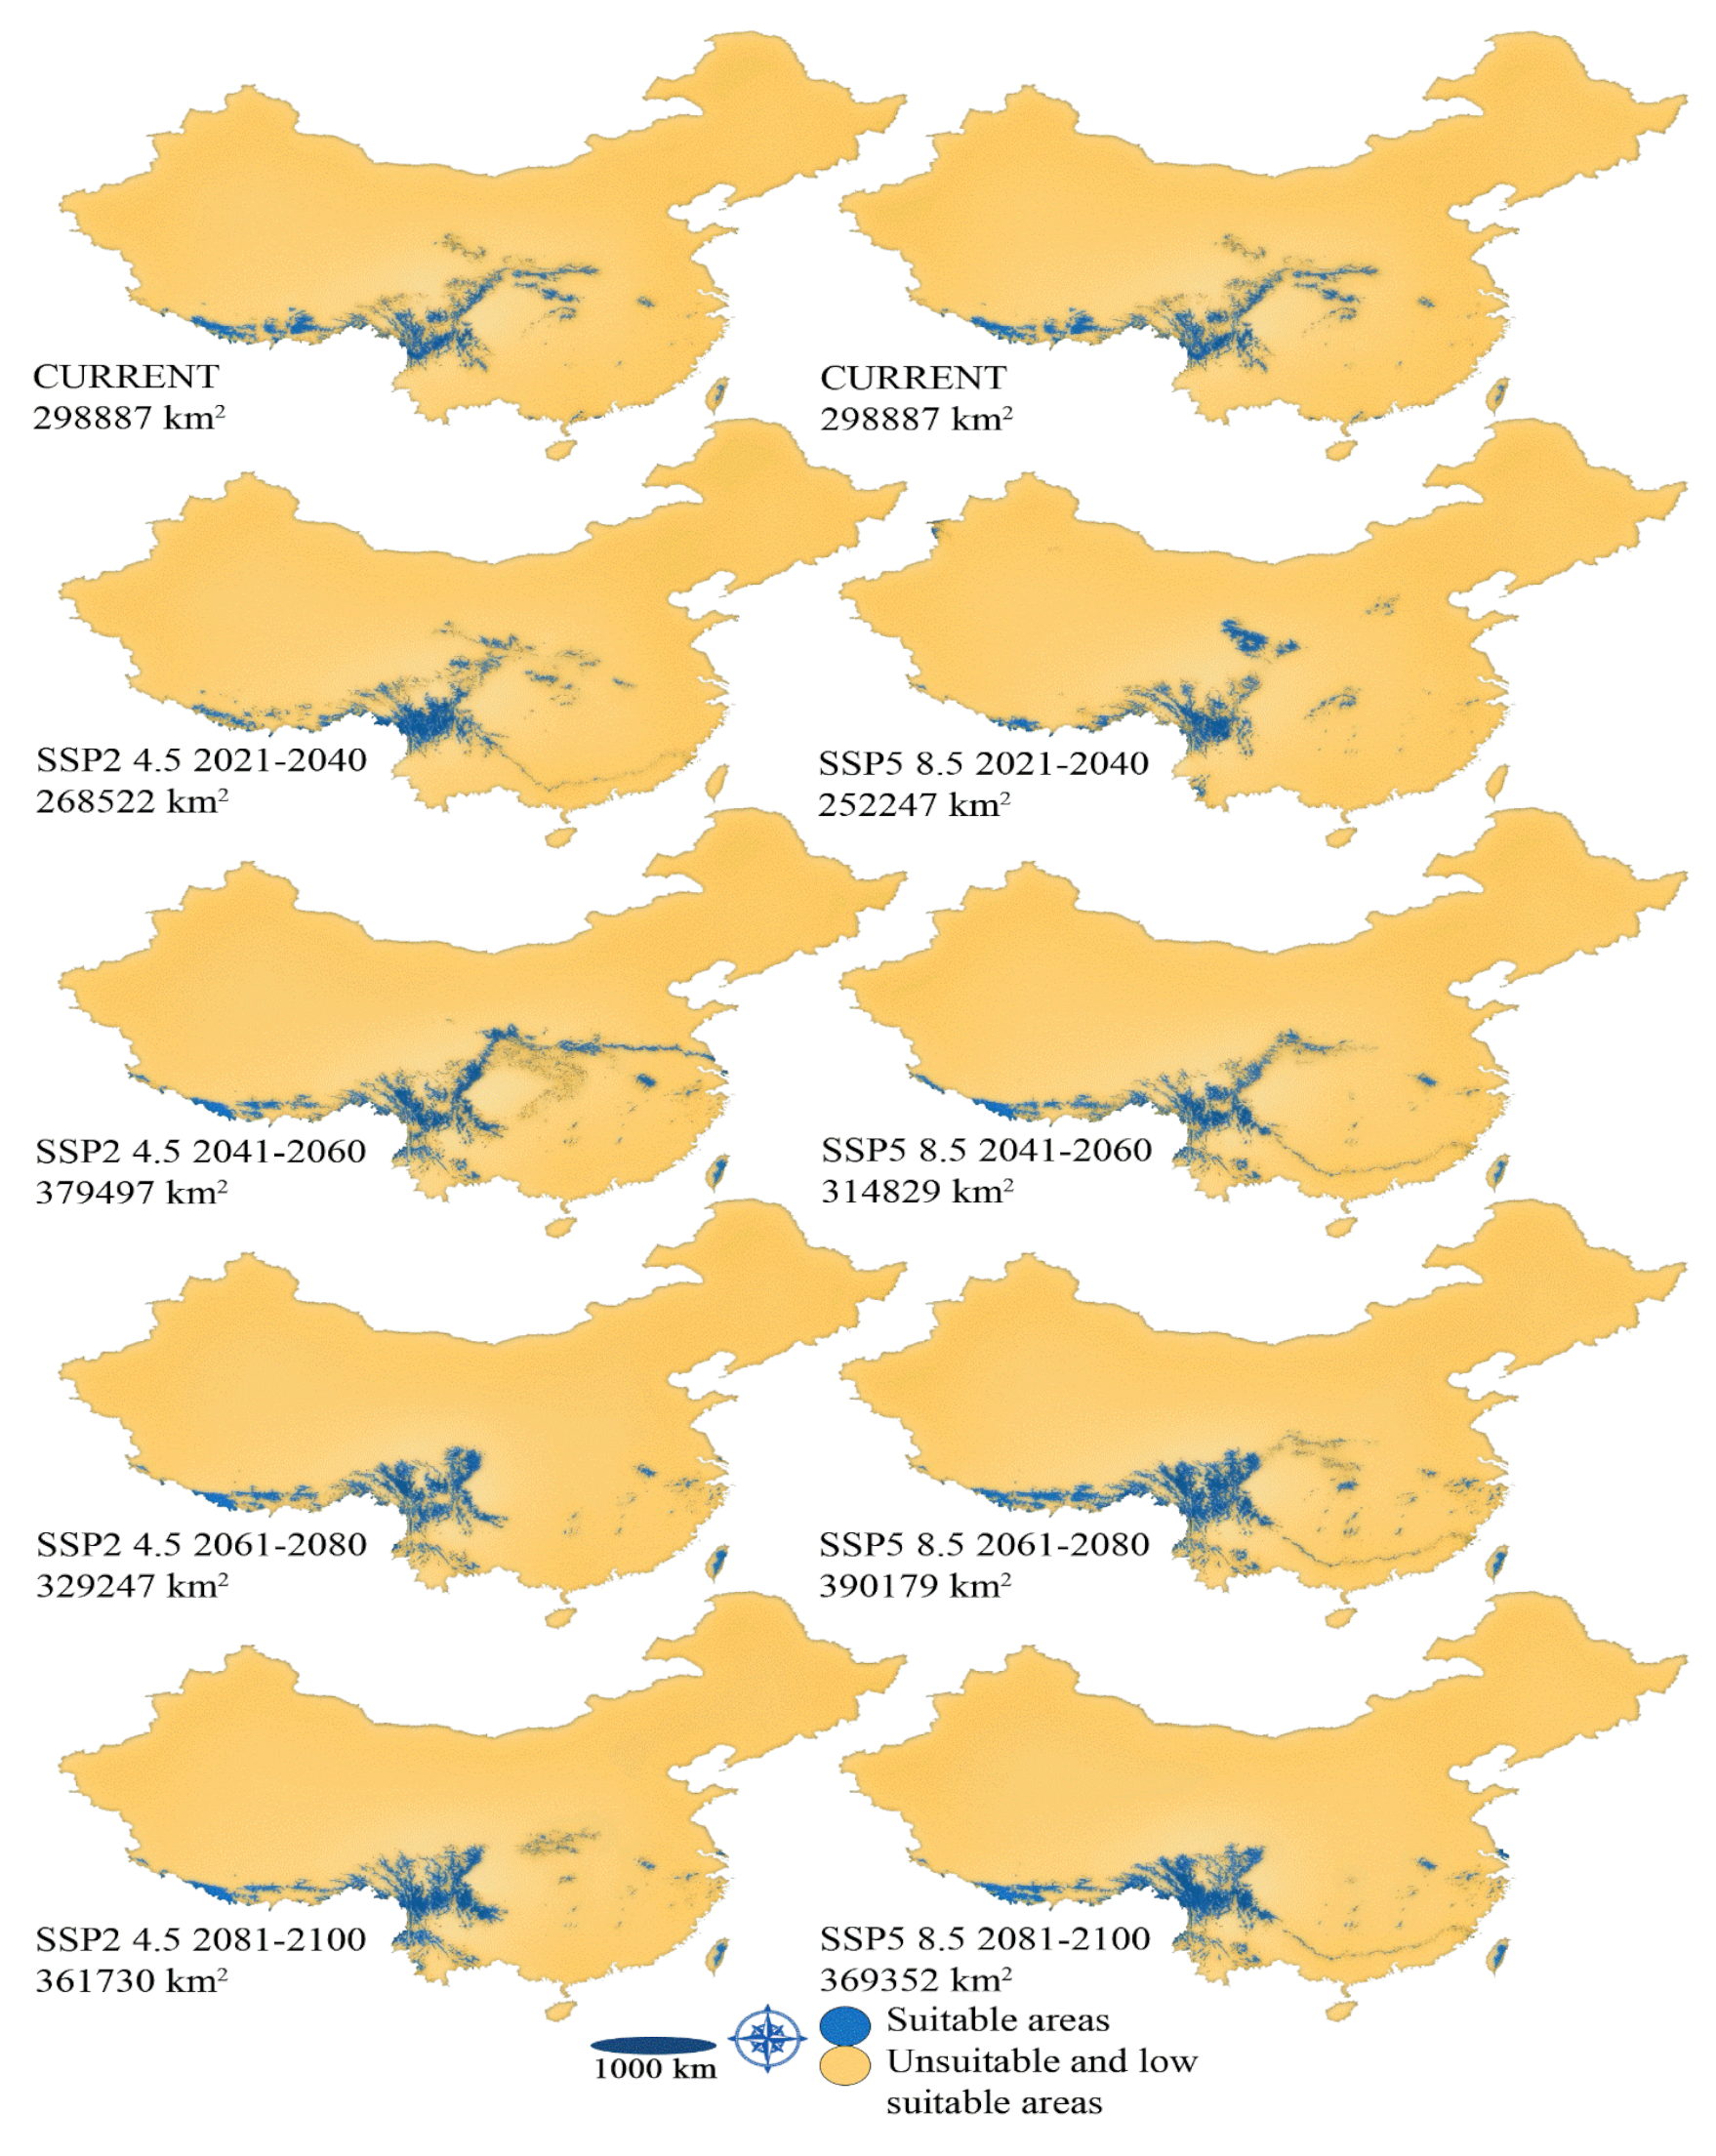
Article

Macro-Morphological and Ecological Variation in Rosa sericea Complex

1
CAS Key Laboratory of Mountain Ecological Restoration and Bioresource Utilization and Ecological Restoration, Biodiversity Conservation Key Laboratory of Sichuan Province, Chengdu Institute of Biology, Chinese Academy of Sciences, Chengdu 610041, China
2
University of Chinese Academy of Sciences, Beijing 100049, China
3
Department of Biology, Faculty of Science and Art, Erzincan Binali Yıldırım University, Erzincan 24100, Turkey
4
Key Laboratory of Bio-Resources and Eco-Environment of the Ministry of Education, College of Life Sciences, Sichuan University, Chengdu 610064, China
5
State Key Laboratory of Systematic and Evolutionary Botany, Institute of Botany, Chinese Academy of Sciences, Beijing 100093, China
*
Authors to whom correspondence should be addressed.
Agronomy 2022, 12(5), 1078; https://doi.org/10.3390/agronomy12051078
Submission received: 25 January 2022 / Revised: 22 April 2022 / Accepted: 27 April 2022 / Published: 29 April 2022
(This article belongs to the Special Issue Recent Progress in Plant Taxonomy and Floristic Studies)

Abstract

:
Taxon delimitation and identification are important in many areas of biology, especially in taxonomy and conservation. Taxonomic treatment is required to establish and justify recommendations in conservation biology for the group being considered. Imperfect and controversial taxonomy can undermine conservation assessment. We studied 71 populations; 665 individuals corresponding to the morphology of the Rosa sericea complex (including six taxa, one of which has extremely narrow distributions) were collected from sympatric, parapatric, and allopatric populations distributed in China. This study aims to investigate whether the complex species are macromorphologically different species and evaluate the rare taxa of the complex for conservation priority. The morphological characters and principal component analysis (PCA) of the R. sericea complex showed that the complex species have overlapping characters but can distinguish morphologically. The species of R. sericea complex systematics status based on previous DNA sequencing is controversial. The ecological habitat’s current morphological characters only delimit the R. morrisonensis (in Taiwan). To evade mistakes in species conservation, we recommend that taxonomical knowledge be needed to ensure success in protecting target species. Thus, the complementarity of systemic and conservation assurance makes conservation actions more necessary for the complex’s rare taxa. The ecological niche modelling (ENM) results showed that habitats of these conspecific taxa would be shrunken. With the presence of snapshots in time, the geography of taxa might decrease rapidly in representative entirely of the Geographic space (G-space) and Environmental space (E-space) that such taxa are bright to inhabit. So far, the significant inferences meant for the niche occupy the most incredible comparative research, taking the impermanent nature of taxa distributions and undertaking that such species are at a state of stability. If the artificially identified species (rarely distributed) are based on morphological identification, they must be conserved.

1. Introduction

The concept of species is crucial in evolutionary research and all biological thoughts. Species are the fundamental unit of life and biological diversity with a specific karyotype, morphology, DNA sequence, ecological niche, or behaviour [1]. Taxonomists made several efforts to describe species, beginning from simple morphology to genetics [2]. Earlier taxonomists such as Linnaeus defined species based on what they saw. Later on, this was formalized as a morphological or typological species concept. Reproductive isolation is considered the key standard for delimiting the species [3,4,5]. Yet, the limitation between closely related taxa becomes unclear with hybridization or continued gene flow [6]. Delimitation of species is important to distinguish between the species of the same nature, and diagnostic characters are helpful to separate all sorts of species boundaries in biological sciences. The idea of delimitation is known as the species concept [7,8]. Though, the species concept itself is under disputation. To understand the taxonomy of biodiversity, especially conservation biology, the delimitation of species is vital for the controversial taxa. Furthermore, species are important, especially in conserving the existing biodiversity in the face of the extinction disaster of the Anthropocene [9,10,11].
The complex group of plants exhibits diverse forms. Taxonomic boundaries between putative taxa are often concealed by a lack of identified fixed morphological differences, potential hybridization, and a lack of informative collections. The taxonomically complex taxa are sometimes difficult to differentiate and delimit due to their complex characters and distribution. The artificial taxonomy or the species delimit through confused characters sometimes leads the taxa in danger for biological conservation [12,13]. Misidentification could lead to underestimating or overestimating species richness, and these difficulties could entirely compromise the investigation. The poor taxonomy could risk understanding ecological patterns since they are based on richness and measurement of species turnover between sites [14,15]. Conservation actions are taken without accurate taxonomic identifications may impair the effective conservation of the target taxa. The goal of taxonomic studies should not be restricted to distinguishing and describing living things, and it seems impossible to talk about conservation without taxonomy [15]. For species delimitation, taxonomic variations are important [15].
Though systematic is usually regarded as the science of diversity, it played a limited role in developing current approaches to conservation biology. In contrast, ecological values and population genetic concepts are more widely incorporated into conservation theory and management strategies [16,17]. Different studies examined species delimitation based on morphological and geographical distribution [18,19,20]. However, these studies were limited to one or two factors, whereas species limitation is based on various drivers such as interaction with climate, evolutionary traits, morphological characteristics, and biogeographical characteristics. In other words, species delimitation and conservation can be addressed by focusing on different levels, from genes to populations, ecosystems, and species concepts [21,22]. Scientists favour biodiversity as more integrative based on genetic and genomic approaches [23]. Systematics offers a foundation of information for conservation biology equally valuable as that of population genetics [19,20]. Systematic is vital due to the linkage of a taxon to other relative species based on taxonomic and molecular characterizations [24]. Species delimitation without an accurate taxonomic identification is incomplete. However, funding agencies have neglected taxonomy nowadays because of being descriptive discipline [15]. Difficulties and hurdles in systematics, ecology, and taxonomic determination among species hamper research in areas of species definition [25]. For species delimitation, identification is important for the complex taxa [15]. Funding agencies need to provide financial assistance for taxonomy and ecology to conduct extensive field works to explore rare and endangered species, especially in megadiverse countries like China. The technique red lists would be viewed and used for poorly known species, depleted species, population decline, restricted ranges, and rarity based on all these criteria. Procedures associated with priority situations and the progress of national red lists are essential to justify some expectations in formulating the criteria [26]. Taxonomy, ecological distribution threats, and population knowledge are important for the red-list assessments and adequate capacity to process and analyze data. Both capacity and data are absent for numerous species-rich taxa, despite their great ecological importance [27,28].
The taxa of the R. sericea complex occur at a high latitudinal gradient from 1000 to more than 4000 m above sea level [6,29]. Based on the previous study, we hypothesized that the species of R. sericea complex showed few distinct macro-morphological characteristics. Our observation demonstrates that the studied species have clear morphological characters to differentiate the taxa in the complex. So, in this research, we applied population morphological and ecological data (precipitation, temperature, and nineteen bio factors) to observe the variation in the focal taxa and their distribution. This paper aims to distinguish between the species of the R. sericea complex using morphological and ecological characteristics and conservation status to attain the following objectives: (1) To delineate species boundaries in R. sericea complex by adopting more comprehensive approaches based on populations sampling; (2) To exclude vulnerably, threatened taxa utilizing the above process; and (3) To determine how accurate and efficient morphological variation is possible based on proper species delimitation.

2. Materials and Methods

2.1. Study Area, Populations Morphology, and Record of Samples

A total of 665 individuals of 71 populations of six taxa of R. sericea complex (R. sericea Lindley (RS) 36 populations, 311 individuals; R. omeiensis Rolfe (RO) 24 populations, 285 individuals; R. sikangensis T. T. Yu and T. C. Ku (RSK) 8 populations, 29 individuals; R. mairei H. Léveillé (RM), R. morrisonensis Hayata (RMO) with 10, 21 individual, respectively; R. zhongdianensis T. C. Ku (RZ) 1 population, 9 individuals) were collected from China (Table S1) and studied at the CDBI herbarium. RMO is the only taxon with one population collected from Taiwan (Figure 1). This work examined fifty morphological characteristics for each individual: twenty-six leaf characters, twenty-one flower and fruit characters, and three other traits. The mean values of the quantitative morphological characters were used for principal component analysis (PCA). Our studied populations showed that the species of this complex individuals sometimes share and grow in the same ecological habitat, except the species RMO (from Taiwan) and RM, and RZ from southwest China. During the collection, we press the samples in the newspapers in the field and bring them to CDBI for a detailed study. The population records and codes information are given in Table 1. The detailed morphological features were studied in the herbarium of the Chengdu Institute of Biology (CDBI). We used a binocular dissecting microscope to distinguish the study taxa based on detailed characters studied for a concise and clear character. The macro-morphological characters of each specimen studied herein are described to determine the species macromorphologically. We also selected some taxonomically important characters to distinguish the complex taxa species. We constructed dichotomous keys and taxonomic descriptions to identify these taxa easily (Table 2). Some characters were noted differently within the same population, while some features were observed overlap between the different species populations. Various qualitative and quantitative characters have been examined in detail.

2.2. PCA Analysis of Morphological and Environmental Factor

The PCA analysis was carried out for the morphological and environmental factors to understand the relationship between the studied taxa. The morphological characters were analyzed using qualitative, quantitative, and ecological characters to see the complex taxa’s structure, relationship, and species boundaries. We did PCA analysis for macro morphological characteristics, qualitative and quantitatively, and the environmental factors (Figure S1).

2.3. Correlation between Quantitative Characters and Environmental Factors

The quantitative data and the 19 bio parameters (https://www.worldclim.org/, (accessed on 15 June 2021) were subjected to analysis of variance in R studio to evaluate the difference between quantitative characters and environmental factors relationship. We used the Pearson linear correlation bivariate between the quantitative and ecological characters of different morphological characters.

2.4. Distribution and Ecological Characters

We pursued to relate and contrast the geographic ranges and environmental tolerance of putative taxa within the studied taxa. Our studied samples were only belonging to the geographical ranges of China. We obtained the environmental data while using our field collection data of given populations. The distribution data of 71 populations and the spatially unique data at 2.5 arc minutes (for future distribution) resolution (5 ∗ 5 km2 at the equator) of 63 recorded points. We used the ENMSDM package and China elevation data (30 arcs second for current), taken from the SRTM elevation data of 63 records. We took and used nineteen temperature, seasonality, and perception variables from WorldClim [30].

2.5. Modelling the Species Complex Current and Future Distribution

2.5.1. Records of the Species Complex and Bioclimatic Variables

We collected 63 presence points (records) of the species complex during fieldworks from 2010 to 2020 (Table 1). After thinning records of the species using the enmSdm package [31] and China’s elevation data (30 arc seconds) derived from Worldclim (https://www.worldclim.org, accessed on 15 June 2021), we obtained 62 records of the species complex. Nineteen bioclimatic variables are crucial in defining species’ climatic niches downloaded from Worldclim dataset v2.1 (30 arc-seconds) [32] for the current period. Because the high correlation between variables is expected to affect model performance and increase uncertainty in model results. Spearman rank correlation (rs) was calculated using R packages (scales and legendary) in R v4.04 to evaluate multicollinearity among the bioclimatic variables. In the analysis output, positive correlations (rs 0.7) between variable pairs were drawn in black and negative correlations (rs ≤ −0.7) were drawn in red.

2.5.2. MaxEnt Modelling of the Species Complex Distribution

We modelled the current and future distribution of the species complex using the MaxEnt method [33] implemented through Maxent v3.4.4 in the SDMtune package. SDMtune uses a particular object to compile the data for the analysis. This object, called SWD, bundles all the information related to each record, thereby reducing the risk of mistakes in further investigations [34]. After creating the SWD object, we trained a model using all 19 climatic variables. Then we considered the variable importance of the Jackknife test of the first model and correlations among bioclimatic variables to model species complex distribution with fewer variables. Because a study [35] revealed that seed dormancy breaking requirements and timing of seedling emergence of the species have a chilling need, Mean Temperature of Coldest Quarter (Bio11) was chosen as the predictor variable among highly correlated variables. In the end, paying regard to all of these predictions obtained, we decided to model the distribution of the species complex with Temperature Seasonality (Bio04), Bio11, and Precipitation of Coldest Quarter (Bio19) (Figure S2).
The results of SDMs under future climatic conditions are affected by a range of factors, including the choice of the statistical model, climate model range, and emission scenarios [36,37]. Although the Intergovernmental Panel on Climate Change (IPCC) considers all Global Climate Models (GCMs) equal, certain GCMs better represent some climate types and regions. For example, among the GCMs, BCCCSM (Beijing Climate Centre, Climate System Model) has higher reliability and has been better studied in China. The GCM used in the study was the BCC-CSM2-MR GCM [34] (2.5 arc minutes) obtained from (https://www.worldclim.org/data/cmip6/cmip6_clim2.5m.html, accessed on 15 June 2021). While the scenarios used were the Shared Socioeconomic Pathways (SSPs; ssp2 4.5 and ssp5 8.5) (CMIP6), which are now being used as important inputs for the latest climate models, feeding into the Intergovernmental Panel on Climate Change (IPCC) sixth assessment report is due to be published in 2021 (https://tntcat.iiasa.ac.at/SspDb/dsd?Action=htmlpage&page=welcome, accessed on 22 June 2021; https://www.ipcc.ch/assessment-report/ar6, accessed on 22 June 2021). The species complex’s future distribution was predicted for 20-year periods (2021–2040, 2041–2060, 2061–2080, and 2081–2100).

2.5.3. Tuning Model Hyperparameters and Evaluation Model Performance

Tuning model hyperparameters is a long process, as it requires testing many combinations to identify the best-performing model [34]. To get the model with high predictive power, we tuned model parameters using ‘gridSearch’ function implemented in SDMtune. Since model evaluation measures the capacity of a given model to reflect “truth” and whether it can be applied under other conditions [38] to assess the performance of the models. We used receiver operating characteristic (ROC) curve analysis and the true skill statistic (TSS). Thresholds for interpreting the TSS values were defined as follows: Value ≥ 0.9 = best, 0.9 > Value ≥ 0.8 = very good, 0.8 > Value ≥ 0.7 = good and Value < 0.7 = weak [39].
In creating distribution maps of the species, five threshold values were used. Accordingly, ‘0–0.25’ denotes unsuitable areas, ‘0.25–0.5’ of very low suitability, ‘0.75–1’ highly suitable. We also calculated the size of moderate and highly suitable (we call them suitable here) predicted by models to quickly assess future distribution areas of the species complex and to see if the species complex would have gain or loss in the size of suitable habitat areas in the future. To do that, first, we reclassified highly suitable sites as ‘1’ and other areas as ‘0’ using ArcMap v10.8. Second, we converted raster files into shape format. Lastly, we calculated the size of the regions from shape data. Distribution maps of the species complex and cartography works were created in QGIS v3.18.
To grasp more information about the Rsc climatic niche and distribution in China, we used the “rmaxent” and “ENMTools” that have some excellent features implemented in functions about the species niches (URL: https://github.com/johnbaums/rmaxent, accessed on 9 June 2021) [40]. In the R maxent, we modelled the species’ climatic niche using all bioclimatic variables to reveal which variable/variables affect the species’ complex distribution in China. In the ENMTools, we measured the spatial heterogeneity of the distribution of suitability scores from the model results we obtained. This feature returns Levins’ two metrics of niche breadth (B1 and B2) [40].

3. Results

Different morphological characters have been studied in this article for the six taxa of the R. sericea complex (RO, RS, RMO, RM, RSK, and RZ) (Figure 2). In addition, we focused on the conservation of rare species of the complex.

3.1. Morphological Variation

Variation has been observed in different morphological characteristics of the studied taxa. The characters investigated in the focal taxa samples were somehow morphologically significant for delimiting the taxa into distinct taxon. We identified different morphological characters to differentiate the study taxa of the complex. A detailed morphological description of the study taxa based on qualitative and quantitative features was revised. In the present work, we studied 50 qualitative and quantitative characters of each individual, which showed some variation in the studied species. Moreover, these characters were analyzed with the environmental characters, and the correlation is given in (Figure 3). The vegetative morphology was mainly focused on the leaf morphological characters. One of the most important characteristics was the leaflet’s morphology and leaflets in different individuals (species). The species boundaries in the complex taxa were evaluated based on morphological characters (Appendix A).
Each individual’s qualitative and quantitative characteristics were examined in the CDBI herbarium and statistically analyzed. The description of these species was mainly based on the morphological characteristics of collected populations specimens from different geographical distribution ranges of the R. sericea complex. Population information is given in (Table 1), and morphological characters descriptions are given in (Appendix A). The studied species of this complex have tetramerous perianth. The height of these shrubby plants’ species ranged from 1 to 4 m.

3.2. Ecological Niche Modelling

The complex taxa except for RS, and RO, while the taxa RSK, RM, RMO, and RZ have narrow ecological amplitude, and hence their distribution is rare. Based on our field observations and herbarium records, the population of the one taxon RZ (with nine individuals with one population) compiled as taxon of very narrow ecological distribution, followed by RM, RMO, and RSK. Some types specimens of this taxon were available in the herbarium. Phylogenetically these species are complex, and the evolutionary tree of these taxa quite complicated. This species are closely interrelated, and morphologically synapomorphies have been examined (Appendix A).
These taxa have phylogenetically complicated systematics. The species boundaries were difficult to differentiate [6,29], while the morphological characters showed that the species have distinct characteristics to define species boundaries. Due to the narrow ecological amplitude and rarity, these taxa should be conserved. The phylogenetic classification is essential if we are thinking of organizing the biodiversity in such a way as to establish conservation significance and improve informed conservation policies [41,42]. Additionally, revised classification is dreaded by conservation practitioners and other taxonomy users. The new classification of plants is based on molecular or phylogenetic analyses considered the basic basis of practical taxonomy [43,44].
From our fieldwork and analysis of morphological characters, and work previously done on the species of the complex [45], these taxa were clustered in the same clade [46]. These taxa’s field observations and geographical distribution showed that RS and RO have a broad ecological amplitude. In contrast, RSK and RM have moderate distribution, while the taxonRZ have a narrow ecological amplitude and few populations in nature. The RMO has occurred in the isolated habitat in Taiwan. We have recorded one population with 21 individuals (Figure 1). Morphologically these species could be differentiated because they have shown morphological species concepts to distinguish them. We assessed the quantitative characteristics of these taxa showed variation in the studied taxa. Taxonomic distinctness based on morphological characters showed that and fulfilled the conservation criteria due to their narrow biogeographical distribution and rarity in nature. Populations extinction is one of the significant threats to plant diversity, foremost to range reductions, disintegration, and isolation, which reduces species abundance.
The current SDMs of the R. sericea complex predicted through the model provide very high success rates with training and test AUC values of 0.90 and 0.97, respectively. These findings indicate that the predictor variables used for SDMs were suitably selected, thus leading to very high prediction success. The AUC curves in developing R. sericea complex SDM under current environments are given (Figure 4). The TSS, AUC, and variable importance values for the complex conspecific under future climatic are given (Figure 4). The present finding obtained from the model, the sum of the three first potential distribution variables was 59.407%. The higher the percent contribution, the more important that a variable is for predicting the occurrence of the taxa. Bio 11 had the highest predictive contribution in the present study, 28.44%.
The current potential distribution of the taxa showed that the area with red indicates a highly suitable area for the complex species. In contrast, the blue indicates the site is not suitable for taxa (Figure 5). The BCC-CSM2-MR GCM and the SSPs (ssp2 4.5 and ssp5 8.5) (CMIP6) based models predicting future habitat suitability of the R. sericea complex taxa are given in (Figure 6 and Figure 7). Concluding from these futures modelling, the results indicate that the species may have difficulties shortly. Some of the rare taxa of the complex will be extinct due to their narrow ecological amplitude.

3.3. Environmental Factors, Morphological Variation, and Correlation

The ecological species concept of the complex taxa somehow showed variation, and some of the populations occurred parapatrically. Our present work’s geographical distribution of RS populations showed a wide distribution range from 1380 to 4168 m in altitude. In comparison, RO has altitudinal variation from 1800 to 4250 m, while RSK has altitude distribution from 2797 to 3851 m. Some RS, RO, and RSK shared the same ecological habitats and grow parapatrically in the study area. We collected each population specimen of RM (2185 m Yunnan, Qujing) and RZ (3007 m Yunnan Diqing), and one population of RMO from an altitude of 3180 m, from Taiwan, Hualian (Table 1, Figure 1). RMO has a unique ecological boundary among the studied taxa and occurs in Taiwan. RZ could also be isolated easily from the rest of the taxa of the complex allopatrically.
The correlation between the quantitative data and 19 bio data is given in (Figure 7). The correlation between the environmental factors and quantitative morphological features shown with single star * correlation is significant at the 0.05 level, while two-star ** correlation is significant at the 0.01 level (Figure 3). The positive and negative correlations between different parameters are shown in (Figure 3). In detail, some of the quantitative characters showed a negative correlation represented with the negative sign (-), while some of the variables have a positive correlation at 0.05 and 0.01 levels. Some variables don’t show any significant correlation represented in the Figure without the star * symbol.

4. Discussion

4.1. Ecotypes Plasticity and Species Boundaries

Different populations of the R. sericea complex were studied here. The individuals’ morphological characters showed variation in characters and morphologically distinct taxa. Some populations shared the same environmental and ecological habitat of the complex species. Due to similar characteristics in different species populations and individuals with different characteristics, the complex species had a wide range of character’s plasticity (Figure 2A–C). The phenotypic plasticity could activate together through ecotype formation, further increasing suitability. The modest level of phenotypic plasticity may facilitate a population’s expansion into novel environments. The trait may place the populations on the slope of an adaptive peak from which natural selection can advance [47]. The RMO adapted to a novel environment and isolated to a new habitat in Taiwan. The limitations to the entirely isolated territory and fundamental asymmetry in migration due to differences in density-dependent viability both redirect selection on a phenotypically plastic trait. Together, these environmental factors might cause the appearance of feature values and genetic constitution that seem specialized to one of the extreme environments of the territory [48]. In the study by Gao et al. [6]), RS and RO were observed parapatrically. However, we observed that the RS, RO, and RSK occur parapatrically, sympatrically, and allopatrically (Figure 1).
Documentation of morphological, environmental, and distribution data provides a basis for the species status of divergent populations of some complex taxa. Conversely, the morphological and ecological characteristics showed that the taxa are distinct taxon based on distinctive features (Table 2). The morphological characters showed that the taxa of the complex are different species. In contrast, predictable morphological features, and environmental and distribution data accept and support different taxon statuses. In our study, the divergent parapatric would stand and be treated as species by default like RMO, RM, and RZ occur parapatrically. Taxon RS has extensive qualitative morphological variation identified in our populations, while the RO has a wide range of characters quantitatively. The PCA analysis showed combinedly that the characters of RO populations are dominated and almost share similar morphological characters with other taxa of the complex (Figure 2A,B,D). Our environmental data showed that the species RMO and RZ have unique environmental characteristics and are isolated from the other taxa of the complex. The factors include low temperature and high precipitation. The morphological characters retain the status of these taxa to distinguish taxon and prove that the taxa in the complex are morphologically different [49,50,51]. Species of the complex may be a single hyper-diverse taxon or contrasted that the speciation or evolution has happened or is ongoing. If the speciation occurred or is ongoing, we would assume to detect apparent morphological and genetic variations, which may show more robust evidence if speciation is completed, or weaker if the speciation is ongoing or confounded by introgression [52,53]. Overall, however, the morphological characteristics support the status of the species as different taxon.

4.2. PCA Analysis of Environmental and Morphological Characteristics

The PCA analysis of environmental and morphological features demonstrated some significant information about the complex species. We used PCA analysis of ecological features and quantitative and qualitative morphological characters to visualize the relationships and differences among the six species of the complex. For the ecological parameters, we used 2.5 arc minutes resolution (∼5 km2 at the equator), for which we obtained 19 temperature, perception, and seasonality variables from WorldClim [30,32].
The PCA analysis of only quantitative morphological characteristics showed more variation in the studied specimens of the same species from different populations (Figure 2A and Table 3). The qualitative morphological characters PCA analysis of the studied specimens of diverse populations shows overlap and difficulty in distinguishing the taxa from each other in the studied taxa (Figure 2B and Table 4). We studied the PCA analysis of nineteen bio factors and 12-months temperature and precipitation. Environmental aspects of the studied specimens and populations showed significant importance in differentiating some of the studied taxa (Figure 2C). We also determined the PCA analysis of 19 bio factors, 12-month temperature minimum, maximum, and precipitation combined with quantitative morphological characters (Figure 2D). The PCA analysis of environmental factors and quantitative features of various populations showed the association between the studied taxa (Figure 2D, Table 5).

4.3. Morphological Characters Evaluation

Morphological characters for species delimitation are usually directly dependent on the field observation and herbarium specimens. These closely interrelated taxa showed dissimilarity in their morphological observation. For the morphological study, we focus on two parts of a plant: (i) the vegetative part and (ii) the reproductive part of the specimens. The vegetative morphology is generally referred to as leaf morphology and is related to different size measures of a species [54]. Morphological features used for taxa delimitation and identification is dependent directly on the studied species specimens.
The present research finding showed that the morphological characters of the R. sericea complex sometimes have complicated taxonomic characters, which is challenging to differentiate the complex species. This estimation on the morphological characters and species collection localities, where some taxa co-occur over the geographical regions investigated (Table 1). The study species here are capable of hybridizing with each other. Some of the individuals are commonly possible to assign to species in mixed populations. The species RS and RO in a previous study [6] differentiated through leaflet numbers. The RS showed fewer leaflets, while RO has more leaflets morphologically. Several ongoing or historical evolutionary processes clarify the morphological dissimilarity among entities within the studied taxa. One possibility is that the species of R. sericea complex represents a single hyperdiverse species phylogenetically. Due to this, these species display genetic panmixia or high levels of gene flow due to less or more constant contact between the populations [6,55,56]. The hyper-diverse species’ morphological characters may be intergrading or demonstrating an approximate relationship with the regional environment [52,53].

4.4. Conservation Strategy

According to Darwin, rarity is a significant precursor of extinction [57,58]. Precise assessments of rare taxon populations and the significant threats are vital to conservation planning and resource allocation for recovery action [59]. As phylogenetically, these species are quite difficult to differentiate, and maybe the species are under ongoing speciation. Our group team has been working on these species for more than a decade [45,46,51,60], and we have information about very few populations, such as the demographic status of RSK, RM, and RZ. The RZ taxon have few numbers of individuals as compared to RSK and RM. As the populations and individual numbers of the one taxon RZ are limited, there is a great chance of drift and inbreeding, altering the genetic structure [61]. Many studies of genetic variation in rare plant taxa have demonstrated that the proportion of polymorphic loci and the number of alleles per locus significantly reduced in small-sized populations [62].
The results of our ENMs indicated that the complex species would have difficulty shortly if climate change drives the taxa into extinction. According to [63], climate change is quantitatively considered in Red list assessments for only a few species. The authors of [64] highlighted that determining the application of SDMs to Red Lists is challenging due to model uncertainties and many biotic and abiotic factors that cannot be studied in such models. They suggested that SDMs and Red List assessments might play a complementary role in conservation actions, such as Red List provides evidence on both current and future risk of extinction for the species, while SDMs warn the magnitude of future extinction risk. Due to the shrinking habitat of the complex in the future climate scenarios, some of the taxa of the complex will lead to extinction due to their rarity and narrow ecological amplitude (Table 6, Table 7 and Table 8).
The rare species of this complex should be conserved in natural habitats where the species grow. Direct population management will help conserve these rare species of the R. sericea complex in the appropriate habitat. Given current land uses (and other pressures of the Anthropocene), however, human interference may be required to maintain the habitat suitable for conserving these rare taxa. As a result, it is not only species that are conservation reliant, but entire ecosystems and the associated disturbance regimes and ecological succession pathways that define them need to be conserved. However, this requires sufficient data on species’ distribution and abundance. The limitation between closely related taxa becomes unclear with hybridization between the same species within the genus and cross genus taxa. Understanding the taxonomy, biodiversity, and conservation biology, the delimitation of species are controversial for biologists, so several species concepts have been evaluated. Reproductive isolation is considered the key standard for delimiting the species [3,5,65].

4.5. Ecology of R. sericea Complex

The R. sericea complex showed apparent macro-morphological variation like some other species of different families [66,67]. Our field investigation observed intergrading morphological characteristics; even the populations were geographically intermixed or proximal, except few entities. However, morphological characters only have been inadequately considerable to determine taxonomic problems within the R. sericea complex. These characters might characterize acclimatization instead of evolutionary variation. Given limited genetic adaptability among the recognized species and the infrequent individual with intermediate characters, these are particularly factual. So, only through integrating ecology will we imply current or ongoing speciation within the R. sericea complex and display assistance for the present taxonomic opinion that the R. sericea complex signifies unique, divergent, or diverging entities. The characteristics that differentiate the R. sericea complex can have ecological significance as variations alongside the environmental gradient over which these two taxa are diverging.
Morphologically R. sericea complex taxa have a smaller number of leaflets or have high leaflet numbers may characterize a variation in temperature, which is higher in the lower elevations of some taxa where the species arises and, therefore, improves the possibility for water loss. Such plants can mitigate water loss in high-temperature environments (niche) with smaller leaf surface areas [68], such as from the smaller number and leaflet size.

5. Conclusions

Through our integrative approach using the field data, ecological factors, and population morphology, we elucidated that qualitative and quantitative characters provide taxonomic descriptions and keys to delimit the taxa. The macromorphological characters showed clear species boundaries, and the taxonomic keys and descriptions provide sufficient evidence as six separate entities. The previous work on the genetics method failed to define species boundaries of the complex. However, species concepts need cohesive evidence such as ecology, morphology, and so on to delineate evolutionarily unique entities since evolution is continuous and leaves different, detectable footprints within different groups of organisms. Additionally, the present knowledge of the conservation status of rare species and the IUCN and its robust network of voluntary experts around the globe is undoubtedly in the best position to guide such work. The present work is based on the collection of samples from more than a decade, suggesting that the species RZ have quite rare populations of individuals and should be conserved. Recognition of unique entities, such as R. sericea complex rare taxa, has vital implications for conservation decisions and robust biodiversity estimates. As the one taxon RZ has narrow ecological amplitude, our niche modelling results suggest that the habitat of these taxa is shrinking with the future climate changes. There is a chance of the extinction of the complex’s rare taxa, which are morphologically different entities.

Supplementary Materials

The following supporting information can be downloaded at: https://www.mdpi.com/article/10.3390/agronomy12051078/s1. Table S1. The morphological characteristics of different populations of Rosa sericea complex from different geographical ranges of Southwest China. Figure S1. The correlation lines among the variables used in the modelling study (Black and red lines indicate a high correlation between variables). Figure S2. The most limiting variables of the species complex distribution in China.

Author Contributions

F.U. and X.G.: Conceptualization, Data curation, Formal analysis, Methodology, Writing—original draft preparation, Writing—review and editing. Y.G. and R.J., Data curation, Formal analysis, Methodology. İ.S. and S.S., Methodology, Writing—review and editing. All authors have read and agreed to the published version of the manuscript.

Funding

This research was supported by the Second Tibetan Plateau Scientific Expedition and Research (STEP) program (2019QZKK0502) and the National Natural Sciences Foundation of China (Project No. 31670192), and National Natural Science Foundation of China 32171605. We are thankful to the Chinese Government Scholarship Program (CSC No. 2018GXZ017484).

Data Availability Statement

All data generated and analyzed during this study are included in this published article.

Acknowledgments

The authors are thankful to the curator and team of CDBI for their support in the examination of samples.

Conflicts of Interest

The authors declare no conflict of interest.

Appendix A

Qualitative and quantitative morphological description of the Rosa sericea complex based on Table S1.
  • Morphological qualitative description of characters
  • Rosa sericea
Prickles; terete, prickles present, sometimes very broad in pairs below the leaves, dense or scattered, robust to fine, abruptly flaring, and the base is broad, sometimes bristles are very dense. Phyllotactic arrangement; not distichous. Vein on adaxial surface; mostly sunken and sometimes flat. Leaf margin; single serrate. leaf margins 2/3 of apex with serrate, ½ with serrate margin were noted. Serrate tooth edge of leaf margin with gland absent. Thorns; thorns of petiole and rachis sometimes absent, rare, and sparse were examined. Thorns of midrib sometimes absent, and rare were noted. Indumentum of leaf adaxially; pubescent and glabrous. Gland of leaf adaxially absent. Indumentum of leaf abaxially; pubescent and glabrous. Gland of the leaf is abaxially mostly absent sometimes rare, sparse, and medium. Indumentum of stipule abaxially; sometimes absent, rarely pubescent, pubescent, sericeous, and densely hairy. Gland of stipule, sometimes absent, only on leaf margins, rarely on leaf margin abaxially, sparsely except leaf margin, and densely except leaf margin. Indumentum of petiole and rachis; sometimes absent, rarely pubescent, pubescent, sericeous, and densely hairy. Glands of petiole and rachis are sometimes absent, rare, sparse, medium, and dense. Indumentum of the pedicel is sometimes absent, rarely pubescent. Indumentum of pedicel; sometimes absent, rarely pubescent, pubescent, sericeous, and densely hairy. The gland of the pedicel is sometimes absent, rare, sparse, medium, and dense. Indumentum of the receptacle; sometimes absent, rarely pubescent, pubescent, sericeous, and densely hairy. Gland of receptacle sometimes absent, rare, sparse, medium, and dense. Sepal morphology; ovate-lanceolate, abaxially sparsely pubescent or subglabrous, adaxially villous, margin entire, apex acuminate, or acute. Indumentum of sepal; sometimes absent, rarely pubescent, pubescent, sericeous, and densely hairy. The gland of the sepal is sometimes absent, rare, sparse, medium, and dense. The number of petals was four mostly few have five. Stalk; not inflated. Hip color; red or bright to reddish, orange to red or red-purple, immature green or greenish.
  • Rosa sikangensis
Prickles; terete, prickles in pairs mostly in pairs below leaves, or intermixed sparse, bristles with dense slender. Phyllotactic arrangement; not distichous. The vein on adaxial surface; is mostly sunken and sometimes flat. Leaf margin; double serrate, ½ with a serrate margin. Serrate tooth edge of leaf margin with gland present. Thorns; thorns of petiole and rachis rare, sparse, medium, and dense were examined. Thorns of midrib were medium and dense were noted. Indumentum of leaf adaxially; sericeous. Gland of leaf adaxially absent. Indumentum of leaf abaxially; sericeous. Gland of leaf abaxially mostly sparse, medium, and dense. Indumentum of stipule abaxially; pubescent, sericeous, and densely hairy. Gland of stipule, sometimes absent, only on leaf margins, rarely on leaf margin abaxially, sparsely except leaf margin, and densely except leaf margin. Indumentum of petiole and rachis; sometimes absent, rarely pubescent, pubescent, sericeous, and densely hairy. Glands of petiole sometimes absent, rare, sparse, medium, and dense. Indumentum of pedicel; sometimes absent, rarely pubescent, pubescent, sericeous, and densely hairy. Gland of the pedicel is sometimes absent, rare, sparse, medium, and dense. These specimens have more hairs on the leaf abaxial surface as well as on the petiole, and fruits.
  • Rosa omeiensis
Phyllotactic arrangement; not distichous. The vein on adaxial surface; is mostly sunken and sometimes flat. Leaf margin; single serrate. leaf margins all serrate, 2/3 of apex with serrate, ½ with serrate margin were observed. Serrate tooth edge of leaf margin with gland absent. Thorns; thorns of petiole and rachis sometimes absent, rare, and sparse were examined. Thorns of midrib sometimes absent, rare, sparse, medium and dense were noted. Indumentum of leaf adaxially; glabrous. Gland of leaf adaxially absent. Indumentum of leaf abaxially; glabrous. Gland of leaf abaxially mostly rarely and sometimes absent. Indumentum of stipule abaxially; sometimes absent, rarely pubescent, pubescent, sericeous, and densely hairy. Gland of stipule, sometimes absent, only on leaf margins, and rarely on leaf margin abaxially. Indumentum of petiole and rachis; sometimes absent, rarely pubescent, pubescent, sericeous, and densely hairy. Glands of the petiole are sometimes absent, rare, sparse, medium, and dense. Indumentum of pedicel; mostly absent, rarely pubescent, and pubescent. Gland of the pedicel is sometimes absent, rare, and sparse. Indumentum of the receptacle; mostly absent, rarely pubescent, and pubescent. Gland of receptacle sometimes absent, rare, and sparse. Sepal morphology; lanceolate, abaxially subglabrous, adaxially sparsely pubescent, margin entire, apex acuminate or long caudate. Indumentum of sepal; rarely pubescent, pubescent, sericeous, and densely hairy. Gland of sepal sometimes absent, rare and sparse. Petals; number of petals were four mostly few have five. Color of petals mostly white, yellowish and pink. Stalk; half inflated. Hip color; red or bright to reddish, orange to red or red purple, immature green or greenish. Prickles; wing like, prickles present in paired below the leaves with broad base, dense or scattered, abruptly flaring, bristles when present very dense, apex tapering or abruptly.
  • Rosa morrisonensis
Prickles; stout, prickles in pairs mostly in pairs below leaves, mostly dense sometimes scattered, bristles dense slender. Phyllotactic arrangement; not distichous. Vein on adaxial surface; mostly flat. Leaf margin; double serrate. Serrate tooth edge of leaf margin with gland present. Leaf margin tooth single tooth. Thorns; thorns of petiole and rachis not present. Thorns of midrib were absent. Indumentum of leaf adaxially; absent. Gland of leaf adaxially rarely. Indumentum of leaf abaxially; sericeous. Gland of leaf abaxially sparse. Indumentum of stipule abaxially; absent. Gland of stipule mostly absent, sometimes in only on leaf margin. Indumentum of petiole and rachis; sometimes absent, and rarely pubescent. Glands of petiole sparse, and medium. Indumentum of pedicel; sometimes absent, rarely pubescent, and pubescent. Gland of pedicel sometimes absent, and rare. Indumentum of receptacle; absent. Gland of receptacle sometimes absent, and rare. Sepal morphology; lanceolate, abaxially glabrous, sometimes sparsely glandular, adaxially densely pubescent, margin entire, apex long acuminate. Indumentum of sepal; sometimes absent mostly rarely pubescent. Gland of sepal sometimes absent, sparse and medium. Gland of receptacle sometimes absent, and rare. Petals; number of petals were four. Color of petals mostly white. Stalk; all inflated. Hip color; orange to red or red purple.
  • Rosa mairei
Prickles; terete, and winglike, prickles present, sometimes very broad in pairs below the leaves, dense or scattered, robust to fine, apex tapering, and the base is broad, sometimes bristles are mostly scattered and sometimes dense. Phyllotactic arrangement; not distichous. Vein on adaxial surface; mostly sunken and sometimes flat. Leaf margin; single serrate. leaf margins 2/3 of apex with serrate, ½ with serrate margin were noted. Serrate tooth edge of leaf margin with gland present. Thorns; thorns of petiole and rachis absent. Thorns of midrib mostly absent, and sometimes dense present. Indumentum of leaf adaxially; pubescent. Gland of leaf adaxially present and dense. Indumentum of leaf abaxially; absent. Gland of leaf abaxially dense. Indumentum of stipule abaxially; sometimes absent, pubescent, and sometimes sericeous. Gland of stipule, rarely on leaf margin abaxially, and densely except from leaf margin. Indumentum of petiole and rachis; absent. Glands of petiole and rachis sometimes medium, and dense. Indumentum of pedicel; sometimes absent, rarely pubescent, and pubescent. Gland of pedicel absent. Indumentum of receptacle; absent. Gland of receptacle absent. Sepal morphology; ovate or lanceolate, abaxially sparsely pubescent, adaxially densely pubescent, margin entire, apex acuminate. Indumentum of sepal; pubescent, sericeous, and densely hairy. Gland of sepal sometimes absent, rare, sparse, and medium. Number of petals were four. White color. Stalk; not inflated and all inflated. Hip color; red or bright to reddish.
  • Rosa zhongdianensis
Prickles; flat, prickles present, sometimes very broad in pairs below the leaves, dense or scattered, robust to fine, tapering, and the base is broad, sometimes bristles are very dense. Phyllotactic arrangement; not distichous. Vein on adaxial surface; sunken on adaxial side. Leaf margin; double serrate. leaf margins double tooth. Serrate tooth edge of leaf margin with gland absent. Thorns; thorns of petiole and rachis sometimes were rare. Thorns of midrib were mostly absent, sometimes rare. Indumentum of leaf adaxially; pubescent. Gland of leaf adaxially absent, rare and sometimes sparse. Indumentum of leaf abaxially; absent. Gland of leaf abaxially mostly rare, and sparse. Indumentum of stipule abaxially; sometimes rarely pubescent, pubescent, sericeous, and densely hairy. Gland of stipule absent. Indumentum of petiole and rachis; sometimes absent, rarely pubescent, pubescent, sericeous, and densely hairy. Glands of petiole and rachis sometimes absent, rare, sparse, and medium. Indumentum of pedicel sometimes rarely pubescent, pubescent, sericeous, and densely hairy. Indumentum of pedicel; sometimes, pubescent, sericeous, and densely hairy. Gland of pedicel absent. Indumentum of receptacle; sometimes absent, and sericeous. Gland of receptacle absent. Sepal morphology; lanceolate, 9–12 mm, both surfaces densely pubescent, margin entire, apex long acuminate, caudate. Indumentum of sepal; sometimes absent, and rarely pubescent. Gland of sepal sometimes absent, rare, and sparse. The number of petals were four. Stalk; not inflated. Hip color; dark red, immature green or greenish.
  • Quantitative discerption of R. sericea complex
  • Rosa sericea
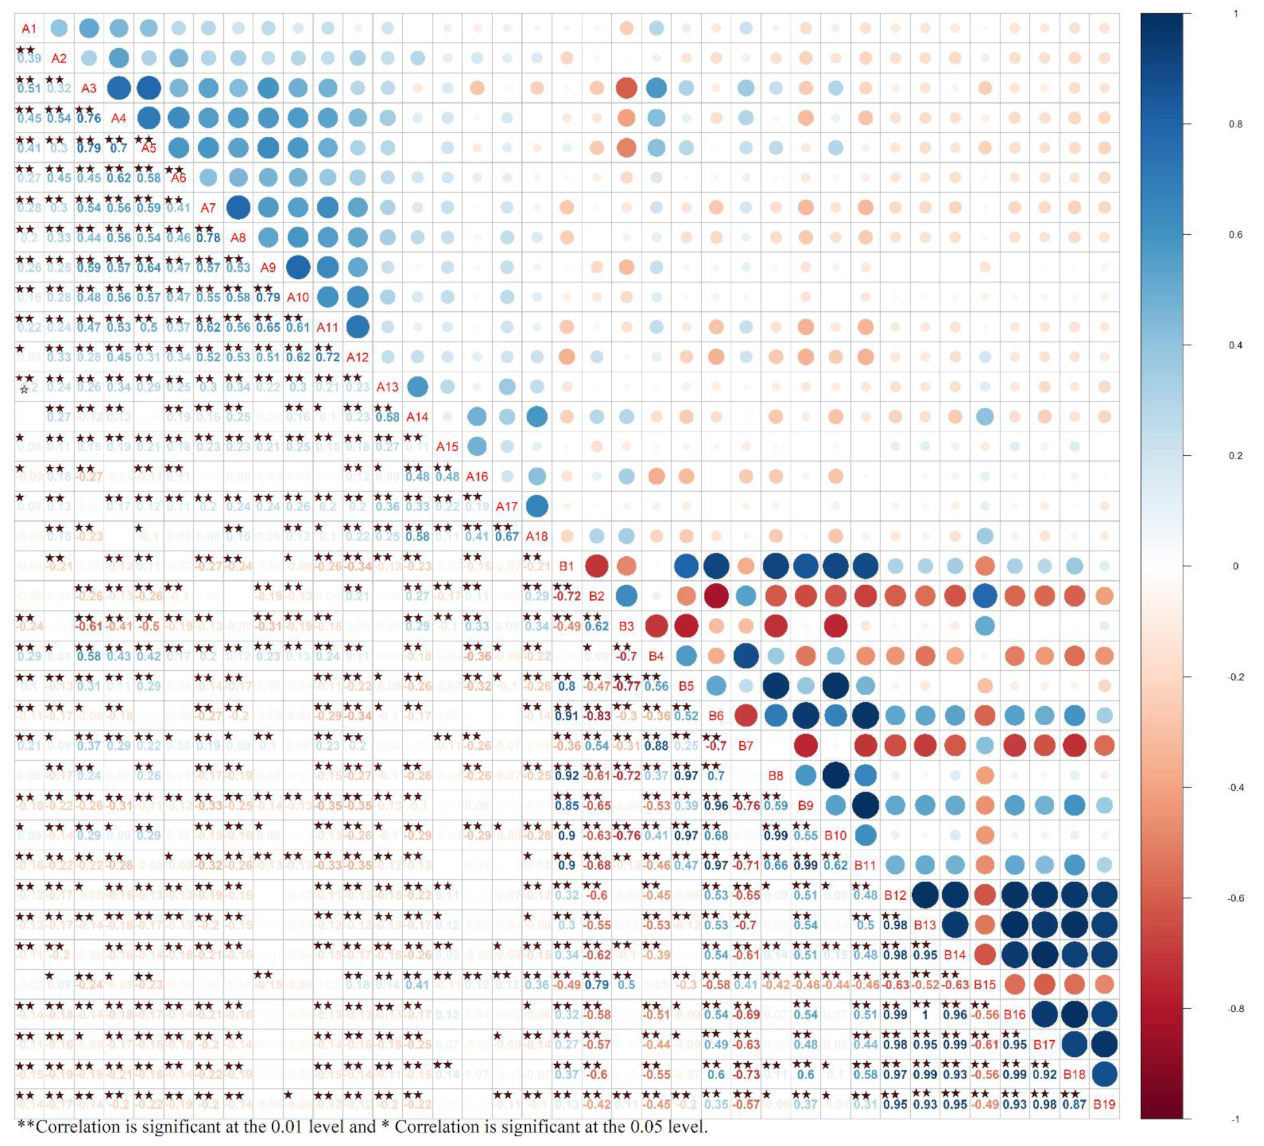
The length ranged from 7–15 mm, but most of the specimens had an average 11 mm of prickles. The width ranges from 7–12 mm. The prickles diameter ranges from 0.9–2.9 cm. Leaf morphology; the number of leaflets minimum ranges from 5–11, number of leaflets maximum ranges from 9–15. Length of leaf minimum ranges from 12.5–50 mm, length of leaf maximum ranges from 20–80 mm. Length of first leaflet on apex minimum ranges from 5.12–17.4 mm, length of the first leaflet on apex maximum ranges from 6.71–31.21 mm. Width of the first leaflet on the apex minimum 2.56–6.43 mm, the width of first leaflet on apex maximum ranges from 3.49–9.8 mm. Length of first leaflet on base minimum ranges from 2–7 mm, length of first leaflet on base maximum ranges from 4–18 mm. Width of the leaflet on base minimum 1.5–8.23 mm, width of the first leaflet on base maximum 2–9.78 mm. Pedicel size; length of pedicle minimum ranges from 1–27 mm, length of pedicel maximum ranges from 2–41.6 mm. Sepal size; length of sepal minimum ranges from 3–19 mm, length of sepal maximum ranges from 6–29 mm. Width of sepal minimum ranges from 1.2–8.7 mm, width of sepal maximum ranges from 1.3–3.5 mm.
  • Rosa omeiensis
The length of prickles was examined various in different specimens of the same species, variation also have been observed, it was ranging from 3–15 mm, but the average length was between 7–10 mm. The width was ranges from 2–12 mm. Prickle diameter was ranging from 1.5–3 cm. Leaf morphology; number of leaflets minimum ranges from 5–11, number of leaflets maximum ranges from 13–17. Length of leaflet minimum ranges from 20–80 mm, length of leaf maximum ranges from 35–115 mm. Length of first leaflet on apex minimum ranges from 5–20 mm, length of the first leaflet on apex maximum ranges from 9–41.1 mm. Width of the first leaflet on apex minimum 2.54–8 mm, width of first leaflet on apex maximum ranges from 3.98–12 mm. Length of first leaflet on base minimum ranges from 3.46–11.12 mm, length of first leaflet on base maximum ranges from 5–17 mm. Width of the leaflet on base minimum 2–6 mm, width of the first leaflet on base maximum 3–8 mm. Pedicel size; length of pedicle minimum ranges from 1–21.5 mm, length of pedicel maximum ranges from 2–34.13 mm. Sepal size; length of sepal minimum ranges from 3.9–16 mm, length of sepal maximum ranges from 5–23 mm. Width of sepal minimum ranges from 1.89–5 mm, width of sepal maximum ranges from 2–6.4 mm.
  • Rosa sikangensis
The prickles length was from 7–15 mm, mostly was from 7–10 mm. The width ranges from 2–12 mm width noted. The prickles diameter ranges from 0.8–1.3 cm. Leaf morphology; number of leaflets minimum ranges from 7–9, number of leaflets maximum ranges from 9–13. Length of leaflet minimum ranges from 13.41–30.23 mm, length of leaf maximum ranges from 30.12–63.56 mm. The length of first leaflet on apex minimum ranges from 5.12–10.29 mm, length of the first leaflet on apex maximum ranges from 8.11–19.78 mm. Width of the first leaflet on the apex minimum 3.34–5.34 mm, the width of the first leaflet on the apex maximum ranges from 4.51–7.53 mm. The length of the first leaflet on the base minimum ranges from 3.12–6.78 mm, length of the first leaflet on the base maximum ranges from 5.14–11.23 mm. Width of the leaflet on-base minimum 2.34–4.32 mm, the width of the first leaflet on-base maximum of 3.03–6.03 mm. Pedicel size; length of pedicle minimum ranges from 3.4–13 mm, length of pedicel maximum ranges from 9.1–32 mm. Sepal size; length of sepal minimum ranges from 4.9–14 mm, length of sepal maximum ranges from 7.9–22 mm. The width of sepal minimum ranges from 1.7–4 mm, the width of sepal minimum ranges from 2.9–9 mm, the width of sepal maximum ranges from 2.5–9 mm.
  • Rosa morrisonensis
The prickles length was from 7–15 mm, mostly was from 7–10 mm. The width ranges from 2–12 mm width noted. The prickle’ diameter ranges from 0.8 to 1.3 cm. Leaf morphology; the number of leaflets minimum were 7, the number of leaflets maximum ranges from 9–11. The length of leaflet minimum ranges from 15–30 mm, length of leaf maximum ranges from 24–45 mm. Length of first leaflet on apex minimum ranges from 5–8 mm, length of the first leaflet on apex maximum ranges from 7–12 mm. The width of the first leaflet on apex minimum 2.5–5 mm, the width of the first leaflet on apex maximum ranges from 3–7 mm. Length of first leaflet on base minimum ranges from 4–6 mm, length of the first leaflet on base maximum ranges from 5–9 mm. The width of the leaflet on base minimum ranges from 2–4 mm, width of the first leaflet on base maximum 3–5.5 mm. Pedicel size; length of pedicle minimum ranges from 4–7 mm, length of pedicel maximum ranges from 5–10 mm. Sepal size; length of sepal minimum ranges from 7–14 mm, length of sepal maximum ranges from 8–14 mm. The width of sepal minimum ranges from 2–3 mm, width of sepal maximum ranges from 2.5–3.5 mm.
  • Rosa mairei
The prickles length was from 7–15 mm, mostly was from 7–10 mm. The width ranges from 2–12 mm width noted. The prickles diameter ranges from 0.8–1.3 cm. Leaf morphology; the number of leaflets minimum were 7–9, number of leaflets maximum ranges from 9–11. The length of leaflet minimum ranges from 20–30 mm, length of leaf maximum ranges from 25–40 mm. The length of the first leaflet on the apex minimum ranges from 7–11 mm, length of the first leaflet on the apex maximum ranges from 9–13 mm. The width of the first leaflet on the apex minimum 3–4.5 mm, the width of first leaflet on apex maximum ranges from 3.5–5.5 mm. The length of first leaflet on base minimum ranges from 3–6 mm, length of first leaflet on the base maximum ranges from 5–9 mm. The width of the leaflet on base minimum ranges from 2–3 mm, width of the first leaflet on a base maximum 2.5–4 mm. Pedicel size; length of pedicle minimum ranges from 2–7 mm, length of pedicel maximum ranges from 3–8 mm. Sepal size; length of sepal minimum ranges from 5–10 mm, length of sepal maximum ranges from 6–12 mm. The width of sepal minimum ranges from 2.5–3 mm, the width of sepal maximum ranges from 3–4 mm.
Rosa zhongdianensis
The prickles length was from 6–8 mm. The width ranges from 4–7 mm width noted. Leaf morphology; the number of leaflets minimum were 5–9, number of leaflets maximum ranges from 9–11. The length of leaflet minimum ranges from 19–42 mm, length of leaf maximum ranges from 32–58 mm. The length of the first leaflet on apex minimum ranges from 7–11 mm, length of the first leaflet on apex maximum ranges from 10–14 mm. Width of the first leaflet on the apex minimum 5–7 mm, the width of first leaflet on apex maximum ranges from 7–8.5 mm. Length of first leaflet on base minimum ranges from 5–8 mm, length of first leaflet on base maximum ranges from 7–13 mm. Width of the leaflet on base minimum ranges from 3–4.5 mm, width of the first leaflet on base maximum 4–5.5 mm. Pedicel size; length of pedicle minimum ranges from 7–14 mm, length of pedicel maximum ranges from 10–15 mm. Sepal size; length of sepal minimum ranges from 9–13 mm, length of sepal maximum ranges from 11–17 mm. Width of sepal minimum ranges from 2.5–3.5 mm, width of sepal maximum ranges from 3–3.5 mm.

References

  1. Mayr, E. The Growth of Biological Thought: Diversity, Evolution, and Inheritance; Harvard University Press: Cambridge, MA, USA, 1982. [Google Scholar]
  2. Goldstein, P.Z.; Brower, A.V. Molecular systematics and the origin of species: New syntheses or methodological introgressions? In Molecular Systematics and Evolution: Theory and Practice; Springer: Berlin/Heidelberg, Germany, 2002; pp. 147–161. [Google Scholar]
  3. Ellstrand, N.C.; Schierenbeck, K.A. Hybridization as a stimulus for the evolution of invasiveness in plants? Proc. Natl. Acad. Sci. USA 2000, 97, 7043–7050. [Google Scholar] [CrossRef] [PubMed] [Green Version]
  4. Prendergast, J.; Quinn, R.; Lawton, J.; Eversham, B.; Gibbons, D. Rare species, the coincidence of diversity hotspots and conservation strategies. Nature 1993, 365, 335–337. [Google Scholar] [CrossRef]
  5. Liti, G.; Barton, D.B.; Louis, E.J. Sequence diversity, reproductive isolation and species concepts in Saccharomyces. Genetics 2006, 174, 839–850. [Google Scholar] [CrossRef] [PubMed] [Green Version]
  6. Gao, Y.; Gao, X.; Harris, A. Species boundaries and parapatric speciation in the complex of alpine shrubs, Rosa sericea (Rosaceae), based on population genetics and ecological tolerances. Front. Plant Sci. 2019, 10, 321. [Google Scholar] [CrossRef] [PubMed] [Green Version]
  7. De Queiroz, K. Species concepts and species delimitation. Syst. Biol. 2007, 56, 879–886. [Google Scholar] [CrossRef] [Green Version]
  8. Mayr, E. The biological species concept. In Species Concepts and Phylogenetic Theory: A Debate; Columbia University Press: New York, NY, USA, 2000; pp. 17–29. [Google Scholar]
  9. Lafuente, A.; Valverde, N. Linnaean Botany and SPANISH Imperial Biopolitics; Antonio Lafuente & Nuria Valverde Instituto de Historia; CSIC: Madrid, Spain, 2005. [Google Scholar]
  10. Parkinson, C.L.; Zamudio, K.R.; Greene, H.W. Phylogeography of the pitviper clade Agkistrodon: Historical ecology, species status, and conservation of cantils. Mol. Ecol. 2000, 9, 411–420. [Google Scholar] [CrossRef] [Green Version]
  11. Shaffer, M.L. Minimum population sizes for species conservation. BioScience 1981, 31, 131–134. [Google Scholar] [CrossRef]
  12. Borchsenius, F. Staggered flowering in four sympatric varieties of geonoma cuneata (Palmae) 1. Biotropica 2002, 34, 603–606. [Google Scholar] [CrossRef]
  13. Hodel, D.R. Chamaedorea Palms: The Species and Their Cultivation; International Palm Society, Universidad Autónoma Chapingo; Mexico Biblioteca Central: Texcoco, Mexico, 1992. [Google Scholar]
  14. Bortolus, A. Error cascades in the biological sciences: The unwanted consequences of using bad taxonomy in ecology. AMBIO A J. Hum. Environ. 2008, 37, 114–118. [Google Scholar] [CrossRef]
  15. Ely, C.V.; de Loreto Bordignon, S.A.; Trevisan, R.; Boldrini, I.I. Implications of poor taxonomy in conservation. J. Nat. Conserv. 2017, 36, 10–13. [Google Scholar]
  16. Nixon, K.C.; Wheeler, Q.D. An amplification of the phylogenetic species concept. Cladistics 1990, 6, 211–223. [Google Scholar] [CrossRef]
  17. Mishler, B.D.; Donoghue, M.J. Species concepts: A case for pluralism. Syst. Zool. 1982, 31, 491–503. [Google Scholar] [CrossRef]
  18. Weston, M.A.; Clarke, K.; Maguire, G.S.; Sumner, J. Morphological and molecular evidence of population divergence in a widespread shorebird across its southern mainland Australian distribution. Conserv. Genet. 2020, 21, 757–770. [Google Scholar] [CrossRef]
  19. Yunli, W.; Yangyang, W.; Wenlong, X.; Chaojie, W.; Chongshi, C.; Shuping, Q. Genetic diversity of pumpkin based on morphological and SSR markers. Pak. J. Bot 2020, 52, 477–487. [Google Scholar] [CrossRef]
  20. Hu, G.-X.; Liu, E.-D.; Wu, Z.-K.; Sytsma, K.J.; Drew, B.T.; Xiang, C.-L. Integrating DNA sequences with morphological analysis clarifies phylogenetic position of Salvia grandifolia (Lamiaceae): An enigmatic species endemic to southwestern China. Int. J. Plant Sci. 2020, 181, 787–799. [Google Scholar] [CrossRef]
  21. McGale, E.; Valim, H.; Mittal, D.; Jimenez, J.M.; Halitschke, R.; Schuman, M.C.; Baldwin, I.T. Determining the scale at which variation in a single gene changes population yields. Elife 2020, 9, e53517. [Google Scholar] [CrossRef] [Green Version]
  22. Smith, A.L.; Hodkinson, T.R.; Villellas, J.; Catford, J.A.; Csergő, A.M.; Blomberg, S.P.; Crone, E.E.; Ehrlén, J.; Garcia, M.B.; Laine, A.-L. Global gene flow releases invasive plants from environmental constraints on genetic diversity. Proc. Natl. Acad. Sci. USA 2020, 117, 4218–4227. [Google Scholar] [CrossRef] [Green Version]
  23. Stange, M.; Barrett, R.D.; Hendry, A.P. The importance of genomic variation for biodiversity, ecosystems and people. Nat. Rev. Genet. 2020, 22, 89–105. [Google Scholar] [CrossRef]
  24. Ivanova, A.A.; Zhelezova, A.D.; Chernov, T.I.; Dedysh, S.N. Linking ecology and systematics of acidobacteria: Distinct habitat preferences of the Acidobacteriia and Blastocatellia in tundra soils. PLoS ONE 2020, 15, e0230157. [Google Scholar] [CrossRef] [Green Version]
  25. Hortal, J.; de Bello, F.; Diniz-Filho, J.A.F.; Lewinsohn, T.M.; Lobo, J.M.; Ladle, R.J. Seven shortfalls that beset large-scale knowledge of biodiversity. Annu. Rev. Ecol. Evol. Syst. 2015, 46, 523–549. [Google Scholar] [CrossRef] [Green Version]
  26. Mace, G.M.; Collar, N.J.; Gaston, K.J.; Hilton-Taylor, C.; Akçakaya, H.R.; Leader-Williams, N.; Milner-Gulland, E.J.; Stuart, S.N. Quantification of extinction risk: IUCN’s system for classifying threatened species. Conserv. Biol. 2008, 22, 1424–1442. [Google Scholar] [CrossRef] [PubMed]
  27. Hochkirch, A.; Samways, M.J.; Gerlach, J.; Böhm, M.; Williams, P.; Cardoso, P.; Cumberlidge, N.; Stephenson, P.; Seddon, M.B.; Clausnitzer, V. A strategy for the next decade to address data deficiency in neglected biodiversity. Conserv. Biol. 2021, 35, 502–509. [Google Scholar] [CrossRef] [PubMed]
  28. Akçakaya, H.R.; Ferson, S.; Burgman, M.A.; Keith, D.A.; Mace, G.M.; Todd, C.R. Making consistent IUCN classifications under uncertainty. Conserv. Biol. 2000, 14, 1001–1013. [Google Scholar] [CrossRef] [Green Version]
  29. Gao, Y.-D.; Zhang, Y.; Gao, X.-F.; Zhu, Z.-M. Pleistocene glaciations, demographic expansion and subsequent isolation promoted morphological heterogeneity: A phylogeographic study of the alpine Rosa sericea complex (Rosaceae). Sci. Rep. 2015, 5, 11698. [Google Scholar] [CrossRef] [Green Version]
  30. Hijmans, R.J.; Cameron, S.E.; Parra, J.L.; Jones, P.G.; Jarvis, A. Very high resolution interpolated climate surfaces for global land areas. Int. J. Climatol. A J. R. Meteorol. Soc. 2005, 25, 1965–1978. [Google Scholar] [CrossRef]
  31. Morelli, T.L.; Smith, A.B.; Mancini, A.N.; Balko, E.A.; Borgerson, C.; Dolch, R.; Farris, Z.; Federman, S.; Golden, C.D.; Holmes, S.M. The fate of Madagascar’s rainforest habitat. Nat. Clim. Chang. 2020, 10, 89–96. [Google Scholar] [CrossRef]
  32. Fick, S.E.; Hijmans, R.J. WorldClim 2: New 1-km spatial resolution climate surfaces for global land areas. Int. J. Climatol. 2017, 37, 4302–4315. [Google Scholar] [CrossRef]
  33. Phillips, S.J.; Anderson, R.P.; Schapire, R.E. Maximum entropy modeling of species geographic distributions. Ecol. Model. 2006, 190, 231–259. [Google Scholar] [CrossRef] [Green Version]
  34. Vignali, S.; Barras, A.G.; Arlettaz, R.; Braunisch, V. SDMtune: An R package to tune and evaluate species distribution models. Ecol. Evol. 2020, 10, 11488–11506. [Google Scholar] [CrossRef]
  35. Zhou, Z.; Bao, W. Levels of physiological dormancy and methods for improving seed germination of four rose species. Sci. Hortic. 2011, 129, 818–824. [Google Scholar] [CrossRef]
  36. Porfirio, L.L.; Harris, R.M.; Lefroy, E.C.; Hugh, S.; Gould, S.F.; Lee, G.; Bindoff, N.L.; Mackey, B. Improving the use of species distribution models in conservation planning and management under climate change. PLoS ONE 2014, 9, e113749. [Google Scholar] [CrossRef] [PubMed] [Green Version]
  37. Sari, I.; Kandemir, A. Will Ferulago glareosa Kandemir and Hedge (Apiaceae) be extinct in the near future? Turk. J. Bot. 2020, 44, 427–440. [Google Scholar] [CrossRef]
  38. Guisan, A.; Thuiller, W.; Zimmermann, N.E. Habitat Suitability and Distribution Models: With Applications in R; Cambridge University Press: Cambridge, UK, 2017. [Google Scholar]
  39. Allouche, O.; Tsoar, A.; Kadmon, R. Assessing the accuracy of species distribution models: Prevalence, kappa and the true skill statistic (TSS). J. Appl. Ecol. 2006, 43, 1223–1232. [Google Scholar] [CrossRef]
  40. Warren, D.L.; Matzke, N.J.; Cardillo, M.; Baumgartner, J.B.; Beaumont, L.J.; Turelli, M.; Glor, R.E.; Huron, N.A.; Simões, M.; Iglesias, T.L. ENMTools 1.0: An R package for comparative ecological biogeography. Ecography 2021, 44, 504–511. [Google Scholar] [CrossRef]
  41. Soltis, P.S.; Gitzendanner, M.A. Molecular systematics and the conservation of rare species. Conserv. Biol. 1999, 13, 471–483. [Google Scholar] [CrossRef]
  42. Vane-Wright, R.I.; Humphries, C.J.; Williams, P.H. What to protect?—Systematics and the agony of choice. Biol. Conserv. 1991, 55, 235–254. [Google Scholar] [CrossRef]
  43. Thorne, R.F. An updated phylogenetic classification of the flowering plants. Aliso A J. Syst. Evol. Bot. 1992, 13, 365–389. [Google Scholar] [CrossRef] [Green Version]
  44. Chase, M.W.; Reveal, J.L. A phylogenetic classification of the land plants to accompany APG III. Bot. J. Linn. Soc. 2009, 161, 122–127. [Google Scholar] [CrossRef]
  45. Shah, S.N.; Ahmad, M.; Zafar, M.; Ullah, F.; Zaman, W.; Malik, K.; Rashid, N.; Gul, S. Taxonomic importance of spore morphology in Thelypteridaceae from Northern Pakistan. Microsc. Res. Tech. 2019, 82, 1326–1333. [Google Scholar] [CrossRef]
  46. Fougère-Danezan, M.; Joly, S.; Bruneau, A.; Gao, X.-F.; Zhang, L.-B. Phylogeny and biogeography of wild roses with specific attention to polyploids. Ann. Bot. 2015, 115, 275–291. [Google Scholar] [CrossRef] [Green Version]
  47. Ghalambor, C.K.; McKay, J.K.; Carroll, S.P.; Reznick, D.N. Adaptive versus non-adaptive phenotypic plasticity and the potential for contemporary adaptation in new environments. Funct. Ecol. 2007, 21, 394–407. [Google Scholar] [CrossRef]
  48. De Jong, G. Evolution of phenotypic plasticity: Patterns of plasticity and the emergence of ecotypes. New Phytol. 2005, 166, 101–118. [Google Scholar] [CrossRef] [PubMed]
  49. Cole, S.; Bhardwaj, G.; Gerlach, J.; Mackie, J.; Grant, C.; Almquist, K.; Stewart, A.; Kurz, E.; Duncan, A.; Deeley, R.G. Overexpression of a transporter gene in a multidrug-resistant human lung cancer cell line. Science 1992, 258, 1650–1654. [Google Scholar] [CrossRef] [PubMed]
  50. Mallet, J. Hybrid speciation. Nature 2007, 446, 279–283. [Google Scholar] [CrossRef] [PubMed]
  51. Ullah, F.; Ayaz, A.; Saqib, S.; Zaman, W.; Butt, M.A.; Ullah, A. Silene conoidea L.: A Review on its Systematic, Ethnobotany and Phytochemical profile. Plant Sci. Today 2019, 6, 373–382. [Google Scholar] [CrossRef]
  52. Nosil, P. Speciation with gene flow could be common. Mol. Ecol. 2008, 17, 2103–2106. [Google Scholar] [CrossRef]
  53. Baird, H.P.; Miller, K.J.; Stark, J.S. Evidence of hidden biodiversity, ongoing speciation and diverse patterns of genetic structure in giant Antarctic amphipods. Mol. Ecol. 2011, 20, 3439–3454. [Google Scholar] [CrossRef]
  54. Hedrén, M. Patterns of allozyme and morphological differentiation in the Carex flava complex (Cyperaceae) in Fennoscandiaxs. Nord. J. Bot. 2002, 22, 257–301. [Google Scholar] [CrossRef]
  55. Hamrick, J.L.; Godt, M.W. Allozyme diversity in plant species. In Plant Population Genetics, Breeding, and Genetic Resources; Brown, A.H.D., Clegg, M.T., Kahler, A.L., Weir, B.S., Eds.; Sinauer: Sunderland, MA, USA, 1990; pp. 43–63. [Google Scholar]
  56. Millar, C.I.; Libby, W.J. Strategies for conserving clinal, ecotypic, and disjunct population diversity in widespread species. Genet. Conserv. Rare Plants 1991, 149, 170. [Google Scholar]
  57. Oostermeijer, J. Threats to rare plant persistence. In Population Viability in Plants; Springer: Berlin/Heidelberg, Germany, 2003; pp. 17–58. [Google Scholar]
  58. Darwin, C. On the Origin of Species: A Facsimile of the First Edition; Harvard University Press: Cambridge, MA, USA, 1964; Volume 11. [Google Scholar]
  59. Schemske, D.W.; Husband, B.C.; Ruckelshaus, M.H.; Goodwillie, C.; Parker, I.M.; Bishop, J.G. Evaluating approaches to the conservation of rare and endangered plants. Ecology 1994, 75, 584–606. [Google Scholar] [CrossRef] [Green Version]
  60. Xiao-Mei, W.; Xin-Fen, G.; Zhang, L.-B. A systematic study of Rosa sericea (Rosaceae) complex: Are R. omeiensis and R. sericea conspecific? J. Syst. Evol. 2008, 46, 919–928. [Google Scholar]
  61. Young, A.; Boyle, T.; Brown, T. The population genetic consequences of habitat fragmentation for plants. Trends Ecol. Evol. 1996, 11, 413–418. [Google Scholar] [CrossRef]
  62. Luijten, S.H.; Dierick, A.; Gerard, J.; Oostermeijer, B.; Raijmann, L.E.; Den Nijs, H.C. Population size, genetic variation, and reproductive success in a rapidly declining, self-incompatible perennial (Arnica montana) in The Netherlands. Conserv. Biol. 2000, 14, 1776–1787. [Google Scholar]
  63. Akçakaya, H.R.; Butchart, S.H.; Watson, J.E.; Pearson, R.G. Preventing species extinctions resulting from climate change. Nat. Clim. Chang. 2014, 4, 1048–1049. [Google Scholar] [CrossRef]
  64. Attorre, F.; Abeli, T.; Bacchetta, G.; Farcomeni, A.; Fenu, G.; De Sanctis, M.; Gargano, D.; Peruzzi, L.; Montagnani, C.; Rossi, G. How to include the impact of climate change in the extinction risk assessment of policy plant species? J. Nat. Conserv. 2018, 44, 43–49. [Google Scholar] [CrossRef]
  65. Lyons, K.G.; Brigham, C.A.; Traut, B.H.; Schwartz, M.W. Rare species and ecosystem functioning. Conserv. Biol. 2005, 19, 1019–1024. [Google Scholar] [CrossRef]
  66. Ku, T.; Robertson, K. Rosa (Rosaceae). Flora China 2003, 9, 339–381. [Google Scholar]
  67. Esfandani-Bozchaloyi, S.; Zaman, W. Taxonomic significance of macro and micro-morphology of Geranium L. species using scanning electron microscopy. Microsc. Res. Tech. 2018, 81, 1520–1532. [Google Scholar] [CrossRef]
  68. Givnish, T.J.; Kriebel, R. Causes of ecological gradients in leaf margin entirety: Evaluating the roles of biomechanics, hydraulics, vein geometry, and bud packing. Am. J. Bot. 2017, 104, 354–366. [Google Scholar] [CrossRef] [Green Version]
Figure 1. The distribution of different taxa of the Rosa sericea complex based on different herbaria samples. The map is based on different Herbaria records i.e., CDBI, PE, QTPMB, NAS, KUN, LZH, and KATH.
Agronomy 12 01078 g001
Figure 2. PCA analysis of quantitative morphological characteristics of R. sericea complex (A), PCA analysis of qualitative morphological features of R. sericea complex (B), PCA analysis of environmental characteristics population-based of R. sericea complex (C), PCA analysis of morphological characters and environmental factors of R. sericea complex (D).
Agronomy 12 01078 g002
Figure 3. Correlation between the 19 bio and quantitative characteristics (1 = Length of leaf minimum, 2 = Length of leaf maximum, 3 = length of the first leaflet on apex minimum, 4 = length of the first leaflet on apex maximum, 5 = width of the first leaflet on apex minimum, 6 = width of the first leaflet on apex maximum, 7 = length of the first leaflet on-base minimum, 8 = length of the first leaflet on-base maximum 9 = width of the first leaflet on-base minimum, 10 = width of the first leaflet on-base maximum, 11 = length of pedicel minimum, 12 = length of pedicel maximum, 13 = length of sepal minimum, 14 = length of sepal maximum, 15 = width of sepal minimum, 16 = width of sepal maximum, 17 = bio1, 18 = bio2, 19 = bio3, 20 = bio4, 21 = bio5, 22 = bio6, 23 = bio7, 24 = bio8, 25 = bio9, 26 = bio10, 27 = bio11, 28 = bio12, 29 = bio13, 30 = bio14, 31 = bio15, 32 = bio16, 33 = bio17, 34 = bio18, 35 = bio19) the bio 19 at 2.5 arc minute resolution and projected based on present-day climatic conditions the codes of bio 19 is according to https://www.worldclim.org/, accessed on 15 June 2021. The graphical representation showed a correlation between −1 and 1 from brown and red to bluish.
Agronomy 12 01078 g003
Figure 4. The response of R. sericea complex to three climatic variables and ROC curve of the model.
Agronomy 12 01078 g004
Figure 5. The current potential distribution model of R. sericea complex.
Agronomy 12 01078 g005
Figure 6. Future suitability areas and the size of the highly suitable areas predicted by models BCC-CSM2-MR ssp245 (left) and BCC-CSM2-MR ssp585 (right) for 2100.
Agronomy 12 01078 g006
Figure 7. The size and placement of highly suitable areas predicted by the future distribution models BCC-CSM2-MR ssp245 (left) and BCC-CSM2-MR ssp585 (right) for 2100.
Agronomy 12 01078 g007
Table 1. Sample collection information for this research.
SpeciesLocalityLatitudeLongitudeAltitudePopulation CodeCollection Year
RSTibet, Yadong27.4288.942786GXF-166462018
RSTibet, Cuona27.9191.802935GXF-166922018
RSTibet, Gyaca29.1392.693188GXF-167342018
RSSichuan, Baoxing30.77102.722325GXF-170172019
ROSichuan, Baoxing30.83102.723127GXF-170182019
ROSichuan, Xianojin30.89102.653593GXF-170222019
ROSichuan, Erlang29.85102.292885.69GXF-173142020
RSSichuan, Erlang29.85102.262738GXF-173162020
RSSichuan, Erlang29.84102.252497.53GXF-173222020
RSSichuan, Erlang29.8464102.262409GXF-173232020
RSSichuan, Erlang29.84102.252247.08GXF-173242020
ROSichuan, Xiangcheng29.1299.993970.7GXF-173732020
RSSichuan, Xiangcheng29.1499.973717.34GXF-173752020
ROSichuan, Xiangcheng29.1399.973831.88GXF-173762020
ROSichuan, Xiangcheng29.1499.963679.29GXF-173772020
RSSichuan, Xiangcheng29.1599.933572GXF-173802020
RSSichuan, Xiangcheng29.1599.933412.35GXF-173832020
RSSichuan, Xiangcheng29.1499.913176.9GXF-173842020
RSSichuan, Xiangcheng29.1199.912941.69GXF-173852020
RSSichuan, Xiangcheng28.9799.842797.29GXF-173862020
RSTibet, Yadong27.4588.922872.27GXF-175102020
RSTibet, Yadong27.5188.953088.38GXF-175122020
RSTibet, Yadong27.5589.003455.09GXF-175132020
RSTibet, Yadong27.5188.953232.9GXF-175142020
RSTibet, Jilong28.7885.303955.38GXF-175382020
RSTibet, Jilong28.4385.262919.29GXF-175392020
ROTibet, Jilong28.4985.223167.12GXF-175402020
ROTibet, Jilong28.5185.223335.99GXF-175422020
ROTibet, Jilong28.3785.332749.6GXF-175432020
RSTibet, Jilong28.4085.352751.14GXF-175592020
RSTibet, Jilong28.6485.273733.56GXF-175612020
ROTibet, Jilong28.5585.243580.76GXF-175622020
RSTibet, Lhasa29.7491.153880.1GXF-175712020
RSTibet, Ding Qing31.2195.793537.08GXF-175752020
RSTibet, ChangDu31.0996.984094.1GXF-175762020
RSTibet, ChangDu31.1097.003851.54GXF-175782020
RSTibet, ChangDu31.1297.023707.31GXF-175792020
RSTibet, ChangDu31.1697.023515.18GXF-175802020
RSTibet, ChangDu31.1997.033334.63GXF-175812020
RSTibet, ChangDu30.688697.2501974168GXF-167712018
RSYunnan, Zhaotong27.46603104.147691750–1789GXF-128002011
RSYunnan, Zhaotong27.24207104.16031450–1500GXF-128042011
RSYunnan, Zhaotong27.50387105.129361380–1450GXF-128182011
RSGuizhou, Liupanshui26.39813104.451661970GXF-128492011
RMYunnan, Qujing26.4845103.5898752185GXF-167852019
ROHubei, Xingshan31.28560110.180612150–2180GXF-130742011
ROHubei, Yichang31.27466110.13412700GXF-130882011
ROShaanxi, Ankang32.1228109.186522057GXF-131602011
ROShaanxi, Xian33.50604108.484831800–1915GXF-131682011
ROGansu, Pingliang35.10787106.216002110–2300GXF-132202011
ROGansu, Baiyin37.8084103.445532618–2820GXF-132382011
ROGansu, Lanzhou35.47600104.33232200–2600GXF-132502011
ROGansu, Dingxi35.57906104.05682600GXF-132592011
ROYunnan, Shangri-la28.3445899.500084250GXF-134072011
ROYunnan, Dêqên28.2012399.55144180GXF-134422011
RSTibet, Nagqu31.1189294.25633960GXF-153662011
ROQinghai, Xining36.59186101.444132500GXF-154702011
ROQinghai, Haidong35.49680102.417251950GXF-155002011
RMOTaiwan, Hualian24.141085121.2837143180GXF-156252012
RSGuizhou, Bijie27.65232105.3802611645GXF-170062019
ROTibet, ChangDu30.412797.16083600GXF-125432010
ROTibet, Yadong27.5781689.025373800GXF-166392018
RZYunnan, Diqing28.09491699.4817253007GXF-173902020
Table 2. Dichotomous taxonomic key of the Taxa of Rosa sericea complex based on macro-morphological features.
1+number of leaflets minimum 5–112
number of leaflets minimum 76
2+number of leaflets maximum 7–15, length of leaf minimum 12.5–50 mm, and maximum 20–80 mm, sepals ovate-lanceolate, abaxially sparsely pubescent or subglabrous, adaxially villous, margin entire, apex acuminate or acuteR. sericea
number of leaflets maximum 9–17, length of leaf minimum 20–80 mm, and maximum 35–115 mm, sepals lanceolate, abaxially subglabrous, adaxially sparsely pubescent, margin entire, apex acuminate or long caudate3
3+length of the first leaflet on apex minimum 5–20 mm, maximum 9–41.1, leaf margins single serrateR. omeiensis
length of the first leaflet on apex minimum 5.12–10.29 mm, maximum 8.11–19.78, leaf margins double serrate4
4+leaf margin double tooth, thrones of petiole and rachis rare, sparse, medium, dense, length of first leaflets base minimum, 3.12–6.78 mm, and maximum, 5.14–11.23R. sikangensis
leaf margin single tooth, thrones of petiole and rachis absent, length of first leaflets base minimum 3–6 mm, and maximum, 5–9 mm5
5+Hip colour red or bright to reddish, length of pedicel minimum 2–7 mm, and maximum 3–8 mmR. mairei
Hip colour orange to red-purple, length of pedicel minimum 4–7 mm, and maximum 5–10 mm6
6+Minimum number of leaflets 7, maximum 9–11, length of leaflet ranges from 15–45 mmR. morrisonensis
Minimum number of leaflets 7–9, maximum 9–11, length of leaflets ranges from 21–47 mm7
7+Sepal broadly ovate, apex shortly caudate, sepal size 6–10 mm, width 2–5 mmR. taronensis
Sepal lanceolate, apex acuminate, sepal size 9–17 mm, width 2.5–3.5 mmR. zhongdianensis
Table 3. PCA analysis of quantitative morphological characteristics.
PCEigenvalue% Variance
1475.90574.668
276.984112.079
336.33515.7008
413.89512.1801
510.01861.5719
67.292661.1442
75.101940.80048
82.610960.40965
91.8710.29355
101.76790.27738
111.585190.24871
121.366460.21439
130.8398910.13178
140.6296850.098795
150.5431760.085222
160.251170.039408
170.2144020.033639
180.1514870.023768
Table 4. PCA analysis of qualitative morphological characteristics.
PCEigenvalue% Variance
17.4580431.325
23.5115514.749
32.7781511.669
41.58736.6669
51.554236.528
60.9588564.0273
70.9513773.9959
80.8430493.5409
90.6276192.6361
100.5757172.4181
110.5153552.1646
120.3816541.603
130.3180811.336
140.2535941.0651
150.2388151.0031
160.1971260.82796
170.1829210.76829
180.1695160.71199
Table 5. PCA analysis of environmental characteristics of the studied populations.
PCEigenvalue% Variance
1280,22193.582
213,001.94.3421
33998.361.3353
41244.910.41574
5424.430.14174
6254.8890.085122
7109.3480.036517
860.9920.020369
946.62650.015571
1028.15970.0094041
1123.96640.0080037
128.894860.0029705
136.64210.0022182
143.563710.0011901
152.388130.00079753
161.311540.000438
170.8262180.00027592
180.7706160.00025735
Table 6. PCA analysis of environmental and quantitative characteristics.
PCEigenvalue% Variance
1524,07595.616
217,160.33.1308
34136.920.75477
41088.620.19861
5505.1710.092167
6373.8550.068209
7320.2270.058424
8114.5990.020908
972.36840.013203
1061.24970.011175
1144.47840.0081149
1233.44810.0061025
1323.80530.0043432
1422.5530.0041147
1512.28620.0022416
1610.55930.0019265
179.754940.0017798
187.675230.0014003
Table 7. TSS and AUC values obtained from the models implemented in this study.
SSPs and CURRENT SDMAUC (Train)TSS (Train)
BCC-CSM2-MR ssp245 2021–20400.970.90
BCC-CSM2-MR ssp245 2041–20600.940.83
BCC-CSM2-MR ssp245 2061–20800.950.82
BCC-CSM2-MR ssp245 2081–21000.960.83
BCC-CSM2-MR ssp585 2021–20400.950.81
BCC-CSM2-MR ssp585 2041–20600.940.82
BCC-CSM2-MR ssp585 2061–20800.970.86
BCC-CSM2-MR ssp585 2081–21000.960.83
CURRENT SDM0.930.92
Table 8. Variable importance of the first model carried out with all climatic variables.
VariablePercent ContributionPermutation Importance
bio1128.444137.0614
bio1021.06016.4193
bio129.90302.2631
bio038.19106.4651
bio027.446512.7615
bio046.76110.0000
bio193.477510.5466
bio012.09860.0000
bio062.02450.5266
bio181.78539.9935
bio151.63882.0871
bio141.62584.9419
bio051.55830.2241
bio091.54652.8801
bio071.32940.4519
bio171.09343.3778
bio160.01610.0000
bio080.00000.0000
bio130.00000.0000
Publisher’s Note: MDPI stays neutral with regard to jurisdictional claims in published maps and institutional affiliations.

