Article

Optimizing Water and Nitrogen Strategies to Improve Forage Oat Yield and Quality on the Tibetan Plateau Using APSIM

1
State Key Laboratory of Grassland Agroecosystems, Lanzhou University, Lanzhou 730020, China
2
College of Pastoral Agriculture Science and Technology, Lanzhou University, Lanzhou 730020, China
*
Author to whom correspondence should be addressed.
Agronomy 2022, 12(4), 933; https://doi.org/10.3390/agronomy12040933
Submission received: 8 March 2022 / Revised: 7 April 2022 / Accepted: 11 April 2022 / Published: 13 April 2022
(This article belongs to the Special Issue Progress in Plant Bioclimatic Modelling under Global Climate Change)

Abstract

:
There is a great need for improving oat forage production to increase forage supply and protect grassland ecosystems on the Tibetan Plateau. We conducted two field experiments and modeling work to investigate the responses of oat (Avena sativa L.) forage yield and N uptake to water and N applications, and to optimize the water and N scheduling under rainfed and irrigated conditions. The experiments were conducted in 2017 and 2018 at Jintai farm in the northeast of the Tibetan Plateau. Two N-applying rates of 120 and 60 kg ha−1 were tested in 2017, and four irrigation treatments (no irrigation—NI, irrigated 50 mm at flowering—I1, irrigated 50 mm at tillering and jointing—I2, and irrigated 50 mm at tillering, jointing, and flowering—I3) were applied under every N rate in 2018. The Agricultural Production System Simulator (APSIM) was calibrated and validated for the local oat variety. Under rainfed conditions in both years, oat yields under high and low N were 7.98–8.52 and 5.09–6.53 t ha−1, respectively; the high N rate significantly increased forage yield and N uptake compared to low N conditions by 22.2–67.4% (p < 0.01) and 42.0–162.0% (p < 0.01), respectively. In 2018, irrigation increased oat forage yield by 29.8–96.6% (p < 0.01) and increased N uptake by 19.6–50.5% (p > 0.05); N rates had no significant effect on forage yield (p > 0.05), but significantly increased N uptake by 42.6–64.7% (p < 0.01). I2 was superior to I3 in terms of increasing water use efficiency (WUE) while maintaining high forage yield and N uptake. APSIM-oat was calibrated with data under both rainfed and irrigated conditions and was confirmed to have good accuracy and lower normalized root mean square errors (NRMSEs) for phonology dates, forage yield, soil water storage, and N uptake. Scenario analysis was performed with 30-year historical weather data; five N rates were designed for rainfed conditions, and 25 scenarios comprising five N rates and five irrigation levels were designed for irrigated conditions. Simulations showed that the N rate of 90 kg ha−1 resulted in the best performance for oat under rainfed conditions. Under irrigated conditions, irrigation promoted oat nitrogen uptake. Thus, overall an N rate of 120 kg ha−1 in combination with irrigation of 120 mm applied during the vegetative growth period performed the best. This optimized strategy may provide guidance on water and N management of oat forage production in the Tibetan Plateau and similar alpine regions worldwide. The promoted strategy increases yields while reducing water and nitrogen resource wastes, thus decreasing the environmental pollution from agriculture and responding to the sustainable development of farmland ecosystems.

1. Introduction

The Tibetan Plateau has a high altitude called the Third Pole, as it is a polar region with extensive human activity [1]. Although the temperature on the plateau is low and the crop growing season is short, agriculture plays a major role in the development of social economy in this area. Crop cultivation and livestock farming provide daily necessities for rural households. Over-grazing of natural grassland has caused damage to ecosystems on the plateau, and thus agricultural development is widely encouraged, and the government has stepped up efforts to modernize the regional agriculture [2,3,4].
Most agricultural areas on the Tibetan Plateau are located in semi-arid areas where the vagaries of climate and unstable water supply largely limit crops production. Water and nitrogen (N) management are key to improving the yield and yield stability of forage crops. Oat (Avena sativa L.) is widely used as a forage crop in this area, as it has a short growth duration and good adaptive capability to low temperature and drought [5,6]. The Tibetan Plateau is a major oat production area in China; however, the production and quality of oat forage are low and variable [7]. Irrigation is not available in some areas, while in areas with irrigation facilities, the irrigation regime is poorly scheduled. In addition, as a cereal crop, oat requires a large number of nutrients from the soil to produce high-quality forage. In practice, farmers usually apply excessive amounts of fertilizer, resulting in substantial environmental problems such as soil acidification and water and air pollution [8,9]. Hence, in oat forage production, optimized water and nutrient management strategies are needed in order to meet the requirements and maximize the use efficiencies of these parameters.
A previous study showed that oat with irrigation showed a higher and more stable forage yield, but at the same time, it was faced with the risk of lodging, which would reduce the yield potential [10]. Forage oat was most sensitive to water shortage during the tillering, jointing, and heading stages; reducing water supply during non-sensitive stages could reduce the water use of oat by 7.2% [11]. Zhao et al. [12] validated that excessive irrigation in later stages significantly and adversely affected oat dry matter accumulation and water use efficiency (WUE). To achieve forage production, irrigation during oat’s vegetative stages is necessary. In addition, rainfall in our study area mainly occurs in late summer and early autumn, when oat reaches the flowering and grain-filling stages, and irrigation in these stages might result in a waste of water resources. However, too much water in the early stages would restrict crop root development and reduce the utilization of soil water storage, and thus reduce crop WUE [8,13]. Therefore, we hypothesized that a moderate amount of supplementary irrigation in the early stages would improve oat forage yield and WUE.
In terms of N use, oat production responds differently to N application under different soil and cultivation conditions. Jia et al. [14] found applying 90 kg ha−1 N resulted in the highest oat forage production in a rainfed area on the Tibetan Plateau; in comparison, Gao et al. [15] found a higher optimum N-applying rate of 375 kg ha−1 for oat forage production on irrigated sandy land. Nitrogen deficiency would restrict the yield potential of oat in a given heat and light environment, and also reduce oat N uptake and forage quality [16]; however, overuse of N might lead fertilizer waste and environment pollution. It also leads to a reduction in profit margins and promotion of weed prolificacies. How the yield and N uptake of forage oat are affected by N application under rainfed and irrigation conditions on the Tibetan Plateau is still unclear.
Appropriate nitrogen levels increase the crop leaf area index and intercept more radiation, thus leading to a greater production of biomass [17]. In addition, Zhou et al. reported that adequate nitrogen supply could increase crop transpiration [18]. Increasing irrigation mainly promotes the transport of nutrients and plant assimilates by increasing the transpiration of the crop [19]. Water and N application usually have a syngeneic impact on crop growth and yield [20,21]. When water was fully supplied, proper N fertilization was needed to prevent nutrient deficiencies but too much fertilizer would result in N leaching and low use efficiency [13,22]. When water was not fully supplied, less N fertilization was usually needed to realize the water-limited maximum crop yield [6,23]. However, the interacting effects of water and N on oat forage production are rarely investigated, especially in the Tibetan alpine environment.
Crop growth models are practical decision-making tools that consider the complex interactions among crops, weather, soil, and management measures that affect crop performance. The Agricultural Production System Simulator (APSIM) is particularly suitable for analyzing water and N management in a crop planting system because it can dynamically represent the processes of crop growth in terms of water and N utilization [23]. It has already been successfully used under different field conditions worldwide in irrigation and N management [24,25]. Most of the previous studies have focused on the maximization of grain yield, and few have aimed at optimizing both biomass yield and N uptake, which are essential for forage crops.
Therefore, we conducted this study with the objectives of: (i) clarifying the yield, water use, WUE, N uptake, and nitrogen use efficiency of oat in response to different water and N fertilizer applications; (ii) calibrating and validating APSIM-oat with field data measured in different years; and (iii) determining the best management strategies to improve forage oat water and N productivity on the semi-arid Tibetan Plateau.

2. Materials and Methods

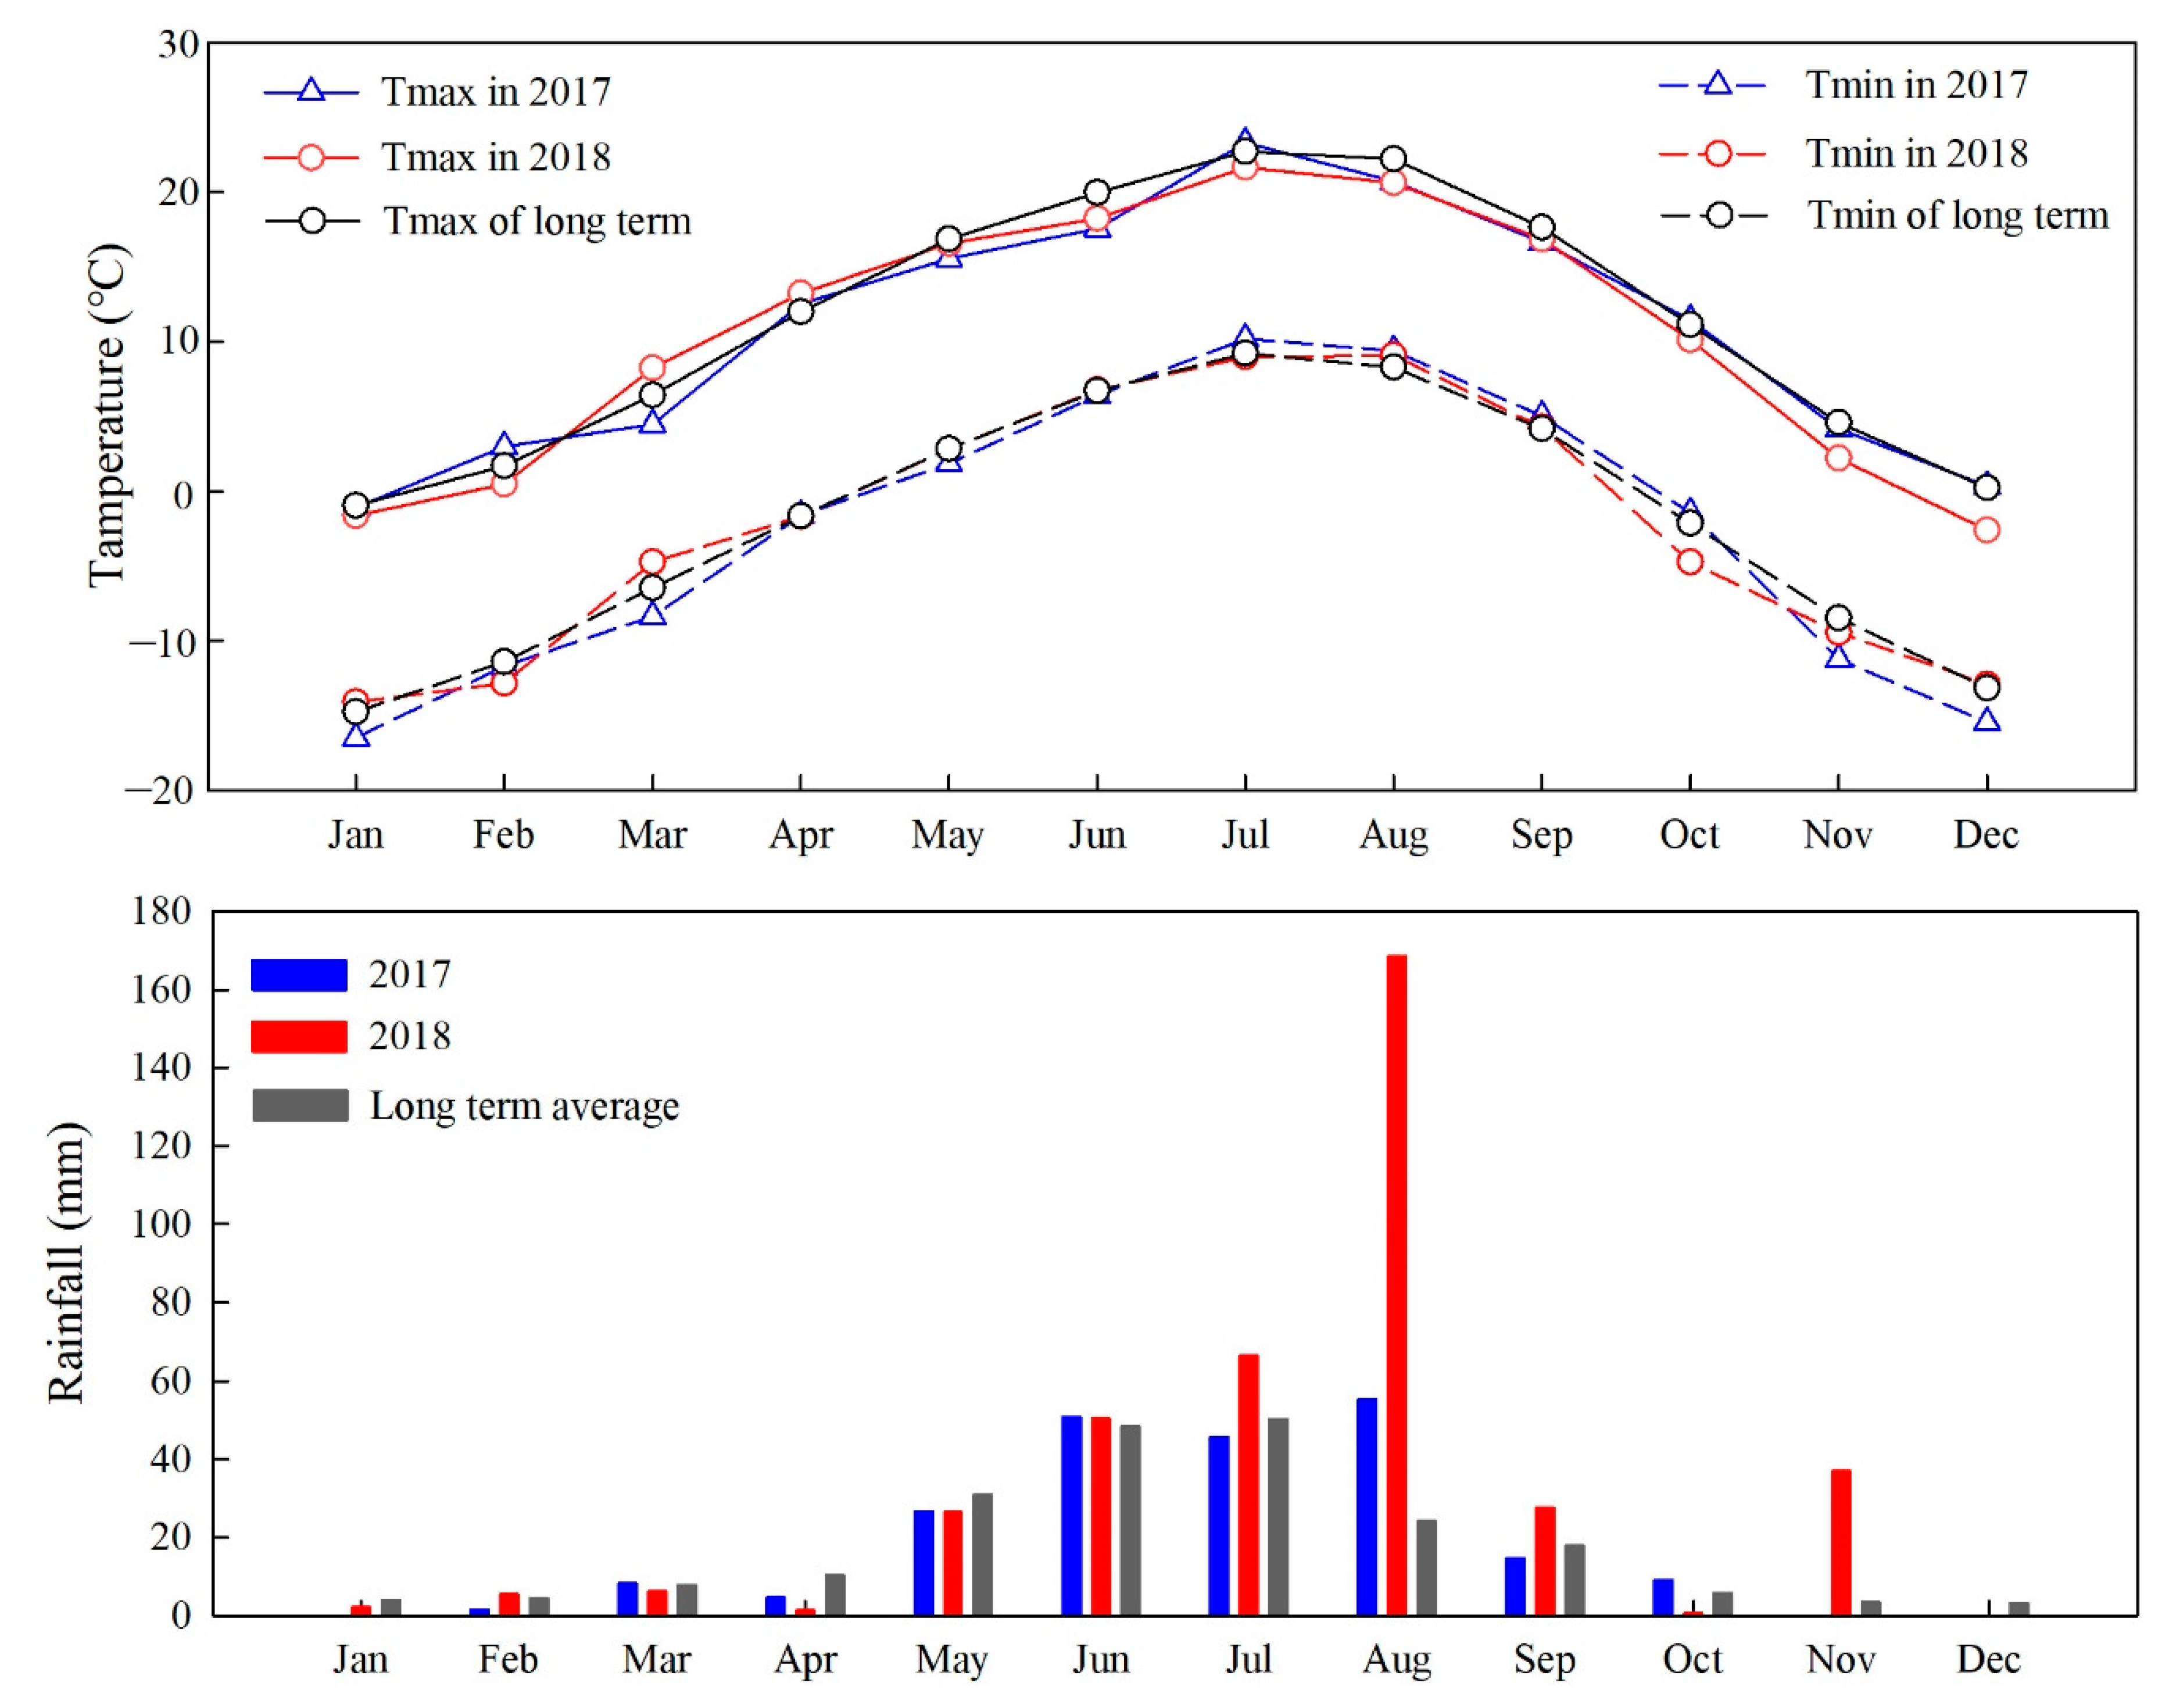
2.1. Experimental Site

We conducted the field experiment at the Jintai farm in Qinghai Province. The farm is located in the northeast of the Tibetan Plateau (36°47′ N, 99°05′ E). The site has a semi-arid climate with long-term annual average temperatures of 3.79 °C, and total yearly precipitation of 211 mm [26]. Winter in the region is long (approximately seven months) and cold, and the crop growing season is short (approximately five months). During the oat growing season, the amount of rainfall was 128.7 and 233.0 mm in 2017 (13 April–25 August) and 2018 (18 June–25 September), respectively. Monthly rainfall in both experimental years is shown in Figure 1.
Soil at the site has distinct layers. The surface (0–40 cm) layer has a lower sand content with a high nutrient content and high water capacity. Soil texture in the surface layer and the layer below (40–100 cm) are silty loam and sandy loam, respectively. Soil organic matter, soil available N ( N H 4 + N + N O 3 N ), bulk density, field water capacity, and crop low water limit in the 0–100 cm soil layers are listed in Table 1.

2.2. Experimental Design and Field Management

The field experiment followed a randomized complete block design with three replications. High and low N application rates of 120 and 60 kg ha−1, respectively, were tested in 2017 under rainfed conditions. In 2018, four irrigation treatments were applied under each N rate, so eight water and N interaction treatments were tested. The irrigation treatments were: 50 mm water was irrigated at the oat flowering stage (I1), 50 mm water was irrigated at the oat tillering and jointing stages (I2, 100 mm in total), 50 mm water was irrigated at the oat tillering, jointing, and flowering stages (I3, 150 mm in total), and no irrigation (NI). Flood irrigation method was used. Supplementary irrigation was applied at scheduled dates for the irrigated treatments. Oat seeds were manually planted on 18 June 2017 and on 13 May 2018. Each plot area was 6 m × 20 m. “Qingyin 2”, a local forage oat variety, was used. It was seeded at a density of 180 kg ha−1. Crop rows were west–east directed with a distance of 30 cm. Oat forage yield was harvested on 20 September 2017 and 25 August 2018. Plants in all treatments were harvested on the same day, since increased nitrogen fertilization and irrigation showed little effect on plant phenology. All the phosphorus (103 kg P2O5 ha−1) and half the total amount of N fertilizer were applied before oat seeding. The rest of the N fertilizer was applied during oat jointing.

2.3. Measurements and Calculations

2.3.1. Phenology Stages and Dry Matter Yield

Oat phenology stages were recorded at sowing, germination, emergence, end of juvenile stage, floral initiation, flowering, start of grain filling, and harvest [27]. The phenological development was observed in each plot at three-day intervals to determine when more than half of the plants reached each phenology stage. The aboveground dry matter yield of oat was sampled at 10–20 day intervals during the growing season. All plants in two adjacent 50 cm long rows were cut for each sample, and three samples were taken from each plot. The sampled plants were oven-dried at 65 °C to a constant weight to determine the dry matter.

2.3.2. Soil Water Content

The soil was sampled with an augur approximately every 20 days. Seven samples at different depths (every 10 cm in 0–40 cm depths, and every 20 cm in 40–100 cm depths) were taken from each hole. Soil samples were oven-dried at 105 °C for eight hours. Soil volumetric water content was calculated as the product of gravimetric water content and bulk density.

2.3.3. Water Use and WUE

Water use of oat (WU, mm) was determined by analyzing seasonal soil water balance in the 0–100 cm soil layer. Soil water percolation throughout the 100 cm depth and capillary rise of deep water into the evaluated soil layer were all neglected. The water balance equation was thus simplified to [28]:
WU = P + I + Δ S
where P is total precipitation in the oat growing season (mm); I is total irrigation in the oat growing season (mm); and ΔS is the decrease in soil water storage from oat sowing to oat harvesting (mm). WUE (kg ha−1 mm−1) was calculated as the ratio of aboveground dry matter yield (DM, kg ha−1) and WU:
WUE = DM / WU

2.3.4. Nitrogen Use Efficiency

Similar to the internal nitrogen use efficiency (NUE, kg kg−1) for grain crops, the internal NUE of forage oat was defined as [6]:
NUE = DM / N   uptake

2.4. APSIM Parameterization and Validation

APSIM is a process-based model in which several submodules work together to simulate agricultural resource transportation and conversion processes and crop growth dynamics. It was previously used to optimize oat sowing date in a semi-arid environment [23], but no study had applied it to optimize water and N management in oat production. The submodule SOIL simulates soil water, carbon and N dynamics, the management folder defines the field management measures, and the crop module APSIM-oat simulates oat growth development and production [29]. The main soil parameters such as soil bulk density, drained upper limit (DUL), low limit for oat growth (LL), and initial soil water, carbon, and N contents were determined by field measurements. Potential evapotranspiration (ET0) was calculated with the Priestley–Taylor equation [30]. Soil evaporation (Es) was calculated using Ritchie’s evaporation model [31]. Es dynamics were determined by weather conditions and two key parameters U and CONA. U is the cumulative evaporation in the first stage of evaporation, while CONA is a decay coefficient of evaporation in the second stage; suggested values from the FAO56 paper were used [32]. In this study, oat was harvested as forage hay. It was reported for seen stages. The duration of each stage was presented as thermal time in the model file. The model calculates daily biomass accumulation according to the amount of radiation interception, oat radiation use efficiency at given stage, and stress factors [23].
During model calibration, we first adjusted the oat cultivar coefficients affecting crop phenology stages, then adjusted the coefficients affecting biomass accumulation. The coefficients were adjusted one by one with the trial-and-error method [33]. The model was calibrated using data on crop phenological events, dry matter, N uptake, and soil water content measured in 2017, and data of the four irrigation treatments under low N application in 2018. We adjusted the coefficients to endow the simulated values with minimum errors; the adjusted values of key coefficients of local oat variety “Qingyin 2” are shown in Table 2.
The experimental data of the four irrigation treatments under high N in 2018 were used in model validation. In both model calibration and validation, the performance of APSIM was evaluated with the indicators root mean square error (RMSE), normalized RMSE, and the index of agreement (d):
R M S E = 1 n i = 1 n S i O i 2
N R M S E = R M S E / O ¯ × 100 %
d = 1 i = 1 n S i O i 2 i = 1 n S i O ¯ + O i O ¯ 2
where Si and Oi are modeled and field observed values, respectively; O ¯ is the mean of observed values; and n is the number of evaluated data pairs. NRMSE values of >30%, 20–30%, 10–20%, and <10% indicate poor, fair, good, and excellent model performance, respectively [34]. The d value ranges between 0 and 1. The higher the d value, the better the model’s performance [35].

2.5. Scenario Analysis

Long-term weather data (1981–2010) including rainfall, minimum and maximum temperature, and sunshine hours at Chaka Station (28 km away from our experiment site) were obtained from the China Meteorological Data management system. Available online: http://data.cma.cn/data (accessed on 31 December 2020). Solar radiation was calculated from sunshine hours in weather data using the Angstrom equation [32]. Agronomic management and soil parameters were set as in the experiment, except for water and N applications. For rainfed conditions, five N scenarios were simulated, namely, 60 (N60), 90 (N90), 120 (N120), 150 (N150), and 180 (N180) kg ha−1 were applied before sowing and during jointing of oat. For irrigated conditions, N application patterns were the same as those under rainfed conditions, and five irrigation scenarios were simulated under each N rate. Thus, 25 scenarios were evaluated. According to the experiment, the optimized irrigation time was during the tillering and jointing of oat, and the quota for every irrigation level was set as 40, 50, 60, 70, and 80 mm. Therefore, the total irrigation volumes of the five scenarios were 80 (I80), 100 (I100), 120 (I120), 140 (I140), and 160 (I160) mm. For every scenario under rainfed and irrigated conditions, 30 years of simulation were run, and the initial conditions at oat sowing were reset every year.

2.6. Statistical Analysis

Statistics were conducted with the assistance of SPSS 25.0 (SPSS, Chicago, IL, USA). One-way analysis of variance (ANOVA) was applied to analyze the effects of N application under rainfed conditions on forage yield, water use, WUE, N uptake, and NUE in 2017 and 2018. Two-way ANOVA was applied to analyze the N effects, irrigation effects, and N and irrigation interaction effects on forage yield, water use, WUE, N uptake, and NUE in 2018. Multiple means were compared with Duncan’s test.

3. Results

3.1. Experiment Results

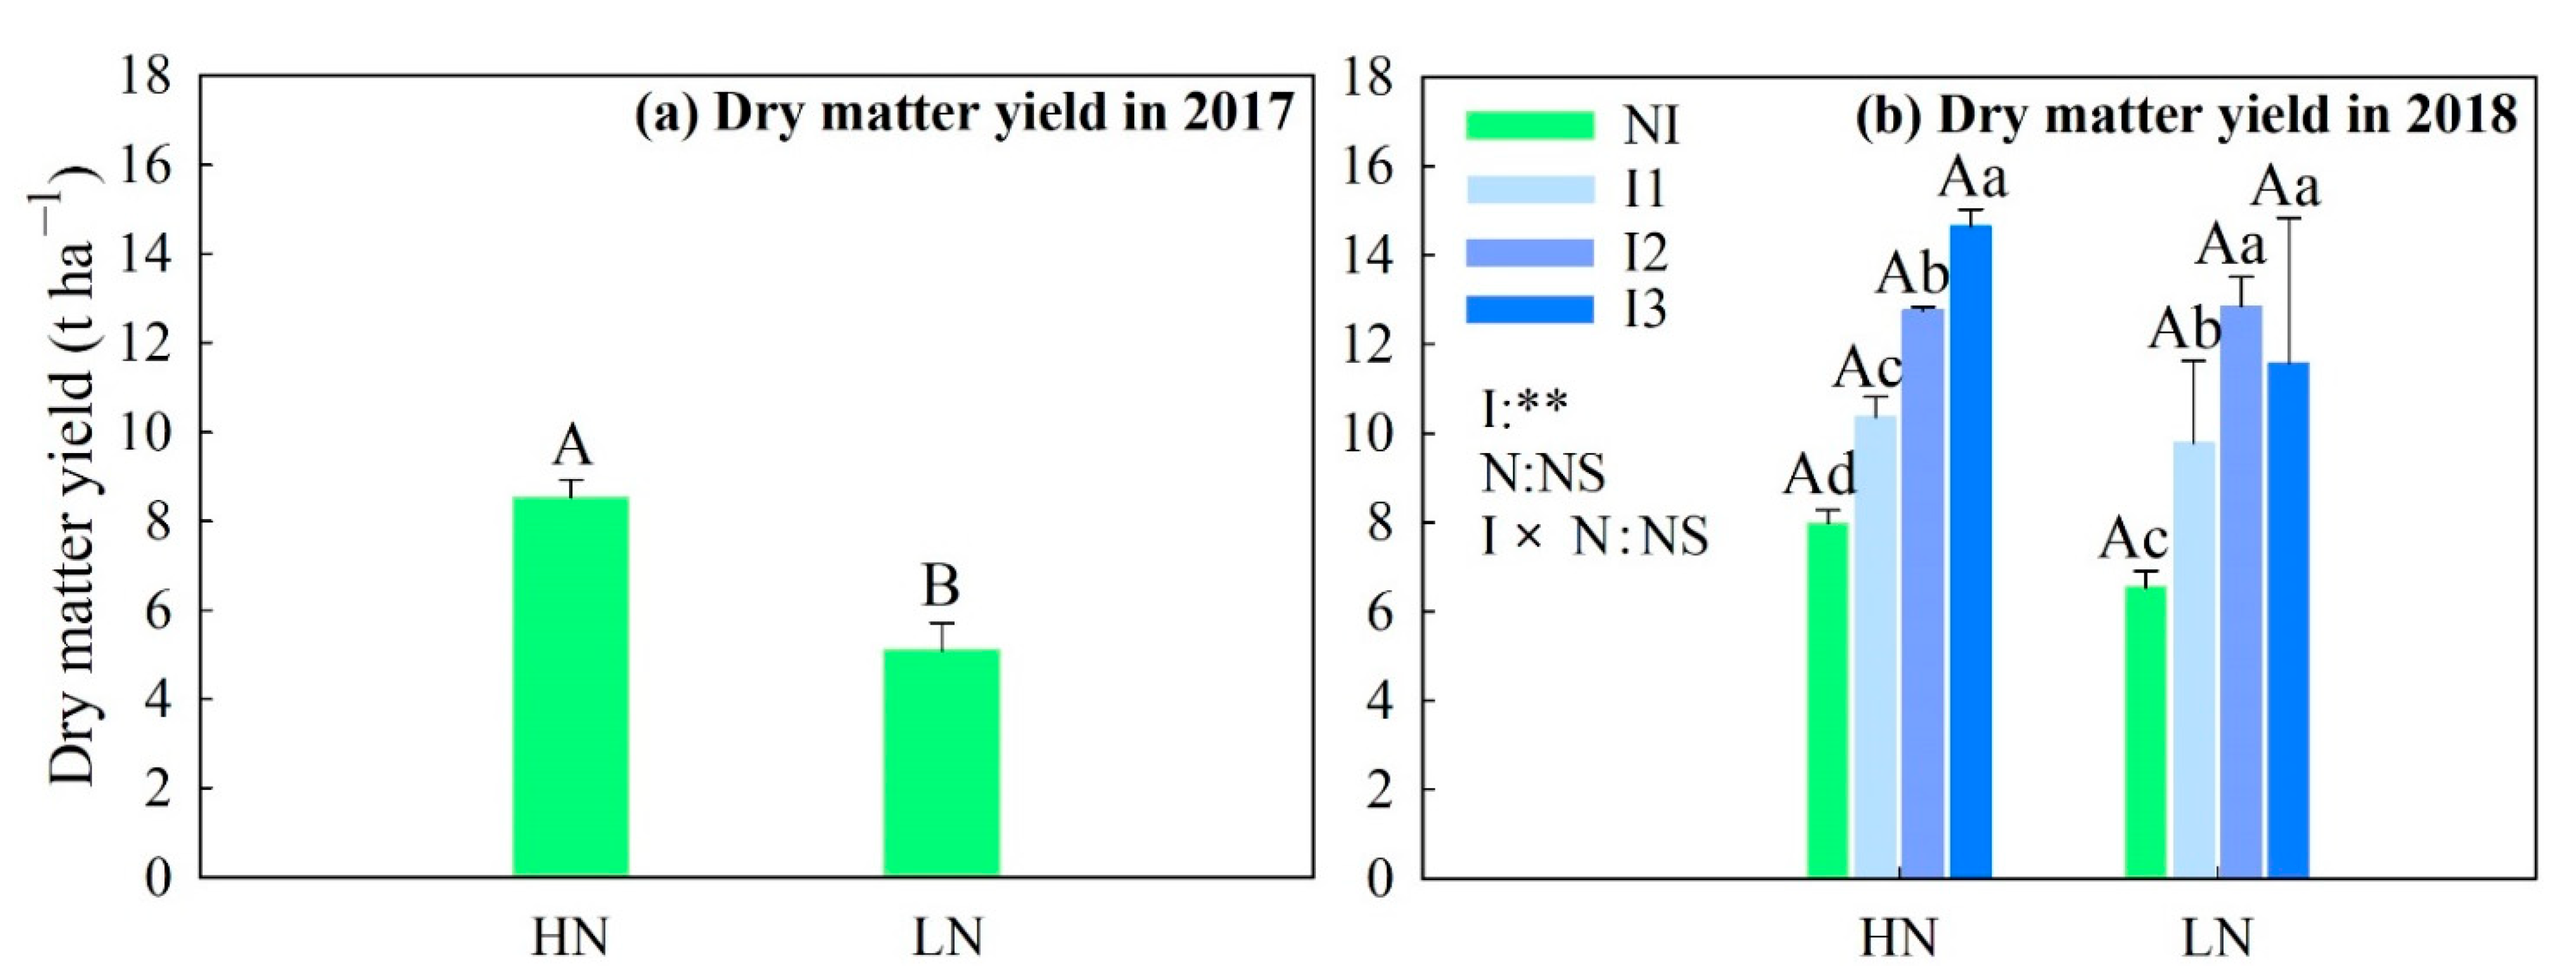
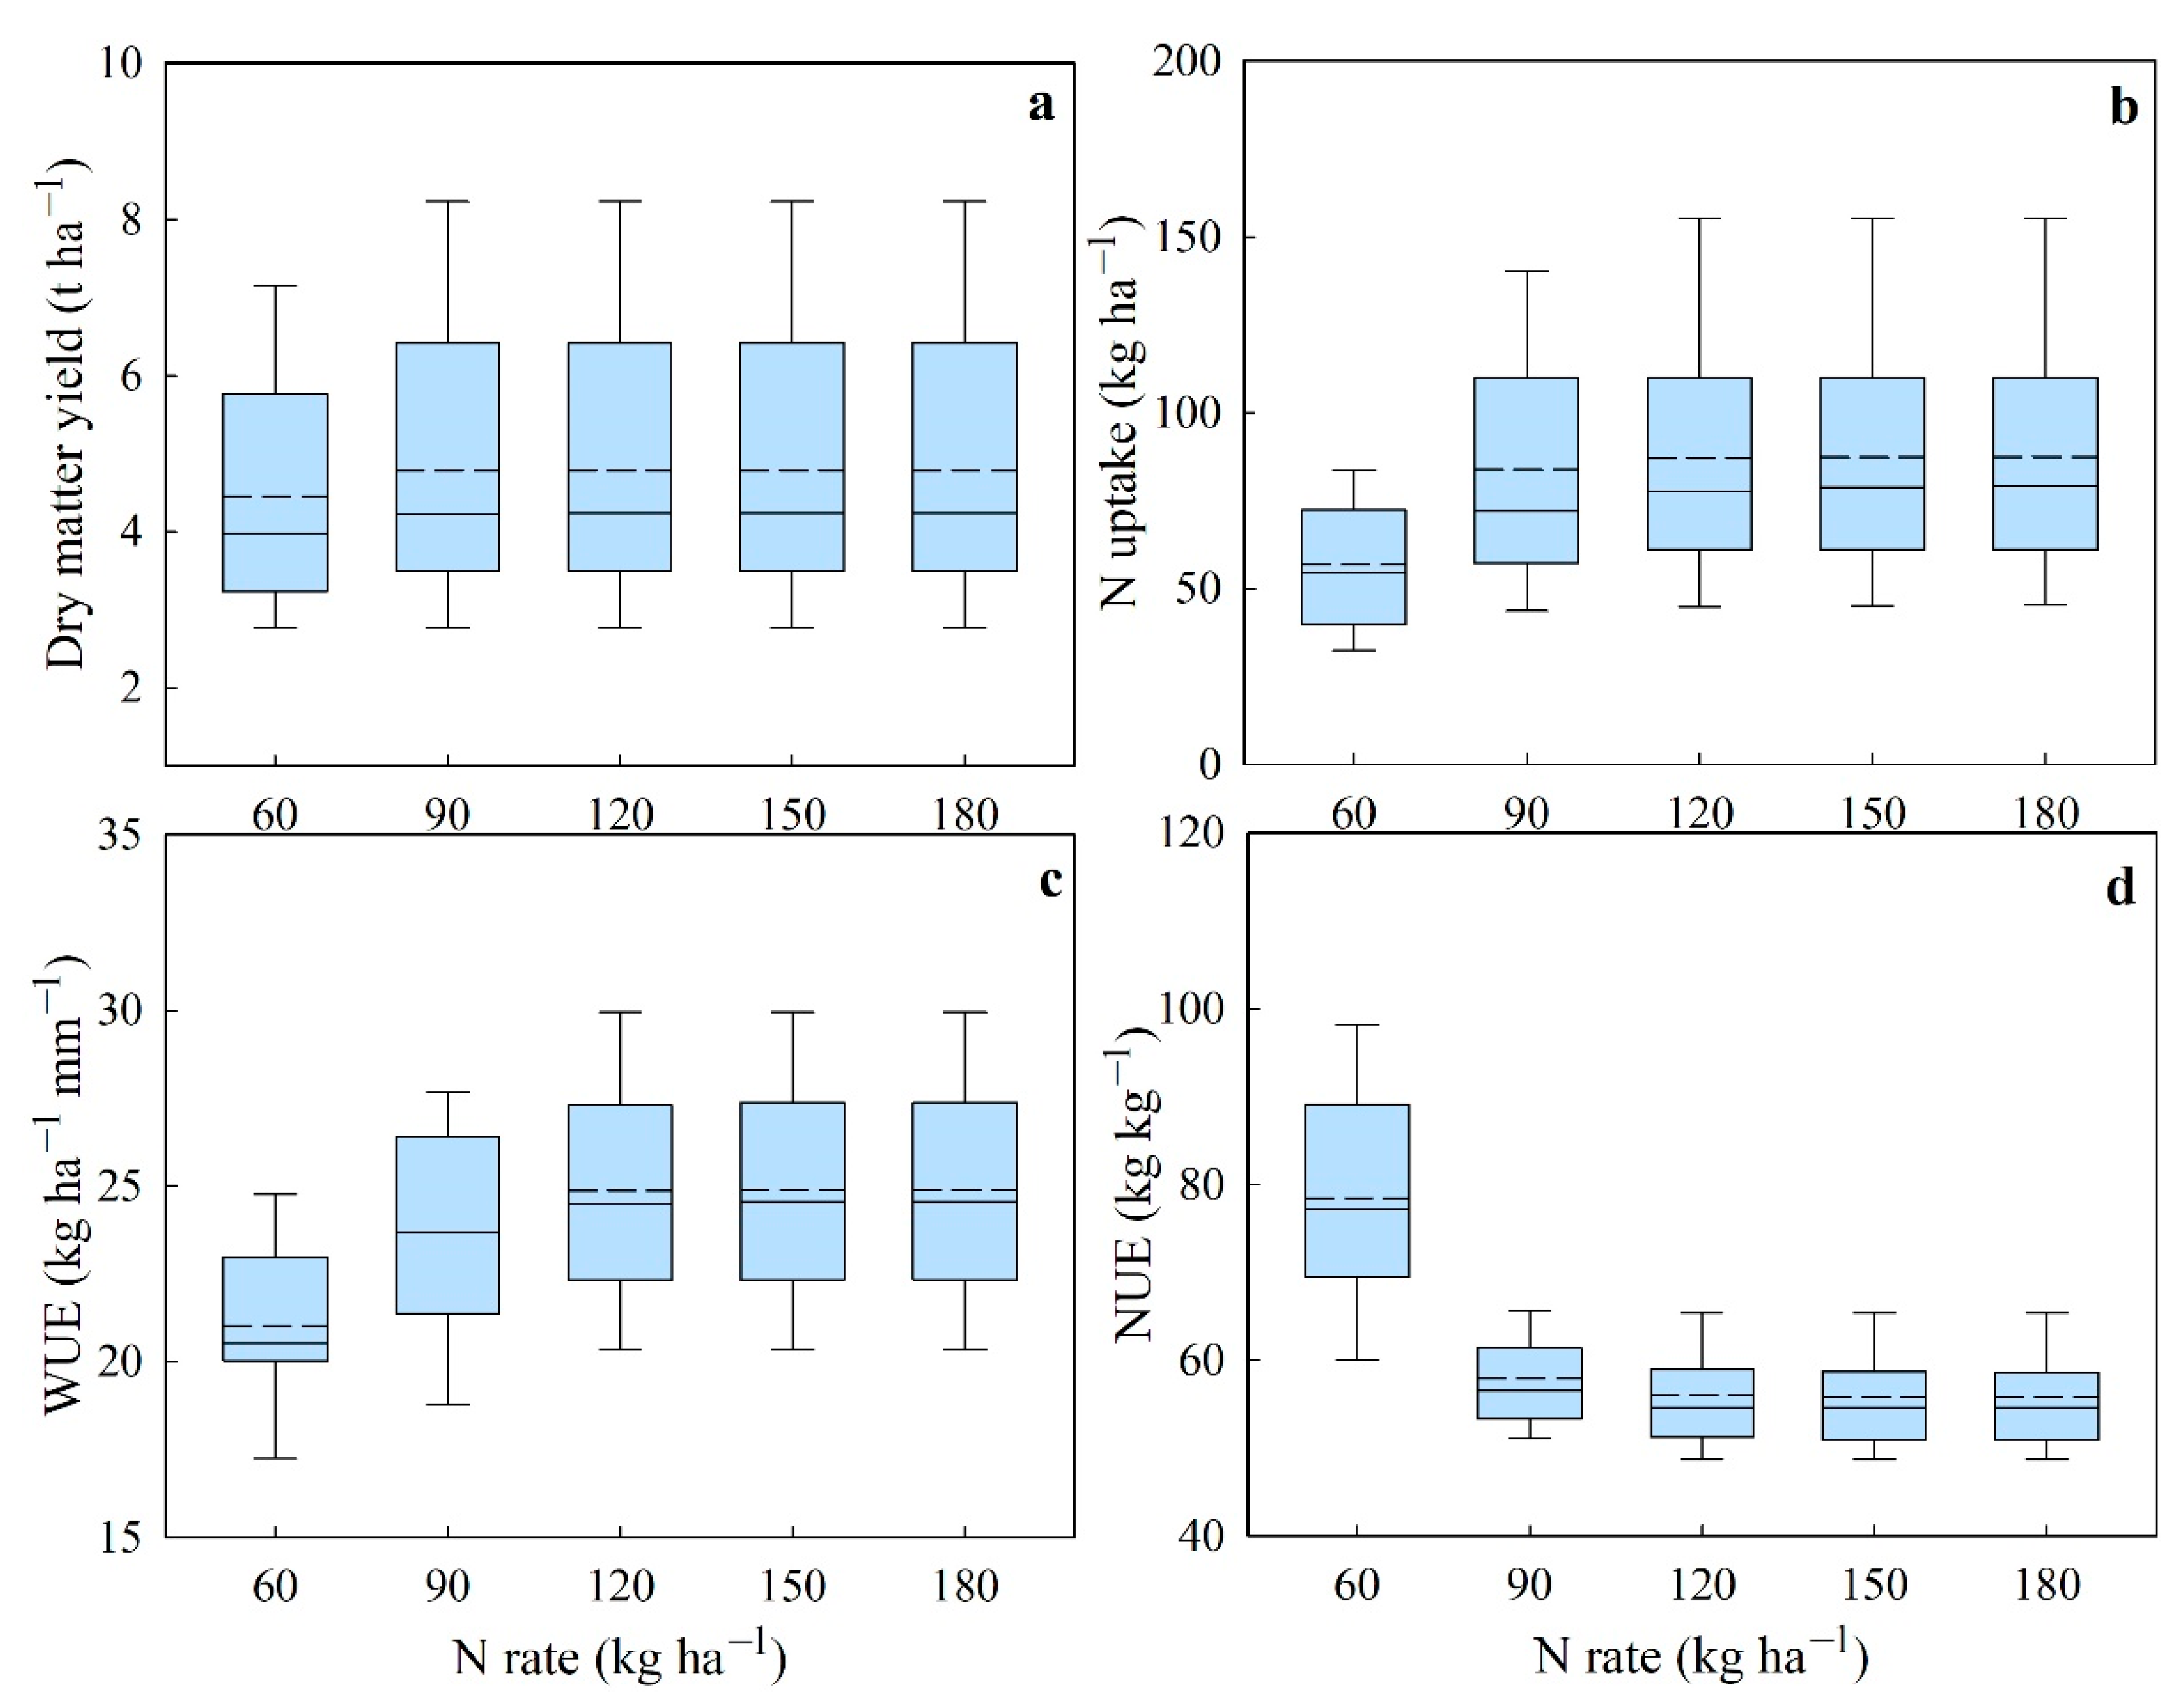
3.1.1. Oat Dry Matter Yield

Figure 2 shows the forage dry matter yield of oat in 2017 and 2018. Under the rainfed condition in 2017, oat yields under high and low N were 8.52 and 5.09 t ha−1, respectively. The yield under high N was 67.4% greater than that under low N (p < 0.01). In 2018, oat yield under high and low N were 7.98–14.64 and 6.53–12.84 t ha−1, respectively. The yield was increased by −0.7–26.5% under high N, but the effect was not statistically significant (p > 0.05). In comparison, irrigation showed significant positive effects on the dry matter yield (p < 0.01); compared with NI, the yields in I1, I2, and I3 were improved by 29.8%, 59.8%, and 83.5%, respectively, under high N, and were improved by 49.8%, 96.6%, and 77.2%, respectively, under low N. The interaction between water and N supply had an insignificant effect on the biomass yield.

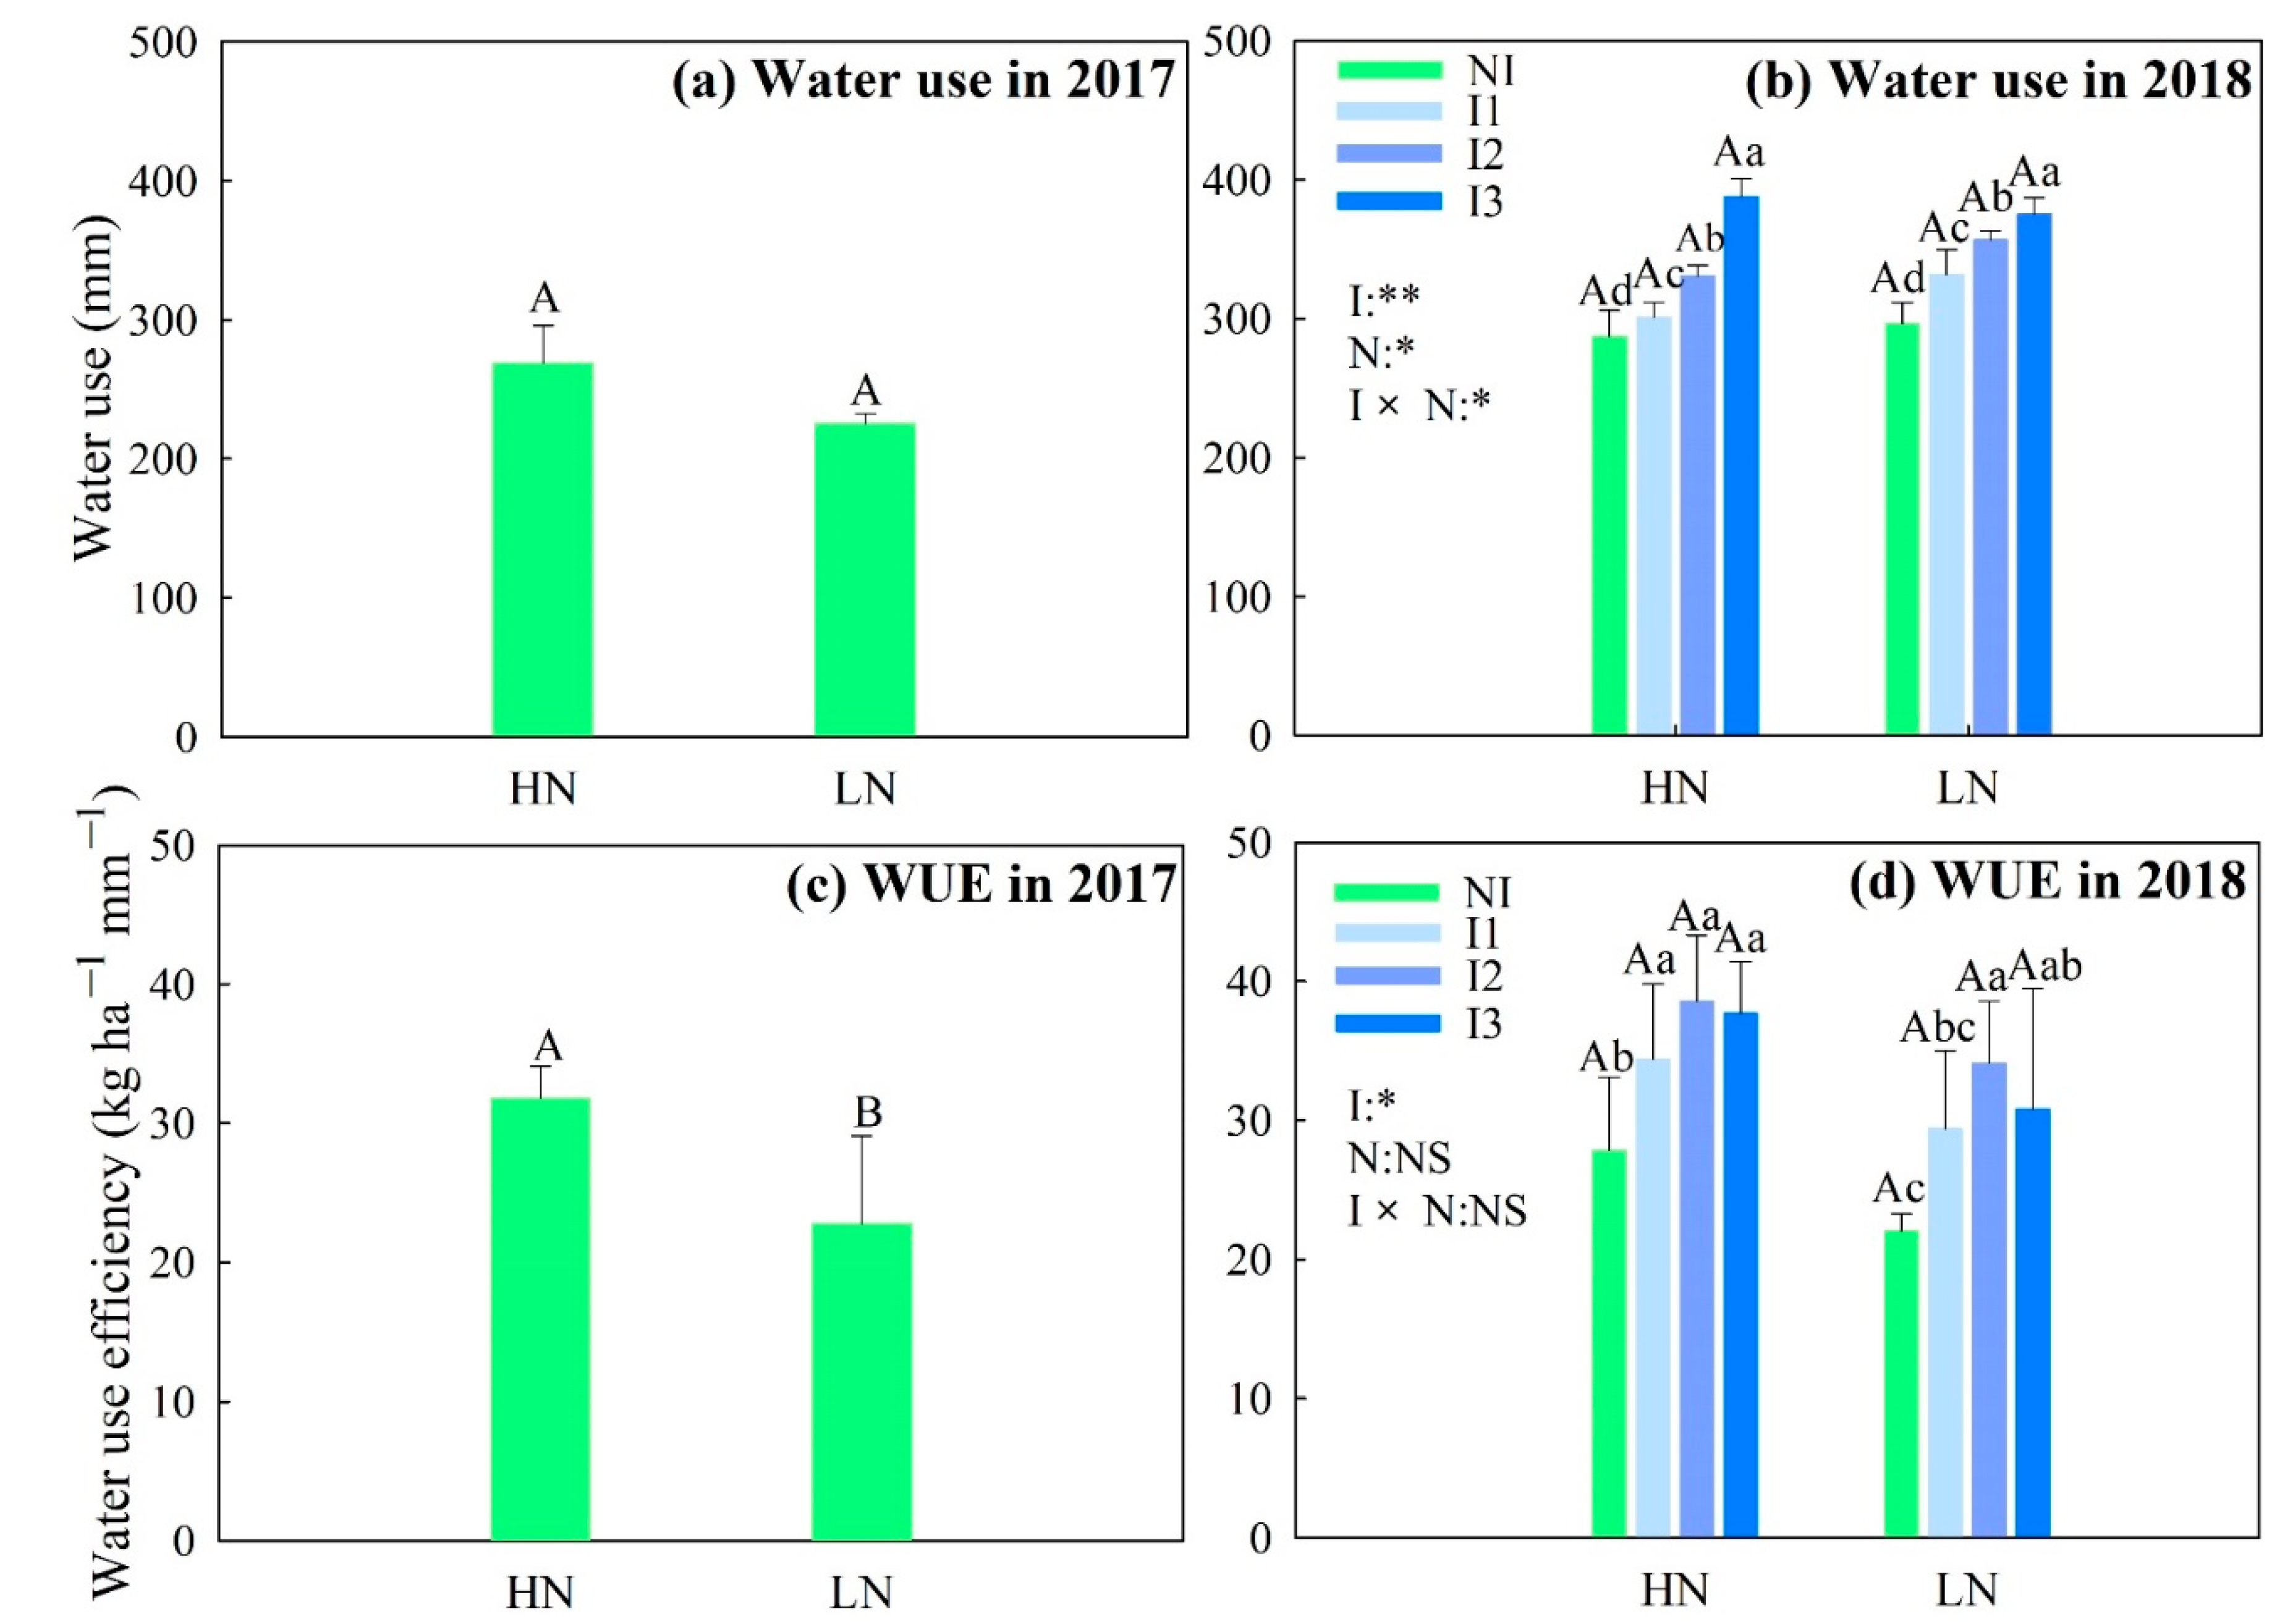
3.1.2. Water Use and WUE

Figure 3 shows water use and WUE of oat under different N and irrigation treatments. In 2017, we found an insignificant difference in water use between the two N treatments; however, the value of WUE was significantly increased under high N (p < 0.05, Figure 3a,c). In 2018, irrigation significantly increased the water use of oat, and I3 induced the highest water uses of 388.0 and 375.2 mm under high and low N treatments, respectively (Figure 2b). The increase in irrigation volume also significantly increased the WUE of oat (p < 0.05, Figure 3d). The increment was the highest in I2, which showed the highest WUE values of 38.6 and 34.1 kg ha−1 mm−1 under high and low N treatments, respectively. N application and the interaction between irrigation and N had a significant impact on the water use of oat (p < 0.05 Figure 3b); however, they had no significant effect on the WUE (Figure 3d).

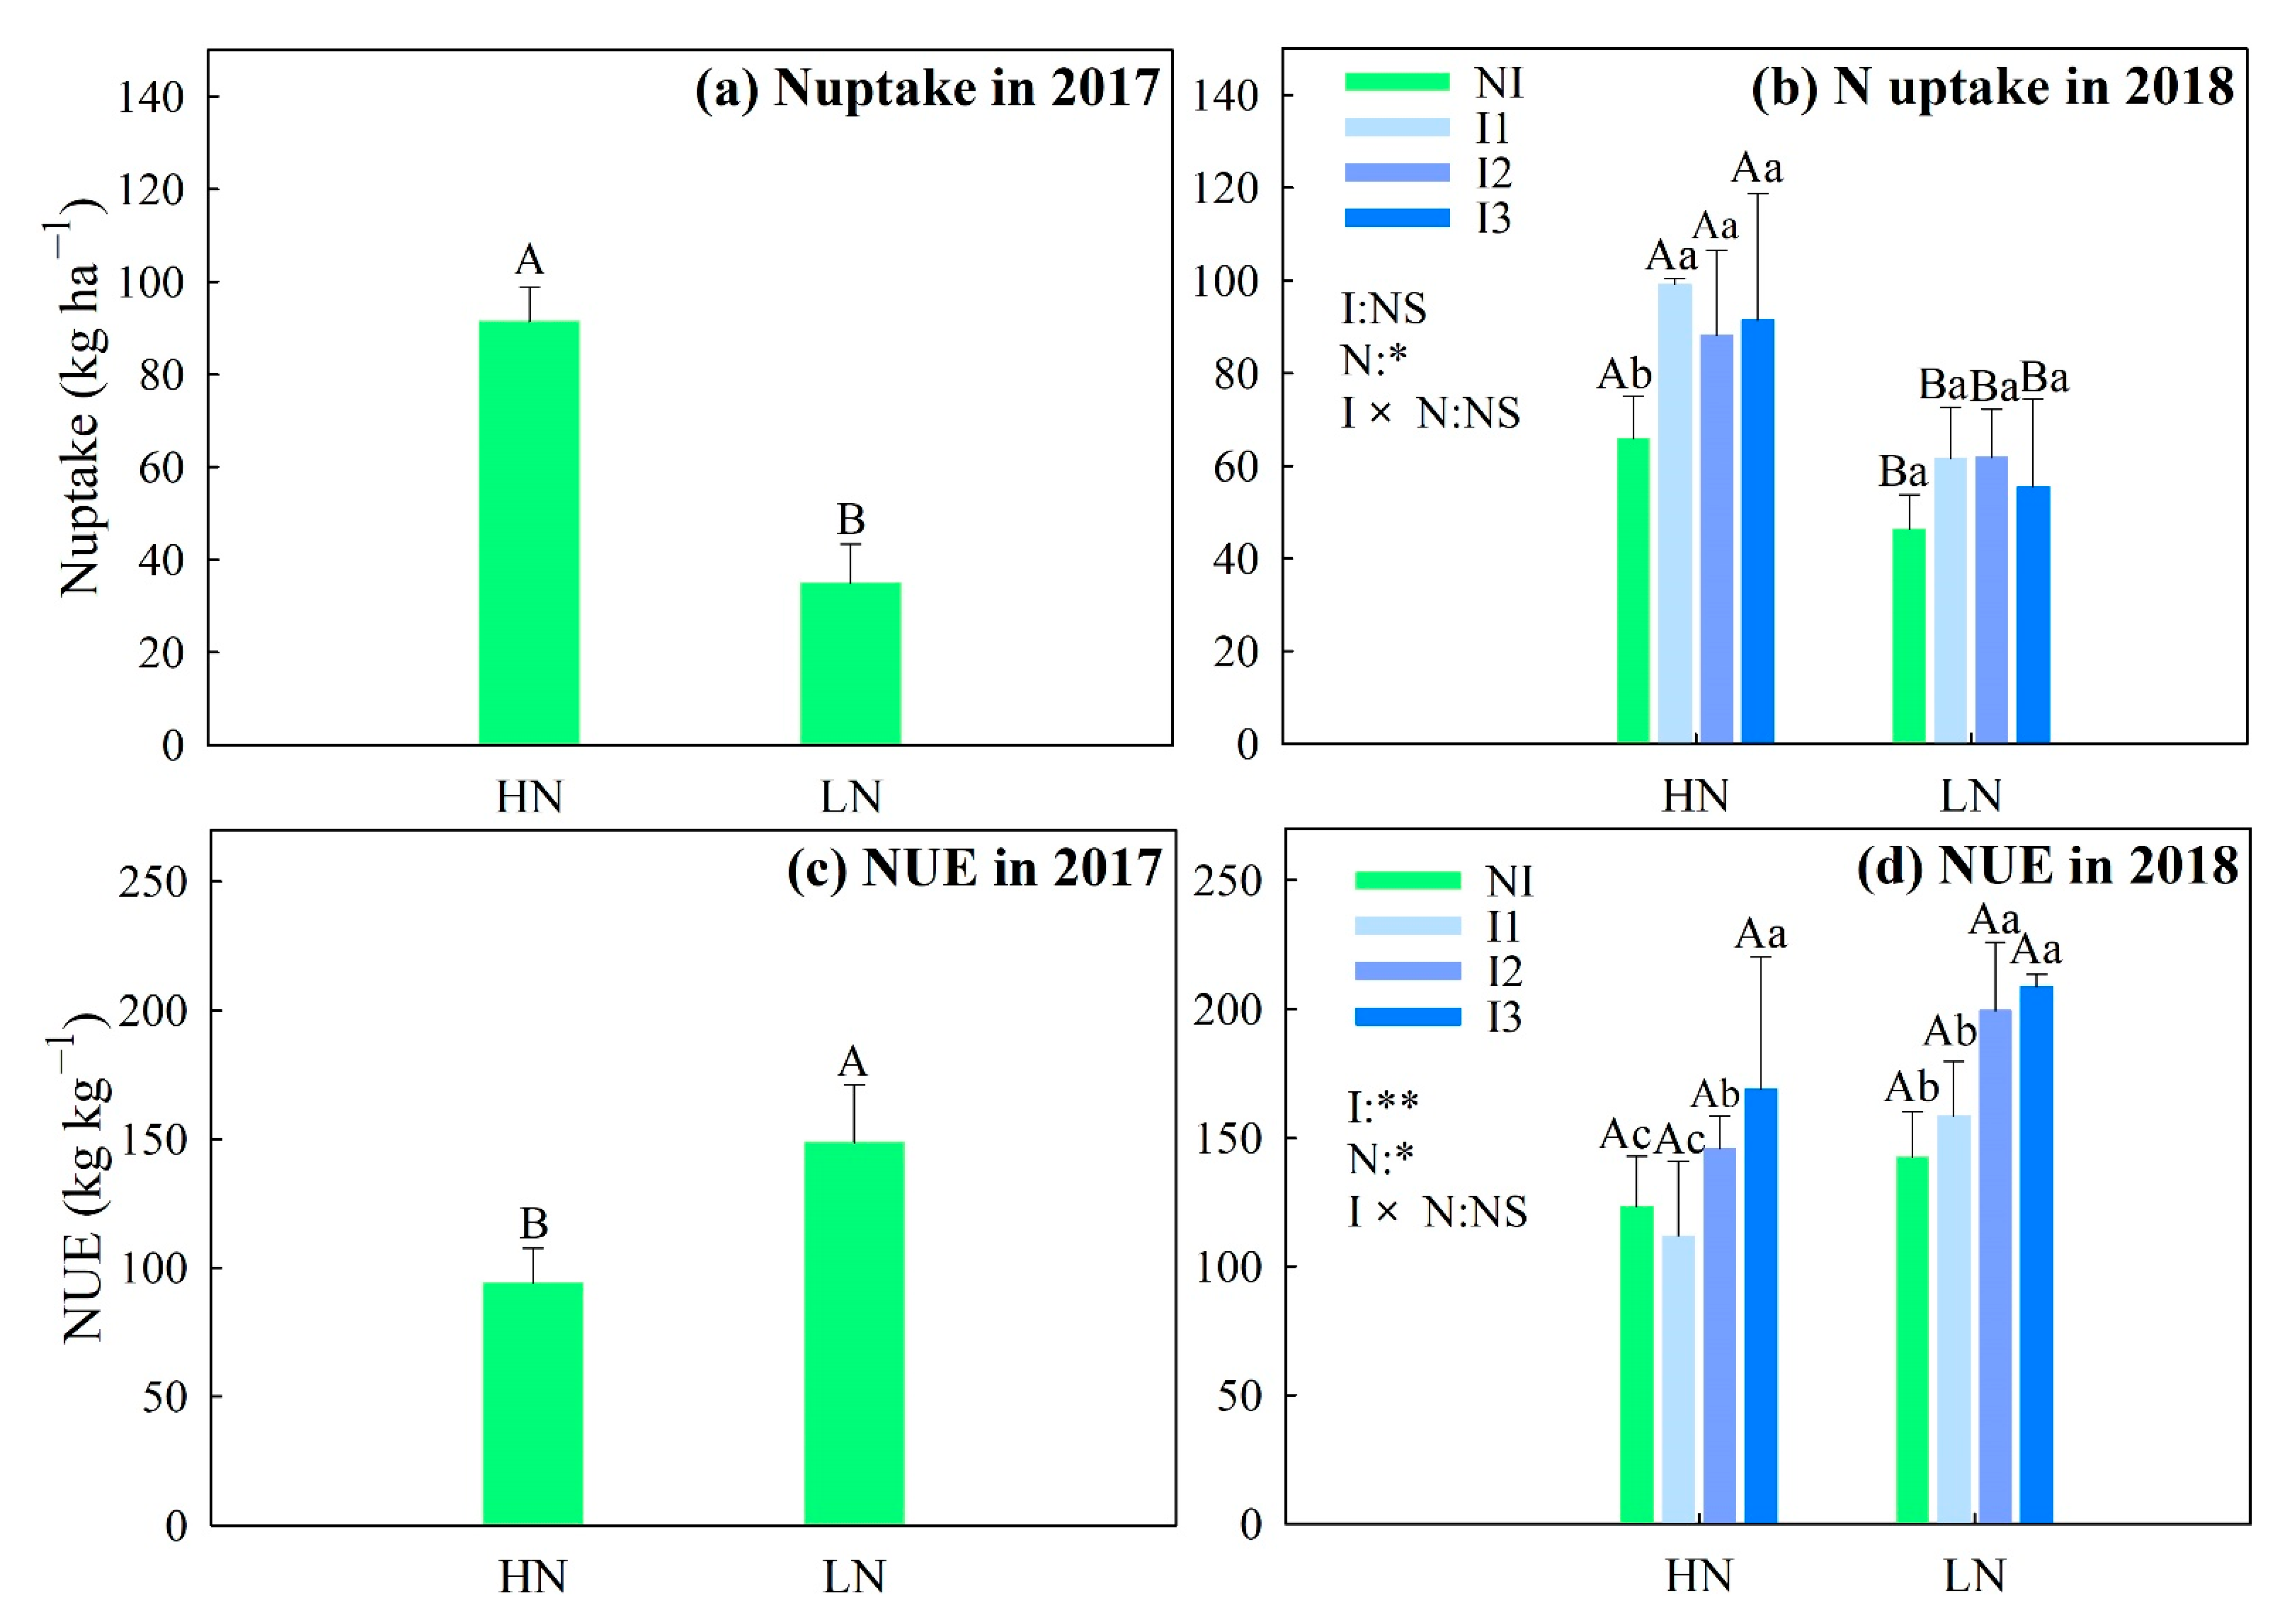
3.1.3. N Uptake and NUE

Figure 4 shows the N uptake and NUE of forage oat with different N and irrigation levels. Under the rainfed condition in 2017, the N uptake of oat under high N was 162.0% greater than that under low N (Figure 4a); however, the NUE was 58% lower than that under low N (p < 0.05, Figure 4c). In 2018, N uptake was significantly enhanced by increasing N application; it was increased by 42.0%, 61.2%, 42.6%, and 64.7% in NI, I1, I2, and I3, respectively (p < 0.05, Figure 4b), whereas the corresponding NUE was decreased by 13.4%, 29.4%, 26.8%, and 19.1% (Figure 4d). Irrigation also enhanced N uptake under high N; however, no significant difference was found among different irrigation levels under low N (Figure 4b). The NUE values of I2 and I3 were significantly higher than the NI treatment under the same N level (p < 0.05); I3 showed the highest NUE of 168.9 kg kg−1 under high N and 208.6 kg kg−1 under low N (Figure 4d). The interaction between N and irrigation had no significant effect on the N uptake and NUE.

3.2. APSIM Calibration and Validation

3.2.1. Model Calibration

Table 3 presents the comparisons of simulated versus measured phenology dates, soil water storage, dry matter yield, and N uptake of oat in model calibration. We can see that the simulated crop phenology (emergence, initial flowering, flowering, and harvest) was in good agreement with the observed values, with an RMSE of 2.75 d, NRMSE of 6.5%, and d value of 0.81. The soil water storage was accurately simulated with an RMSE of 6.9 mm, NRMSE of 3.7%, and d value of 0.98. The dynamics of the oat dry matter yield were also well described. The yield at the milk ripening stage was most accurately simulated, with an RMSE of 0.5 t ha−1, NRMSE of 5.1%, and d value of 0.99. In addition, the results showed that the model also well simulated the N uptake in both seasons, with NRMSE values of 11.0–15.4% and d values ranging from 0.87 to 0.94.

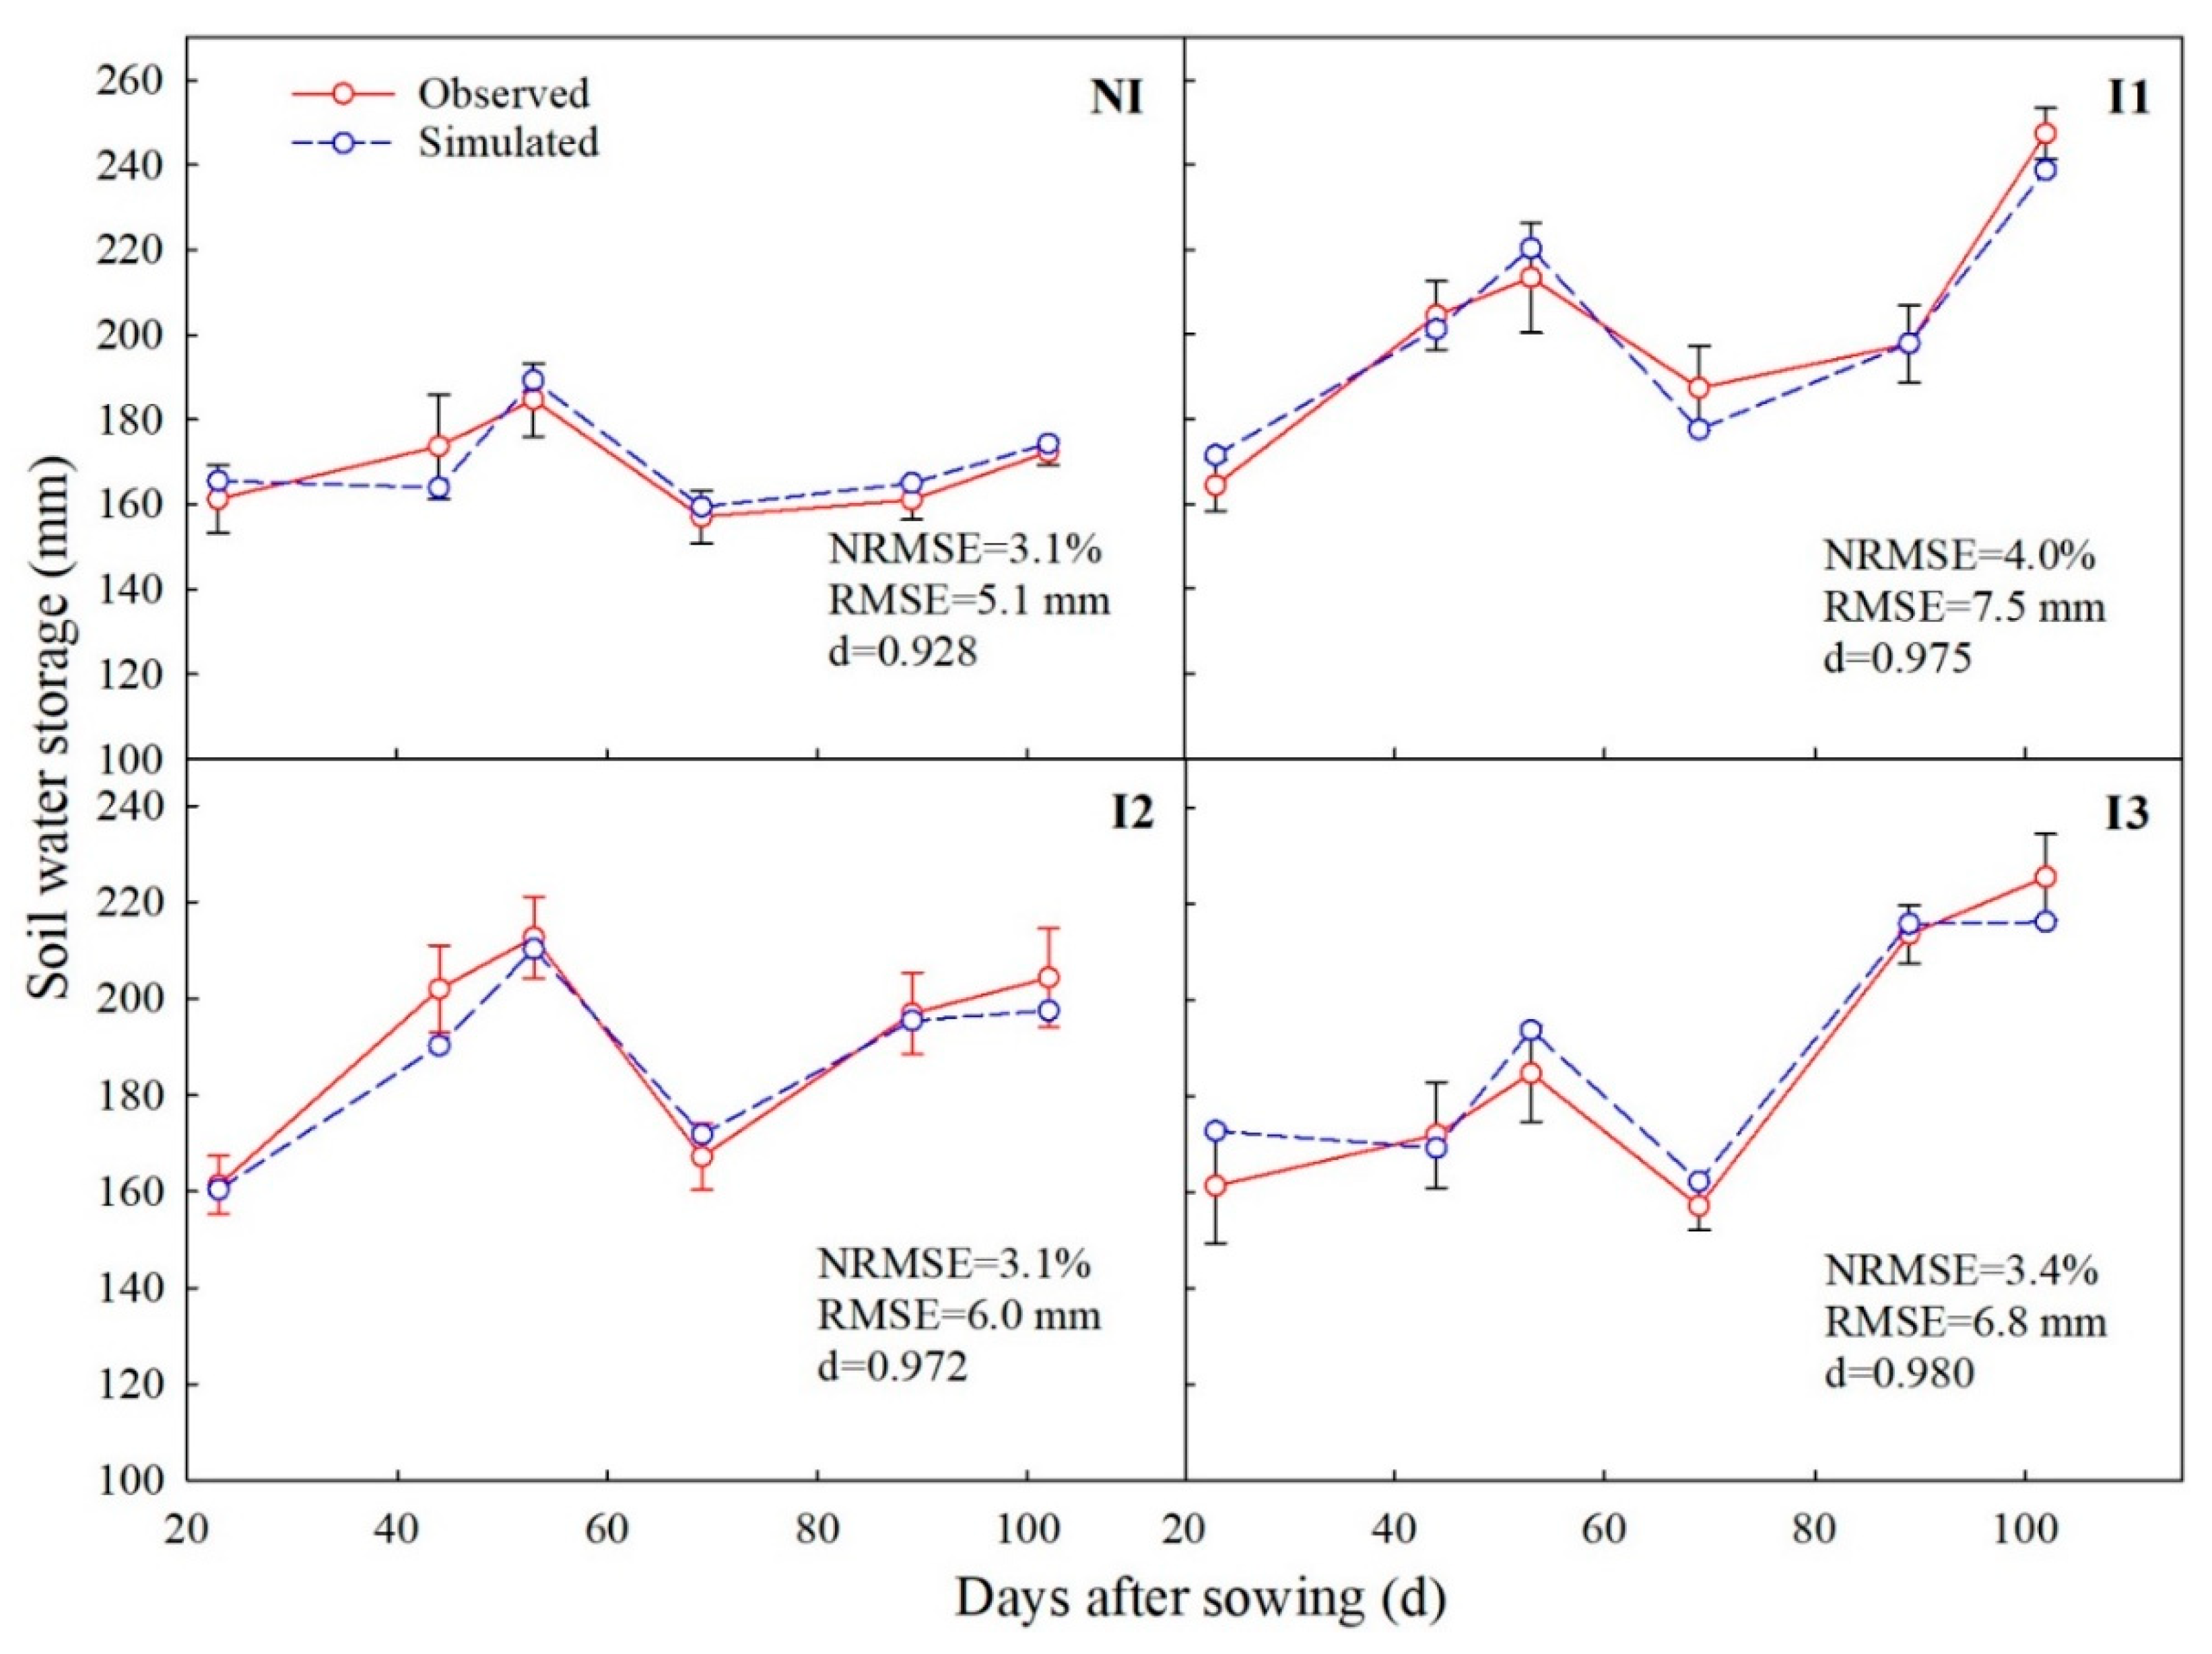
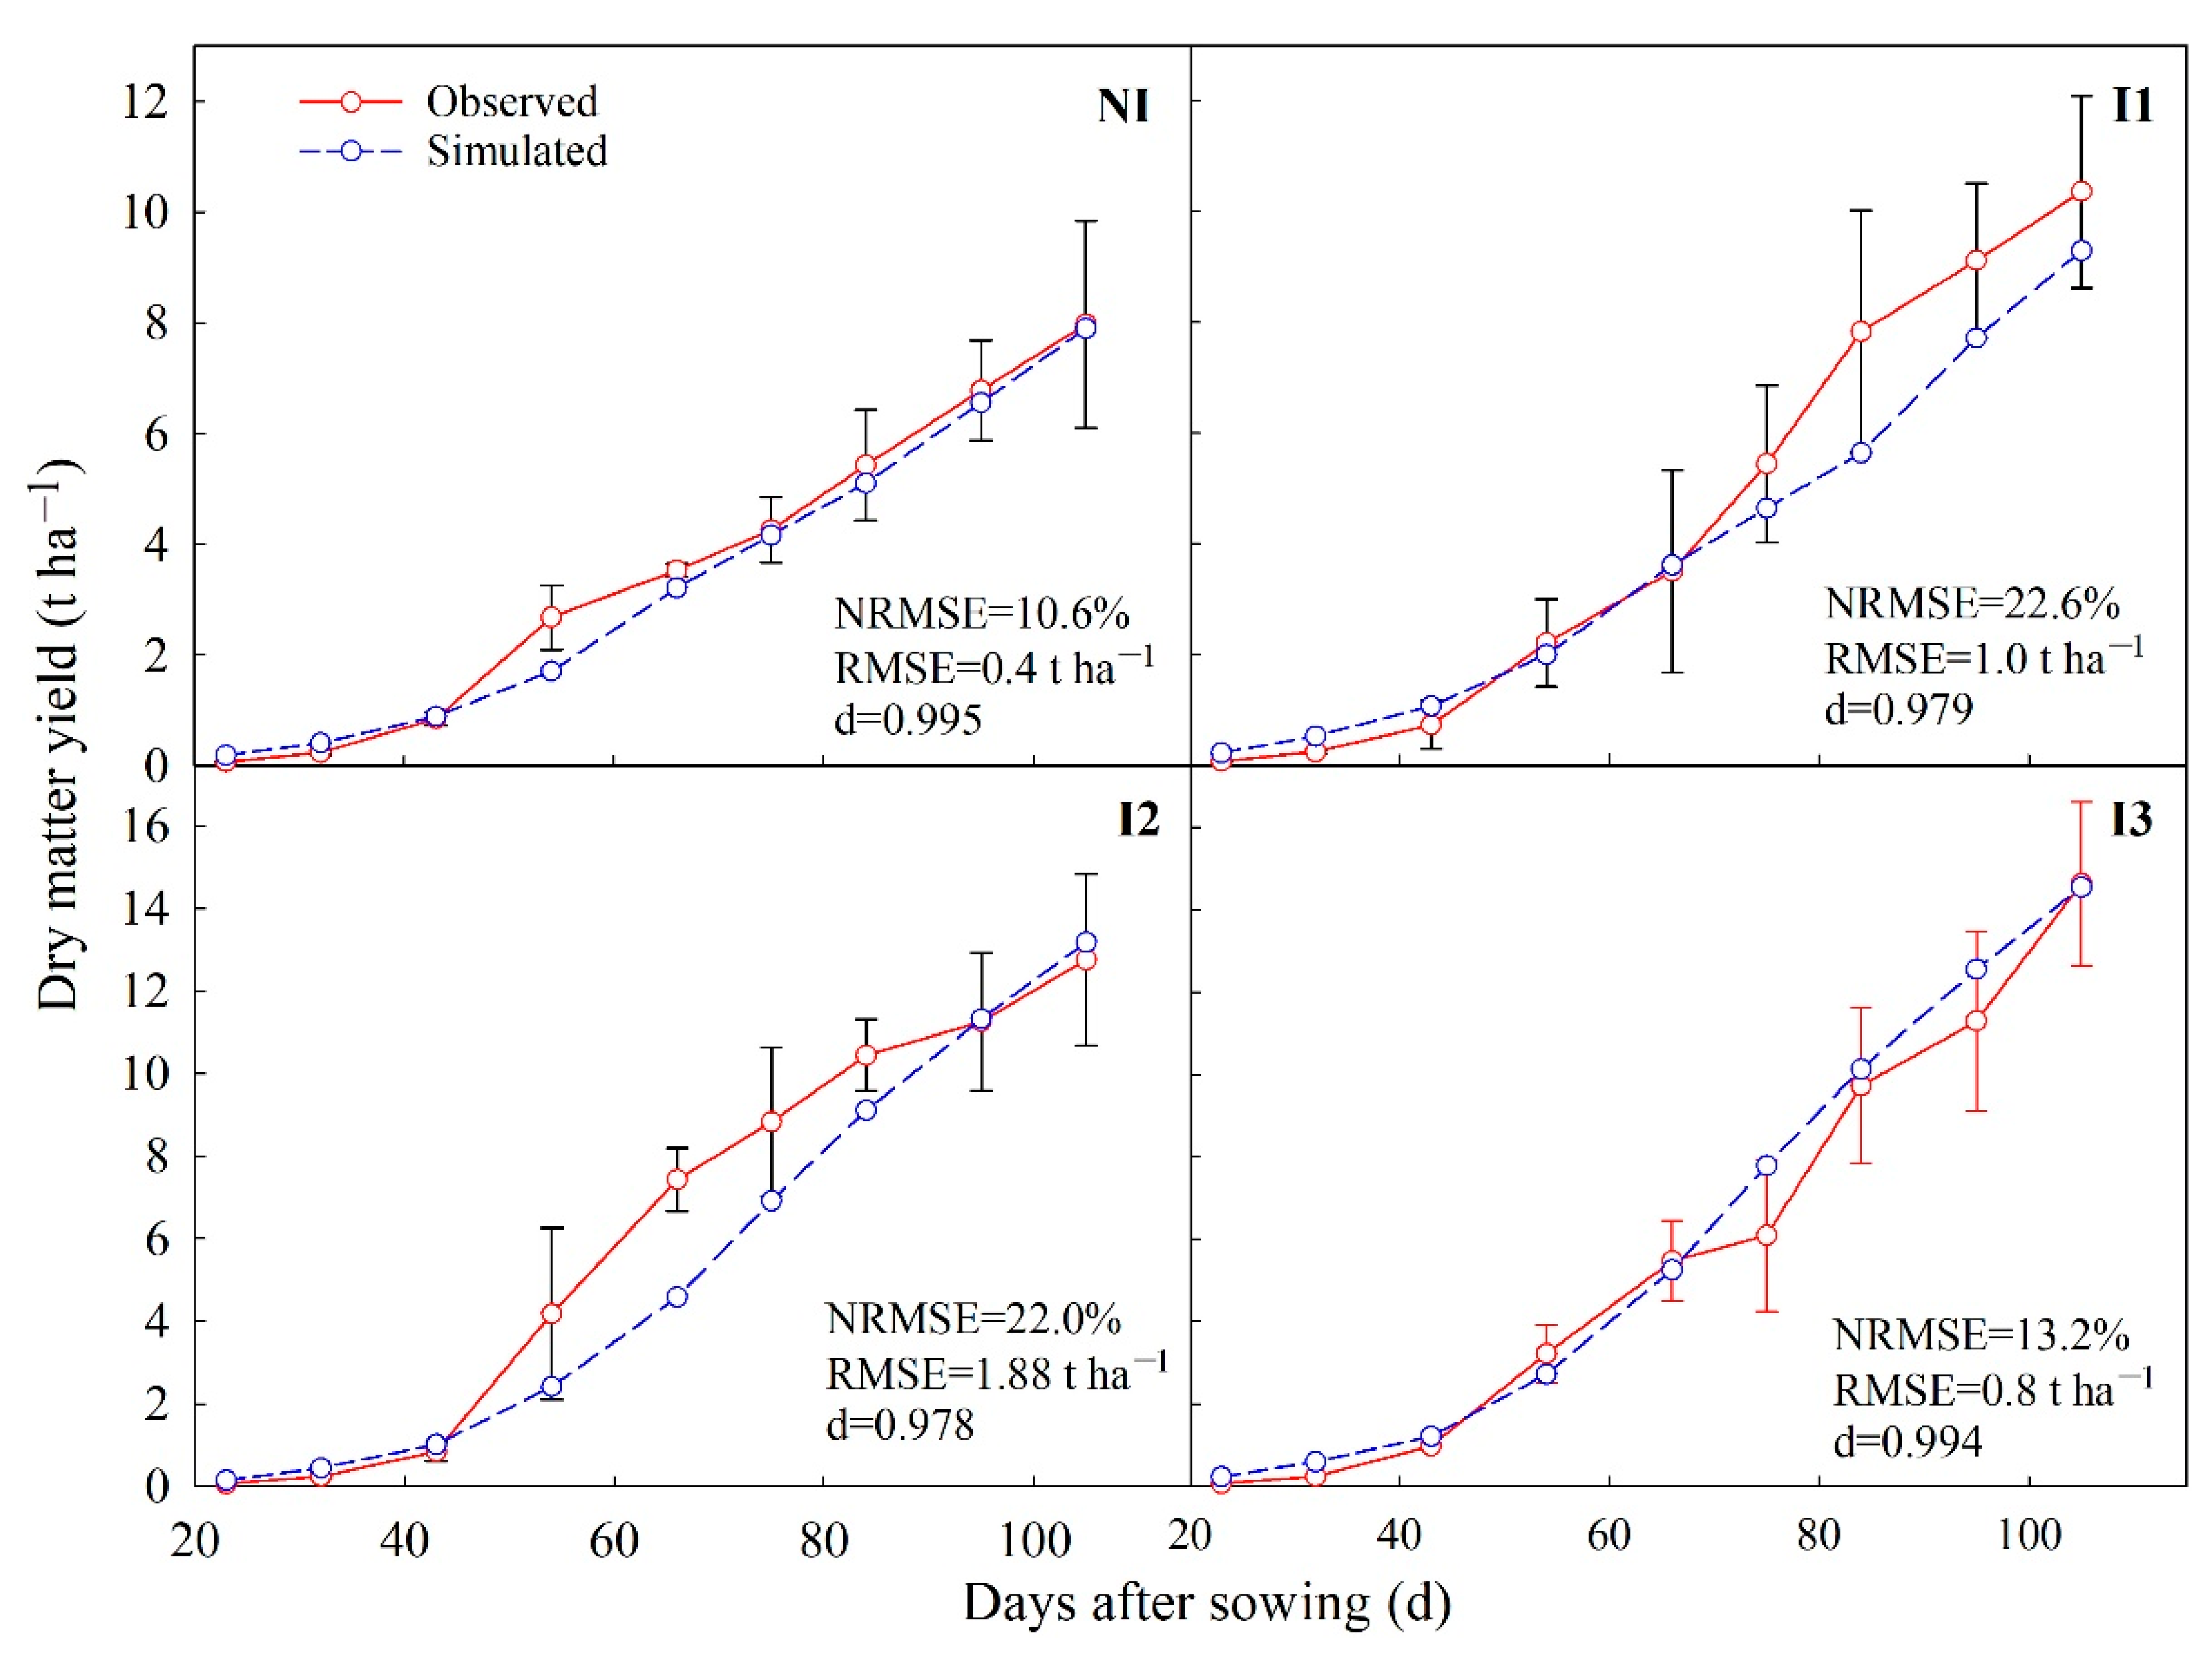
3.2.2. Model Validation

Figure 5 shows the comparison of simulated versus measured dry matter accumulation of oat in the model validation. The dynamic of dry matter accumulation under high N in 2018 was well simulated; the statistical results showed that the average NRMSE was 17.1%, the RMSE was 1.02 t ha−1, and the d value was 0.99. However, we should note that the model showed better performance under NI and I3 than under I1 and I2, as some values under I1 and I2 were largely underestimated.
Figure 6 shows the comparison of observed and simulated soil water storage in the 0–100 cm layer during model validation. Soil water storage in 2018 increased from the beginning to the end of the season under irrigated treatments (Figure 6a–c), while that under NI showed a minor variation (Figure 6d). The model accurately depicted the dynamics of soil water storage in both irrigated and non-irrigated treatments. The NRMSEs were 3.1%, 4.0%, 3.1%, and 3.4% under NI, I1, I2, and I3, respectively, the RMSEs were 5.1, 7.5, 6.0, and 6.8 mm, and the d values were 0.93, 0.98, 0.97, and 0.98.
Table 4 shows the comparison of simulated versus measured phenology and N uptake of oat in the model validation. The model performed well in depicting the dynamics of phenology under high N in 2018, with an NRMSE of 7.9%, RMSE of 2.8 d, and d value of 0.52. N uptake was also well simulated. The RMSEs were 3.2 and 2.9 kg ha−1 at flowering and ripening stages, respectively, the corresponding NRMSEs were 3.4% and 2.6%, and the d values were 0.98 and 0.93.

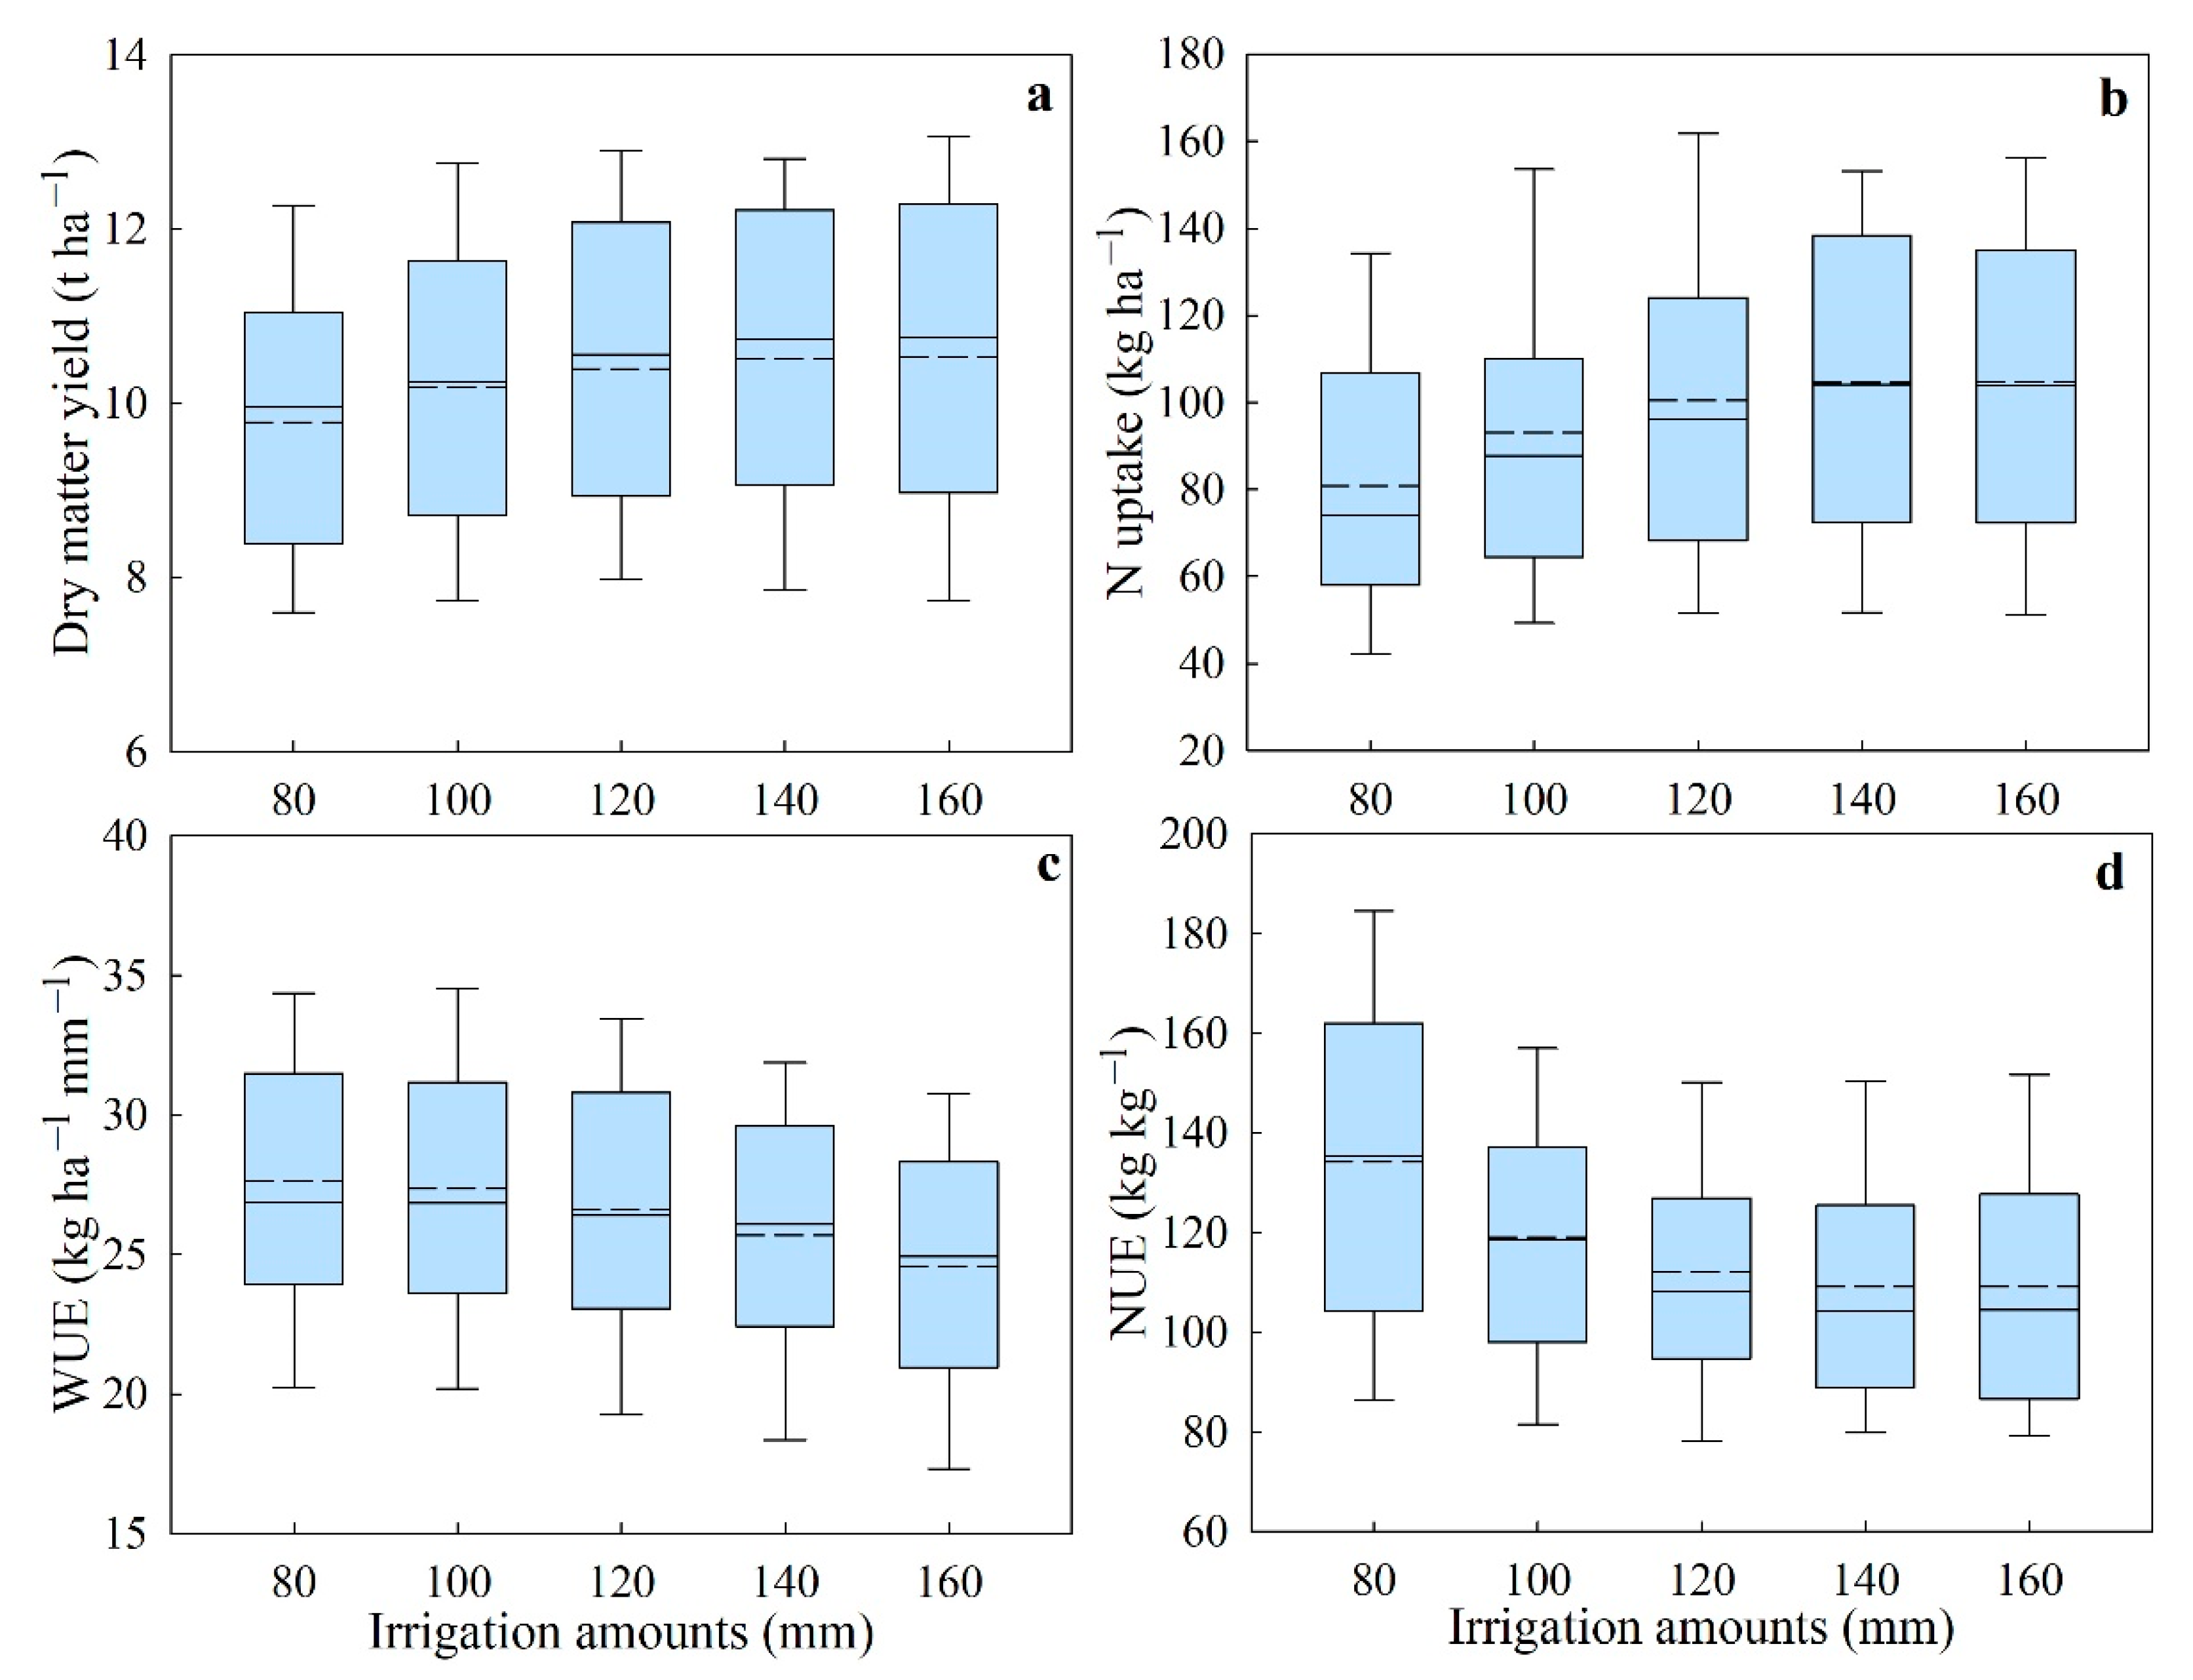
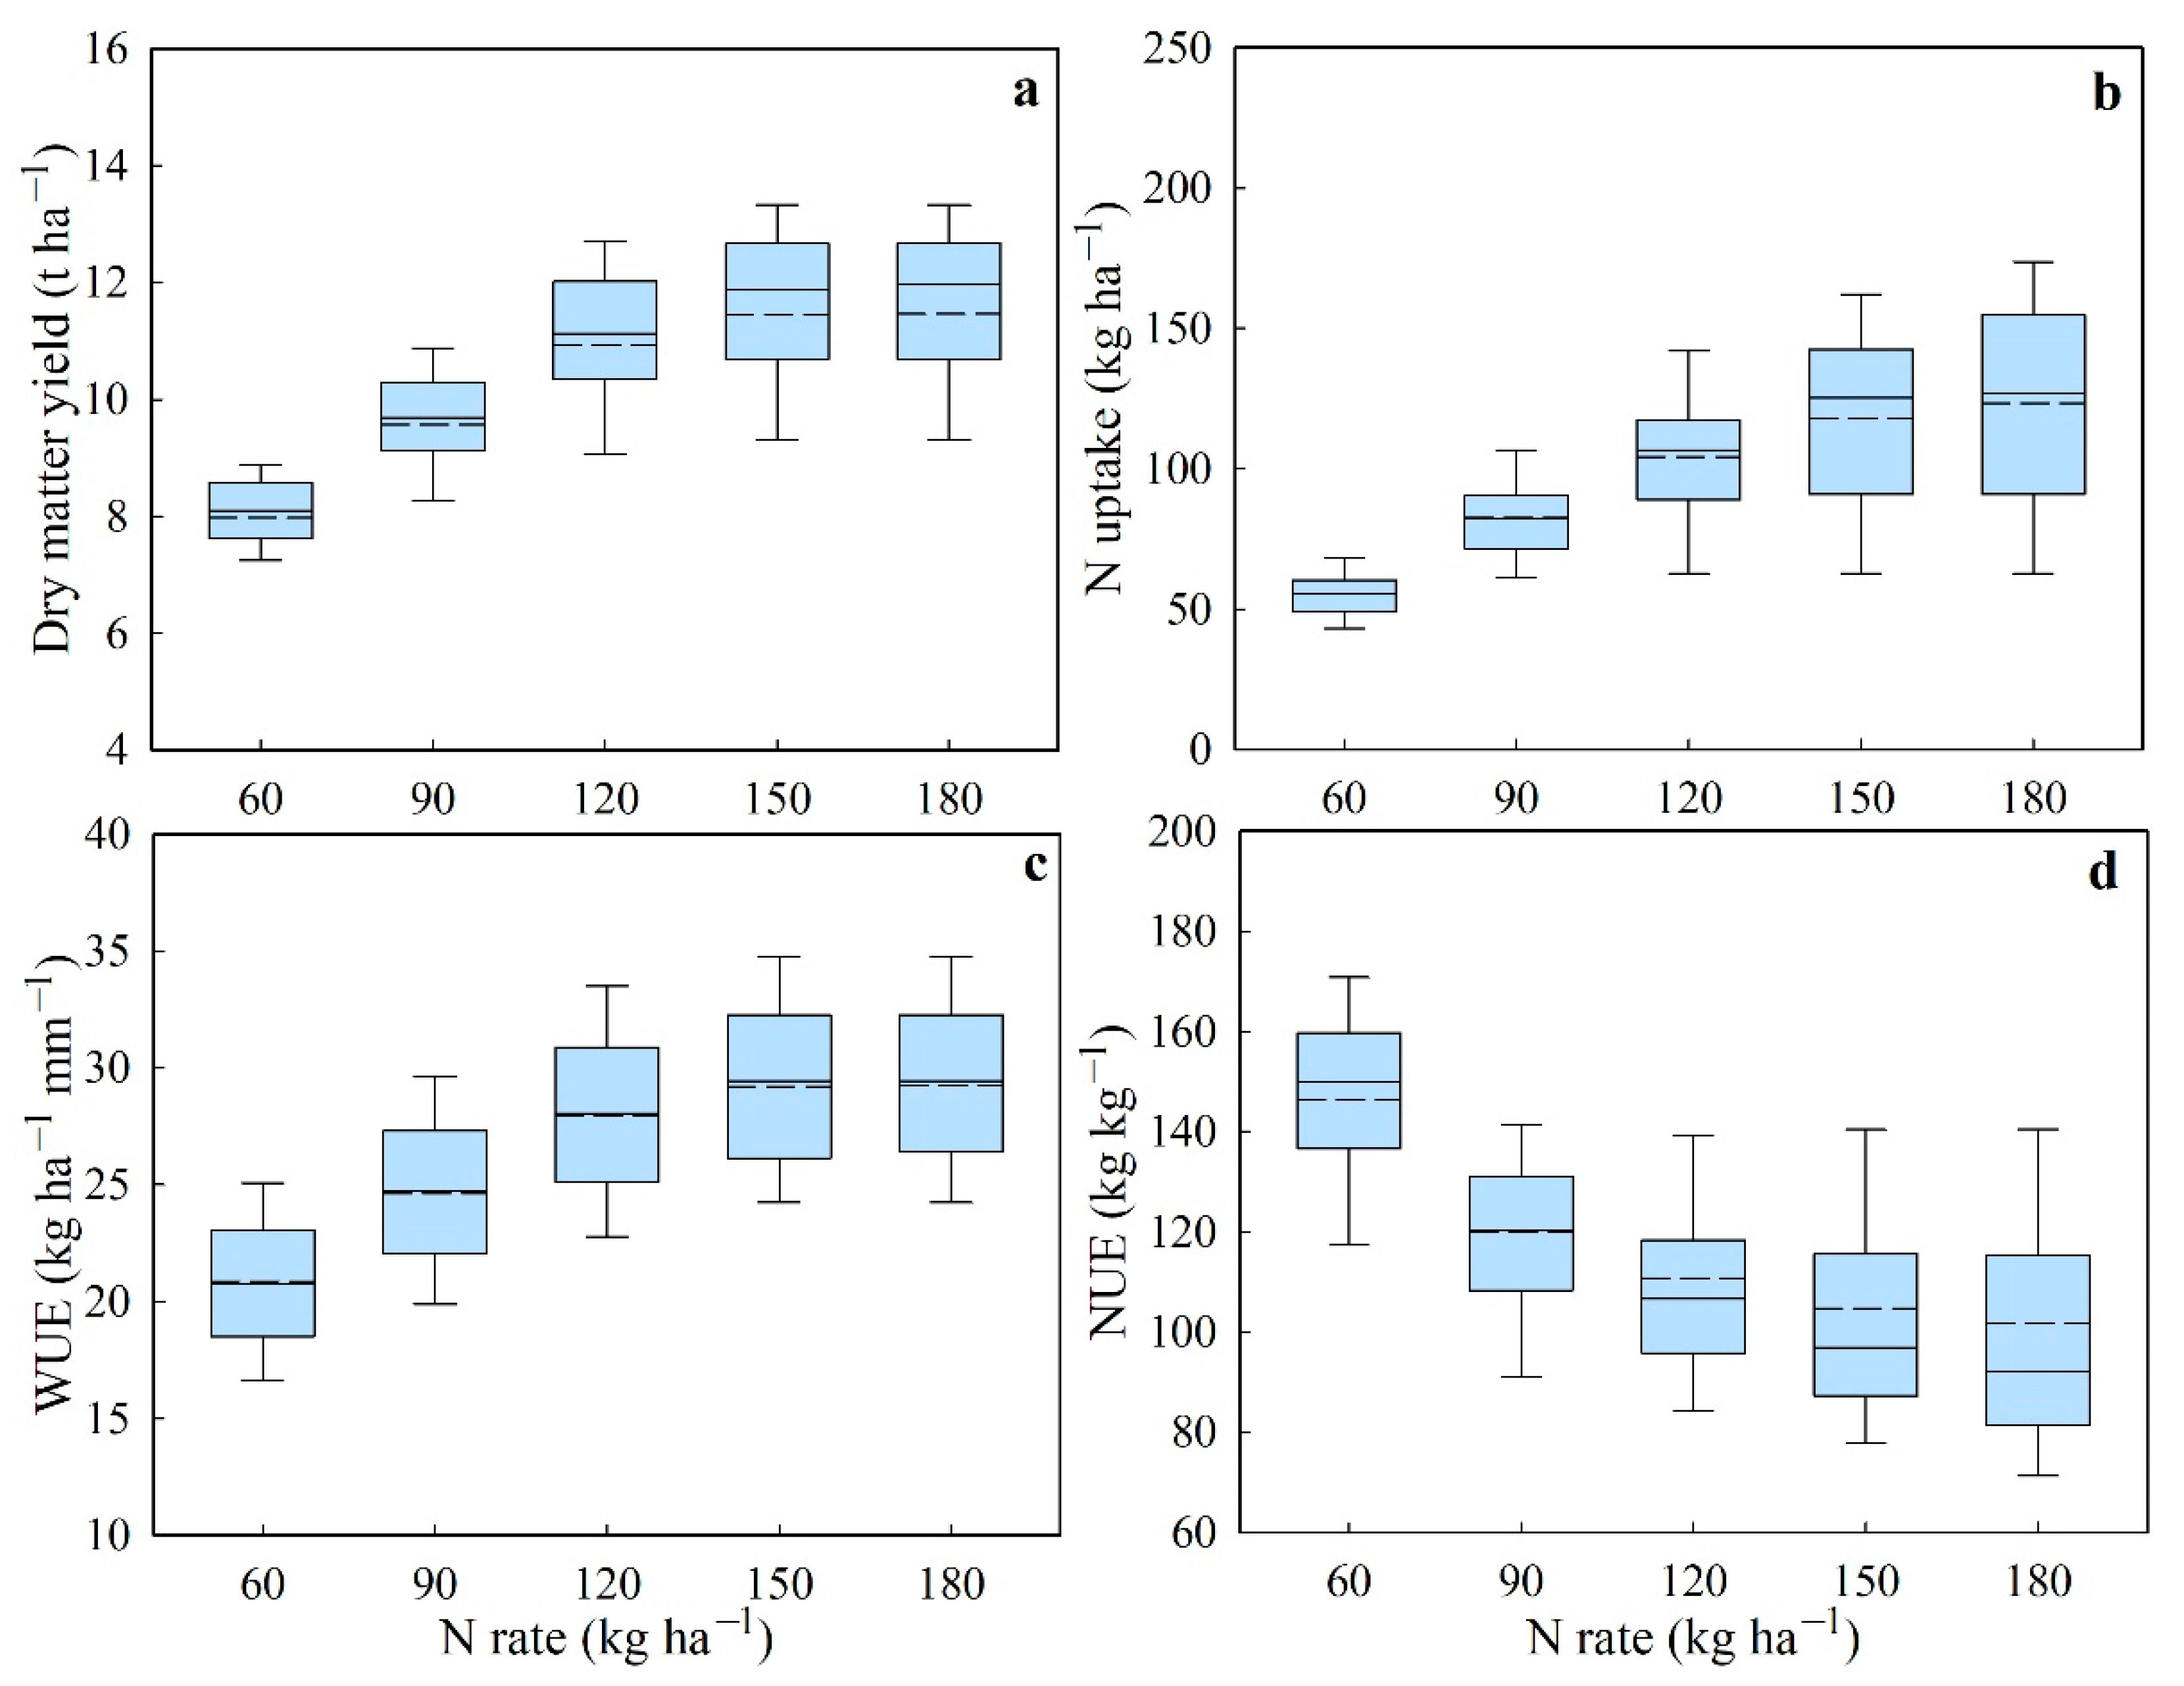
3.3. Optimization of Irrigation and Nitrogen Applications

Figure 7 shows the 30-year average biomass yield of oat as changed with the amount of irrigation. Averaged over the five N application treatments, the dry matter yield of oat was 9.78 t ha−1 when the irrigation amount was 80 mm, and the dry matter yield increased by 6.3%, 7.5%, and 7.7% when the irrigation amount increased to 120, 140, and 160 mm, respectively. The marginal effect of irrigation on yield improvement was 0.020 and 0.011 t ha−1 mm−1 when the irrigation amount increased from 80 to 100 mm and 100 to 120 mm, respectively, and it was reduced substantially to only 0.006 and 0.001 t ha−1 mm−1 when the irrigation amount increased from 120 to 140 mm and 140 to 160 mm, respectively. N uptake increased by only 4.1% and 0.09% when the irrigation amount increased from 120 to 140 mm and 140 to 160 mm, respectively, which were much lower than the increases of 15.1% and 7.9% when the N application increased from 80 to 100 mm and 100 to 120 mm, respectively. An irrigation amount of 120 mm is therefore superior for biomass production, saving water, and N uptake. In addition, WUE and NUE decreased with the increase in irrigation; 120 mm of irrigation also allowed for maintaining relatively high WUE and NUE of 26.6 kg ha−1 mm−1 and 112.0 kg kg−1.
Figure 8 shows the 30-year average biomass yield as changed with the amount of N application under irrigated conditions. The marginal effect of N application on yield improvement also decreased as the amount of N application increased. The marginal effects were 0.053 and 0.045 t kg−1 when N rate was changed from 60 to 90 and from 90 to 120 kg ha−1. It was reduced to only 0.017 and 0.001 t kg−1 when the N rate was changed from 120 to 150 kg ha−1 and from 150 to 180 kg ha−1. N uptake and WUE also increased with the increasing of N rate; the values increased by 26.4% and 13.5%, respectively, when the N rate was changed from 90 to 120 kg ha−1, but they increased by only 13.1% and 4.4% when the N rate was changed from 120 to 150 kg ha−1. The optimum application rate of 120 kg ha−1 was therefore recommended for local forage oat production.
Figure 9 shows the 30-year average biomass yield, N uptake, WUE, and NUE of oat as changed with N application under rainfed conditions. Dry matter yield, WUE, and N uptake of oat increased by 7.5%, 6.9%, and 47.7%, respectively, when the N rate increased from 60 to 90 kg ha−1. However, few increases in these indicators were found when the N application rate was further improved. Therefore, the superior N rate of 90 kg ha−1 was recommended for rainfed conditions.

4. Discussion

4.1. Biomass Yield, Water Use, and Nitrogen Use of Oat in the Field Experiment

Under the rainfed condition, the treatment with high N fertilization rate showed higher biomass yield and N uptake in both seasons. This was because the low rate of N application could not meet the yield potential of oat under the given heat, light, and water conditions. Other studies, such as Neugschwandtner and Kaul [36] and May et al. [16], also indicated the positive effects of increasing N application on oat production. In addition, the N concentration of oat was also improved by N application. In other words, the crude protein content of oat hay was improved by increasing N use, in agreement with a previous study [37]. WU and WUE of oat were also enhanced by the increasing of N application, which is similar to results for dryland maize [38] and wheat [39]. Because shoot and root growth were enhanced by N application, less water evaporated, and crops depleted more soil water. However, the NUE was reduced under high N, indicating that the high N resulted in a luxury use of N and led to a waste of resources. Therefore, it is necessary to optimize the N rate with the assistance of simulation tools such as ASPIM. Furthermore, the ASPIM has been proven to be effective in identifying an optimum N rate [25].
When supplement irrigation was applied, the biomass yield of oat was significantly improved. However, under low N application, the yield improvement was only significant under I2 (Figure 1). This was because water and N have a synergistic effect on crop growth; increased irrigation and N may also facilitate pollination and the transport of nutrient and plant assimilates [17]. Additionally, low application of N would restrict the advantage of irrigation because irrigation-enhanced N leaching means that the amount of available N cannot meet the requirements of crop growth, especially during the late growth stages [40,41]. Supplemental irrigation also improved N uptake of oat, but I3 and I2 showed no advantage over I1, which means that irrigation was beneficial for forage hay production but was not always beneficial for improving forage quality. This was because increased irrigation led to soil N leaching. More irrigation water contributed to the higher water use of oat under both N applications. This was because the availability of adequate plant nutrients and water in the root zone increases leaf expansion and leaf area growth, which improves light and CO2 capture [17]. An adequate supply of N was reported to increase crop transpiration which increases C uptake and assimilation [42]. Additionally, more soil evaporation occurred when the soil was kept wet for a longer time [13,42]. The WUE attained the highest value at I2. Therefore, in terms of oat forage production, two periods of irrigation during the vegetation development stage could lead to high biomass yield, N uptake, and water and N use efficiencies.

4.2. APSIM Performance and Scenario Analysis

No previous study has calibrated the APSIM-oat model for a variety local to the Tibetan Plateau. We calibrated the parameters of the widely used local variety “Qingyin 2” to assess water and N management optimization (Table 2). Phenology coefficients are the priority in model calibration. We calibrated and validated the phenology simulation with oat development data from two growing seasons with contrasting planting dates and water conditions. Dry matter yield at different growth stages was also well simulated, although some observations in early growth stages were slightly overestimated and somewhat in later stages were underestimated. These mismatches were mainly due to the considerable variation in plant sampling, and the inaccurate parameterization of model parameters could also induce simulation errors [43]. Similar to the studies by Mohanty et al. [44] and Yang et al. [45], soil water storage dynamics were also perfectly fitted with the measured values under both rainfed and irrigated conditions in our study. APSIM had been successfully used to model N balance [33,46], and we also validated the capability of APSIM in simulating soil N balance and oat N uptake in the Tibetan alpine environment. Therefore, we suggest that the validated APSIM was reliable in water and N process modeling, and that it could be applied in water and N management scenario analysis.
The scenario simulations under rainfed conditions indicated that a more than 90 ka ha−1 N application resulted in minimal positive effects on dry matter production, N uptake, and WUE of oat; therefore, excess application of N fertilizer would not be efficiently used by oat and would even lead to fertilizer waste. This is in agreement with similar N-optimization studies conducted under rainfed conditions. For example, Yang et al. [47] found that the application rate of 150–170 kg ha−1 was superior for wheat production on the Loess Plateau. Water was the main limiting factor for crop growth under rainfed conditions, especially in arid and semi-arid environments, and excessive available N in the soil would not be absorbed by crops, which might also contribute to environmental pollution through leaching or volatilization from the soil [21,48]. Therefore, the N rate of 120 kg ha−1 in local practice was too much under dryland conditions, so we recommend the rate of 90 ka ha−1.
Under irrigated conditions, N became the main limiting factor for oat growth. Dry matter yield, N uptake, and WUE all showed an increasing trend with N application. However, the increasing range became limited when the N application rate was greater than 120 kg ha−1. The marginal effect is a typically used method to evaluate the additional yield advantage induced by every N or water application [49]. The marginal effects of N application on oat biomass yield were as high as 0.045–0.053 t kg−1 when the N rate was improved from 60 to 120 kg ha−1, but it was reduced to only 0.001–0.017 t kg−1 when N application increased within 120 to 180 kg ha−1. Furthermore, increasing production costs of oat due to increased nitrogen fertilizer use leads to lower economic viability [50]. Further economic analysis would help us to identify the most efficient practices for oat production on the Tibetan Plateau. Araya et al. [17] also indicated that wheat yield increased with N rate, but the increase per unit of applied N gradually decreased. In addition, over-application of N under irrigated conditions would increase N leaching loss.
Irrigation showed a positive effect on forage yield and N uptake of oat; however, too much irrigation reduced the water and N use efficiencies. Excessive water application can increase soil evaporation and soil water seepage loss [51,52], but on the other hand, improper irrigation could also increase the leaching of soil nutrients and even affect the root respiration [53,54]. The simulation showed that the marginal effect of irrigation on biomass yield decreased substantially with the increase in irrigation volume, which was reduced to only 0.006 t ha−1 mm−1 when the irrigation amount increased from 120 to 140 mm. In addition, WUE and NUE decreased greatly when the irrigation amount increased from 120 to 140 mm. Therefore, the irrigation amount of 120 mm (irrigation water of 60 mm applied at tillering and jointing of oat) is superior for oat production and resource saving.

5. Conclusions

Under rainfed conditions, a high N rate significantly increased forage yield and N uptake. Supplementary irrigation applications yielded a higher forage production, and increased N application under irrigation significantly increased N uptake. Two irrigations were superior to three irrigations in terms of increasing WUE while maintaining high forage yield and N uptake. The simulation study indicated that the N rate of 90 kg ha−1 resulted in the best performance for oat under rainfed conditions. The N rate of 120 kg ha−1 in combination with irrigation of 120 mm applied during the vegetative growth period performed the best under irrigated conditions. Adjusting the planting date and density has great potential for helping forage crops to better capture temperature, light, and water resources, which deserves further study in the future. In addition, how to incorporate forage oat with other crops through intercropping or rotation in the planting systems should also be explored in further research.

Author Contributions

Conceptualization, H.Y. and Z.W.; methodology, Q.M., X.Z., H.Y. and Z.W.; investigation, Q.M., X.Z. and Y.W.; data curation, Q.M., X.Z., Y.W. and Z.W.; writing—original draft preparation, Q.M. and Z.W.; writing—review and editing, H.Y. and Z.W.; supervision, Z.W.; project administration, H.Y. and Z.W.; funding acquisition, H.Y. and Z.W. All authors have read and agreed to the published version of the manuscript.

Funding

This study is funded by the National Natural Science Foundation of China (31871560), China Forage and Grass Research System (CARS-34), National Key Research and Development Program of China (2016YFC0400302), and the Fundamental Research Funds for the Central Universities (lzujbky-2020-19).

Data Availability Statement

The data supporting the reported results will be available by request from the corresponding author.

Conflicts of Interest

The authors declare no conflict of interest.

References

  1. Long, R.; Zhang, D.; Wang, X.; Hu, Z.; Dong, S. Effect of strategic feed supplementation on productive and reproductive performance in yak cows. Prev. Vet. Med. 1999, 38, 195–206. [Google Scholar] [CrossRef]
  2. Harris, R.B. Rangeland degradation on the Qinghai-Tibetan plateau: A review of the evidence of its magnitude and causes. J. Arid Environ. 2010, 74, 1–12. [Google Scholar] [CrossRef]
  3. Brown, C.; Waldron, S. Agrarian change, agricultural modernization and the modelling of agricultural households in Tibet. Agric. Syst. 2013, 115, 83–94. [Google Scholar] [CrossRef]
  4. Dong, S.; Shang, Z.; Gao, J.; Boone, R.B. Enhancing sustainability of grassland ecosystems through ecological restoration and grazing management in an era of climate change on Qinghai-Tibetan Plateau. Agric. Ecosyst. Environ. 2020, 287, 106684. [Google Scholar] [CrossRef]
  5. Li, R.; Zhang, Z.; Tang, W.; Huang, Y.; Coulter, J.A.; Nan, Z. Common vetch cultivars improve yield of oat row intercropping on the Qinghai-Tibetan plateau by optimizing photosynthetic performance. Eur. J. Agron. 2020, 117, 126088. [Google Scholar] [CrossRef]
  6. Wang, Z.; Zhang, X.; Ma, Q.; Shen, Y. Seed mixture of oats and common vetch on fertilizer and water-use reduction in a semi-arid alpine region. Soil Till. Res. 2022, 219, 105329. [Google Scholar] [CrossRef]
  7. Zhao, G.; Shi, S.; Liu, G.; Xu, S. The current situation of oat research and production, problems and strategy in Tibetan Plateau. Pratacultural Sci. 2004, 21, 17–21. [Google Scholar]
  8. Guo, J.; Liu, X.; Zhang, Y.; Shen, J.; Han, W.; Zhang, W.; Christie, P.; Goulding, K.; Vitousek, P.; Zhang, F. Significant acidification in major Chinese croplands. Science 2010, 327, 1008–1010. [Google Scholar] [CrossRef] [Green Version]
  9. Zhao, X.; Zhou, Y.; Min, J.; Wang, S.; Shi, W.; Xing, G. Nitrogen runoff dominates water nitrogen pollution from rice-wheat rotation in the Taihu Lake region of China. Agric. Ecosyst. Environ. 2012, 156, 1–11. [Google Scholar] [CrossRef]
  10. Zhang, K.; Chen, Y.; Zhang, P.; Wei, K.; Yang, J. Differences in yield of oat varieties and relationship with agronomic traits under irrigation conditions. Agric. Res. Arid Areas 2019, 37, 166–170. [Google Scholar]
  11. Xu, B.; Tang, P.; Li, Q.; Yixi, Z.; Ren, Q. Research on optimal irrigation schedule of oats by CROPWAT in Lhasa of Tibet. Agric. Res. Arid Areas 2015, 33, 35–39. [Google Scholar]
  12. Zhao, B.; Pang, Y.; Zeng, Z.; Hu, Y.; Li, G.; Liu, R. Effect of limited irrigation on yield and water use efficiency of oats. Agric. Res. Arid Areas 2007, 25, 105–108. [Google Scholar]
  13. Chai, Q.; Gan, Y.; Zhao, C.; Xu, H.; Waskom, R.M.; Niu, Y.; Siddique, K.H. Regulated deficit irrigation for crop production under drought stress. A review. Agron. Sustain. Dev. 2016, 36, 3. [Google Scholar] [CrossRef] [Green Version]
  14. Jia, Z.; Zhou, Q.; Han, Z.; Yan, H. Effect of N and P fertilizer on the production performance of bare buried. Pratacultural Sci. 2007, 24, 19–22. [Google Scholar]
  15. Gao, K.; Yu, Y.; Xia, Z.; Ling, L. Response of height, dry matter accumulation and partitioning of oat (Avena sativa L.) to planting density and nitrogen in Horqin Sandy Land. Sci. Rep. 2019, 9, 7961. [Google Scholar] [CrossRef] [Green Version]
  16. May, W.E.; Brandt, S.; Hutt Taylor, K. Response of oats grain yield and quality to nitrogen fertilizer and fungicides. Agron. J. 2020, 112, 1021–1034. [Google Scholar] [CrossRef] [Green Version]
  17. Kibe, A.M.; Singh, S.; Kalra, N. Water–nitrogen relationships for wheat growth and productivity in late sown conditions. Agric. Water Manag. 2006, 84, 221–228. [Google Scholar] [CrossRef]
  18. Zhou, S.; Hu, X.; Ran, H.; Wang, W.; Hansen, N.; Cui, N. Optimization of irrigation and nitrogen fertilizer management for spring maize in northwestern China using RZWQM2. Agric. water Manag. 2020, 240, 106276. [Google Scholar] [CrossRef]
  19. Araya, A.; Prasad, P.V.V.; Gowda, P.H.; Afewerk, A.; Abadi, B.; Foster, A.J. Modeling irrigation and nitrogen management of wheat in northern Ethiopia. Agric. water Manag. 2019, 216, 264–272. [Google Scholar] [CrossRef]
  20. Kadiyala, M.D.M.; Jones, J.W.; Mylavarapu, R.S.; Li, Y.C.; Reddy, M.D. Identifying irrigation and nitrogen best management practices for aerobic rice–maize cropping system for semi-arid tropics using CERES-rice and maize models. Agric. Water Manag. 2015, 149, 23–32. [Google Scholar] [CrossRef] [Green Version]
  21. Cao, X.; Wu, L.; Lu, R.; Zhu, L.; Zhang, J.; Jin, Q. Irrigation and fertilization management to optimize rice yield, water productivity and nitrogen recovery efficiency. Irrig. Sci. 2021, 39, 235–249. [Google Scholar] [CrossRef]
  22. Giannoulis, K.D.; Kamvoukou, C.; Gougoulias, N.; Wogiatzi, E. Irrigation and nitrogen application affect Greek oregano (Origanum vulgare ssp. hirtum) dry biomass, essential oil yield and composition. Ind. Crops Prod. 2020, 150, 112392. [Google Scholar] [CrossRef]
  23. Zhang, Y.; Zhang, L.; Yang, N.; Huth, N.; Wang, E.; van der Werf, W.; Evers, J.B.; Wang, Q.; Zhang, D.; Wang, R.; et al. Optimized sowing time windows mitigate climate risks for oats production under cool semi-arid growing conditions. Agric. For. Meteorol. 2019, 266–267, 184–197. [Google Scholar] [CrossRef]
  24. Keating, B.A.; Carberry, P.S.; Hammer, G.L.; Probert, M.E.; Robertson, M.J.; Holzworth, D.; Huth, N.I.; Hargreaves, J.N.G.; Meinke, H.; Hochman, Z.; et al. An overview of APSIM, a model designed for farming systems simulation. Eur. J. Agron. 2003, 18, 267–288. [Google Scholar] [CrossRef] [Green Version]
  25. Beah, A.; Kamara, A.Y.; Jibrin, J.M.; Akinseye, F.M.; Tofa, A.I.; Adam, A.M. Simulating the Response of Drought–Tolerant Maize Varieties to Nitrogen Application in Contrasting Environments in the Nigeria Savannas Using the APSIM Model. Agronomy 2021, 11, 76. [Google Scholar] [CrossRef]
  26. Lu, Y.; Wang, E.; Zhao, Z.; Liu, X.; Tian, A.; Zhang, X. Optimizing irrigation to reduce N leaching and maintain high crop productivity through the manipulation of soil water storage under summer monsoon climate. Field Crops Res. 2021, 265, 108110. [Google Scholar] [CrossRef]
  27. Ma, Q.; Zhang, X.; Wang, Z.; Yang, H. Optimizing oat irrigation schedules in an alpine region using APSIM. Acta Prataculturae Sin. 2020, 29, 1–10. [Google Scholar]
  28. Large, E.C. Growth Stages in Cereals Illustration of the Feekes Scale. Plant Pathol. 1954, 3, 128–129. [Google Scholar] [CrossRef]
  29. Wang, Z.; Jiang, H.; Shen, Y. Forage production and soil water balance in oat and common vetch sole crops and intercrops cultivated in the summer-autumn fallow season on the Chinese Loess Plateau. Eur. J. Agron. 2020, 115, 126042. [Google Scholar] [CrossRef]
  30. Holzworth, D.P.; Huth, N.I.; DeVoil, P.G.; Zurcher, E.J.; Herrmann, N.I.; McLean, G.; Chenu, K.; van Oosterom, E.J.; Snow, V.; Murphy, C.; et al. APSIM—Evolution towards a new generation of agricultural systems simulation. Environ. Model. Softw. 2014, 62, 327–350. [Google Scholar] [CrossRef]
  31. Priestley, C.H.B.; Taylor, R.T. On the assessment of surface heat flux and evaporation using large-scale parameters. Mon. Weather Rev. 1972, 100, 81–92. [Google Scholar] [CrossRef]
  32. Ritchie, J.T. Model for predicting soil evaporation from row crop with incomplete cover. Water Resour. Res. 1972, 8, 1204–1213. [Google Scholar] [CrossRef] [Green Version]
  33. Allen, R.G.; Pereira, L.S.; Raes, D.; Smith, M. Crop Evapotranspiration: Guidelines for Computing Crop Water Requirements; FAO Irrigation and Drainage Paper 56; FAO: Rome, Italy, 1998. [Google Scholar]
  34. Ahmed, M.; Akram, M.N.; Asim, M.; Aslam, M.; Hassan, F.; Higgins, S.; Stöckle, C.O.; Hoogenboom, G. Calibration and validation of APSIM-Wheat and CERES-Wheat for spring wheat under rainfed conditions: Models evaluation and application. Comput. Electron. Agr. 2016, 123, 384–401. [Google Scholar] [CrossRef]
  35. Jamieson, P.D.; Porter, J.R.; Wilson, D.R. A test of the computer simulation model ARCWHEAT1 on wheat crops grown in New Zealand. Field Crops Res. 1991, 27, 337–350. [Google Scholar] [CrossRef]
  36. Willmott, C.J.; Ackleson, S.G.; Davis, R.E.; Feddema, J.J.; Klink, K.M.; Legates, D.R.; O’Donnell, J.; Rowe, M. Statistics for the evaluation and comparison of models. J. Geophys. Res. Oceans 1985, 90, 8995–9005. [Google Scholar] [CrossRef] [Green Version]
  37. Neugschwandtner, R.W.; Kaul, H.P. Nitrogen uptake, use and utilization efficiency by oat-pea intercrops. Field Crops Res. 2015, 179, 113–119. [Google Scholar] [CrossRef]
  38. Cui, J.; Yang, H.; Yu, C.; Bai, S.; Wu, T.; Song, S.; Sun, W.; Shao, X.; Jiang, L. Effect of urea fertilization on biomass yield, chemical composition, in vitrorumen digestibility and fermentation characteristics of forage oats straw in Tibet of China. J. Agric. Sci. 2016, 154, 914–927. [Google Scholar] [CrossRef]
  39. Khan, S.; Anwar, S.; Shaobo, Y.; Gao, Z.; Sun, M.; Ashraf, M.Y.; Ren, A.; Yang, Z. Soil water consumption, water use efficiency and winter wheat production in response to nitrogen fertilizer and tillage. Peer J. 2020, 8, e8892. [Google Scholar] [CrossRef]
  40. Palestina, M.S.; Gutierrez, R.A.S.; Valle, O.R.; Reyes, M.A.G.; Banuelos, H.G. Models for irrigation timing and optimization in oats for forage. Rev. Mex. Cienc. Pecu. 2018, 9, 667–684. [Google Scholar]
  41. Wang, Q.; Li, F.; Zhang, E.; Li, G.; Vance, M. The effects of irrigation and nitrogen application rates on yield of spring wheat (longfu-920) and water use efficiency and nitrate nitrogen accumulation in soil. Aust. J. Crop Sci. 2012, 6, 662–672. [Google Scholar]
  42. Qiu, G.Y.; Wang, L.; He, X.; Zhang, X.; Chen, S.; Chen, J.; Yang, Y. Water use efficiency and evapotranspiration of winter wheat and its response to irrigation regime in the north China plain. Agric. For. Meteorol. 2008, 148, 1848–1859. [Google Scholar] [CrossRef]
  43. Bassu, S.; Asseng, S.; Motzo, R.; Giunta, F. Optimising sowing date of durum wheat in a variable Mediterranean environment. Field Crops Res. 2009, 111, 109–118. [Google Scholar] [CrossRef]
  44. Mohanty, M.; Probert, M.E.; Reddv, K.S.; Dalal, R.C.; Mishra, A.K.; Rao, A.S.; Sinh, M.; Menzies, N.W. Simulating soybean-wheat cropping system: APSIM model parameterization and validation. Agric. Ecosyst. Environ. 2012, 152, 68–78. [Google Scholar] [CrossRef]
  45. Yang, X.; Zheng, L.; Yang, Q.; Wang, Z.; Cui, S.; Shen, Y. Modelling the effects of conservation tillage on crop water productivity, soil water dynamics and evapotranspiration of a maize-winter wheat-soybean rotation system on the Loess Plateau of China using APSIM. Agric. Syst. 2018, 166, 111–123. [Google Scholar] [CrossRef]
  46. Vogeler, I.; Cichota, R.; Thomsen, I.K.; Bruun, S.; Jensen, L.S.; Pullens, J.W.M. Estimating nitrogen release from Brassicacatch crop residues-Comparison of different approaches within the APSIM model. Soil Till. Res. 2019, 195, 104358. [Google Scholar] [CrossRef]
  47. Yang, X.; Li, Z.; Cui, S.; Cao, Q.; Deng, J.; Lai, X.; Shen, Y. Cropping system productivity and evapotranspiration in the semi-arid Loess Plateau of China under future temperature and precipitation changes: An APSIM-based analysis of rotational vs. continuous systems. Agric. water Manag. 2020, 229, 105959. [Google Scholar] [CrossRef]
  48. Frasier, I.; Noellemeyer, E.; Amiotti, N.; Quiroga, A. Vetch-rye biculture is a sustainable alternative for enhanced nitrogen availability and low leaching losses in a no-till cover crop system. Field Crops Res. 2017, 214, 104–112. [Google Scholar] [CrossRef]
  49. Zhao, J.; Cai, X.; Wang, Z. Optimality conditions for a two-stage reservoir operation problem. Water Resour. Res. 2011, 47, W08503. [Google Scholar] [CrossRef]
  50. Baxevanos, D.; Tsialtas, I.T.; Voulgari, O.; Pankou, C.I.; Vlachostergios, D.; Lithourgidis, A.S. Oat genotypic requirement for intercropping with vetch under Mediterranean conditions. J. Agric. Sci. 2020, 158, 695–706. [Google Scholar] [CrossRef]
  51. Chu, G.; Yang, L. Study on effect of deficit irrigation on the yield and water use efficiency in winter wheat. Water-Sav. Irrig. 2016, 8, 54–56. [Google Scholar]
  52. Kang, X.; Jing, H.; Ma, A.; Wang, Y.; Cui, H. Effects of micro-sprinkler irrigation amounts on soil water storage and consumption and water use efficiency in the north of Huang-Huai-Hai wheat field. J. Soil Water Cons. 2019, 33, 221–226. [Google Scholar]
  53. Lukangu, G.; Savage, M.J.; Johnston, M.A. Use of sub-hourly soil water content measured with a frequency-domain reflectometer to schedule irrigation of cabbages. Irrig. Sci. 1999, 19, 7–13. [Google Scholar] [CrossRef]
  54. Abraha, M.G.; Savage, M.J. The soil water balance of rainfed and irrigated oats, Italian ryegrass and rye using the CropSyst model. Irrig. Sci. 2008, 26, 203–212. [Google Scholar] [CrossRef]
Figure 1. Monthly temperature and rainfall in 2017 and 2018 at the experiment site in Chaka.
Agronomy 12 00933 g001
Figure 2. Oat dry matter yield under different irrigation and nitrogen applications in 2017 (a) and 2018 (b). HN—high nitrogen; LN—low nitrogen; NI—no irrigation; I1—irrigation only at flowering; I2—irrigation at tillering and jointing; I3—irrigation at tillering, jointing, and flowering. Different capital letters indicate a significant difference between different nitrogen treatments, and different lowercase letters indicate significant differences among different irrigation treatments under the same nitrogen level (p < 0.05). I—irrigation; N—nitrogen; I × N—irrigation × nitrogen. Two stars mean that the effect is significant p < 0.01, and NS means the effect is insignificant. Error bars indicate one standard deviation from the mean.
Agronomy 12 00933 g002
Figure 3. Water use (a,b) and water use efficiency (c,d) of oat under different irrigation and nitrogen fertilizer treatments in 2017 (a,c) and 2018 (b,d). HN—high nitrogen; LN—low nitrogen; NI—no irrigation; I1—irrigation only at flowering; I2—irrigation at tillering and jointing; I3—irrigation at tillering, jointing, and flowering. Different capital letters indicate a significant difference between different nitrogen treatments, and different lowercase letters indicate significant differences among different irrigation treatments under the same nitrogen level (p < 0.05). I—irrigation; N—nitrogen; I × N—irrigation × nitrogen. One star and two stars mean that the effect is significant at p < 0.05 and p < 0.01 levels, respectively, and NS means the effect is insignificant. Error bars indicate one standard deviation from the mean.
Agronomy 12 00933 g003
Figure 4. Nitrogen uptake (a,b) and nitrogen use efficiency (c,d) of oat under different irrigation and nitrogen fertilizer treatments in 2017 (a,c) and 2018 (b,d). HN—high nitrogen; LN—low nitrogen; NI—no irrigation; I1—irrigation only at flowering; I2—irrigation at tillering and jointing; I3—irrigation at tillering, jointing, and flowering. Different capital letters indicate a significant difference between different nitrogen treatments, and different lowercase letters indicate significant differences among different irrigation treatments under the same nitrogen level (p < 0.05). I—irrigation; N—nitrogen; I × N—irrigation × nitrogen. One star and two stars mean that the effect is significant at p < 0.05 and p < 0.01 levels, respectively, and NS means the effect is insignificant. Error bars indicate one standard deviation from the mean.
Agronomy 12 00933 g004
Figure 5. Comparison of observed (solid lines) and simulated (dotted lines) dry matter yield of oat in model validation. Experiment data under high nitrogen in 2018 were used. I1—irrigation only at flowering; I2—irrigation at tillering and jointing; I3—irrigation at tillering, jointing, and flowering. Error bars indicate one standard deviation from the observed mean.
Agronomy 12 00933 g005
Figure 6. Comparison of observed (solid lines) and simulated (dotted lines) soil water storage in the 0–100 cm layer in model validation. Experimental data under high nitrogen in 2018 were used. NI—no irrigation; I1—irrigation only at flowering; I2—irrigation at tillering and jointing; I3—irrigation at tillering, jointing, and flowering. Error bars indicate one standard deviation from the mean observed.
Agronomy 12 00933 g006
Figure 7. The 30-year average dry matter yield (a), N uptake (b), WUE (c), and NUE (d) of oat as affected by the amount of irrigation on the Tibetan Plateau. The bottom and top edges of the box show the 25th and 75th quantiles, the solid line is the data median, and the dotted line is the data average.
Agronomy 12 00933 g007
Figure 8. The 30-year average dry matter yield (a), N uptake (b), WUE (c) and NUE (d) of oat as affected by N application under irrigated conditions on the Tibetan Plateau. The bottom and top edges of the box show the 25th and 75th quantiles, the solid line is the data median, and the dotted line is the data average.
Agronomy 12 00933 g008
Figure 9. The 30-year average dry matter yield (a), N uptake (b), WUE (c), and NUE (d) of oat as affected by the amount of nitrogen application under the rainfed condition on the Tibetan Plateau. The bottom and top edges of the box show the 25th and 75th quantiles, the solid line is the data median, and the dotted line is the data average.
Agronomy 12 00933 g009
Table 1. Soil organic matter, soil available N, bulk density, the field capacity, and crop low water limit in the 0–100 cm soil layer measured at the beginning of the experiment.
Soil Layer
(cm)
Soil Organic Matter (g·kg−1)Available
Nitrogen (mg·kg−1)
Available
Phosphorus (mg·kg−1)
Bulk Density (g·cm−3)Field Water
Capacity (cm3·cm−3)
Crop Low
Limit (cm3·cm−3)
0–1019.9223.826.111.380.270.09
10–2020.9013.585.431.390.260.09
20–3024.7410.095.561.400.270.08
30–4015.306.832.931.420.260.07
40–6010.604.762.181.430.250.06
60–1006.734.532.121.430.180.05
Table 2. Calibrated cultivar parameters of local oat variety “Qingyin 2” on the Tibetan Plateau.
ParameterDescriptionUnitValue
ven_sensVernalization sensitivity-1.5
photo_sensPhotoperiod sensitivity-4.3
tt_end_of_juvenileThermal time required from end of the juvenile stage to floral initiation°C·d430
tt_floral_initiationThermal time required from floral initiation stage to flowering°C·d400
tt_floweringThermal time required in flowering to start of grain filling°C·d180
tt_start_grain_fillThermal time required from start to end of grain-filling stage°C·d420
RUERadiation use efficiencyg·MJ−11.85
Table 3. Statistics of the performance of APSIM in model calibration.
VariableObserved ValueSimulated ValueRMSENRMSE (%)d
Emergence date (DAS)8.77.71.011.50.78
Initial flowering date (DAS)53.555.72.95.60.88
Flowering date (DAS)75.779.34.05.20.79
Harvest maturity date (DAS)88.590.03.13.50.79
Soil water storage at tillering (mm)193.2193.37.33.80.98
Soil water storage at flowering (mm)174.2171.93.92.20.99
Soil water storage at ripening (mm)183.8186.69.65.20.97
Dry matter yield at tillering (t ha−1)0.350.410.128.30.78
Dry matter yield at flowering (t ha−1)6.236.080.812.20.95
Dry matter yield at ripening (t ha−1)9.058.950.55.10.99
N uptake at flowering (kg ha−1)63.172.29.815.40.87
N uptake at ripening (kg ha−1)78.578.58.611.00.94
Table 4. Descriptive statistics of the performance of APSIM-oat in modeling phenology and N uptake of oat in model validation.
VariableObsSimRMSENRMSE (%)d Value
Emergence date (DAS)7.36.501.318.30.26
Initial flowering date (DAS)55.557.82.44.30.47
Flowering date (DAS)77.879.54.65.90.61
Harvest maturity date (DAS)89.091.32.73.00.74
N uptake at flowering (kg ha−1)96.099.03.23.40.98
N uptake at ripening (kg ha−1)111.0113.72.92.60.93
Sim—simulated; Obs—observed; RMSE—root mean square error; NRMSE—normalized RMSE; DAS—days after sowing.
Publisher’s Note: MDPI stays neutral with regard to jurisdictional claims in published maps and institutional affiliations.

