Article

Impact of Sowing Time on Chickpea (Cicer arietinum L.) Biomass Accumulation and Yield

NSW Department of Primary Industries, 322 Pine Gully Road, Wagga Wagga, NSW 2650, Australia
*
Author to whom correspondence should be addressed.
Agronomy 2022, 12(1), 160; https://doi.org/10.3390/agronomy12010160
Submission received: 6 December 2021 / Revised: 20 December 2021 / Accepted: 21 December 2021 / Published: 10 January 2022
(This article belongs to the Special Issue Progress in Plant Bioclimatic Modelling under Global Climate Change)

Abstract

:
Chickpea growth, development and grain yield are affected by a range of climatic and environmental factors. Experiments were conducted across four sowing dates from mid-April to the end of May, over two years at Trangie in central western New South Wales (NSW), and Leeton, Wagga Wagga and Yanco (one year) in southern NSW, to examine the influence of sowing time on biomass accumulation, grain yield and plant yield components. Climatic and experimental location data were recorded during the growing seasons. Early sowing (mid-April) resulted in taller plants, higher bottom and top pod heights, fewer pods, more unfilled pods and greater biomass accumulation, but low harvest index due to reduced grain yield compared with late sowing (end of May). Grain number was positively correlated with grain yield and was the main yield component accounting for most of the variation in yield. There was largely a positive correlation between biomass and yield, especially with delayed sowing except for Leeton experiments. This study concludes that sowing around the end of April in central western NSW and mid-May in southern NSW is conducive to higher grain yield as it minimises exposure to abiotic stresses at critical growth periods and allows efficient conversion of biomass to grain yield.

1. Introduction

Chickpea (Cicer arietinum L.) is a cool-season legume grown over a wide range of environments mainly in the arid and semi-arid regions of the world, where it often encounters hostile climatic conditions. Its numerous nutritional and farming system benefits are well documented. Chickpea is a source of essential proteins and amino acids in human diets [1] and provides valuable energy and proteins in animal feed [2]. Within farming systems, it is a useful break crop for weed control and prevention of soil- and stubble-borne disease outbreaks. Furthermore, its ability to fix atmospheric nitrogen improves soil fertility, providing benefits for subsequent cereal crops.
Although chickpeas are grown in approximately 17.8 million ha across 56 countries [3] the Indian subcontinent is the major producer and consumer [4,5]. In Australian Mediterranean regions, it is predominantly grown in the northern parts, in Queensland and northern New South Wales (NSW). Over a 20-year period (1999–2019), in Australia the harvested area increased from 218,000 to 263,000 ha, with a corresponding increase of 229,900 to 281,200 tonne production [3]. However, over this period yield gains have been minimal, increasing by 14 kg per ha (1055 to 1069 kg/ha) [3]. The northern regions of Australia have deep soils and high water-holding capacity, and chickpea is sown in late autumn and/or early winter when the soil water profile is full. Due to summer dominant rainfall [6] these regions receive low in-crop rainfall and thus chickpeas get exposed to unfavourable climatic conditions such as terminal water deficit and extreme high temperatures later in the season, which limit yield potential. The benefits to farming systems and profitability of chickpeas have encouraged production to expand into new agroecological zones such as the central western and southern regions of NSW. In these colder- and winter-rainfall-dominated regions [6], biomass accumulation and grain yield are constrained by cold temperatures and frost events early in the growing season and terminal drought and heat stress later in the season.
The optimum temperature during the sensitive reproductive phase for chickpea production is between 10 and 30 °C [5], with flower/pod abortion and yield reductions observed at temperatures above or below this range [7,8,9,10,11,12]. In this temperature range there tends to be sufficient accumulation of biomass and its efficient conversion to grain yield. The number of productive flowers and filled pods is greatly affected by high temperatures, and therefore these traits can be used as a selection criterion for heat tolerance [5]. Furthermore, a mean daily temperature of approximately 15 °C is required for successful pod set and grain retention [7,8]. At very low temperatures, frost induces flower and pod abortion leading to a high number of empty pods. In most growing regions chickpea is largely grown on stored soil moisture, with no supplementary irrigation, and therefore tends to encounter terminal drought. Globally, drought accounts for about 50% of the chickpea yield reductions [13]. While grain weight, grain number and pod number contribute to final grain yield, grain number has been overwhelmingly shown to be the main driver of yield in crops [6,14]. Grain weight, however, has important commercial quality implications especially if abiotic stresses result in shrivelled or small grain [6,15].
Identifying crop varieties that are suitable for new production environments is key to increasing crop expansion, adaptation and overall productivity [16,17]. Understanding the mechanisms for maintaining productivity and/or increasing yield under multiple stresses assists in determining varietal suitability in other environments. Desi chickpea varieties tend to be more tolerant of abiotic stresses such as drought and heat than the kabuli varieties [5]. Generally, crops adopt a range of avoidance or tolerance strategies to survive and yield satisfactorily under abiotic constraints [18,19]. In chickpea, the reproductive phase is more sensitive to environmental stresses than the vegetative phase. However, due to its indeterminate growth habit, these growth phases can overlap, and chickpeas can be exposed to the same environmental stressors during both growth phases simultaneously. Biomass accumulation and satisfactory conversion to grain yield can be maximised through management practices such as optimising sowing dates for specific varieties, to ensure that the crop is not in susceptible growth phases when environmental stresses are highest [20].
Sowing across a range of dates and different environments is a practical way of testing both a crop’s adaptability to and productivity in new regions and matching the genetic performance of varieties to the long-term average climatic conditions. The aim of this study was to identify the varieties best adapted to two agroecological environments of central western and southern NSW through varying sowing date and to understand the genotype-by-environment (G × E) interactions. The study also aimed to quantify the drivers of chickpea yield by measuring yield components, biomass, harvest index and the relationships between grain number and biomass with grain yield.

2. Materials and Methods

2.1. Experimental Locations and Seasonal Conditions

In 2018, the experiments were conducted at four locations, Trangie Agricultural Research Centre (TARC; 31.99° S, 147.95° E), Wagga Wagga Agricultural Institute (WWAI; 35.05° S, 147.35° E), Leeton Field Station (LFS; 34.59° S, 146.36° E) and Yanco Agricultural Institute (YAI; 34.61° S, 146.41° E). YAI is 6 km from LFS and was considered as a drought stressed companion to the LFS experiment. In 2019 experiments were conducted at TARC, WWAI and LFS but not at YAI. Experiment details, overall trial management and long-term seasonal conditions, have been presented previously [21] and in Supplementary Figure S1. Daily temperatures (maximum and minimum) and rainfall amount for all experiments (Table 1) were obtained from the local Bureau of Meteorology (BOM) weather stations. The experiments were sown on similar dates at all the locations, with fortnightly sowing from mid-April to end of May.
Southern and central western NSW had low autumn and growing season rainfall in 2018 and 2019. At TARC the long-term average growing season (April–October) rainfall is 248 mm, but only 137 and 45 mm was received in 2018 and 2019, respectively. At WWAI the long-term average growing season rainfall is 322 mm, but only 153 and 193 mm was received in 2018 and 2019, respectively. Likewise, the 87 mm of growing season rainfall received at LFS (6 km from YAI) in 2018 was well below the 193 mm long term average, but improved in 2019 to 160 mm. All experiments received supplementary irrigation to maintain them considering the very dry conditions. The LFS experiments received the most supplementary irrigation (244 and 220 mm in 2018 and 2019, respectively).

2.2. Plant Material and Experimental Conditions

Varieties (genotypes) were selected based on their diverse characteristics, including maturity classification, adaptation to the agroecological zones and disease resistance. In total, nine chickpea genotypes were examined: the desi varieties PBA Striker, PBA Slasher, PBA Boundary, PBA HatTrick, Neelam and CBA Captain (previously reported/known as breeding line CICA1521) and the kabuli varieties, GenesisTM 079, GenesisTM 090 and GenesisTM Kalkee. Seven of these genotypes were common across the three regions and two years, as PBA HatTrick replaced Neelam in 2019. Four sowing dates (SD) were used to identify the optimal sowing period, timed to coincide with ‘very early’ (SD1), ‘early’ (SD2), ‘timely’ (SD3) and ‘late’ (SD4) sowing practices.
Each experiment was established as a split-block design with three replicates, with sowing date as main plots and varieties as subplots. In both years, the experiments were sown with a five (TARC) or six-row cone seeder, at 3–5 cm depth. The row spacing was 0.33 m at TARC, 0.3 m at WWAI and 0.25 m at both LFS and YAI. The area of each plot was 16.5 m2 at TARC, 21.6 m2 at WWAI, 15 m2 at LFS and YAI. All experiments had a target sowing density of 40 plants/m2. At sowing, a Rhizobium group N inoculant (New Edge Microbials), was made into a water slurry and injected into the furrow at a rate of 50 L/ha. Local management practices, including hand chipping and application of registered herbicides, fungicides and pesticides, were used to maintain the plots free of weeds and diseases.

2.3. Measurements at Physiological Maturity

Plant height was measured in situ, from the base to the top of the plant, with five plants randomly measured within each plot at maturity. At harvest, two 1 m2 quadrats were cut from the inner rows and at least 1 m from the end of each plot [22]. These samples were dried at 72 °C for at least 48 h. Total above ground biomass (t/ha), grain yield (t/ha), harvest index (HI), grain number and weight (g) were calculated from the dried quadrat samples. Harvest index was calculated as grain yield/total shoot dry weight. In addition, 10 plants were taken at random from each plot to measure and/or count plant components including: top and bottom pod height, number of filled/unfilled (viable/unviable) pods, total pods, pod weight, branch number, grain number and grains per pod. These were expressed on a per plant basis.

2.4. Statistical Analyses

Statistical analysis was performed using the REML linear model algorithm of GenStat 19th Edition [23]. The effects of sowing date, genotype and their interaction were tested separately for each environment, as the datasets were unbalanced among environments. The multi environment correlation of the 14 traits measured in this study was analysed. The contribution of the yield components to grain yield on per plant basis was assessed by simple linear regression, with yield as the response variant and the yield components as explanatory variants. The predicted means, generated by the REML linear model algorithm, for grain yield were used to test the environmental correlations, genotype-by-environment (G × E) interactions and genotype adaptability/stability using the additive main effects and multiplicative interaction (AMMI) model. Furthermore, the predicted means were used to characterise the environments using the genotype main effects (G) and genotype-by-environment interaction (G × E) GGE model.

3. Results

3.1. Correlation between Traits

Significant positive phenotypic correlations were observed between biomass and yield-related traits (Table 2). The strongest positive correlations (r > 0.70) were between pod number with branch number and filled pods. The number of filled pods was correlated with both grains per plant and grain yield per plant. Plant height was correlated with both bottom and top pod heights, while biomass was strongly correlated with both plant height and top pod height. Bottom and top pod heights were correlated with each other. Pod number per plant was correlated with both grains per plant and grain yield per plant. The number of grains per plant was correlated with both grain yield per plant and overall grain yield, with both these traits also correlated.
Moderate correlations (r = 0.50–0.69) were observed between branch number with filled pods, grains per plant and grain yield per plant. There was also moderate correlation between bottom pod height and dry matter. Filled pod number was moderately correlated with total grain yield and harvest index. Harvest index was correlated positively with grains per plant and negatively with bottom pod height. The number of unfilled pods was correlated with pod number, grains per plant and grain yield per plant, while pod number was correlated with number of unfilled pods.

3.2. Biomass and Related Traits

In both years, harvest index, above ground biomass, plant and bottom pod height all varied with sowing date (Table 3; Supplementary Tables S1–S7). Genotypes, sowing date and their interactions were all sources of variation for the measured traits.
Harvest index increased with delayed sowing at all locations across both years, ranging from 0.22 at YAI to 0.55 at LFS (during 2018) and 0.04 at WWAI to 0.44 at TARC (during 2019). Genotype-by-sowing date (G × SD) interactions were significant at only the WWAI and YAI locations during 2018 and at all the locations during 2019.
Later sowing resulted in lower biomass across both years. In 2018, biomass accumulated from the earliest and latest sowing dates ranged from 2.35 t/ha (SD4 at WWAI) to 7.66 t/ha (SD1 at LFS), and in 2019, from 1.95 t/ha (SD4 at WWAI) to 7.36 (SD1 at LFS). G × SD interactions for biomass were only found at WWAI during 2019.
Later sowing reduced plant height at most locations across both years. In 2018, plant height ranged from 35.64 cm at WWAI (SD4) to 57.89 cm at LFS (SD1), with no differences at YAI. Plant height was not measured at TARC. In 2019, plant height ranged from 36.99 cm at WWAI (SD4), to 63.63 cm at LFS (SD1). Across both years, only WWAI had a significant G × SD interaction for plant height.
Bottom pod height was lowered by delayed sowing across both years. In 2018, this ranged from 18.78 cm at TARC (SD3) to 33.05 cm at LFS (SD1). In 2019, this ranged from 21.47 cm for SD4 at TARC to 41.62 cm for SD1 at LFS. Across both years, G × SD interactions for bottom pod height were only found at WWAI in 2019. Branch number was affected by sowing date only at WWAI2018, WWAI2019 and LFS2019, with more branches at earlier sowing times and lowest in the later-sown treatment (SD4).

3.3. Yield and Yield Components

Yield and yield components responded to variation in sowing date across locations in both years (Table 4; Supplementary Tables S1–S7). The main effects of genotypes and sowing date, together with their interactions, were all sources of variation for the measured traits.

3.3.1. Mean Grain Yield

Very low rainfall led to low grain yield, LFS2018 being an exception with the highest yields of any location/year combination (location mean yield 2.29 t/ha) as compared with WWAI2019 the lowest (location mean yield 0.59 t/ha). Grain yield was impacted by sowing date at all locations/years except WWAI and TARC during 2018. The highest yield occurred at LFS during 2018, with 2.4 t/ha from SD3, and the lowest at WWAI during 2019 with 0.173 t/ha from SD1. Generally, at southern NSW locations the greatest yields were from SD3, whereas earlier sowing (SD1 and SD2) produced greater yields in central NSW. The highest yielding varieties across this study were PBA Slasher, PBA Striker, PBA Boundary and CBA Captain at almost all location/year combinations, with the exceptions of PBA Boundary and PBA Slasher at WWAI2019 and PBA Boundary at LFS during 2019 and YAI2018. The other varieties, GenesisTM 079, GenesisTM 090, GenesisTM Kalkee and Neelam, were generally low yielding, with the exception of GenesisTM 079 at TARC and LFS during 2018. G × SD interactions were found at WWAI, LFS, and YAI during 2018, and only TARC during 2019.

3.3.2. Pod Number and Pod Fill

Pod number was affected by sowing date at most locations during 2018 and 2019 (except TARC in 2019), with a general trend of more pods developing from earlier sowing (SD1 and SD2) except WWAI in 2019 that had highest pods at SD3. The highest pod number occurred at TARC in 2018 (42.8 pods per plant in SD1) and the lowest at WWAI in 2019 (5.0 pods per plant from SD1). Filled pod number was only affected by sowing date at WWAI (both years) and LFS during 2019, whereas the unfilled pod number was affected at all locations except YAI during 2018, and at no location in 2019. Generally, grains per pod had a negative correlation with pod number across sowing dates at all locations. At TARC in 2018, pod number and unfilled pods were highest at SD1, with no differences in filled pod number, but with significant G × SD interactions for all three traits. There were also no differences in grains per pod, 100 grain weight and grain yield per plant, though they showed G × SD interactions. This was in contrast to the results from the following year, which showed that sowing date had no effect on filled, unfilled, total pod numbers, grains per pod and grains per plant and there were no G × SD interactions. However, sowing date affected grain weight which ranged from 20.69 (SD4) to 23.65 g (SD1), though there were no G × SD interactions.
At WWAI in 2018, late sowing decreased the total number of pods, filled and unfilled pod numbers but increased number of grains per pod, but had no effect on grain weight. This was in contrast to the results from 2019, which had higher filled pod and pod numbers later in the season (SD3 and SD4). No differences were found for unfilled pod numbers in 2019, but grain weight and grains per plant were significantly different across sowing dates.
At LFS in 2018, pod numbers and unfilled pod numbers were highest in the earliest sown treatment, but no differences were found for the number of filled pods. However, the number of grains per pod increased as sowing was delayed. In 2019, this was reversed, with SD1 recording the lowest filled pod number, total pod number and grains per plant and SD2 the highest filled pod number, total pod number and grains per plant.
No significant differences were found for filled and unfilled pod numbers or grains per pod across sowing dates at YAI in 2018, although total pod number, grains per plant and grain weight were highest in SD2.

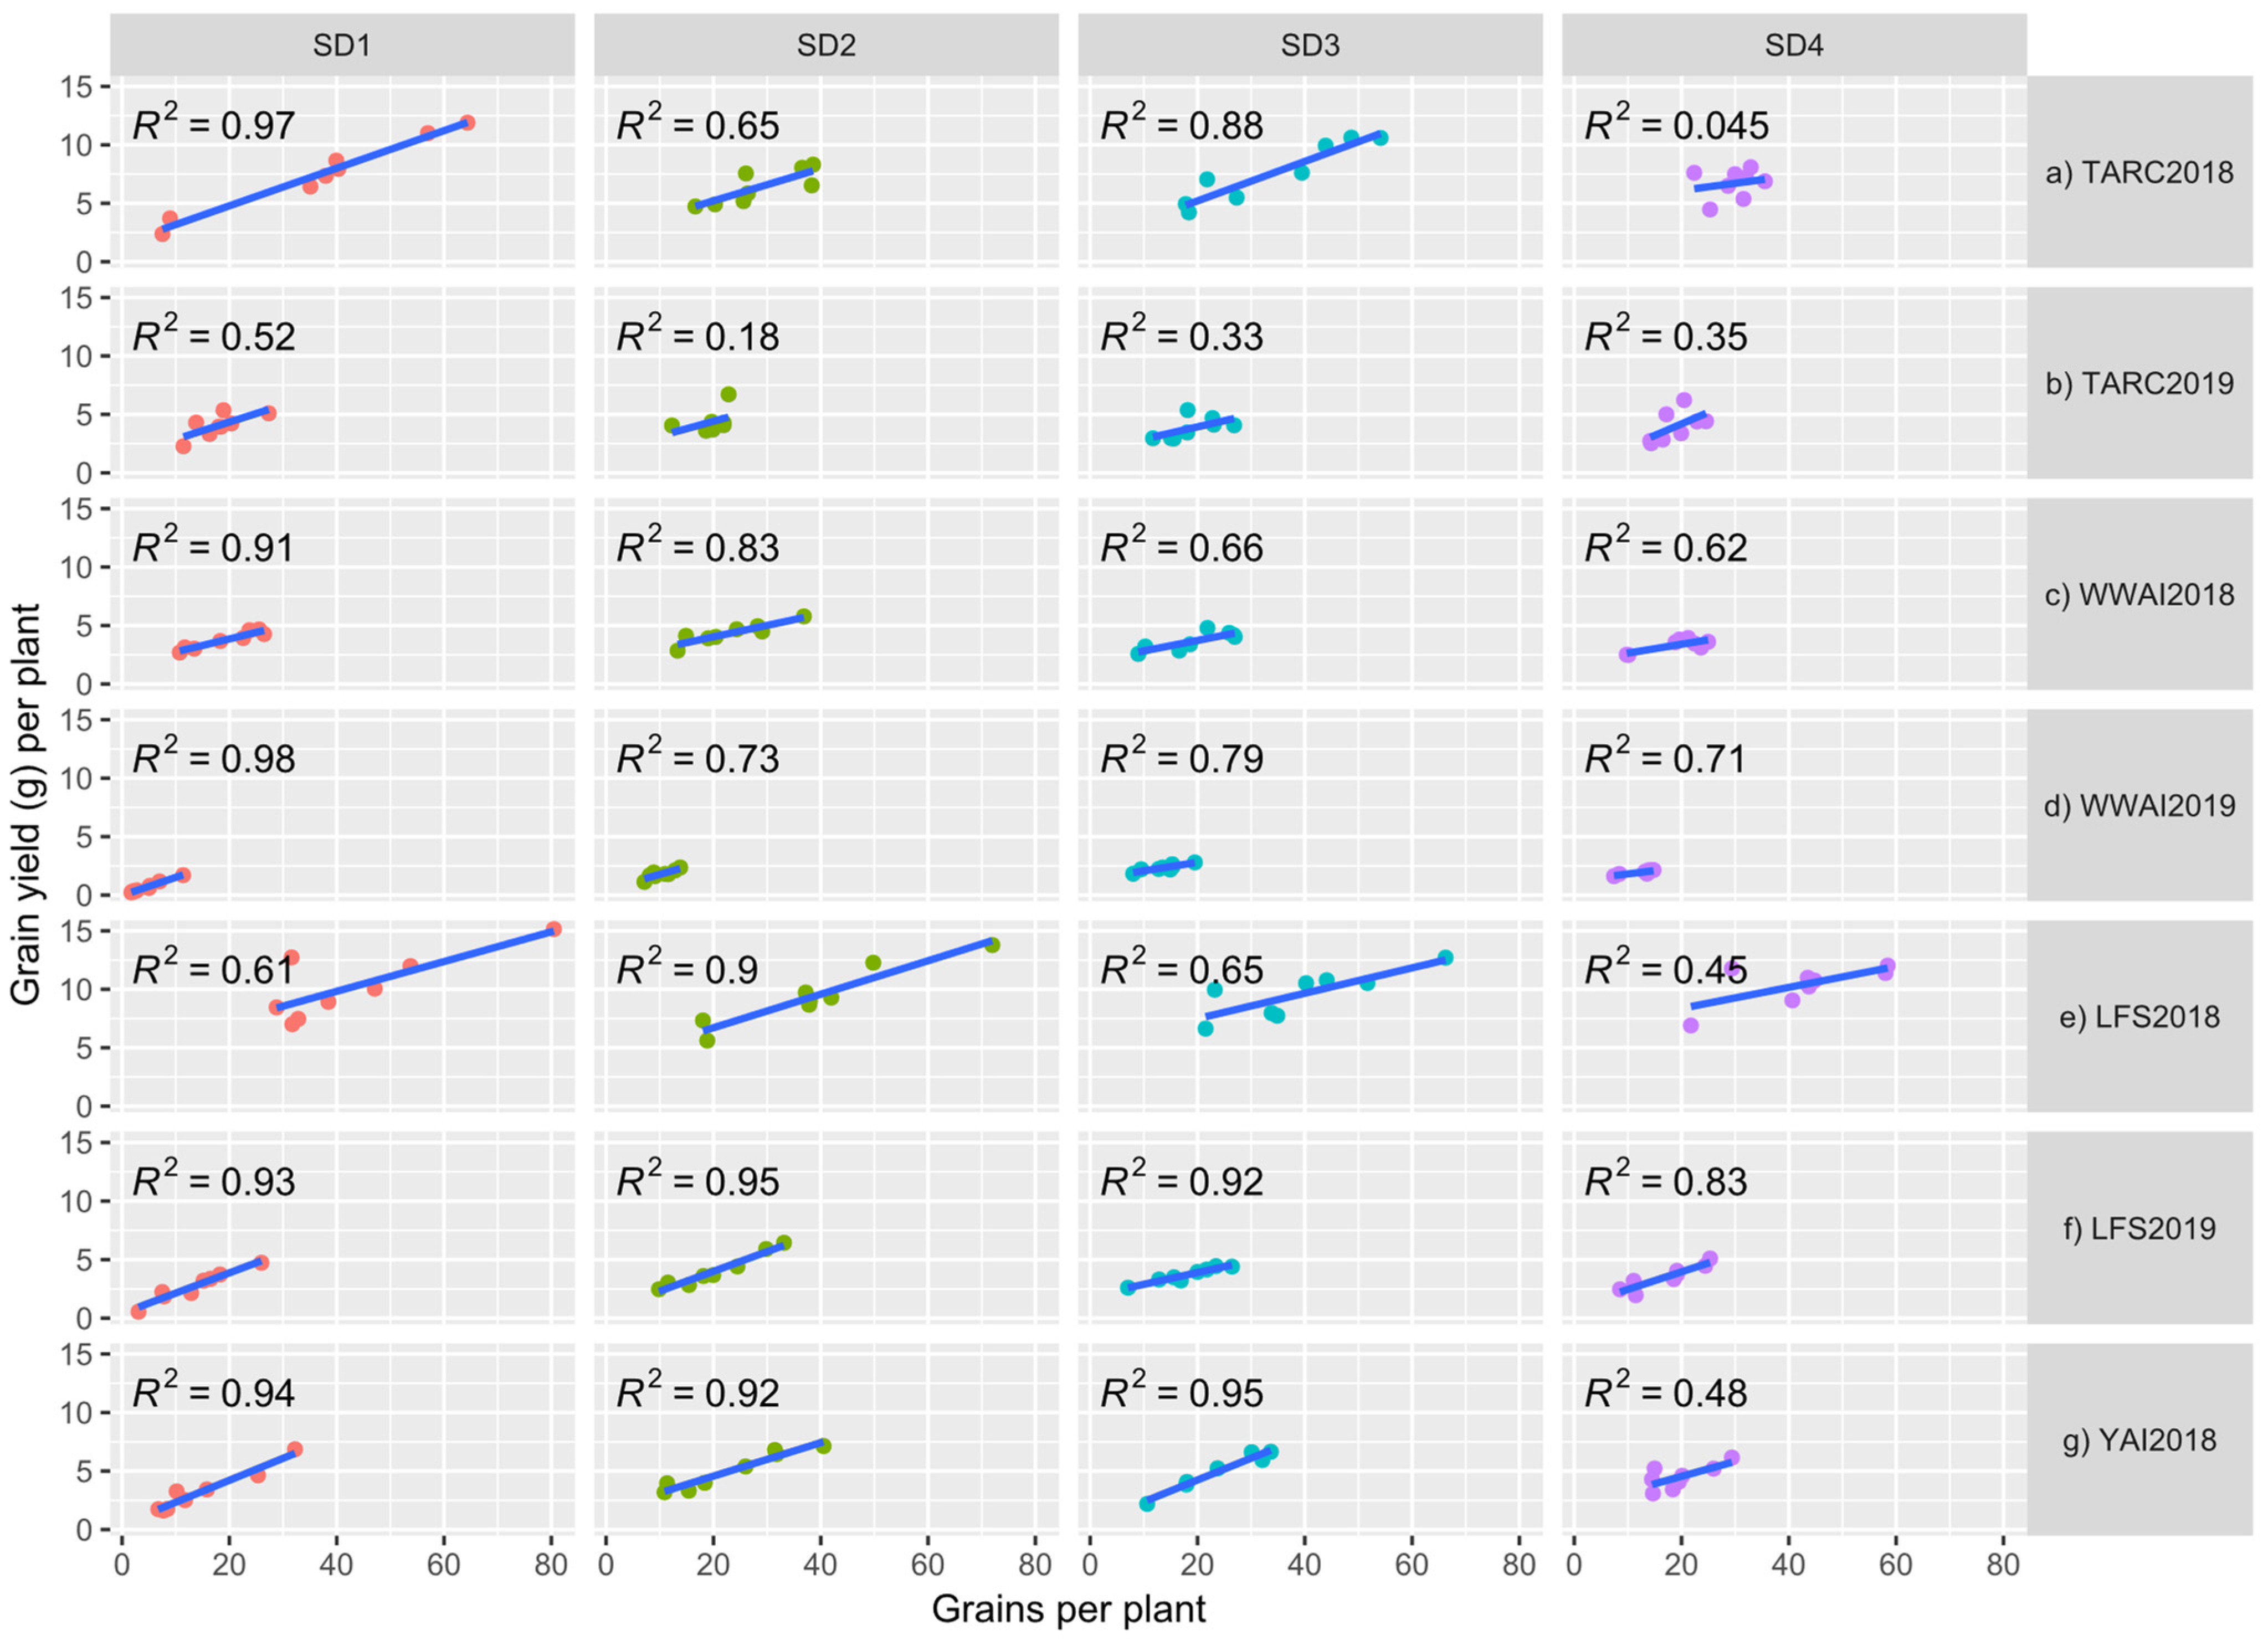
3.4. Contribution of Yield Components to Final Grain Yield

The various yield components when regressed towards final grain yield differed on their contribution on a per plant basis across experiments and sowing dates. Grain number accounted for most of the variation (84.9%), followed by pod number (78.3%), with grains per pod contributing the least (29.2%). The relationship between grain yield per plant and grain number was explored and showed positive correlations in all the experiments (Figure 1a–g). At TARC, there was a high correlation between grain number and grain yield per plant in 2018 except for SD4 (R2 = 0.045), with SD1 having R2 = 0.97 value. However, in 2019 at TARC the correlations were low with a high of R2 = 0.52 in SD1. At WWAI in both years the R2 values were large, ranging from 0.62 for SD4 in 2018 to 0.98 for SD1 in 2019. At LFS and YAI the correlations were high except for SD4 in 2018, with R2 = 0.45 and 0.48, respectively.

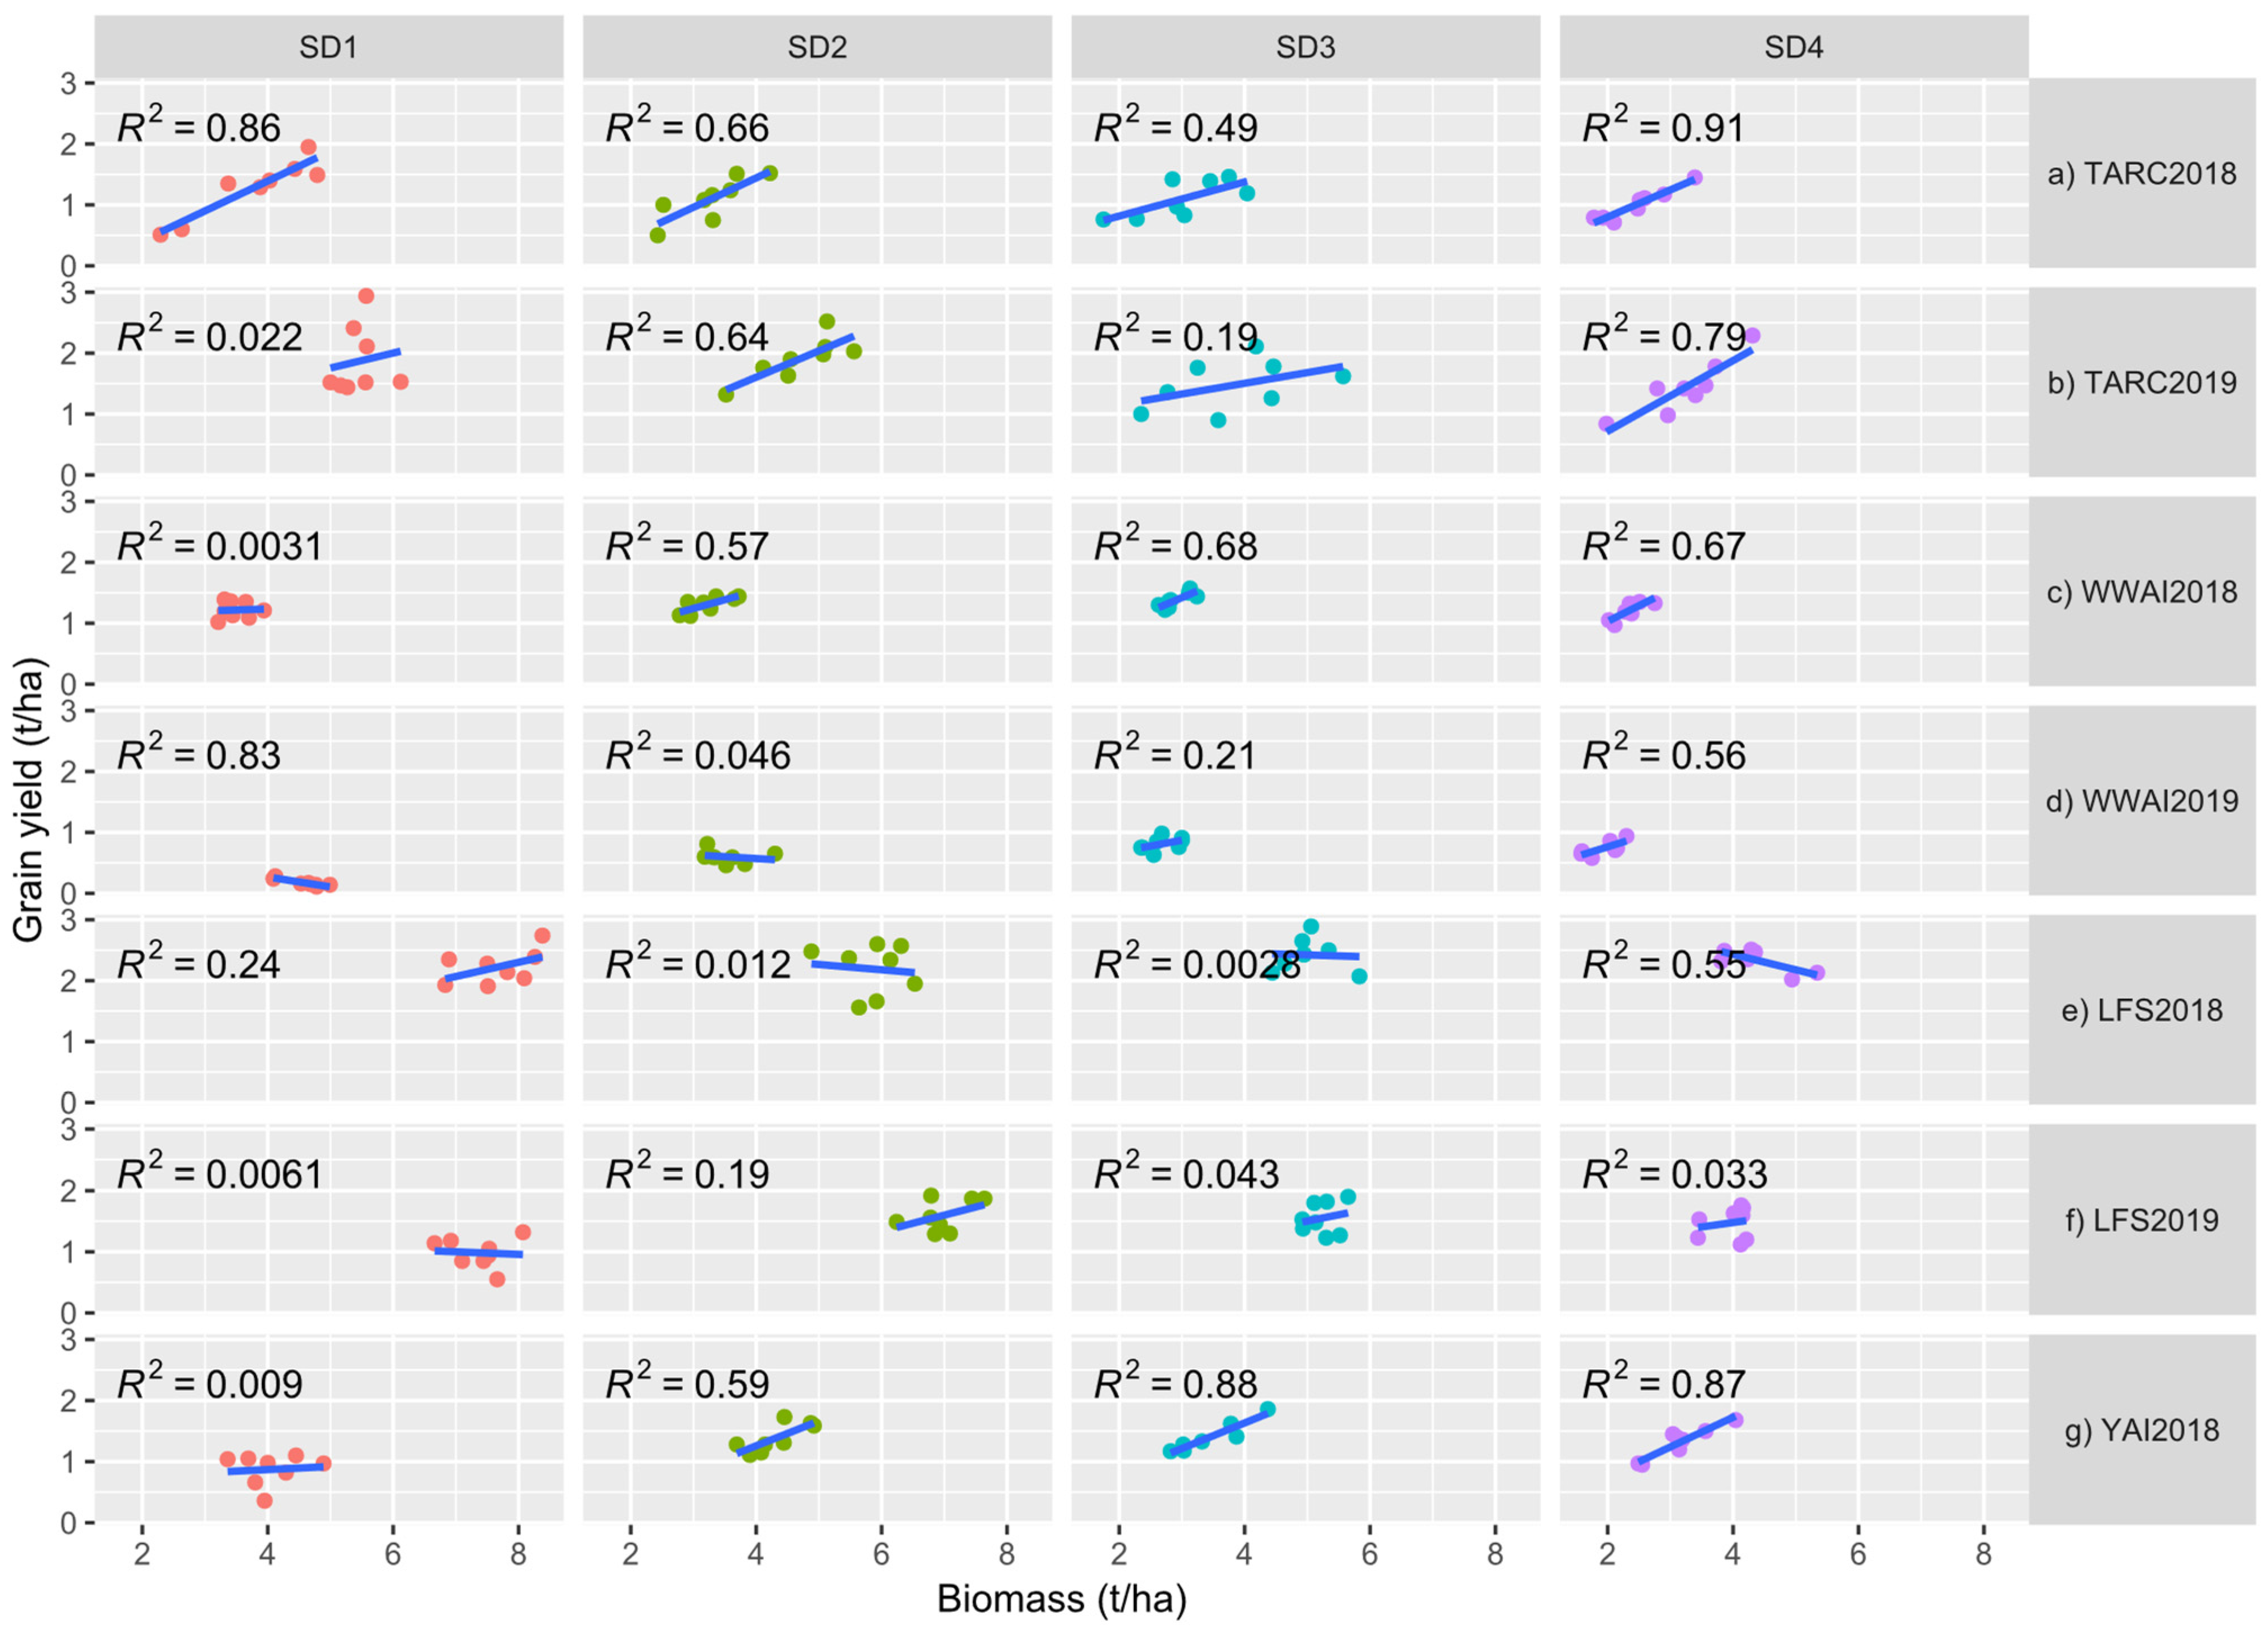
3.5. Relationship between Biomass and Grain Yield

The correlation between total biomass and grain yield was highest in the late-sown experiments (SD3 and/or SD4) in all the environments except for LFS (Figure 2a–g). Correlations were mostly positive except in WWAI2018 (SD1), WWAI2019 (SD1 and SD2) LFS2018 (SD2 and SD3) and LFS2018 (SD1) that showed negative correlation between biomass and grain yield. Correlations were generally low for LFS, which had very high biomass of up to 8 t/ha for some varieties, ranging from no correlation for SD3 in 2018 to moderately high correlation (R2 = 0.55) for SD4 in 2018.

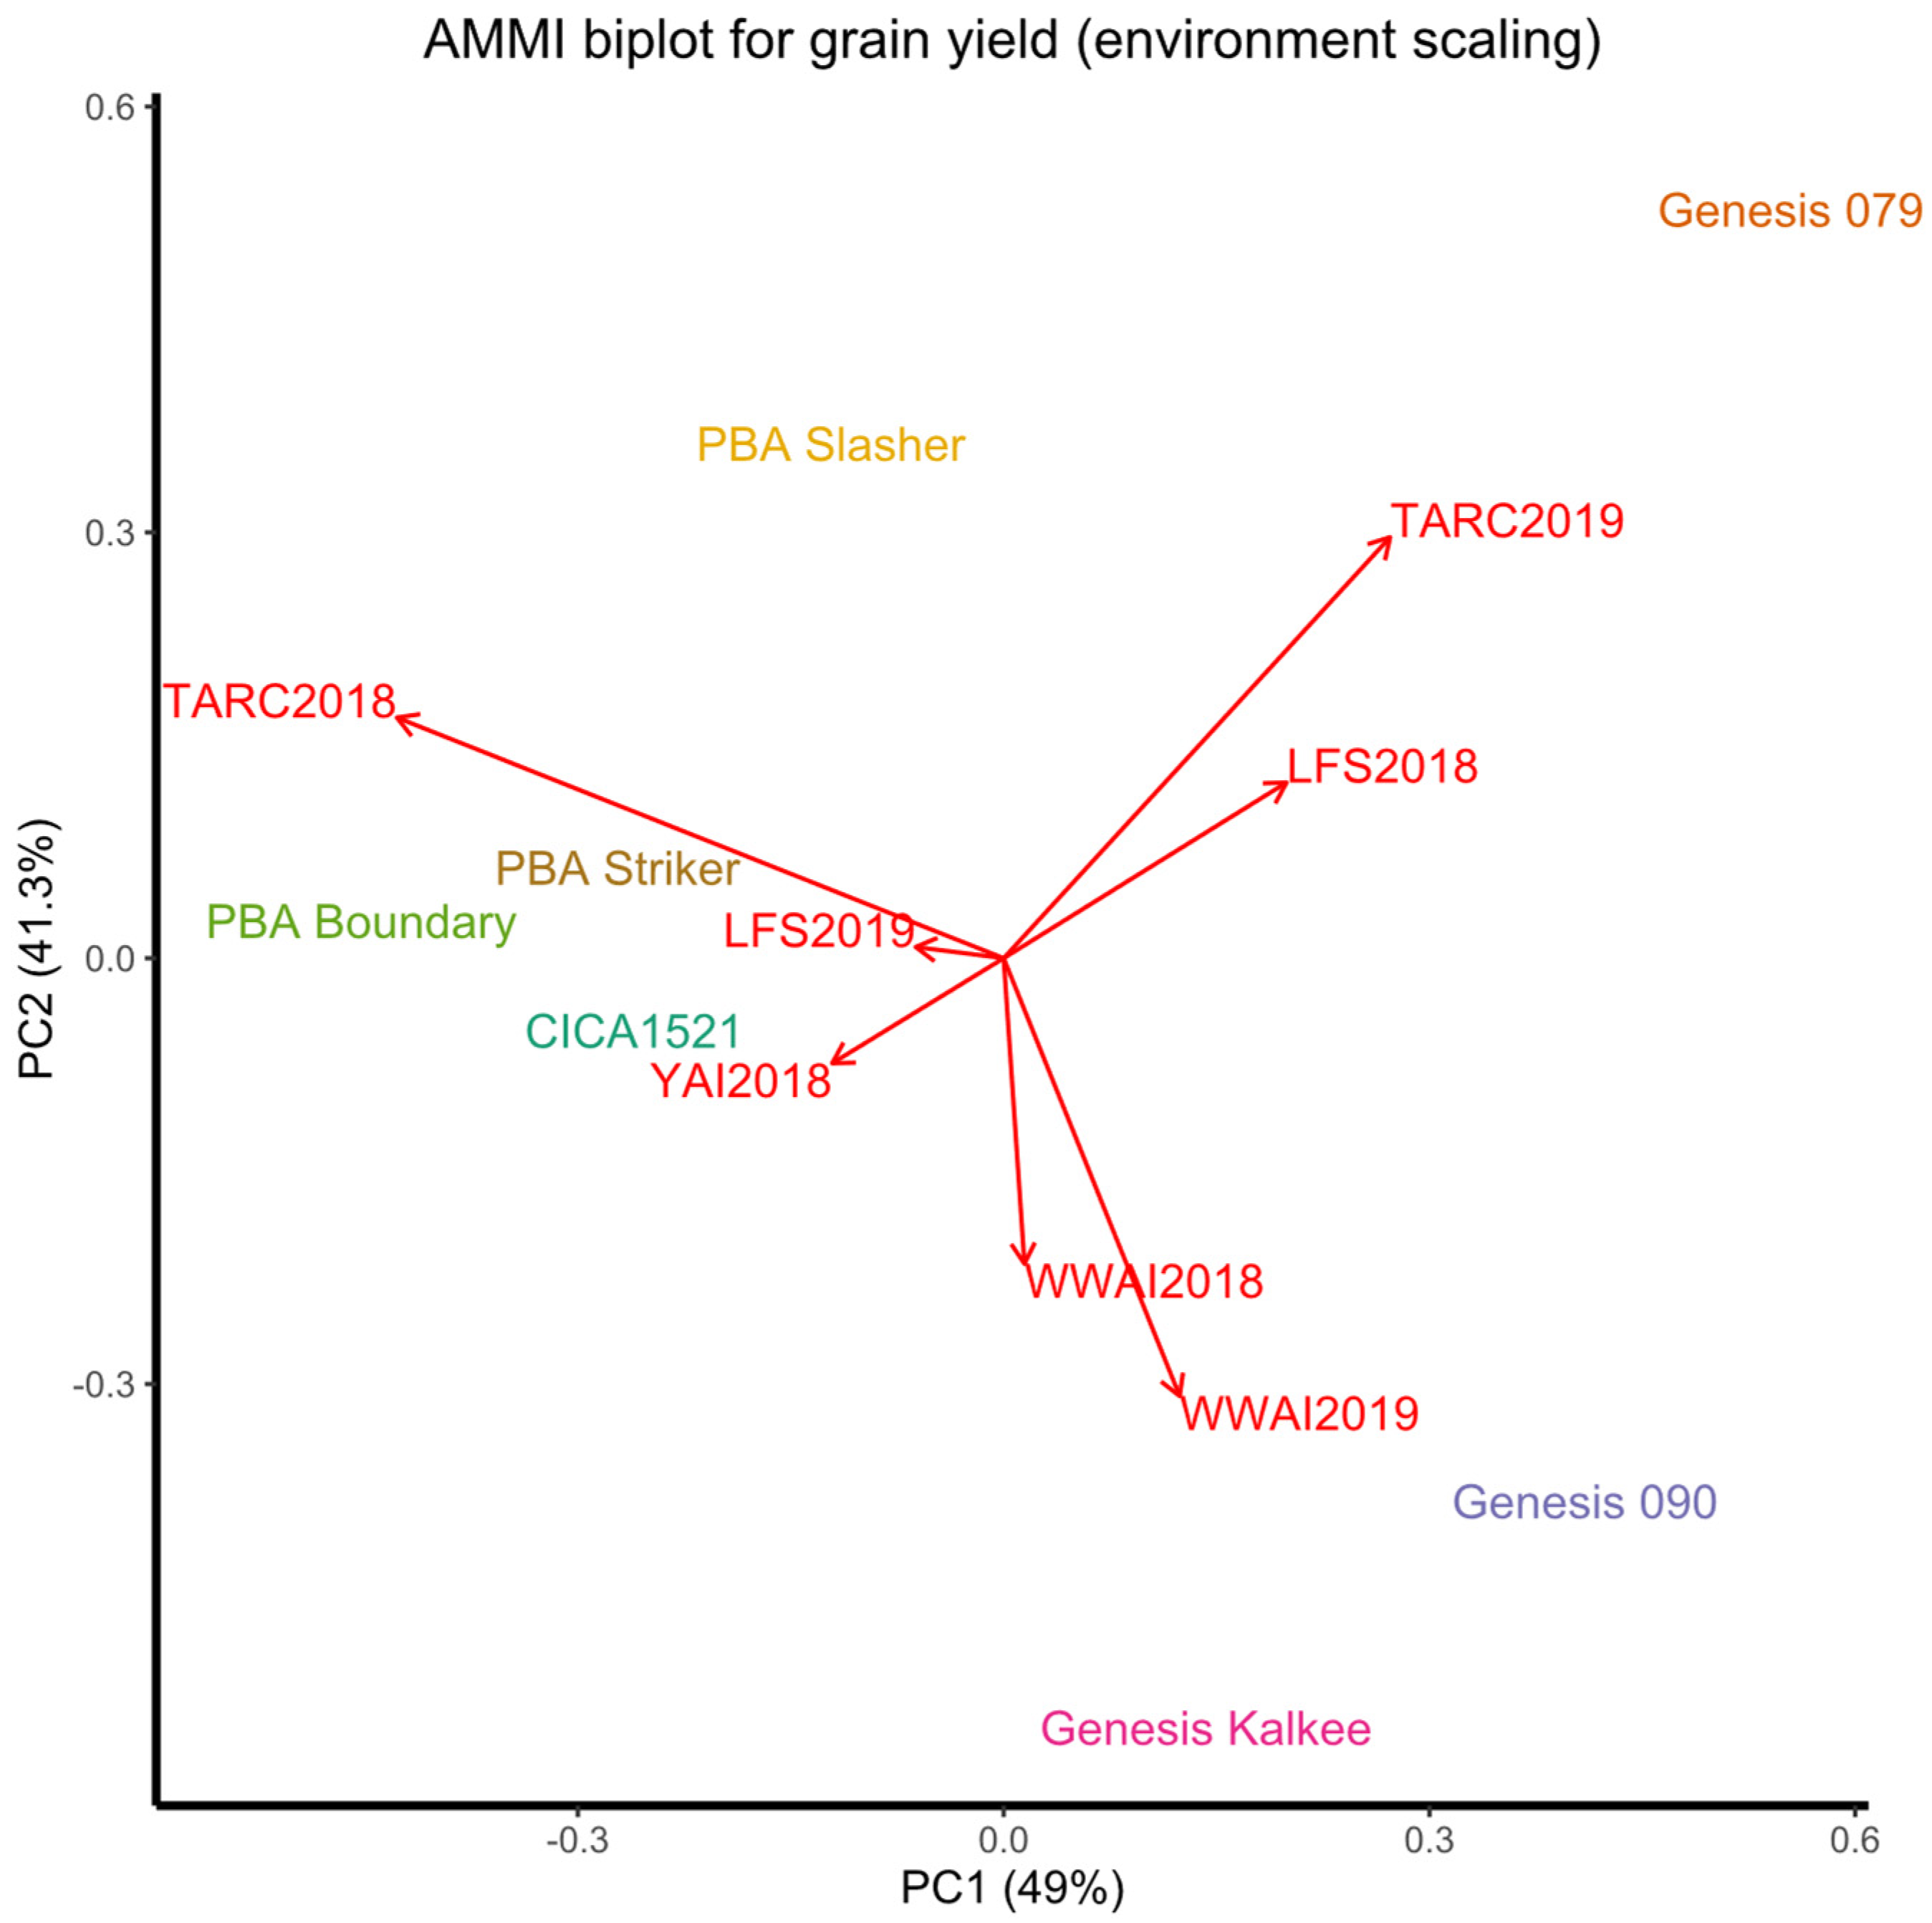
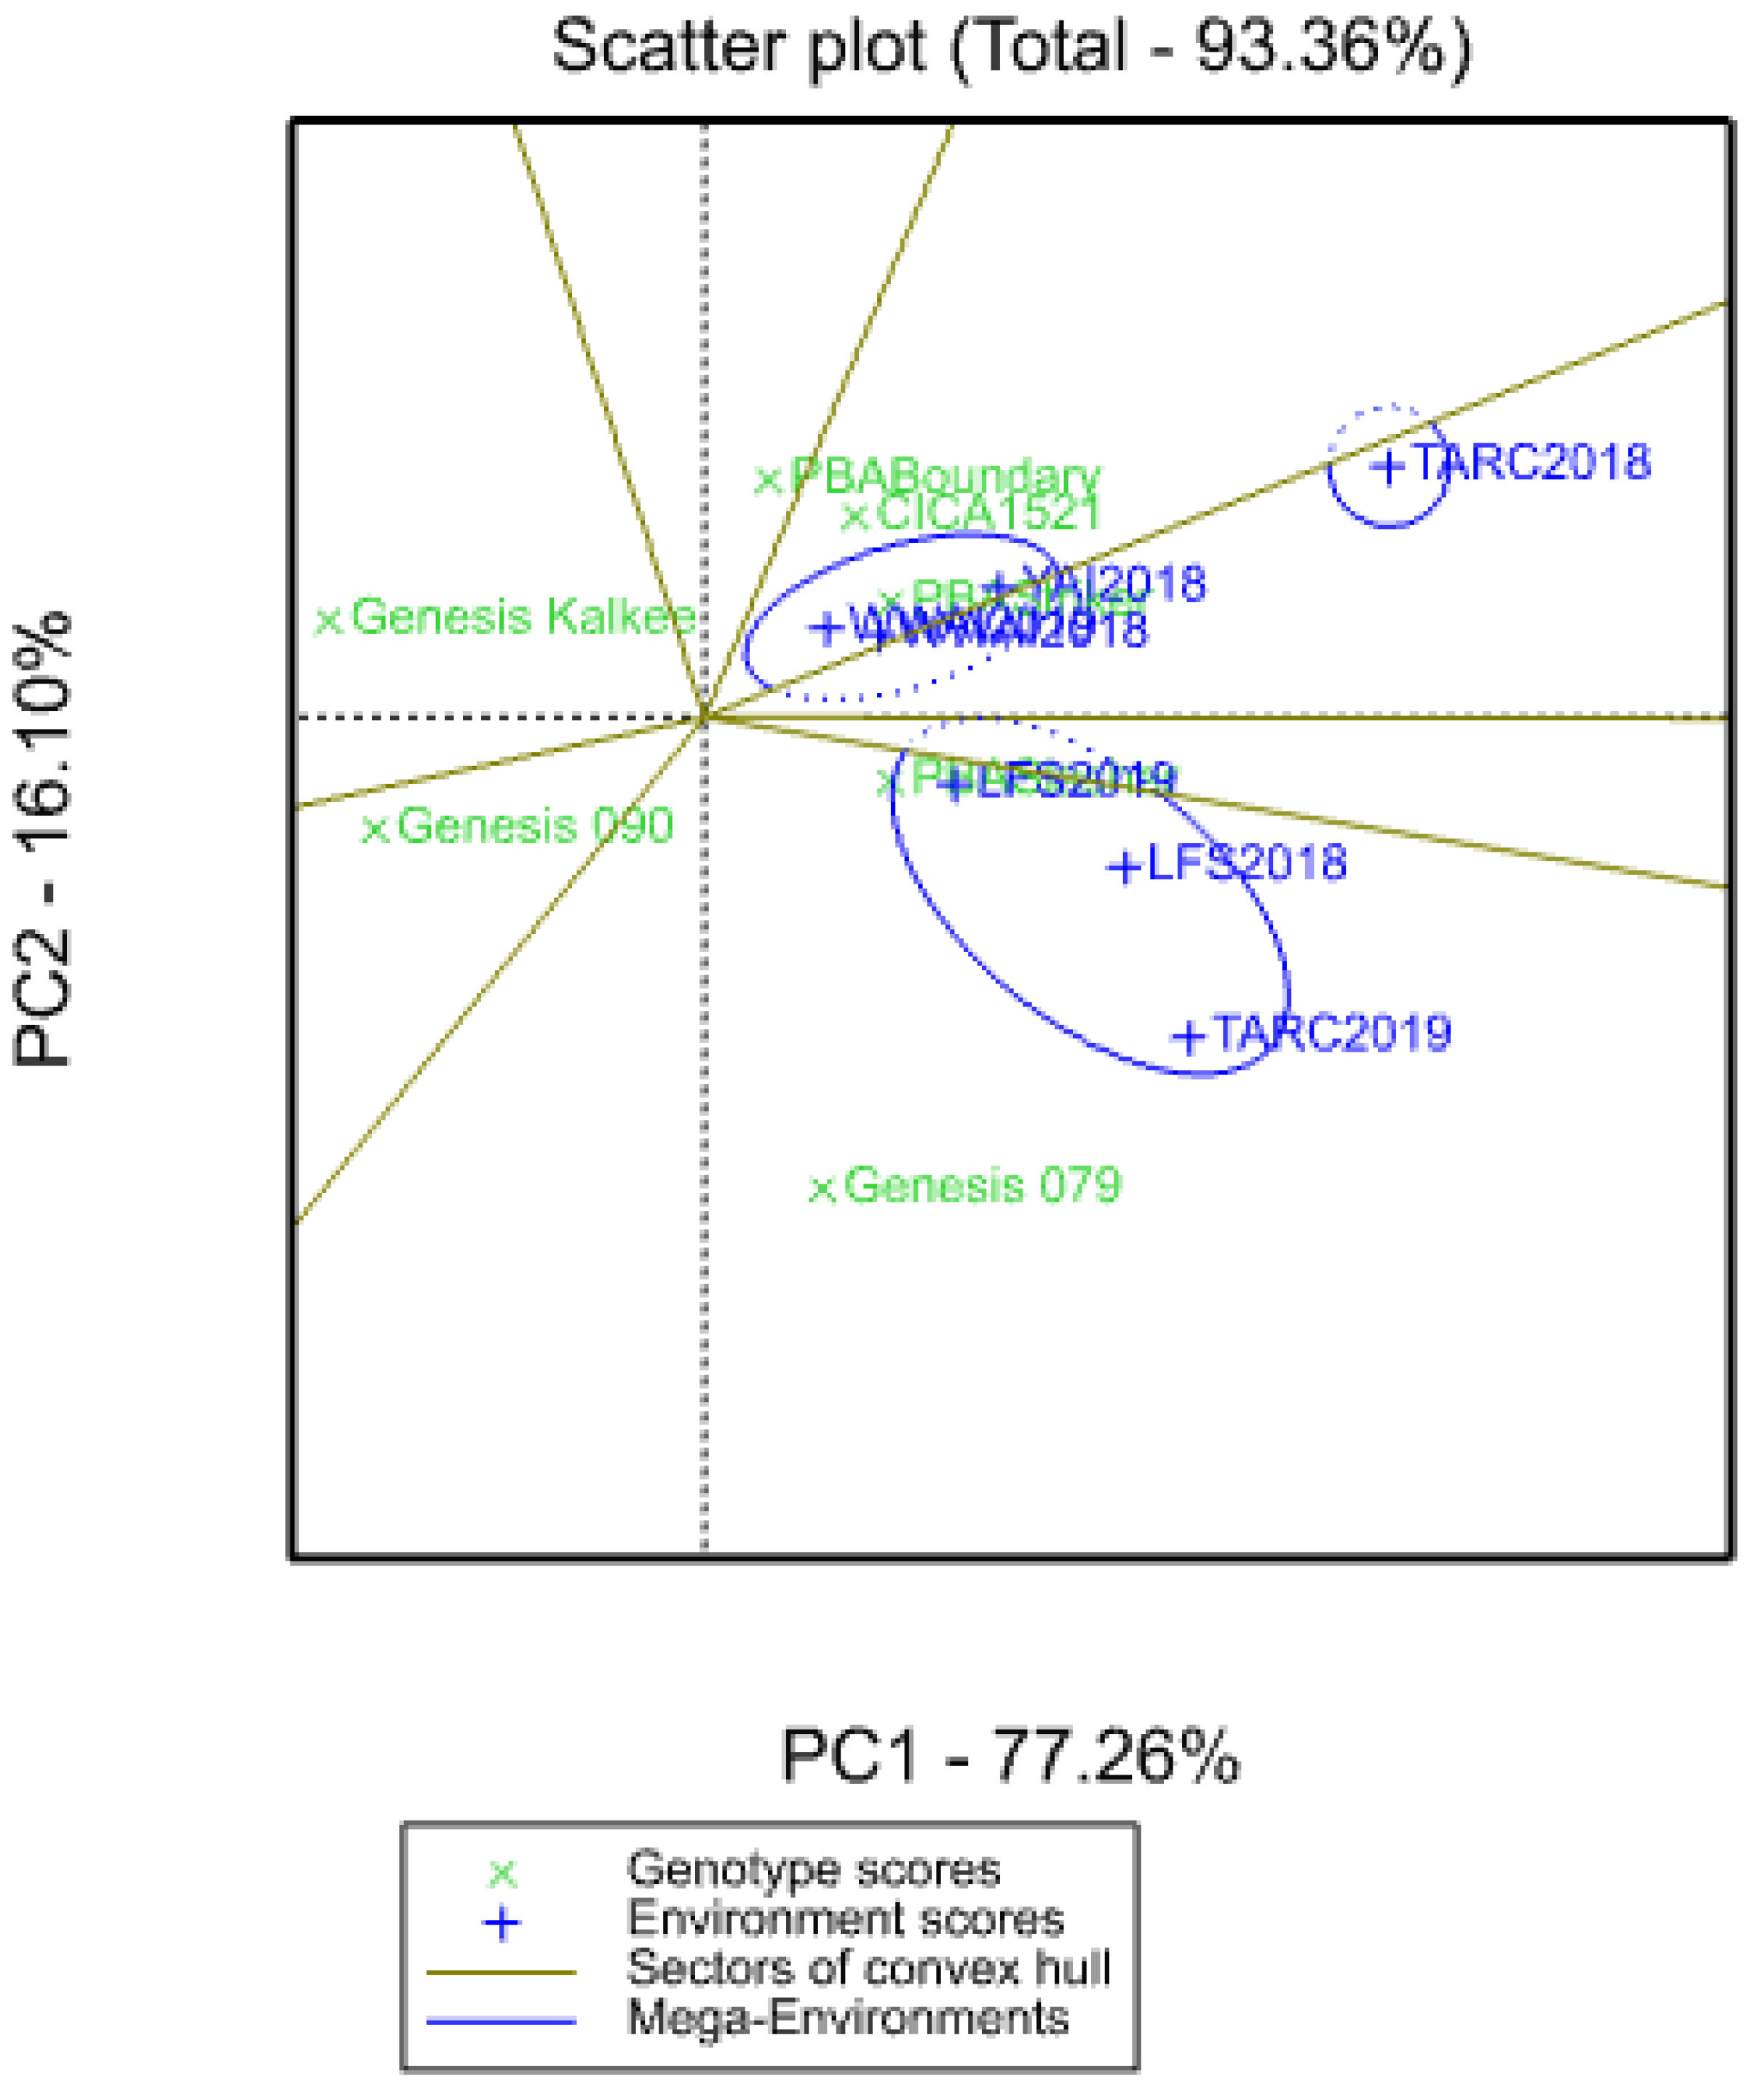
3.6. Environmental Correlations

An additive main effects and multiplicative interactions (AMMI) biplot provides a visual representation of genotype performance and environmental correlations for grain yield (Figure 3). Both PCA1 and PCA2 are significant at the 0.001 level, with the PC1 axis explaining 49% and the PC2 axis explaining 41.3% of the G × E interaction sum of squares. Together, these two principal components explained 90.3% of the G × E interaction. The genotypes did not cluster together in the AMMI biplot, but some environments did, such as WWAI2018 and WWAI2019. There was no correlation between TARC2018 with either LFS2018 or YAI2018, and a negative correlation between TARC2018 and the rest of the environments. There was a positive correlation between WWAI2018/WWAI2019 with both YAI2018 and LFS2019, and a negative one with LFS2018 and TARC2019. LFS2018 was positively corelated with TARC2019, uncorrelated with LFS2019 and TARC2018, and negatively correlated with the rest of the environments. Varieties PBA Slasher and PBA Striker were closer to the origin and GenesisTM 090 and PBA Boundary were further from the origin. Environments in southern NSW (WWAI2018/2019, LFS2018/2019 and YAI2018) were closer to the origin than the central western NSW environments (TARC2018/2019).
Southern NSW environments followed a general trend of positive interactions with GenesisTM 090 and GenesisTM Kalkee and negative interactions with PBA Striker and PBA Slasher based on the projection of genotype onto the environmental axis. The exception to this trend was LFS2018, with an inverse response for interaction for these varieties (negative interaction with GenesisTM 090 and GenesisTM Kalkee and positive interaction with PBA Striker and PBA Slasher). The only consistent interactions in the central western environment were a positive interaction with PBA Slasher, and negative interactions with GenesisTM 090 and GenesisTM Kalkee across both 2018 and 2019. Strong positive interactions were found with TARC2019 and GenesisTM 079, and WWAI2018 and WWAI2019 and GenesisTM Kalkee. Despite the differences in environment and years, the AMMI analysis demonstrated that TARC2019 and LFS2018 influenced genotypes in a similar manner.
A ‘which-won-where’ analysis divided the seven environments into three mega environments (Figure 4). TARC2018 formed one mega environment on its own (ME1); a second mega environment contained LFS2018, LFS2019 and TARC2019 (ME2); the final mega environment contained WWAI2018, WWAI2019 and YAI2018 (ME3). No variety performed well in ME1; GenesisTM 079 and PBA Slasher were the best-performing varieties in ME2; PBA Striker and PBA Captain (CICA1521) performed best in ME3. PBA Boundary, GenesisTM 090 and GenesisTM Kalkee were not suited to any specific mega environment.

4. Discussion

A wide sowing window ranging from mid-April to end of May tested the effects of sowing date on chickpea biomass accumulation and overall yield in central western and southern NSW environments. Varying sowing date to test for adaptability in new potential production areas or response to abiotic stresses is a commonly adopted approach [6,11,24,25,26]. Planting varieties at the optimum sowing time can minimise the risk of environmental stresses such as frost, heat and drought coinciding with sensitive growth phases such as flowering and podding that are critical to yield formation [20].
Genotype and sowing date were sources of variation for biomass accumulation and yield across locations and years. Previous observations have shown that abiotic stresses such as drought and heat and the resultant G × E interaction strongly influence a crop’s ability to develop and produce yields [7,27]. In our study, sowing earlier than the current regional guidelines and recommendations (SD1) resulted in taller plants and higher biomass accumulation but low harvest index, as the biomass did not translate into greater grain production. This illustrates weak source-sink relationships; the large source of biomass not being translated into grain yield, with the limitation being on the sink side of the relationship. Source-sink relationships and the subsequent remobilisation and partitioning of photo assimilates and nutrients into the developing grain influence final grain yield and narrowing of the yield gap.
Harvest index is an indicator of efficiency of converting the source organs (fully developed leaves as components of biomass) into sink organs (developing grain as components of yield) [28,29]. The low harvest index and poor correlation between biomass and grain yield (Figure 2a–g) in earlier sown treatments was caused by early sown crops consuming the limited and valuable resources such as water and nutrients during the vegetative phase and subsequently suffering moisture stress during the pod fill stage. At harvest, soil water in SD1 was lower than in SD4 (EM38 data not shown). This was most likely due to greater water use by larger plants growing over a longer season. It was previously shown that the growth duration is longer at late sowing dates in these environments [21]. However, this low correlation between biomass and grain yield was not observed at TARC in 2018 due to low plant density not using available soil water. Additionally, the dense canopy of large, high biomass early sown crops reduces light penetration and shades the lower flowers, and this has been shown to increase flower abortion in pulses [30] and therefore reduces grain number and overall yield potential.
Biomass and yield at LFS were higher than at the other experiments. The importance of water availability to yield is highlighted when comparing the LFS and YAI experiments. These experiments were only 6 km apart and had very similar weather and environmental conditions, which suggests that the 103 mm of extra supplementary irrigation was responsible for LFS accumulating more biomass and outyielding YAI by 1.06 t/ha (averaged across sowing dates). These differences in supplementary irrigation also suggest that GenesisTM 090 may be drought susceptible, as it showed visual signs of stress such as yellowing and crop wilting at the dry experiment (YAI) but not when more water was available (LFS). The regression analysis showed that grain and pod number were the highest contributors to yield. This confirms the close relationship between chickpea yield and grain number, and by inference pod number [20]. It is widely accepted that grain number is more plastic, responsive to environmental changes and easier to manipulate than grain size in most crops [14,20,31,32,33]. High grain number was due to a high proportion of filled pods, or fewer unfilled pods per plant. Unfavourable conditions such as severe frost when the crop was at sensitive growth phases could account for most of the observed unfilled pods, especially for the early sown treatments.
Generally, the desi varieties have been observed to display higher levels of tolerance to abiotic stresses such as drought and heat than the kabuli varieties [5]. In agreement with this observation, the desi varieties PBA Striker, PBA Slasher, PBA Boundary and CBA Captain were the highest-yielding varieties in all the experiments (Supplementary Tables S1–S7). The yield advantage of early flowering and maturing varieties [21] in stressful environments was observed in this study with the fast flowering and maturing PBA Striker being the highest-yielding variety at all experiment locations. This agrees with another study where short-duration genotypes outyielded long-duration ones under heat stress [11]. When sown in the optimum window, early varieties will mature before stored soil moisture is depleted and before the onset of high temperature in late spring and/or early summer, which is a common occurrence in the locations used in this study. Early flowering will increase potential yield by using stored soil water during the reproductive phase to fill grain rather than during the vegetative phase to grow biomass. Late-season heat stress can reduce the potential yield, with losses estimated to be between 10% and 15% for every degree increase in temperature above the optimum temperature range [26]. These late-season high temperatures often coincide with moisture stress, which will reduce grain yield as plants remobilise stored reserves to buffer the impact of these stresses [30]. This highlights the importance of early–mid season maturity, especially during dry years in avoiding late-season abiotic constraints.
The genotypes behaved differently across environments and demonstrated their diversity by not clustering together in the AMMI biplot (Figure 3). Varieties CBA Captain, PBA Slasher and PBA Striker are closer to the origin, which shows that they are broadly adapted and less sensitive to environmental changes, while PBA Boundary, GenesisTM Kalkee, GenesisTM 090 and GenesisTM 079 are further from the origin, which demostrates sensitivity to environmental interactions, and shows specific adaptation [34]. GenesisTM Kalkee was consistently low yielding across environments and was in a sector which does not include any specific mega environment (Figure 4). It is therefore likely not suited to the environments of central western and southern NSW, or at least not during dry years. This is possibly explained by its overall long growing season [21] which will likely expose it to late-season soil water and heat stress.
The WWAI environments clustered together and influenced genotypes in a similar way across the two years, as similar conditions and management practices were experienced and/or applied. A higher positive correlation between the WWAI environments with YAI2018 might partly be because of similar dry conditions, while correlation with both YAI2018 and LFS2019 might also be due to similar climatic conditions because of geographic proximity. However, lack of correlation with LFS2018 demonstrates that other confounding factors such as irrigation, beyond climatic conditions and geographic proximity, also had an effect. Differences between experiments are due to the diverse range of climates including altitudes, watering regimes and soil types in the experimental locations. Year-on-year variation was observed at TARC, where TARC2018 did not cluster with any environment, including TARC2019, and formed its own mega environment (ME1). No variety performing well in ME1. Dry conditions at TARC in 2018 created challenges with establishment and overall plant density and this could have made this environment unique and unrelated to TARC2019, which was in the same mega environment as the LFS environments. TARC2019, like LFS2018 and LFS2019, received a significant amount of irrigation (175 and 87 mm pre- and post-sowing, respectively) and this limited moisture stress might have driven the similarities. This was possibly the case with the clustering of the WWAI and YAI experiments as these received minimal irrigation during the season. At the other locations, the year-on-year variation was minimal as the LFS and WWAI experiments fell into the same mega environments across the two years. However, this study demonstrates the importance and need to take year-on-year variation into consideration when interpreting multi-year field studies.

5. Conclusions

The 2018 and 2019 seasons in southern and central western NSW were very challenging for growing chickpea due to low growing season rainfall. This study identifies mid to the end of May as the optimum sowing time for chickpea in southern and central western NSW agroecological zones, and pod and grain numbers as major drivers of yield and overall adaptation. Sowing at this time maximises potential yield by increasing the probability of avoiding/escaping stressful events such as winter frosts and late-season drought and heat stress during critical growth phases. Harvest index was higher in smaller, late-sown plants, indicating that when combined with early maturity they may have a competitive advantage in water-limited environments. Given the indeterminate growth habit of chickpea, the low harvest index and poor correlation between biomass and grain yield observed in this study might not be as pronounced under more favourable seasonal conditions. Moisture was important in environmental classifications, with the more irrigated experiments (LFS2018, LFS2019 and TARC2019) falling into the same mega environment. Similarly, the environments with limited irrigation (YAI2018, WWAI2018, and WWAI2019) clustered together. The results of this study indicate a need for more multi-environmental studies on chickpeas under Australian conditions to draw more detailed inferences and comparisons.

Supplementary Materials

The following supporting information can be downloaded at: https://www.mdpi.com/article/10.3390/agronomy12010160/s1, Supplementary Figure S1a: Trangie Agricultural Station climate 2018, Figure S1b: Trangie Ag-ricultural Research Centre climate 2019, Figure S1c: Wagga Wagga Agricultural Institute climate 2018, Figure S1d: Wagga Wagga Agricultural Institute climate 2019 (Supplementary Figure S1d), Figure S1e: Leeton Field Station and Yanco Agricultural Institute climate 2018, Figure S1f: Leeton Field Station climate 2019. Table S1: ST1_TARC_2018, Table S2: ST2_TARC_2019, Table S3: ST3_ WWAI_2018, Table S4: ST4_WWAI_2019, Table S5: ST5_LFS_2018, Table S6: ST6_LFS_2019, Table S7: ST7_YAI_2018. Supplementary Tables S1–S7.xlsx.

Author Contributions

M.F.R. conceived the topic, acquired the funding, and oversaw the whole study including coordinating data collection. A.L.P. and L.M. collected and analysed data; M.F.R. designed the experiment; M.F.R., A.L.P. and L.M. wrote the manuscript. All authors contributed to editing, revision and approval of the manuscript. All authors have read and agreed to the published version of the manuscript.

Funding

This research was a joint investment between the NSW Department of Primary Industries and Grains Research and Development Corporation (GRDC) under the Grains Agronomy and Pathology Partnership (GAPP), with project title, ‘The adaptation of profitable pulses in the central and southern zones of the northern grains region’. Project code: BLG112, March 2018 to June 2020, awarded to MFR.

Acknowledgments

We thank Tony Napier, Leigh Jenkins and their technical staff at the Yanco Agricultural Institute and Trangie Agricultural Research Centre respectively, for their assistance in conducting and maintaining experiments. Also, thank you to Iain Hume, Muhuddin Anwar and Tania Moore for providing useful comments and edits.

Conflicts of Interest

The authors declare no conflict of interest. The funders had no role in the design of the study; in the collection, analyses or interpretation of data; in the writing of the manuscript or in the decision to publish the results.

References

  1. Jukanti, A.K.; Gaur, P.M.; Gowda, C.L.L.; Chibbar, R.N. Nutritional quality and health benefits of chickpea (Cicer arietinum L.): A review. Brit. J. Nutr. 2012, 108, 11–26. [Google Scholar] [CrossRef] [Green Version]
  2. Bampidis, V.A.; Christodoulou, V. Chickpeas (Cicer arietinum L.) in animal nutrition: A review. Anim. Feed Sci. Technol. 2011, 168, 1–20. [Google Scholar] [CrossRef]
  3. FAOSTAT. 2020. Available online: https://faostat.fao.org/faostat/ (accessed on 14 November 2021).
  4. Croser, J.S.; Clarke, H.J.; Siddique, K.H.M.; Khan, T.N. Low-temperature stress: Implications for chickpea (Cicer arietinum L.) improvement. Crit. Rev. Plant Sci. 2003, 22, 185–219. [Google Scholar] [CrossRef]
  5. Gaur, P.M.; Samineni, S.; Thudi, M.; Tripathi, S.; Sajja, S.B.; Jayalakshmi, V.; Mannur, D.M.; Vijayakumar, A.G.; Ganga Rao, N.V.P.R.; Ojiewo, C.; et al. Integrated breeding approaches for improving drought and heat adaptation in chickpea (Cicer arietinum L.). Plant Breed. 2019, 138, 389–400. [Google Scholar] [CrossRef] [Green Version]
  6. Sadras, V.; Dreccer, M.F. Adaptation of wheat, barley, canola, field pea and chickpea to the thermal environments of Australia. Crop Pasture Sci. 2015, 66, 1137–1150. [Google Scholar] [CrossRef]
  7. Berger, J.D.; Turner, N.C.; Siddique, K.H.M.; Knights, E.J.; Brinsmead, R.B.; Mock, I.; Edmondson, C.; Khan, T.N. Genotype by environment studies across Australia reveal the importance of phenology for chickpea (Cicer arietinum L.) improvement. Aust. J. Agric. Res. 2004, 55, 1071–1084. [Google Scholar] [CrossRef]
  8. Clarke, H.J.; Siddique, K.H.M. Response of chickpea genotypes to low temperature stress during reproductive development. Field Crops Res. 2004, 90, 323–334. [Google Scholar] [CrossRef]
  9. Devasirvatham, V.; Gaur, P.M.; Mallikarjuna, N.; Raju, T.N.; Trethowan, R.M.; Tan, D.K.Y. Reproductive biology of chickpea response to heat stress in the field is associated with the performance in controlled environments. Field Crops Res. 2013, 142, 9–19. [Google Scholar] [CrossRef] [Green Version]
  10. Devasirvatham, V.; Gaur, P.M.; Mallikarjuna, N.; Tokachichu, R.N.; Trethowan, R.M.; Tan, D.K.Y. Effect of high temperature on the reproductive development of chickpea genotypes under controlled environments. Funct. Plant Biol. 2012, 39, 1009–1018. [Google Scholar] [CrossRef] [Green Version]
  11. Devasirvatham, V.; Gaur, P.M.; Raju, T.N.; Trethowan, R.M.; Tan, D.K.Y. Field response of chickpea (Cicer arietinum L.) to high temperature. Field Crops Res. 2015, 172, 59–71. [Google Scholar] [CrossRef] [Green Version]
  12. Devasirvatham, V.; Tan, D.K.Y.; Gaur, P.M.; Raju, T.N.; Trethowan, R.M. High temperature tolerance in chickpea and its implications for plant improvement. Crop Pasture Sci. 2012, 63, 419–428. [Google Scholar] [CrossRef] [Green Version]
  13. Gaur, P.M.; Jukanti, A.K.; Varshney, R.K. Impact of genomic technologies on chickpea breeding strategies. Agronomy 2012, 2, 199–221. [Google Scholar] [CrossRef] [Green Version]
  14. Sadras, V.O.; Slafer, G.A. Environmental modulation of yield components in cereals: Heritabilities reveal a hierarchy of phenotypic plasticities. Field Crops Res. 2012, 127, 215–224. [Google Scholar] [CrossRef]
  15. Wood, J.A.; Knights, E.J.; Harden, S.; Hobson, K.B. Seed quality and the effect of introducing Cicer echinospermum to improve disease and pest resistance in desi chickpea. Legum. Sci. 2019, 1, e22. [Google Scholar] [CrossRef]
  16. Pushpavalli, R.; Berger, J.D.; Turner, N.C.; Siddique, K.H.M.; Colmer, T.D.; Vadez, V. Cross-tolerance for drought, heat and salinity stresses in chickpea (Cicer arietinum L.). J. Agron. Crop Sci. 2020, 206, 405–419. [Google Scholar] [CrossRef]
  17. Tricker, P.J.; ElHabti, A.; Schmidt, J.; Fleury, D. The physiological and genetic basis of combined drought and heat tolerance in wheat. J. Exp. Bot. 2018, 69, 3195–3210. [Google Scholar] [CrossRef] [PubMed] [Green Version]
  18. Maphosa, L.; Richards, M.F.; Norton, S.L.; Nguyen, G.N. Breeding for abiotic stress adaptation in chickpea (Cicer arietinum L.): A comprehensive review. Crop Breed. Genet. Genom. 2020, 2, e200015. [Google Scholar] [CrossRef]
  19. Shunmugam, A.S.K.; Kannan, U.; Jiang, Y.; Daba, K.A.; Gorim, L.Y. Physiology based approaches for breeding of next-generation food legumes. Plants 2018, 7, 72. [Google Scholar] [CrossRef] [Green Version]
  20. Lake, L.; Sadras, V.O. The critical period for yield determination in chickpea (Cicer arietinum L.). Field Crop Res. 2014, 168, 1–7. [Google Scholar] [CrossRef]
  21. Richards, M.F.; Preston, A.L.; Napier, T.; Jenkins, L.; Maphosa, L. Sowing date affects the timing and duration of key chickpea (Cicer arietinum L.) growth phases. Plants 2020, 9, 1257. [Google Scholar] [CrossRef]
  22. Rebetzke, G.J.; Fischer, R.A.; van Herwaarden, A.F.; Bonnett, D.G.; Chenu, K.; Rattey, A.R.; Fettell, N.A. Plot size matters: Interference from intergenotypic competition in plant phenotyping studies. Funct. Plant Biol. 2014, 41, 107–118. [Google Scholar] [CrossRef] [PubMed]
  23. VSN International. Genstat for Windows, 20th ed.; VSN International: Hemel Hempstead, UK, 2019; Available online: https://vsni.co.uk/software/genstat (accessed on 20 May 2021).
  24. Canci, H.; Toker, C. Evaluation of yield criteria for drought and heat resistance in chickpea (Cicer arietinum L.). J. Agron. Crop Sci. 2009, 195, 47–54. [Google Scholar] [CrossRef]
  25. Krishnamurthy, L.; Gaur, P.M.; Basu, P.S.; Chaturvedi, S.K.; Tripathi, S.; Vadez, V.; Rathore, A.; Varshney, R.K.; Gowda, C.L.L. Large genetic variation for heat tolerance in the reference collection of chickpea (Cicer arietinum L.) germplasm. Plant Genet. Resour. 2011, 9, 59–69. [Google Scholar] [CrossRef] [Green Version]
  26. Upadhyaya, H.D.; Dronavalli, N.; Gowda, C.L.L.; Singh, S. Identification and evaluation of chickpea germplasm for tolerance to heat stress. Crop Sci. 2011, 51, 2079–2094. [Google Scholar] [CrossRef] [Green Version]
  27. Parent, B.; Bonneau, J.; Maphosa, L.; Kovalchuk, A.; Langridge, P.; Fleury, D. Quantifying wheat sensitivities to environmental constraints to dissect genotype × environment interactions in the field. Plant Physiol. 2017, 174, 1669. [Google Scholar] [CrossRef] [PubMed]
  28. Roorkiwal, M.; Jain, A.; Kale, S.M.; Doddamani, D.; Chitikineni, A.; Thudi, M.; Varshney, R.K. Development and evaluation of high-density Axiom((R)) CicerSNP Array for high-resolution genetic mapping and breeding applications in chickpea. Plant Biotechnol. J. 2018, 16, 890–901. [Google Scholar] [CrossRef] [Green Version]
  29. Smith, M.R.; Rao, I.M.; Merchant, A. Source-Sink Relationships in crop plants and their influence on yield development and nutritional quality. Front. Plant Sci. 2018, 9, 1889. [Google Scholar] [CrossRef] [Green Version]
  30. Manning, B.K.; Adhikari, K.N.; Trethowan, R. Impact of sowing time, genotype, environment and maturity on biomass and yield components in faba bean (Vicia faba). Crop Pasture Sci. 2020, 71, 147–154. [Google Scholar] [CrossRef]
  31. Ramamoorthy, P.; Lakshmanan, K.; Upadhyaya, H.D.; Vadez, V.; Varshney, R.K. Shoot traits and their relevance in terminal drought tolerance of chickpea (Cicer arietinum L.). Field Crop Res. 2016, 197, 10–27. [Google Scholar] [CrossRef] [Green Version]
  32. Ramamoorthy, P.; Lakshmanan, K.; Upadhyaya, H.D.; Vadez, V.; Varshney, R.K. Root traits confer grain yield advantages under terminal drought in chickpea (Cicer arietinum L.). Field Crop Res. 2017, 201, 146–161. [Google Scholar] [CrossRef] [Green Version]
  33. Slafer, G.A.; Savin, R.; Sadras, V.O. Coarse and fine regulation of wheat yield components in response to genotype and environment. Field Crop Res. 2014, 157, 71–83. [Google Scholar] [CrossRef]
  34. Malosetti, M.; Ribaut, J.-M.; van Eeuwijk, F.A. The statistical analysis of multi-environment data: Modeling genotype-by-environment interaction and its genetic basis. Front. Physiol. 2013, 4, 44. [Google Scholar] [CrossRef] [PubMed] [Green Version]
Figure 1. (ag) Relationship of grain number per plant with grain yield (g/plant) at four sowing dates (SD) at Trangie (TARC), Wagga Wagga (WWAI), Leeton (LFS) and Yanco (YAI) during 2018 and 2019. (a) TARC2018; (b) TARC2019; (c) WWAI2018; (d) WWAI2019; (e) LFS2018; (f) LFS2019; (g) YAI2018. TARC18 = Trangie Agricultural Research Centre 2018 experiment; TARC19 = Trangie Agricultural Research Centre 2019 experiment; WWAI18 = Wagga Wagga Agricultural Institute 2018 experiment; WWAI19 = Wagga Wagga Agricultural Institute 2019 experiment; LFS18 = Leeton Field Station 2018 experiment; LFS19 = Leeton Field Station 2019 experiment; and YAI18 = Yanco Agricultural Institute 2018 experiment.
Agronomy 12 00160 g001
Figure 2. (ag) Relationship of total above biomass (t/ha) with grain yield (t/ha) at four sowing dates (SD) at Trangie (TARC), Wagga Wagga (WWAI), Leeton (LFS) and Yanco (YAI) during 2018 and 2019. (a) TARC2018; (b) TARC2019; (c) WWAI2018; (d) WWAI2019; (e) LFS2018; (f) LFS2019; (g) YAI2018. TARC18 = Trangie Agricultural Research Centre 2018 experiment; TARC19 = Trangie Agricultural Research Centre 2019 experiment; WWAI18 = Wagga Wagga Agricultural Institute 2018 experiment; WWAI19 = Wagga Wagga Agricultural Institute 2019 experiment; LFS18 = Leeton Field Station 2018 experiment; LFS19 = Leeton Field Station 2019 experiment; YAI18 = Yanco Agricultural Institute 2018 experiment.
Agronomy 12 00160 g002
Figure 3. AAMI biplot for grain yield showing the correlation between environments and overall genotype stability and adaptability. At origin GEI = 0. Acute angle = positive correlation; right angle = no correlation and obtuse angle = negative correlation. TARC18 = Trangie Agricultural Research Centre 2018 experiment; TARC19 = Trangie Agricultural Research Centre 2019 experiment; WWAI18 = Wagga Wagga Agricultural Institute 2018 experiment; WWAI19 = Wagga Wagga Agricultural Institute 2019 experiment; LFS18 = Leeton Field Station 2018 experiment; LFS19 = Leeton Field Station 2019 experiment; and YAI18 = Yanco Agricultural Institute 2018 experiment.
Agronomy 12 00160 g003
Figure 4. GGE biplot for grain yield showing different vectors and three mega environments and variety performance in the respective vectors and mega environments. The overlapping environments in ME3 are YAI2018, WWAI2019 and WWAI2019. TARC18 = Trangie Agricultural Research Centre 2018 experiment; TARC19 = Trangie Agricultural Research Centre 2019 experiment; WWAI18 = Wagga Wagga Agricultural Institute 2018 experiment; WWAI19 = Wagga Wagga Agricultural Institute 2019 experiment; LFS18 = Leeton Field Station 2018 experiment; LFS19 = Leeton Field Station 2019 experiment; and YAI18 = Yanco Agricultural Institute 2018 experiment.
Agronomy 12 00160 g004
Table 1. Rainfall, supplementary irrigation, minimum (min) and maximum (max) temperatures recorded in 2018 and 2019. TARC18 = Trangie Agricultural Research Centre 2018 experiment; WWAI18 = Wagga Wagga Agricultural Institute 2018 experiment; LFS18 = Leeton Field Station 2018 experiment; YAI18 = Yanco Agricultural Institute 2018 experiment; TARC19 = Trangie Agricultural Research Centre 2019 experiment; WWAI19 = Wagga Wagga Agricultural Institute 2019 experiment; and LFS19 = Leeton Field Station 2019 experiment.
Experiment JanFeb MarAprMayJunJulAugSepOctNovDec
TARC18Rainfall (mm)26.2137.8314.227.20.823.89.2595028.8
Irrigation (mm)00401530020200000
Min Temp. (°C)20.619.117.514.77.45.52.73.87.913.515.519.3
Max Temp. (°C)36.934.833.430.121.717.818.118.923.727.529.234.8
WWAI18Rainfall (mm)60.346.57.73.926.840.115.21925.322.391.348.4
Irrigation (mm)00016180000000
Min Temp. (°C)18.216.313.6115.53.91.42.73.89.31317.5
Max Temp. (°C) 34.532.630.227.918.61514.215.119.526.326.732.6
LFS18Rainfall (mm)24.214.2223.229.25.88.812.47.457.622.6
Irrigation (mm)00220010000121200
Min Temp. (°C)1917.714.411.46.13.82.13.34.810.413.618.6
Max Temp. (°C) 35.833.93128.919.615.415.916.921.22727.933.8
YAI18Rainfall (mm)24.214.2223.229.25.88.812.47.457.622.6
Irrigation (mm)0001111001648000
Min Temp. (°C)1917.714.411.46.13.82.13.34.810.413.618.6
Max Temp. (°C)35.833.93128.919.615.415.916.921.22727.933.8
TARC19Rainfall (mm)5816.817.6018.65.89.83.25.42.220.22.4
Irrigation (mm)0606049240252030000
Min Temp. (°C)24.619.81814.58.655.23.67.812.915.519.6
Max Temp. (°C)39.734.231.928.221.517.918.319.224.329.130.736.4
WWAI19Rainfall (mm)25.511.439.72353.944.325.518.4198.754.97.7
Irrigation (mm)0001500000000
Min Temp. (°C)22.116.715.211.46.32.83.61.13.88.111.415.9
Max Temp. (°C)3831.828.62517.714.51414.419.926.127.334
LFS19Rainfall (mm)10.628.414.833.43437.428.813.213.2741.24.9
Irrigation (mm)00020000000000
Min Temp. (°C)21.917.115.5126.73.24.21.64.99.412.216.7
Max Temp. (°C)38.93330.126.11915.414.915.821.427.628.634.6
Table 2. Multi-environment phenotypic correlation coefficients for biomass- and yield-related traits.
Branch Number (BN)-
Dry matter (DM) (t/ha) 0.19-
Filled pods per plant (FPP)0.690.16-
100 grain weight (100 GW) (g) 0.18−0.09−0.07-
Harvest index (HI)0.22−0.380.530.08-
Plant height (PH) (cm) −0.050.730.00−0.35−0.45-
Bottom pod height (BPH) (cm) −0.230.58−0.25−0.33−0.500.78-
Top pod height (TPH) (cm) 0.060.810.15−0.29−0.350.880.78-
Pod number per plant (PNP)0.700.230.99−0.040.490.03−0.220.19-
Grains per plant (GPPl)0.670.260.92−0.010.510.06−0.180.240.93-
Grains per pod (GPP)0.270.140.150.220.170.03−0.040.080.180.40-
Grain yield per plant (GYP)0.680.340.850.080.490.07−0.130.270.880.930.41-
Unfilled pods per plant (UPP)0.420.460.430.170.070.180.020.310.580.520.220.56-
Grain yield (GY) (t/ha) 0.420.420.670.040.640.11−0.070.290.690.740.330.810.47-
BNDMFPP100 GWHIPHBPHTPHPNPGPPlGPPGYPUPPGY
Table 3. Effect of sowing date on chickpea architecture and biomass accumulation. The values in the table are the mean values predicted by linear modelling. Means followed by the same letter are not significantly different. TARC18 = Trangie Agricultural Research Centre 2018 experiment; WWAI18 = Wagga Wagga Agricultural Institute 2018 experiment; LFS18 = Leeton Field Station 2018 experiment; YAI18 = Yanco Agricultural Institute 2018 experiment; TARC19 = Trangie Agricultural Research Centre 2019 experiment; WWAI19 = Wagga Wagga Agricultural Institute 2019 experiment; and LFS19 = Leeton Field Station 2019 experiment.
ExperimentSowing DateBranch Number per PlantBottom Pod Height (cm)Top Pod Height (cm)Plant Height (cm)Biomass (t/ha)Harvest Index
TARC18SD15.2920.2638.33 b-3.870.34
SD25.2419.3734.82 a-3.250.33
SD36.0718.7838.64 b-2.990.37
SD44.7319.2436.99 ab-2.520.40
p-valuensns*-nsns
TARC19SD15.3931.70 b49.97 b52.71 b5.45 c0.34 a
SD24.8428.31 b45.67 b55.47 b4.69 bc0.41 bc
SD34.3824.16 a38.06 a45.49 a3.82 ab0.39 b
SD44.6421.47 a 33.73 a39.99 a3.24 a0.44 c
p-valuens***************
WWAI18SD19.02 c27.69 d42.91 c45.37 c3.49 c0.35 a
SD28.53 c25.90 c42.03 c45.19 c3.23 c0.41 b
SD36.55 b23.30 b35.62 b39.25 b2.91 b0.48 c
SD45.49 a21.50 a31.96 a35.64 a2.35 a0.51 c
p-value******************
WWAI19SD16.31 d33.42 d43.80 d51.71 d4.58 d0.04 a
SD25.79 c29.46 c44.15 c47.35 c3.53 c0.17 b
SD34.48 b27.20 b39.74 b42.13 b2.69 b0.31 c
SD43.55 a24.56 a34.28 a36.99 a1.95 a0.38 d
p-value******************
LFS18SD111.7333.05 c58.01 d57.89 c7.66 d0.29 a
SD210.9230.24 b49.77 c47.21 b5.85 c0.38 b
SD310.4727.07 a46.87 b45.83 b5.01 b0.49 c
SD410.9125.55 a44.31 a42.61 a4.38 a0.55 d
p-valuens***************
LFS19SD14.74 b41.62 d63.11 d63.63 d7.36 d0.13 a
SD25.39 c37.09 c57.97 c58.21 c6.97 c0.23 b
SD34.41 ab29.77 b48.91 b48.38 b5.23 b0.30 c
SD44.00 a25.05 a41.53 a41.75 a3.96 a0.37 d
p-value******************
YAI18SD19.4720.93 a35.5335.694.05 c0.22 a
SD210.3319.66 a38.6539.614.31 c0.32 b
SD37.4220.18 a35.7841.153.53 b0.41 c
SD45.1224.36 b36.2237.762.95 a0.41 c
p-valuens*nsns******
- = missing data/not measured, ns = not significant, * = p < 0.05, *** = p < 0.001.
Table 4. Effect of sowing date on chickpea yield and yield components. The values in the table are the mean values predicted by the linear modelling. Means followed by the same letter are not significantly different. TARC18 = Trangie Agricultural Research Centre 2018 experiment; WWAI18 = Wagga Wagga Agricultural Institute 2018 experiment; LFS18 = Leeton Field Station 2018 experiment; YAI18 = Yanco Agricultural Institute 2018 experiment; TARC19 = Trangie Agricultural Research Centre 2019 experiment; WWAI19 = Wagga Wagga Agricultural Institute 2019 experiment; and LFS19 = Leeton Field Station 2019 experiment.
ExperimentSowing DateFilled Pods per PlantUnfilled Pods per PlantPods per PlantGrains per PodGrains per Plant100 Grain Weight (g)Grain Yield (t/ha)
TARC18SD132.610.2 a42.8 a1.138.522.91.302
SD223.65.9 b29.5 b1.227.523.01.071
SD327.84.1 b31.8 b1.234.323.51.095
SD425.13.7 b28.8 b1.332.023.231.001
p-valuens****nsnsnsns
TARC19SD115.24.019.21.218.123.7 a1.868 a
SD215.53.218.71.319.623.3 a1.903 a
SD315.13.518.51.218.921.9 b1.473 b
SD415.33.618.91.218.820.7 c1.438 b
p-valuensnsnsnsns****
WWAI18SD122.8 bc1.7 a24.6 bc0.9 a19.1 a22.21.216
SD225.6 c1.8 a27.4 bc0.9 a23.3 b22.31.306
SD320.4 ab1.4 ab21.8 a1.0 ab19.5 a22.31.377
SD417.0 c1.1 b18.1 ab1.1 b18.8 a22.01.209
p-value*******nsns
WWAI19SD14.6 a0.55.0 a1.2 a4.7 a5.0 a0.173 a
SD29.9 b1.010.9 b1.1 ab10.3 b15.9 b0.600 b
SD312.6 c1.013.6 c1.0 ab13.6 c17.5 c0.812 c
SD410.6 b1.412.0 bc1.0 b12.4 c15.8 b0.747 d
p-value***ns***************
LFS18SD134.07.0 b41.0 b1.3 a43.125.1 a2.221 a
SD228.64.7 a33.3 a1.4 ab39.226.2 b2.190 a
SD328.84.0 a32.8 a1.4 ab39.526.1 b2.422 b
SD429.73.7 a33.4 a1.5 b42.526.0 b2.335 ab
p-valuens********ns****
LFS19SD110.1 a2.712.8 a1.013.4 a21.50.983 a
SD215.0 b3.418.4 b1.120.3 b20.81.593 b
SD313.7 b3.717.5 b1.018.0 b23.81.552 b
SD413.4 ab3.316.7 ab1.017.2 ab21.21.475 b
p-value*ns*ns*ns***
YAI18SD111.22.814.0 a1.314.8 a18.1 b0.871 a
SD217.24.521.6 b1.323.2 b17.5 b1.384 bc
SD3-----16.3 a1.439 c
SD414.62.116.7 ab1.419.7 ab15.2 a1.225 ab
p-valuensns*ns******
- = missing data/not measured; ns = not significant; * = p < 0.05; ** = p < 0.01; *** = p < 0.001.
Publisher’s Note: MDPI stays neutral with regard to jurisdictional claims in published maps and institutional affiliations.

