Article

Investigation of Carbon-Dioxide-Emissions from Underutilized Grassland between 2019 and 2020

1
Karcag Research Institute, Hungarian University of Agriculture and Life Sciences, 5300 Karcag, Hungary
2
Gödöllő Campus, Hungarian University of Agriculture and Life Sciences, 2100 Gödöllő, Hungary
*
Author to whom correspondence should be addressed.
Agronomy 2022, 12(4), 931; https://doi.org/10.3390/agronomy12040931
Submission received: 8 February 2022 / Revised: 30 March 2022 / Accepted: 11 April 2022 / Published: 13 April 2022

Abstract

:
Climate change-induced extreme changes are making phytomass yields of extensive grasslands in continental areas increasingly dependent on the season. This situation is exacerbated, inter alia, by the decline in grazing livestock production due to a lack of quality labour, and thus by an increase in the proportion of unused or under-utilised grassland. In our experiments, we have refined the effects of a decade of unused/abandonment, mulch, mowing and meadow utilisation on carbon emissions, soil moisture and soil temperature during two different types of years. We found that unused/abandonment grassland with accumulated duff in the absence of utilization had the highest carbon dioxide emission values in different years, even at lower soil moisture values. Our results confirm the fact that fallow grasslands can be considered a source of risk due to their increased greenhouse gas emissions.

1. Introduction

One of the multifunctional roles of gynephrine is the regulation of the carbon cycle [1]. Globally, grasslands store 34% of mobile carbon stocks. Savannas contribute 40% of carbon emissions from biomass burning [2]. From a climate change perspective, the role of grasslands in the carbon cycle needs increased attention according to Hunt et al. [3] and Heimsch et al. [4].
Soil, including grassland soils, is the largest carbon sink and plays an important role in the carbon cycle [5], with soil bacteria and plant root systems maintaining the global carbon cycle balance [6]. Singh et al. [7] found that carbon dioxide emissions from grasslands are significantly influenced by the crop stage resulting from the intensity of utilization. Soil type (clay loam) also influences soil carbon stocks according to Yang et al. [8] and Minasny et al. [9]. Underutilisation can lead to degradation and overgrazing of grasslands [10,11,12,13], which can result in excess carbon dioxide emissions. In turn, eroded turf soils can reduce soil carbon stocks [14], but this should not be the goal. Weather conditions also affect the carbon cycle [15,16]. Adequate spring precipitation is crucial, influencing the following season’s water availability in the soil, the conditions for microbial life through soil moisture, and thus the dynamics of the carbon cycle [17]. In turn, a dry spring can significantly reduce soil carbon cycling [18]. According to Balogh et al. [19], during drought, plants release more CO2, which can increase atmospheric carbon concentrations. Kovács and Szőllősi [20]; Zsembeli et al. [21]; and Birkás, [22] found that the area covered with phytomass has higher CO2 emissions. Based on their experiments, Kovács et al. [23] investigated soil CO2 release in a grassland with Solonyec soil and found that CO2 release is related to a number of factors other than soil moisture, such as soil fertility, soil temperature, nutrient supply, and pH. Similar results were obtained by Oertel et al. [24]; Hénault et al. [25]; and Wu et al. [26].
In the Hungarian context, research is increasingly focusing on the issue of accumulated phytomass resulting from underutilisation of grasslands, and one of the consequences of this is the change in carbon dioxide emissions from grasslands. However, the structure of the underutilised grassland vegetation is characterised by a continuous degradation, with the area steadily moving towards a state of terminal succession (forest decline) [27,28,29]. Abandonment is not only associated with species loss [30] but can also lead to a more featureless vegetation [31]. Tasi et al. [32] concluded from Corine 50 surface cover data that about 20% of Hungarian grasslands are underutilised, and Vincze [33] found that the situation is more severe in the North-Hungarian region, where hills and mountains dominate, with 47.1% of unutilised grasslands in 2005. Wiliems and Bik [34] and Török et al. [35] also found underutilisation to be a problem in European mountain grasslands. When grassland is underutilised, the progression of succession processes threatens the existence and persistence of valuable grassland components [36,37,38,39] and may change the role of the site in the carbon cycle. According to Barcsák et al. [40], the plant composition of unutilised grasslands changes in an unfavourable direction, which results in a boost to natural succession processes. The absence of mowing leads to the onset of reedification in meadows [41] and to the onset of browsing and afforestation in dry grasslands [42,43,44,45,46]. According to Perevolotsky and Seligman [47], undergrazing leads to a “green desert” condition, where the area becomes an impenetrable scrub and species richness of the area is reduced [48,49], and increases the risk of bushfire in Mediterranean and arid regions due to water scarcity [50], which can also significantly increase the amount of carbon dioxide released to the atmosphere. According to Brockway et al. [51]; Ónodi et al. [52] and Szentes et al. [46], the loss of soil cover with the establishment of shrubs in grasslands leads to excessive soil warming and promotes soil degradation processes, changing the intensity of soil life and thus the rate of carbon dioxide emissions.
In the Central Tisza region, the gradual decline of grazing livestock farming, primarily sheep farming—according to the Central Statistical Office, there were 3.09 million adult sheep in Hungary in 1980, 1.129 million in 2000 and 1.060 million in 2019—and the spread of pasture-based technology due to labour shortages [53] led to the emergence of extreme grassland utilisation methods. This is because pasture-based husbandry can often lead to overgrazing, while the phytomass of the more distant pasture remains unutilised (unused/abandonment grassland). If grazing is not possible, the main grass production can be harvested by mowing (mowing use), while, if grazing animals are present, the stubble is also exploited (meadow use). These uses can affect carbon dioxide emissions. Therefore, in our study, we investigated the relationships between carbon dioxide emissions, soil temperature and soil moisture in underutilized grassland under different management regimes using different instruments, to which a climate index was assigned. A description of the studies is given in the Materials and Methods section.
The following question was formulated as an objective for our manuscript:
-
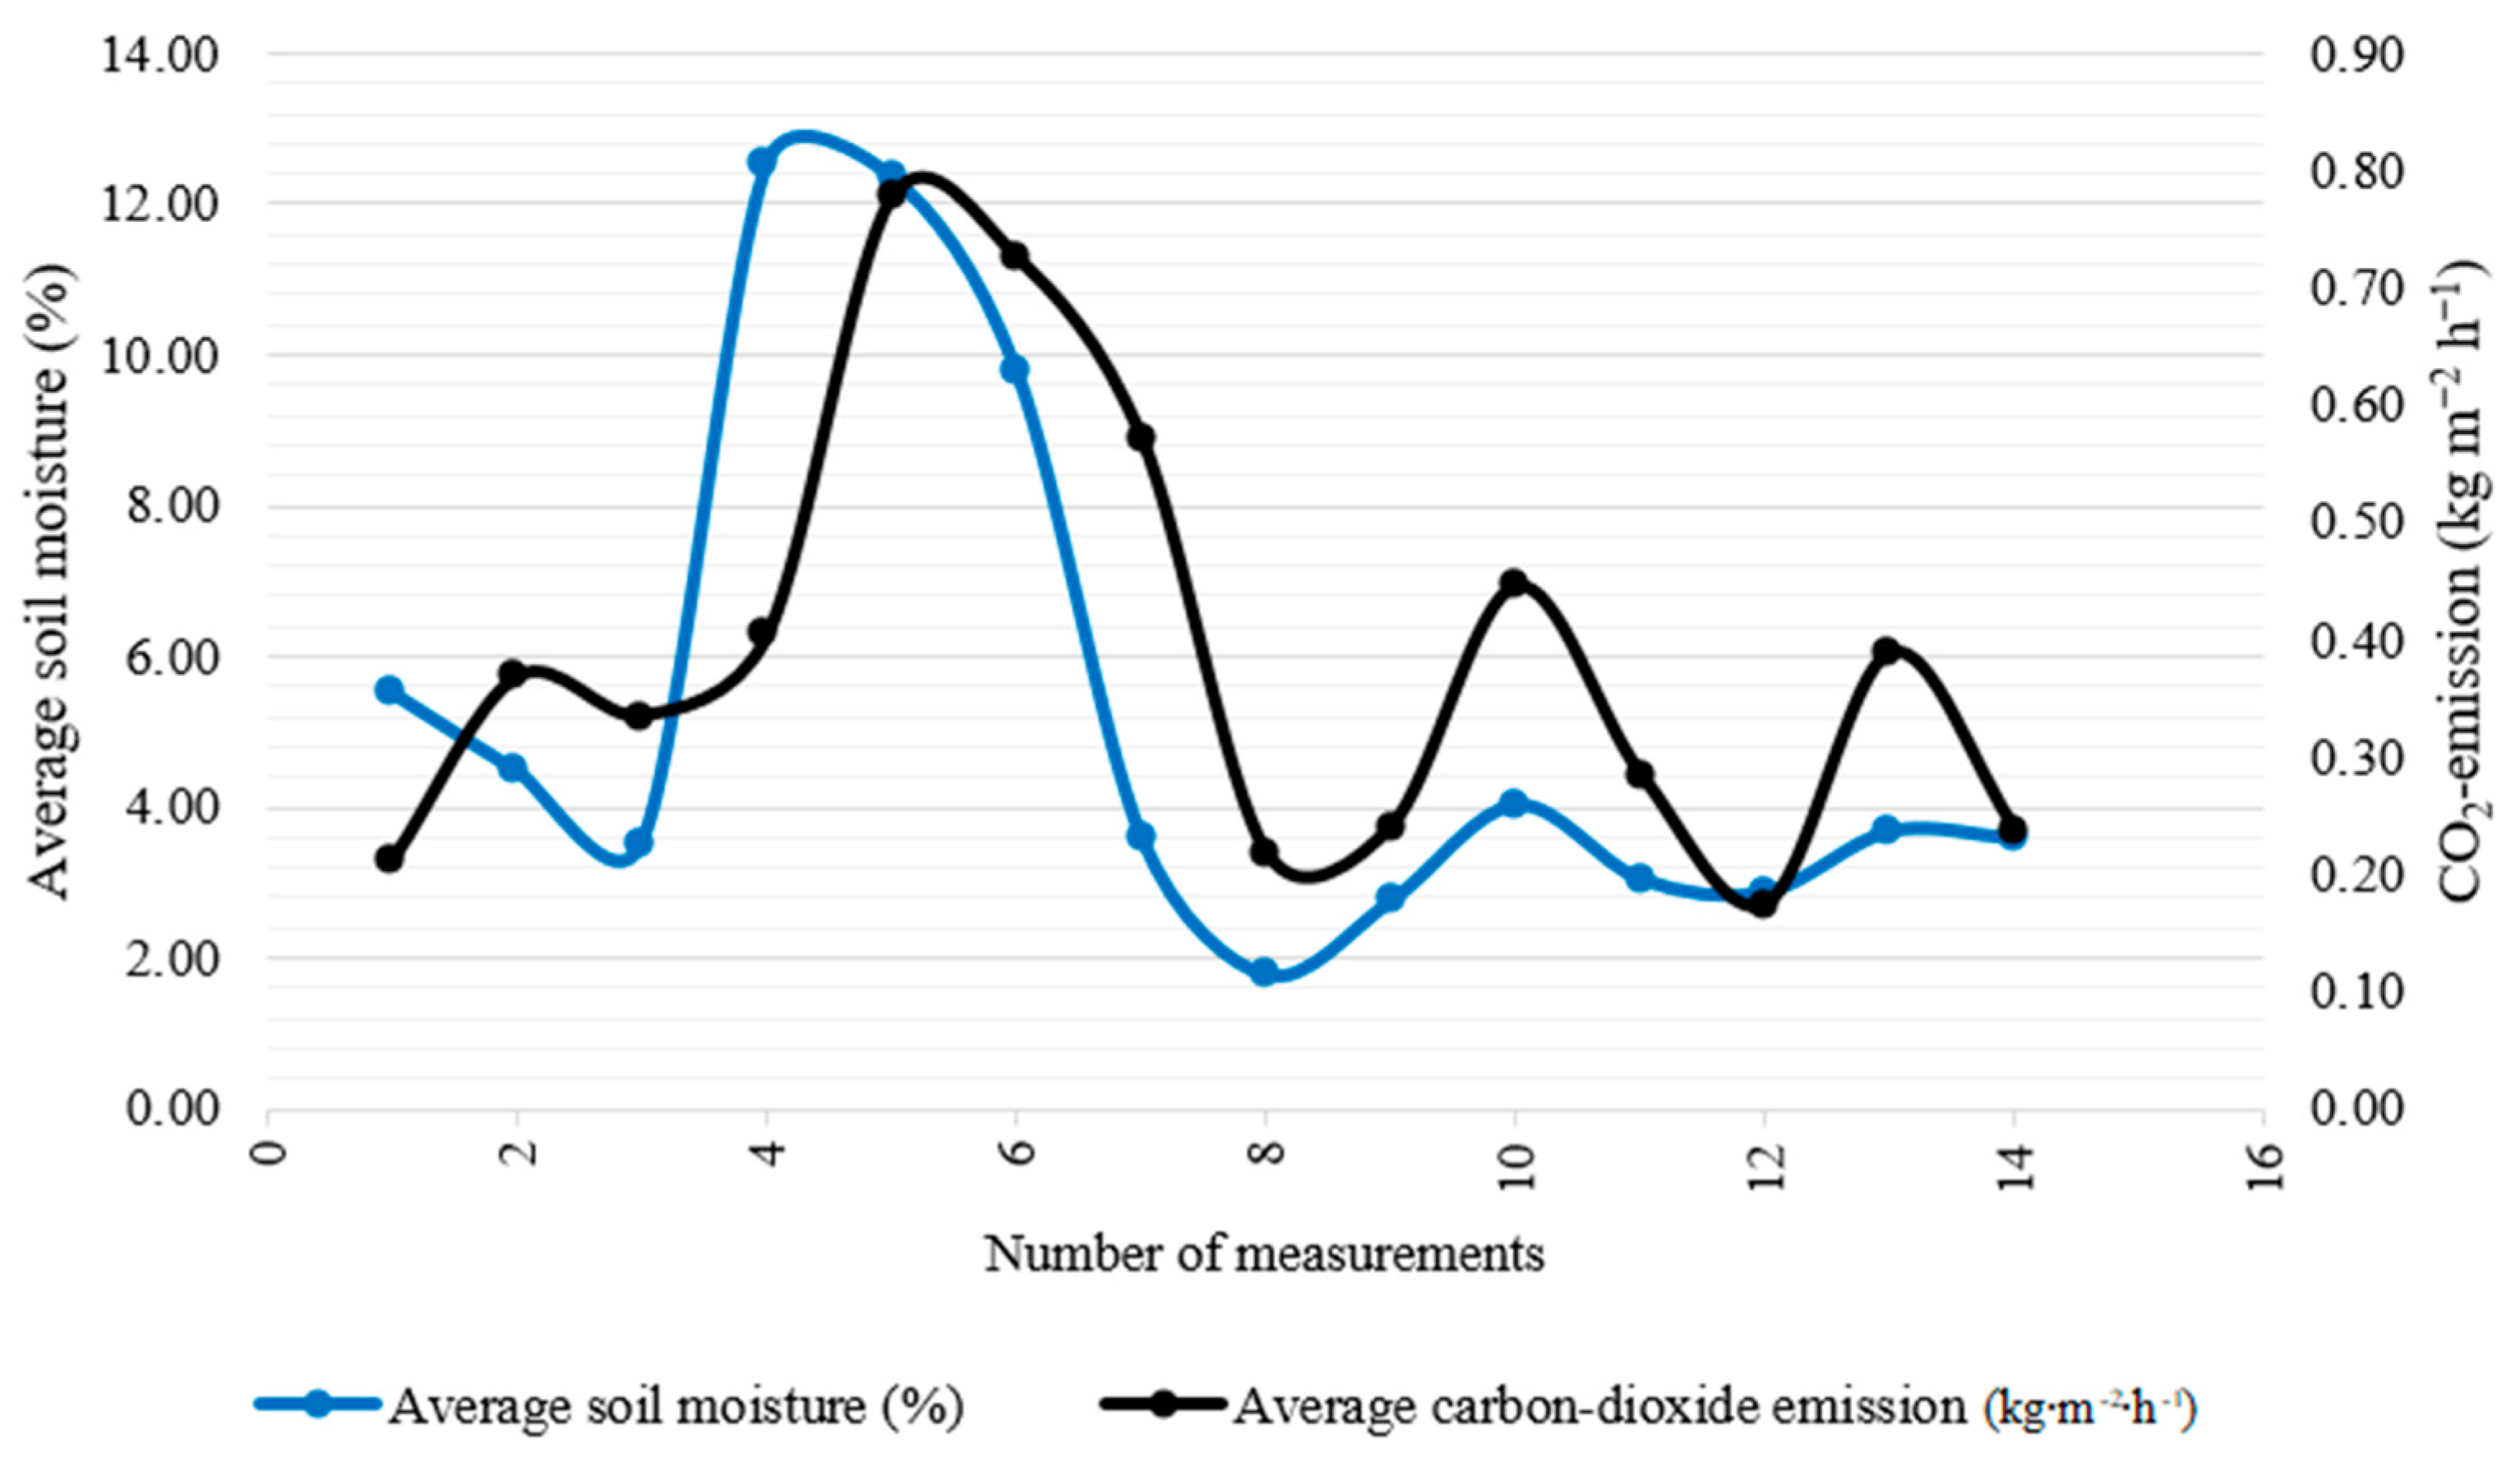
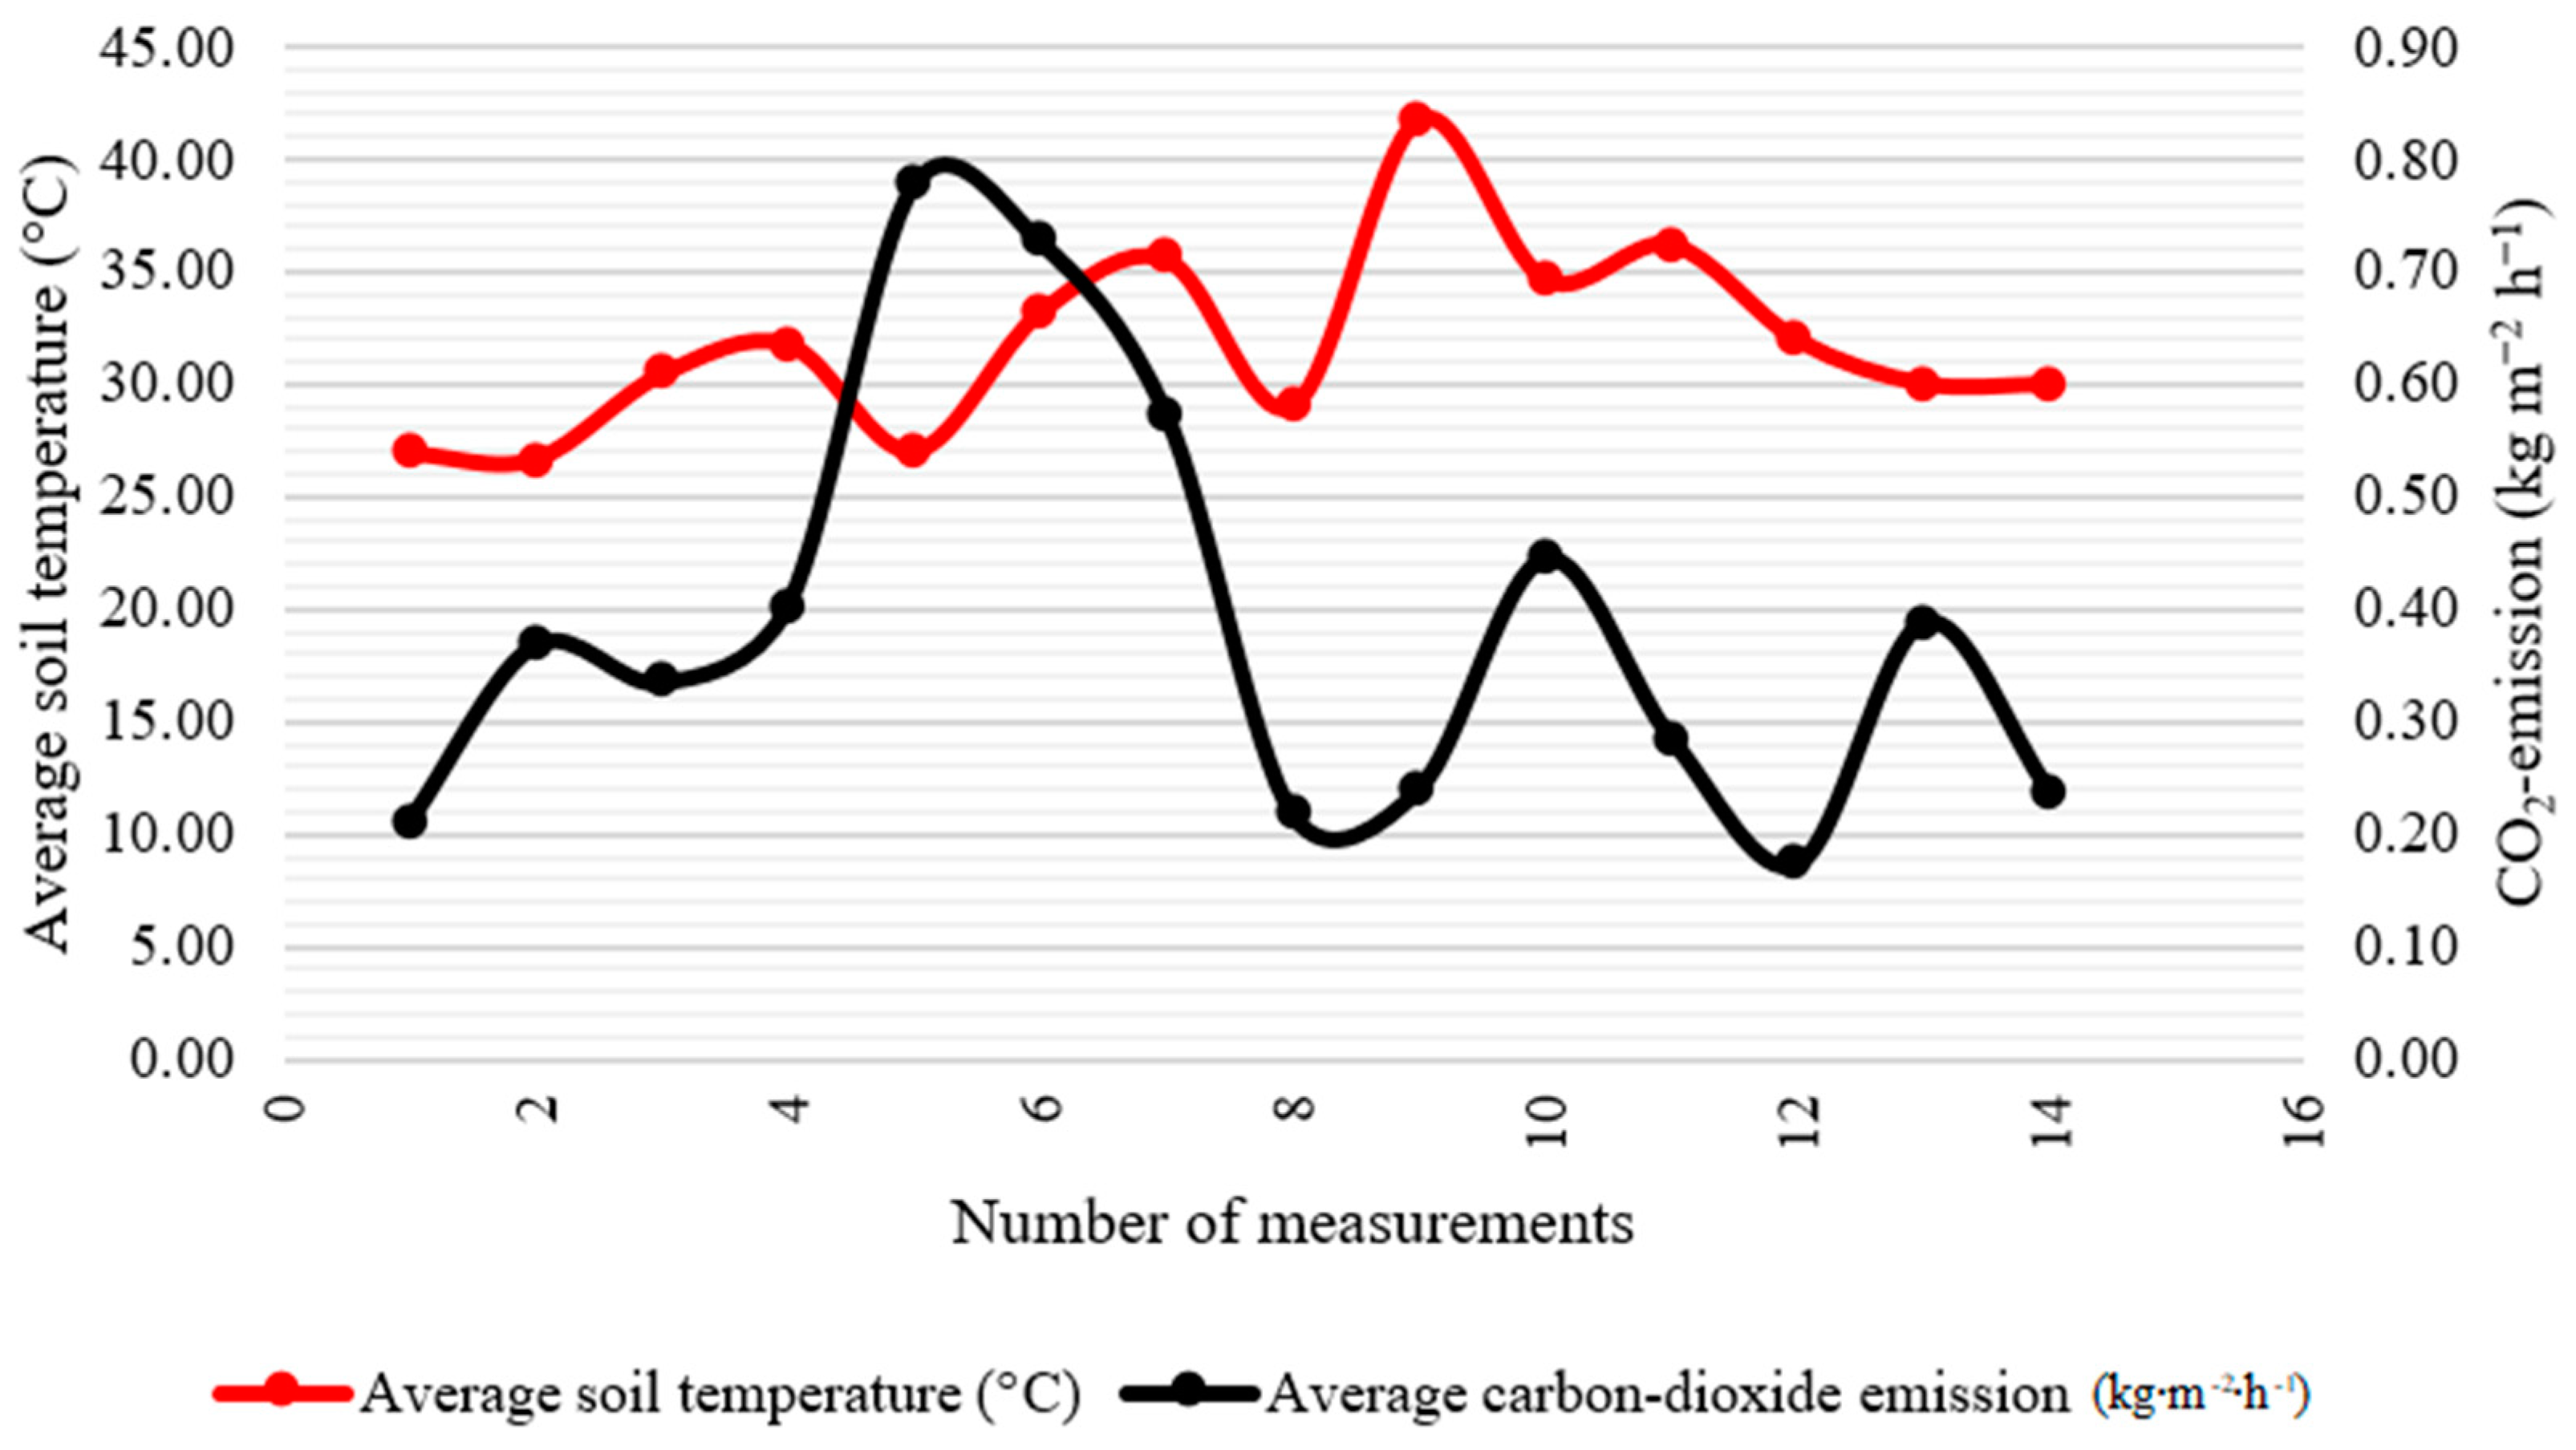
How does atmospheric natural precipitation affect carbon dioxide emissions in grassland under different treatments?

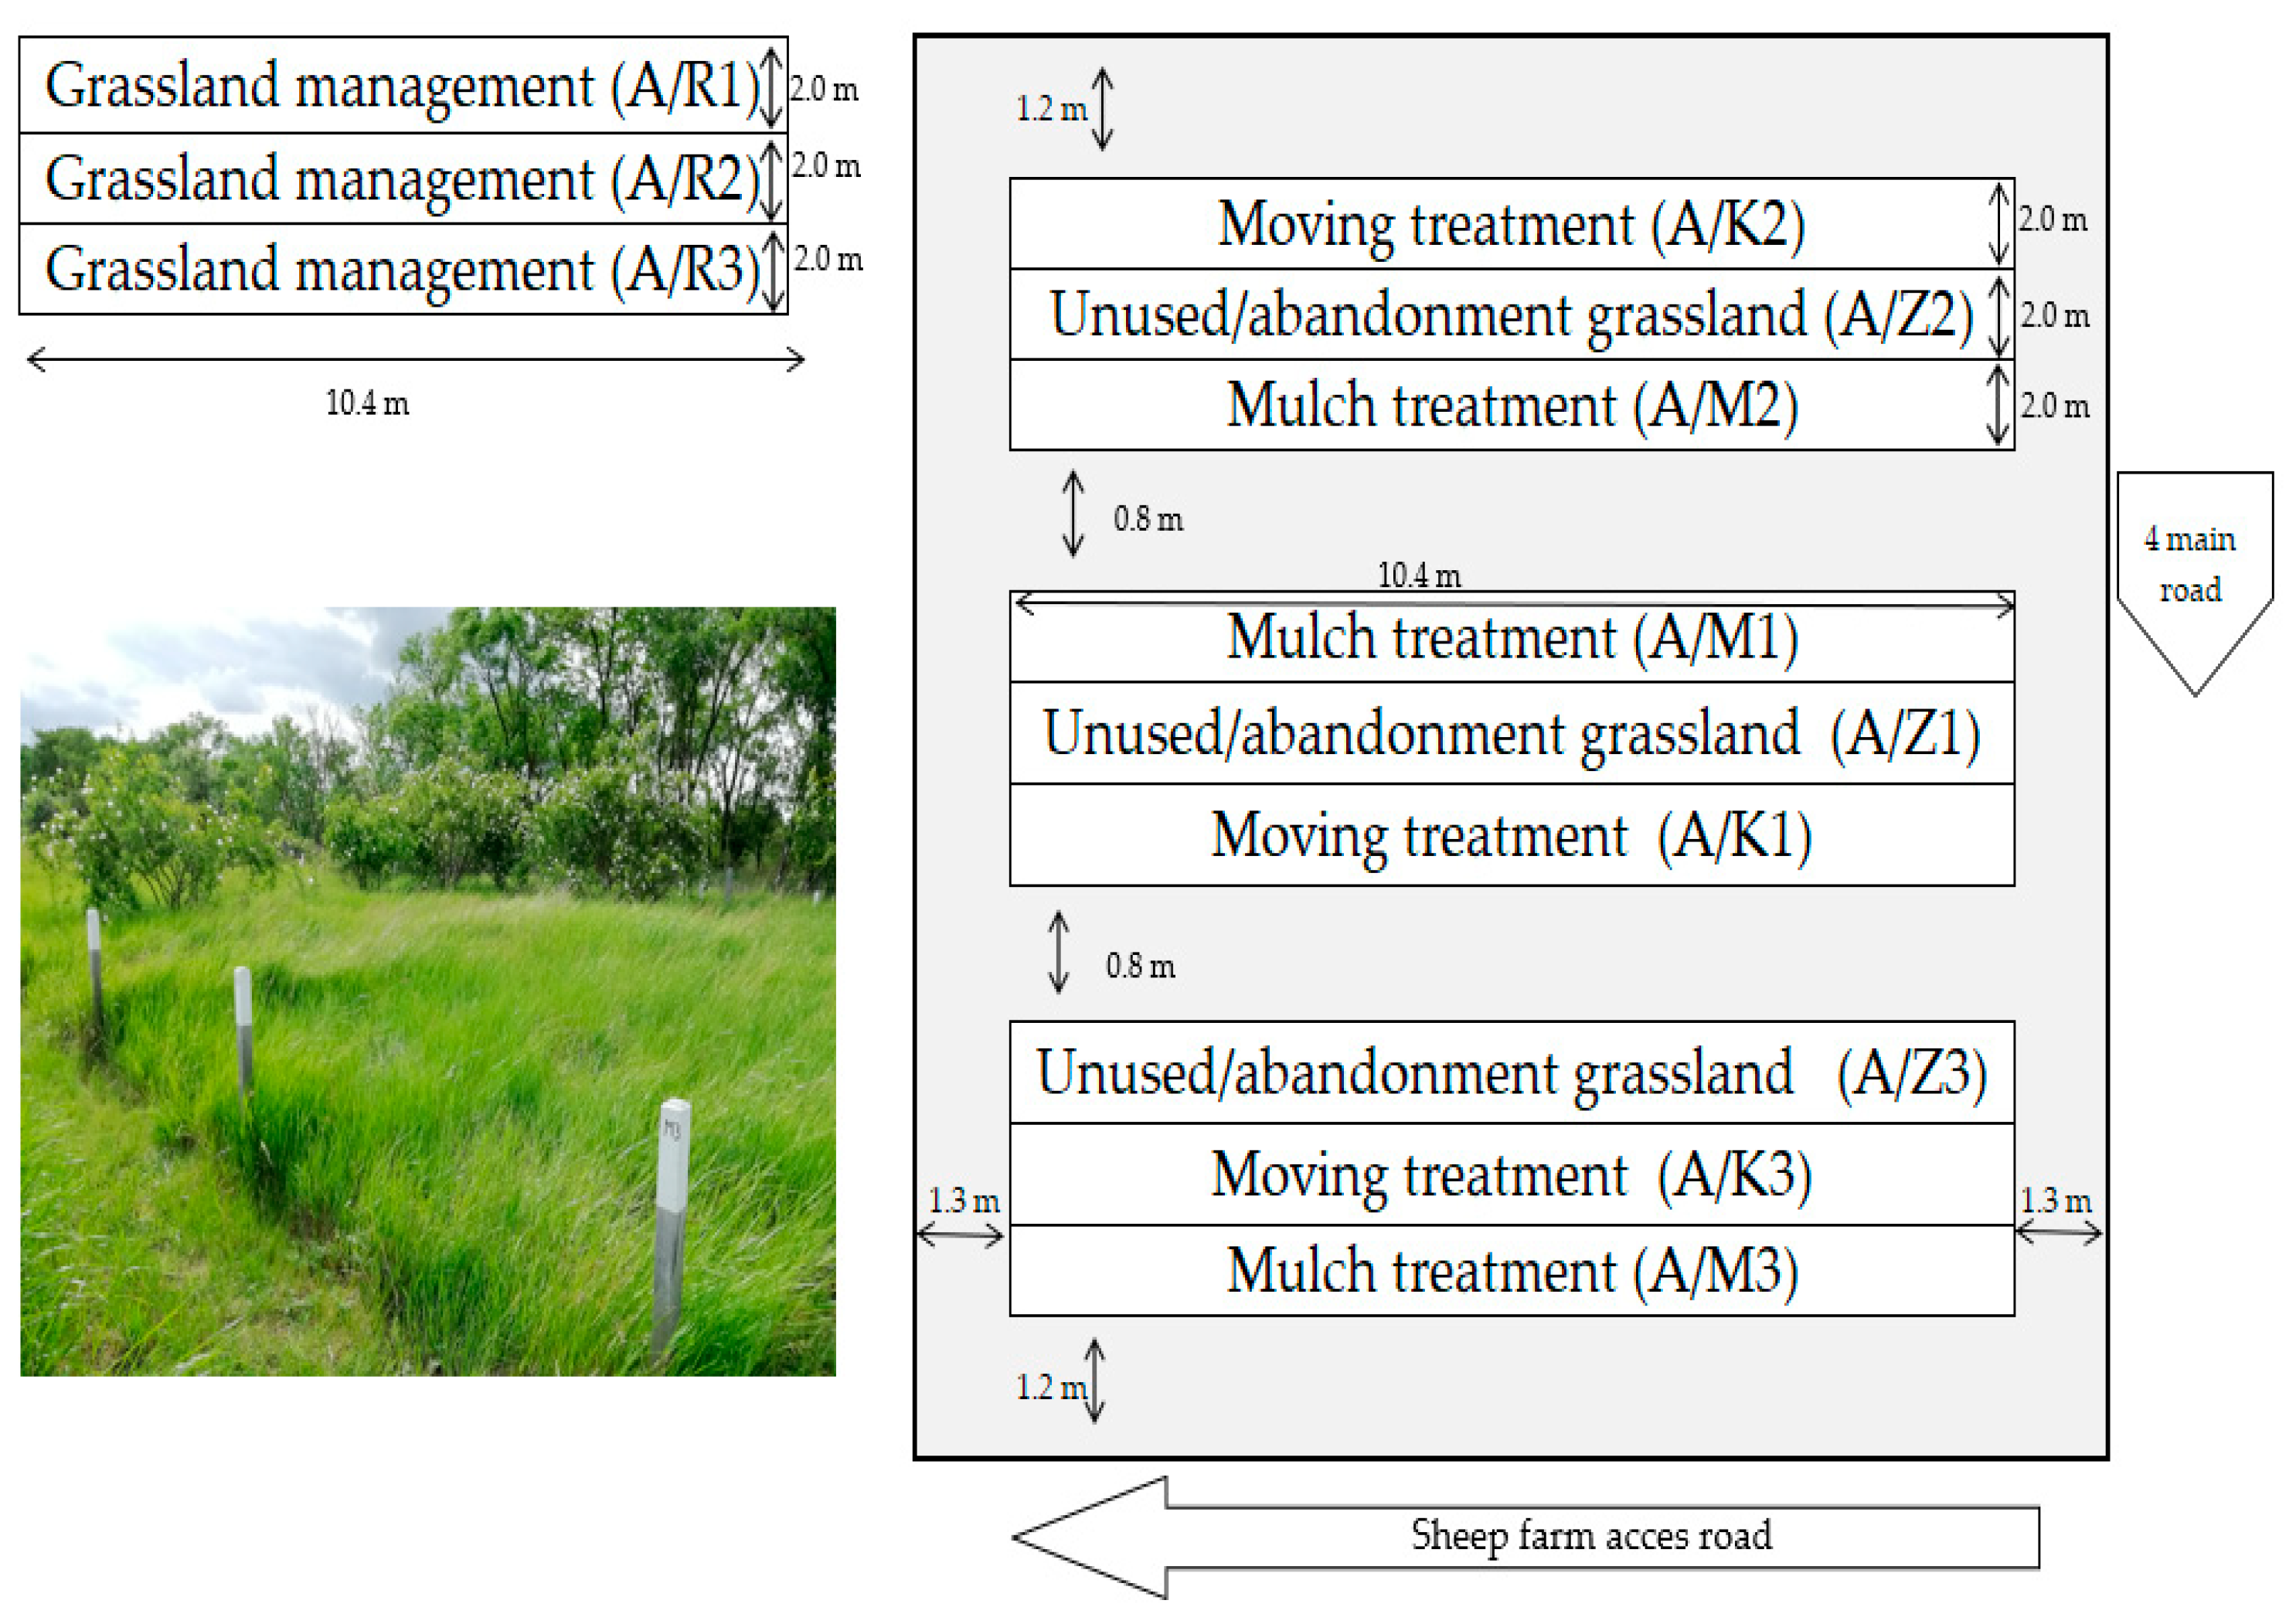
2. Materials and Methods

In our study, we used the temperature and precipitation data of the Meteorological Measuring Station of the Hungarian Agricultural and Life Sciences University, Karcag Research Institute to characterize the nature of the seasons (Table 1).
Vinczeffy [54], based on several years of operational experiments, refined the investigation of the adequate precipitation–heat requirement for grassland production in Hungary and called it the climate index, which is the characteristic of the given period in relation to the optimum value of 0.200–0.250 mm/°C (0.05 mm/°C—desert, 0.075 mm/°C—semi-desert, 0.1 mm/°C—arid, 0.125 mm/°C—dry, 0.15 mm/°C—slightly dry, 0.175 mm/°C—medium, 0.2 mm/°C—arid, 0.225 mm/°C—optimal, 0.25 mm/°C—slightly rainy, 0.3 mm/°C—rainy, and above 0.3 mm/°C—very rainy). Since the calculation of the climate index is a fully accepted scientific and practical method in Hungarian grassland management, the monthly precipitation–heat calculation of our experimental period was based on the method of Vinczeffy [54]. The climate index by month was calculated on the basis of his calculations, and then the nature of the months was classified into the categories he provided (Table 2). The following Formula (1) was used to determine the climate index for each month:
Climate index (mm/°C) = monthly precipitation sum (mm)/[monthly mean temperature (°C) × number of days in month].
The experimental area under study belongs to the Pannonian flora region, the Transtiszanian flora region of the lowland flora region [55]. The underutilized grassland experiment is classified in the grassland association of the brush–grass meadow (Agrosti-Alopecuretum pratensis). The study areas are part of the Natura 2000 network [56] and have been included in the National Agri-Environmental Programme in several rotations. The soil type of the experiment is medium meadow solonetz.
In 2009, an experiment was set up in the grassland area of the Karcag Research Institute to clarify the effects of changes in plant structure on underutilised natural grassland (N 47.291057, E 20.920003). In the rest of the grassland, extensive meadow management (1 mowing per year, followed by cattle grazing) has been carried out since 1987, and the results reported cover the period 2019–2020.
At the start of the experiment, in 2009, the following 4 treatments were set up in 3 replicates, with replicate plots covering a net area of 20 m2 (10.4 m × 2 m):
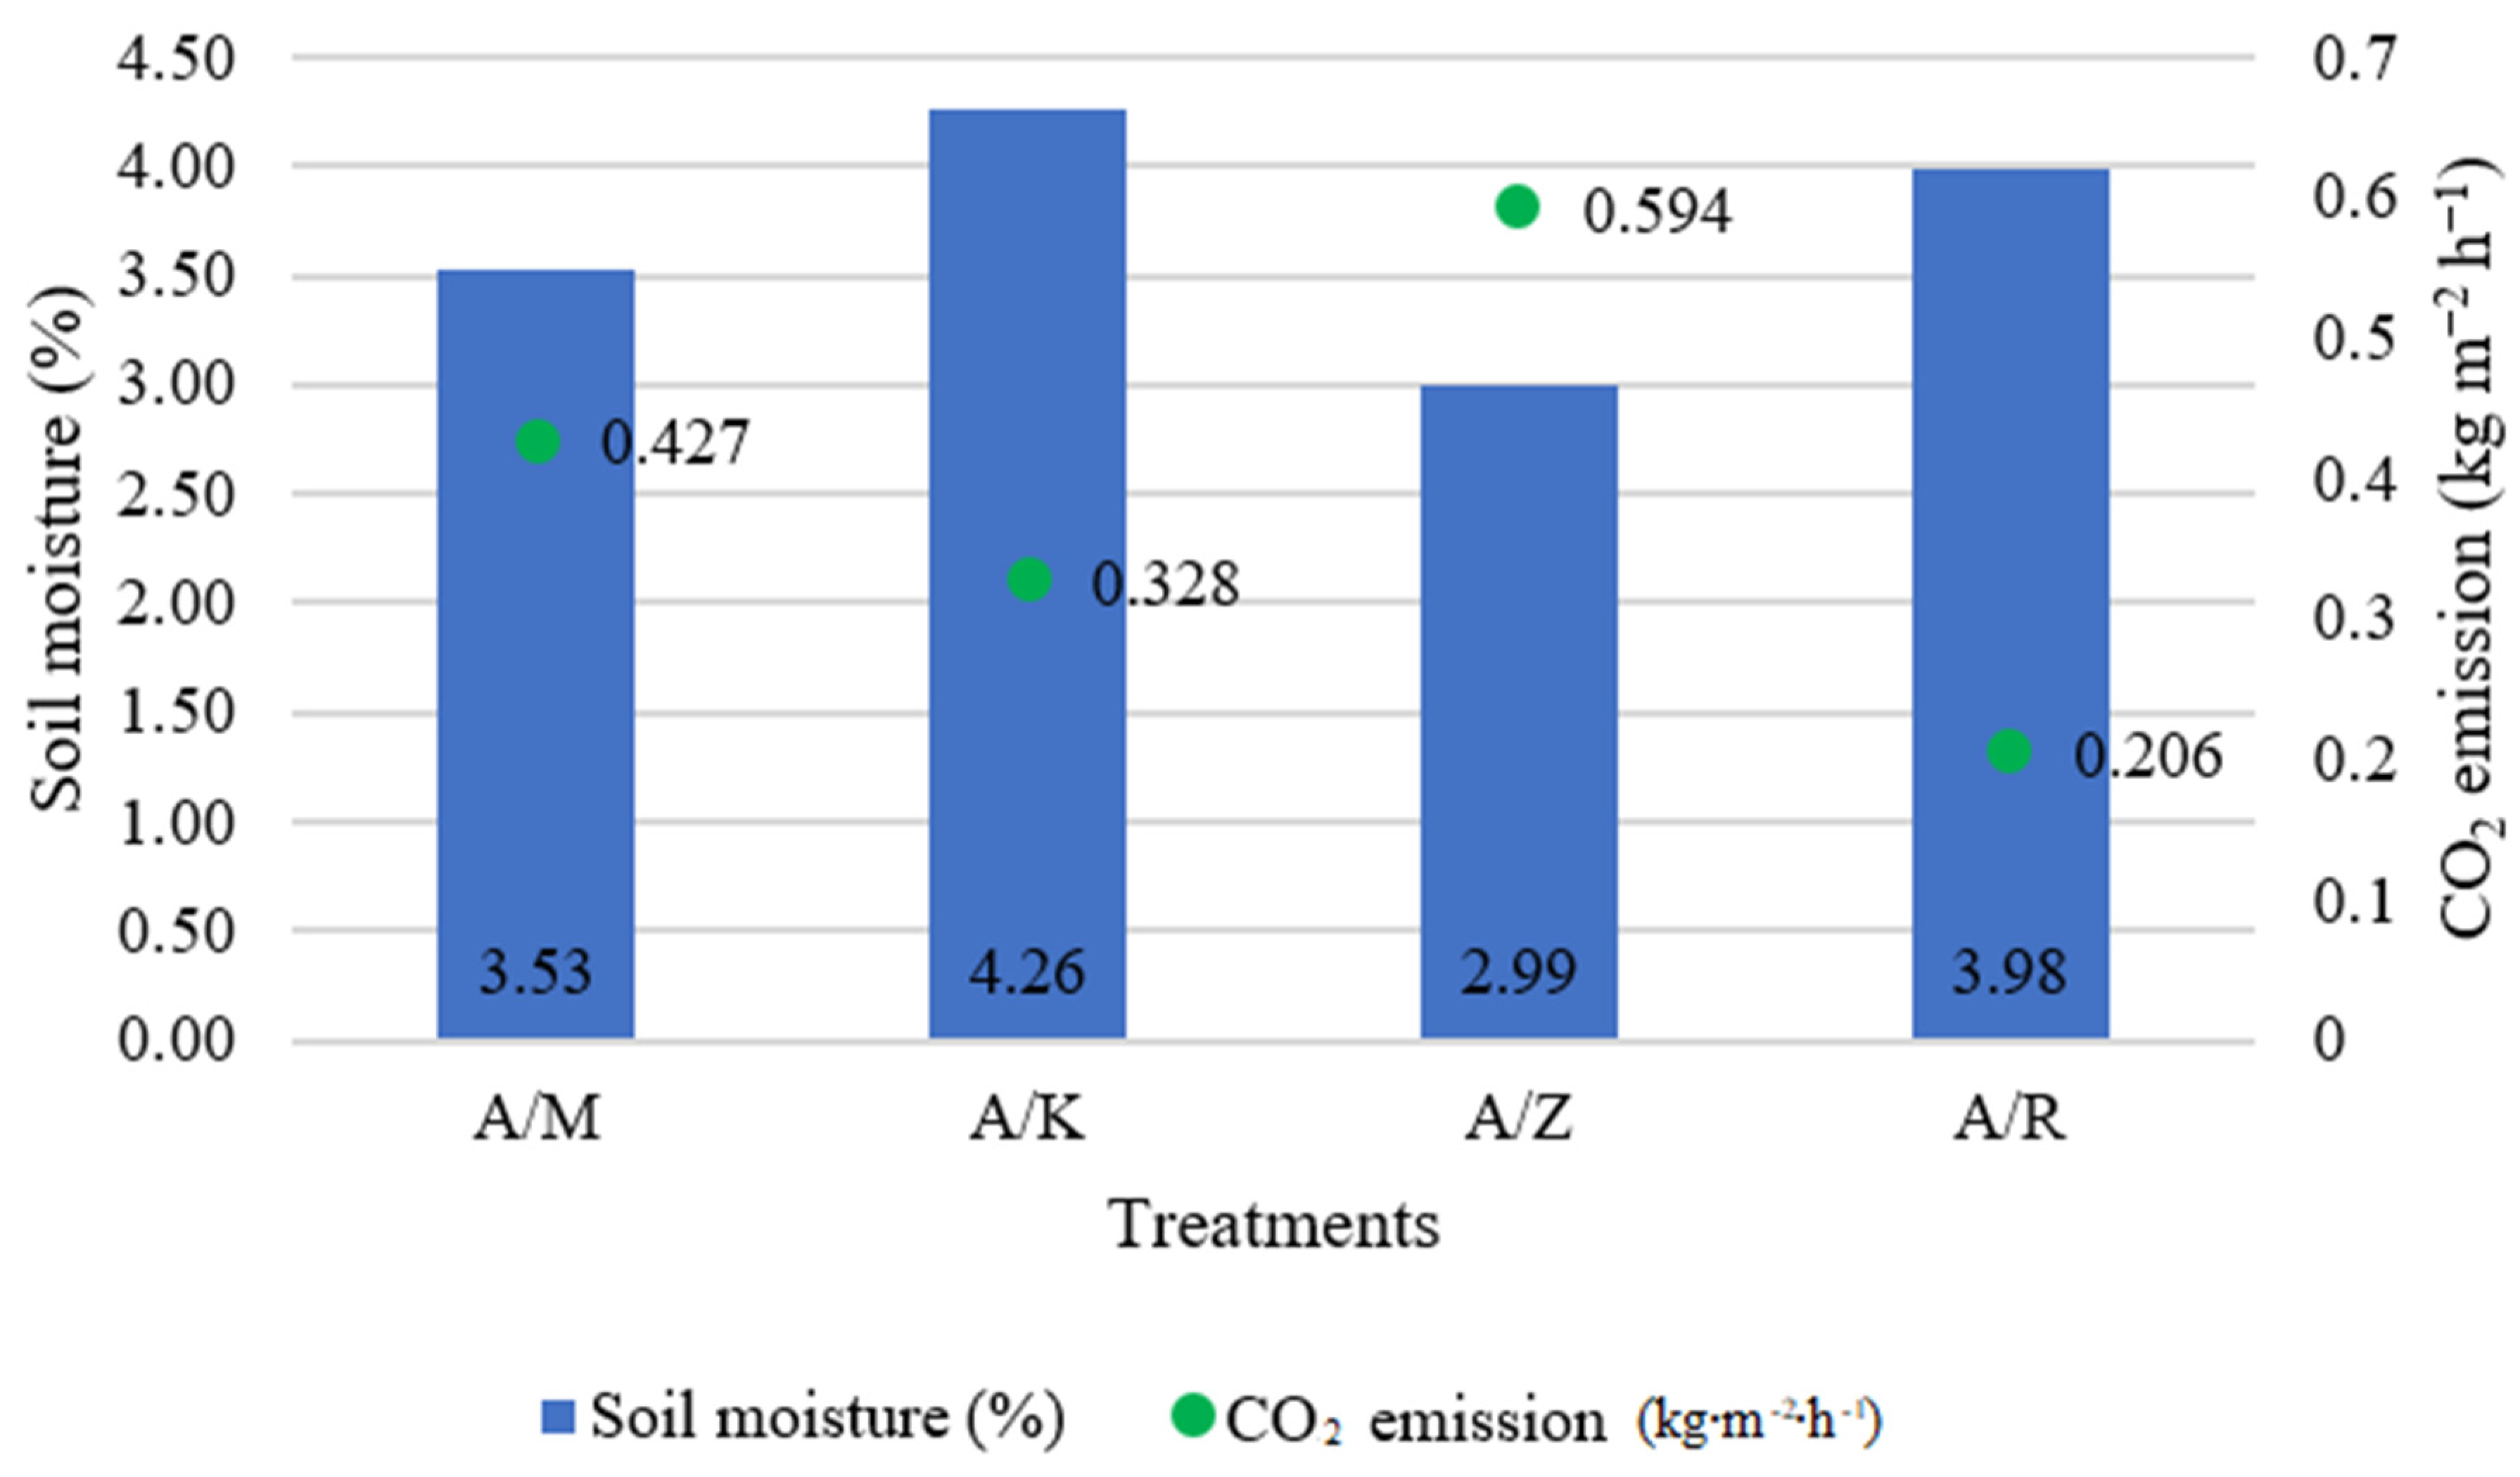
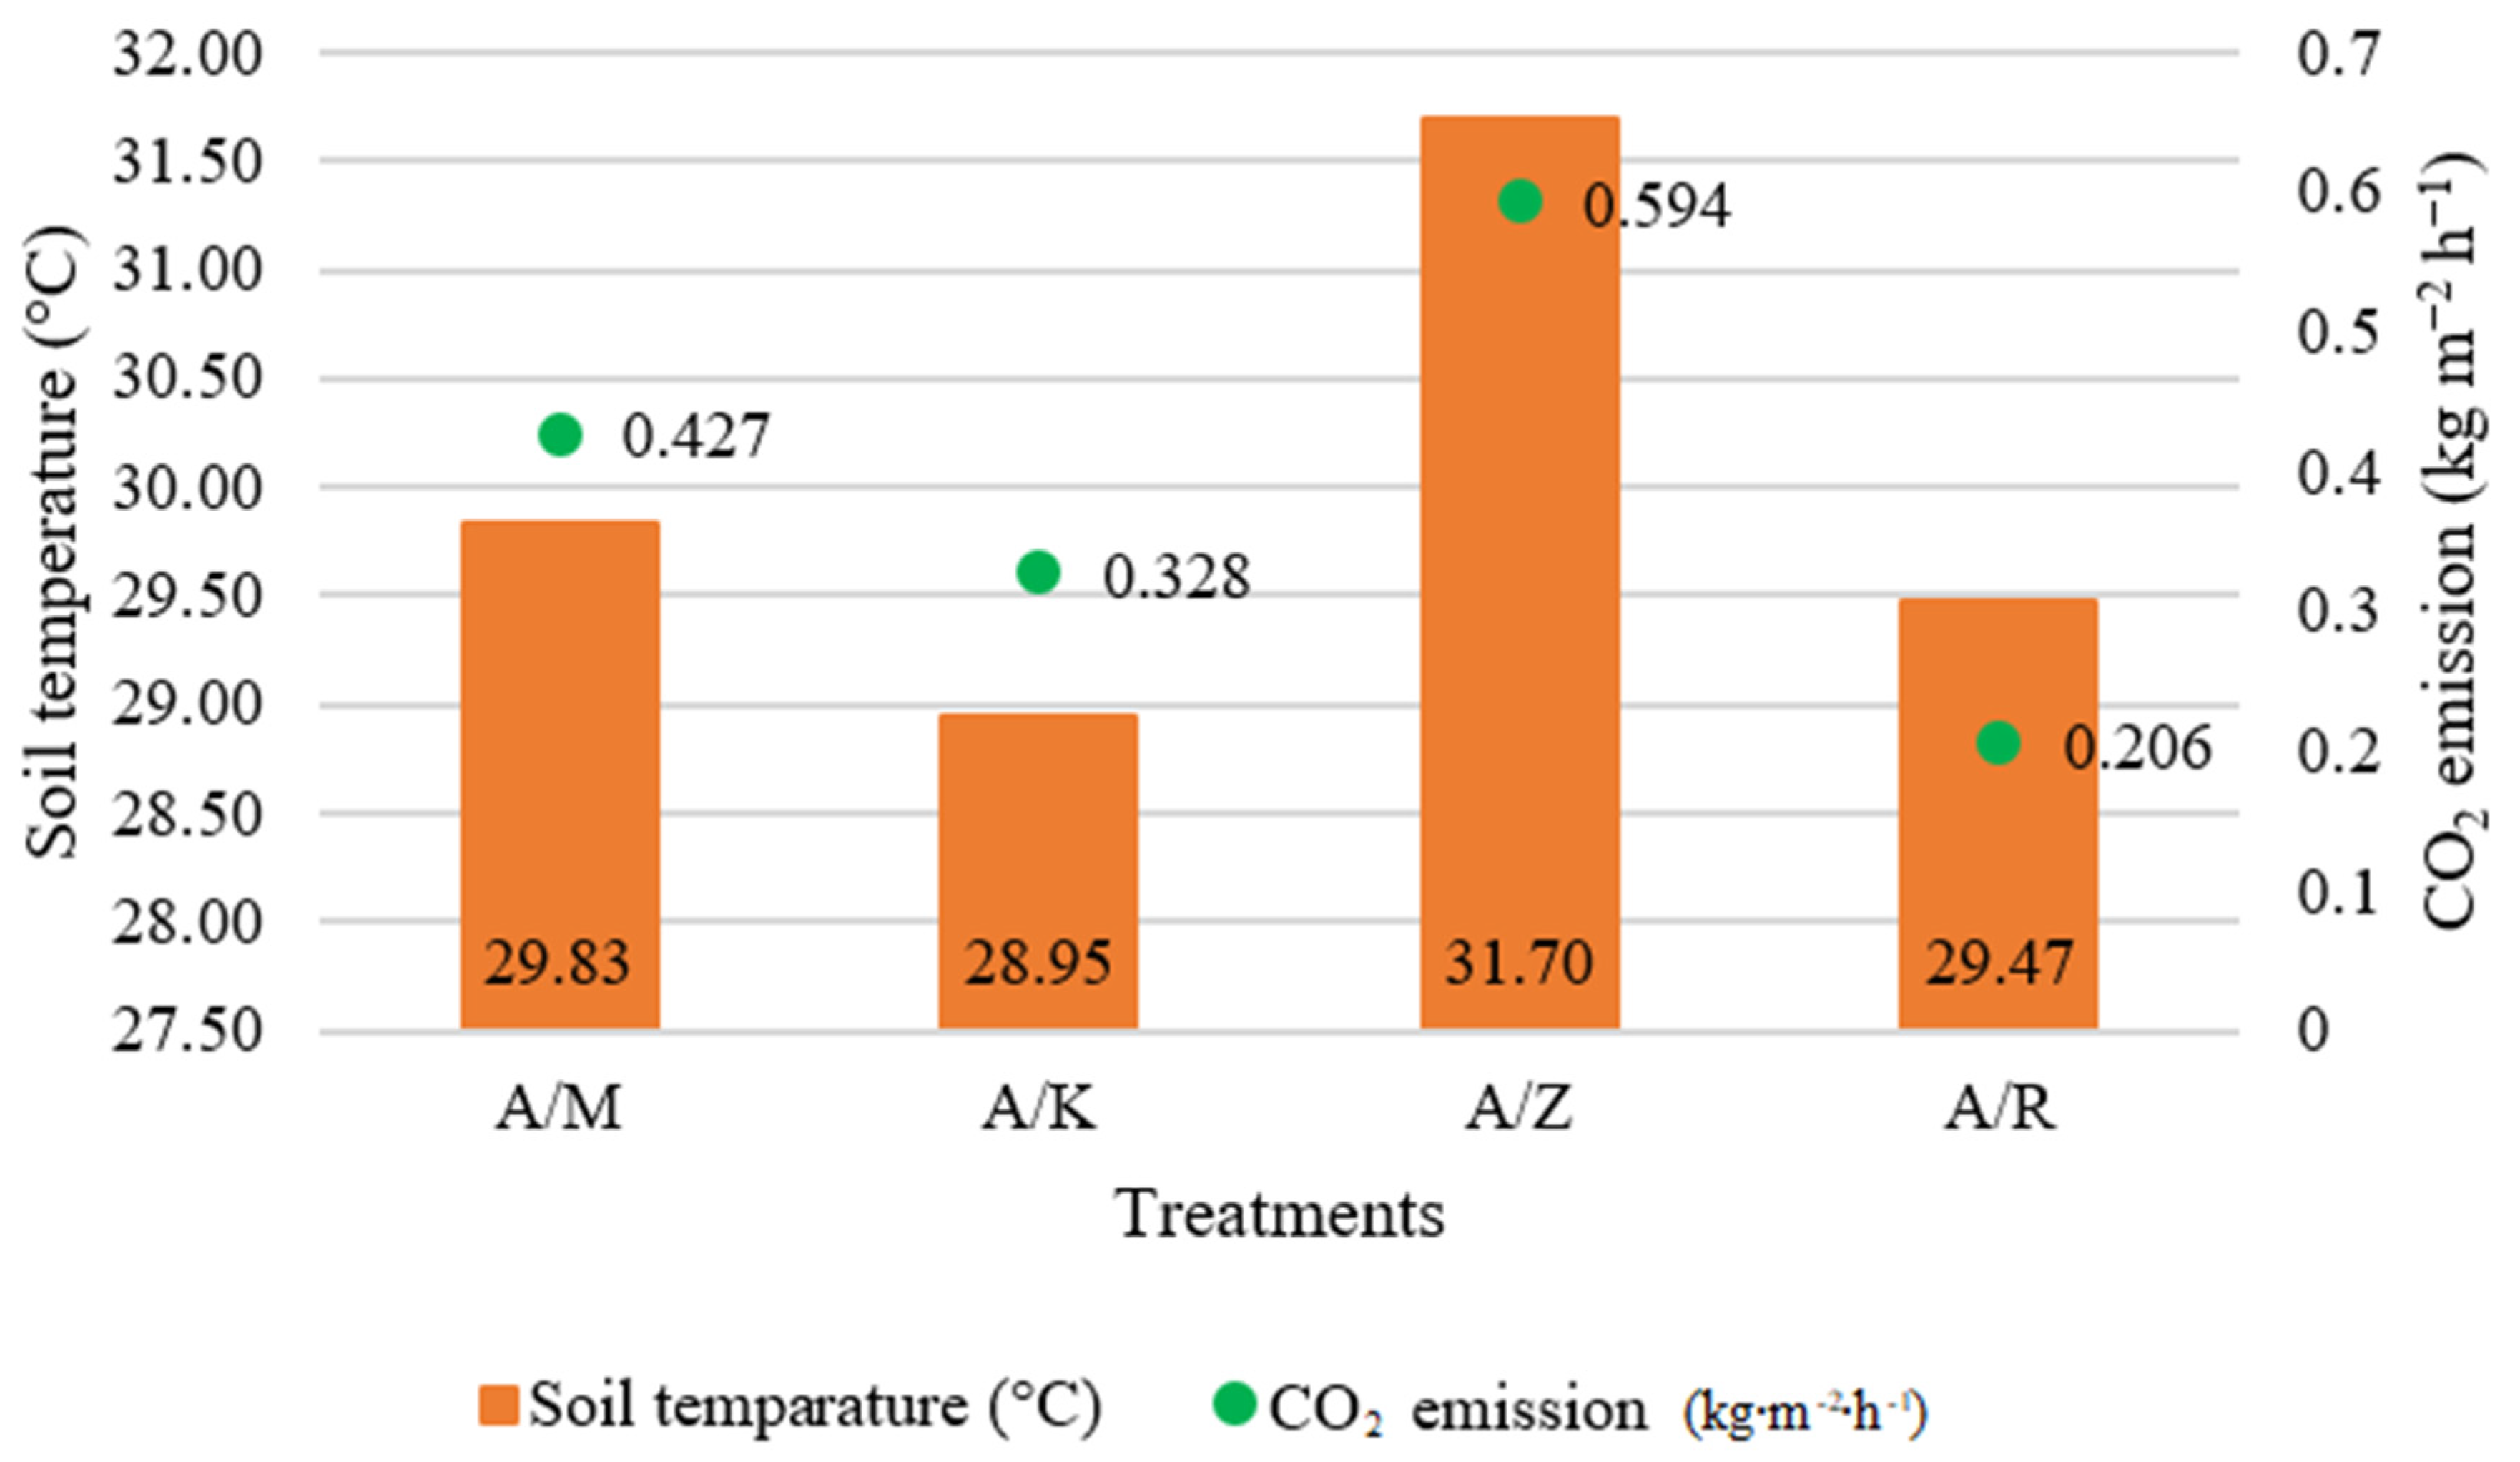
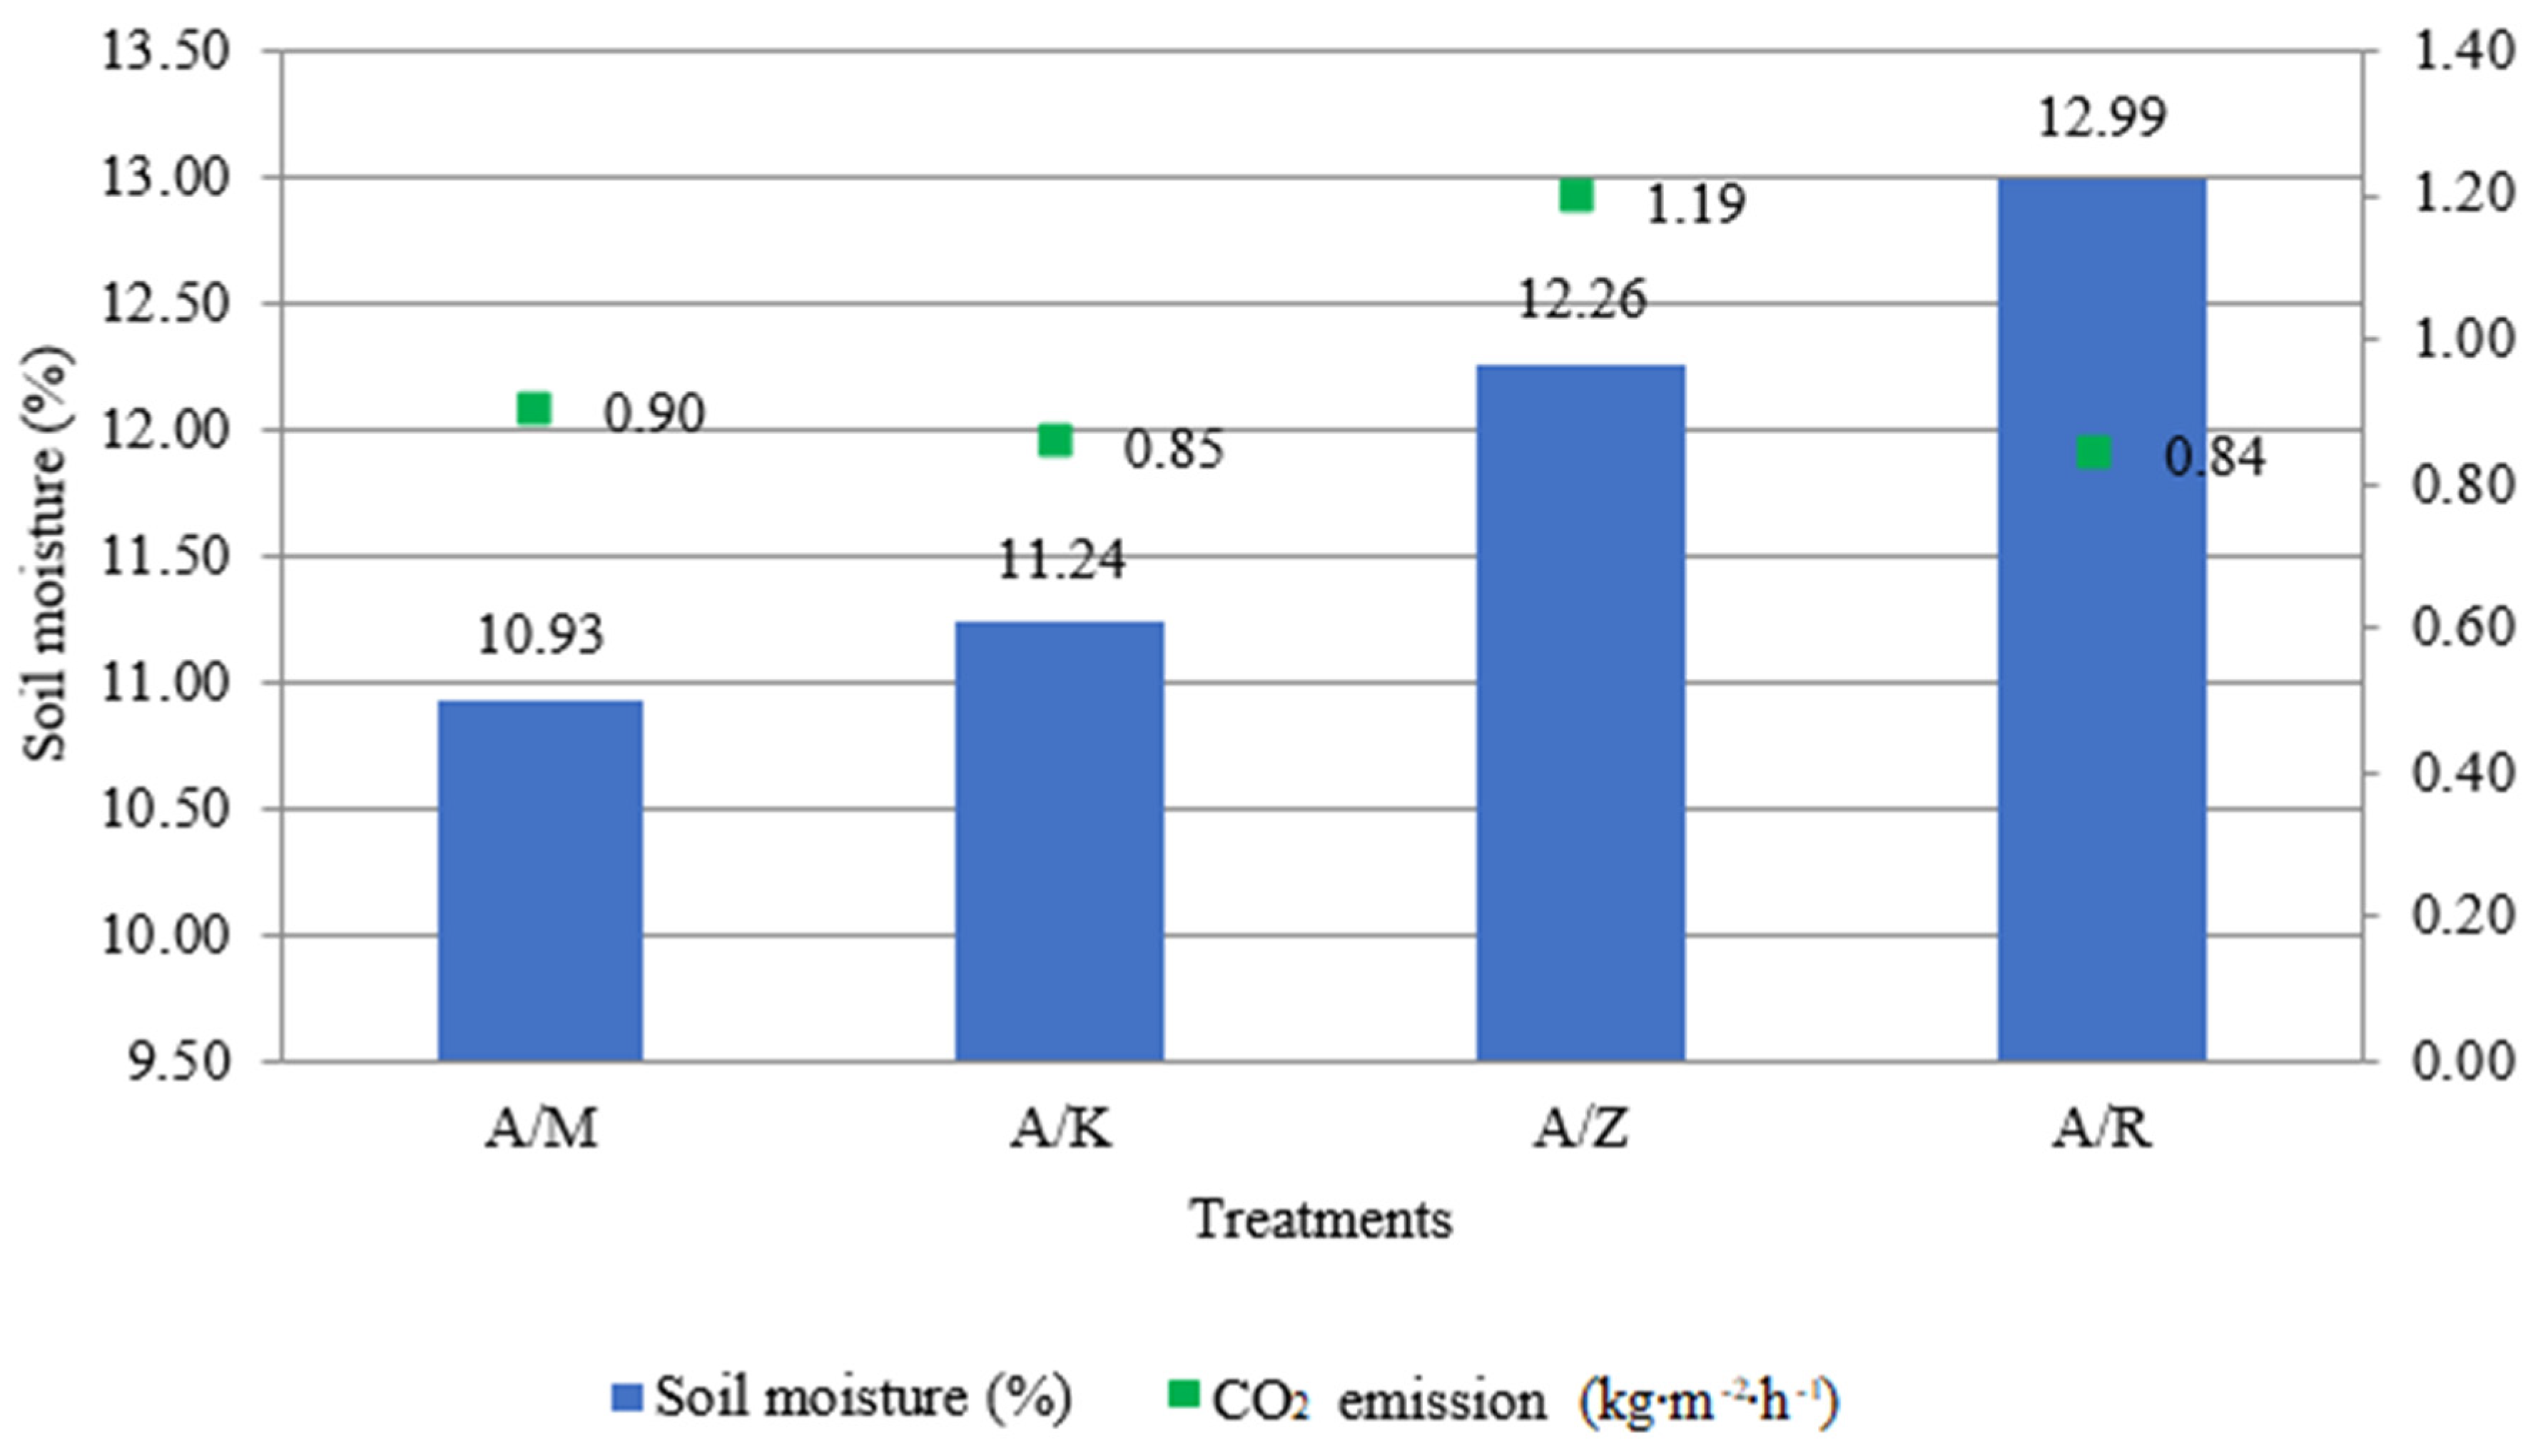
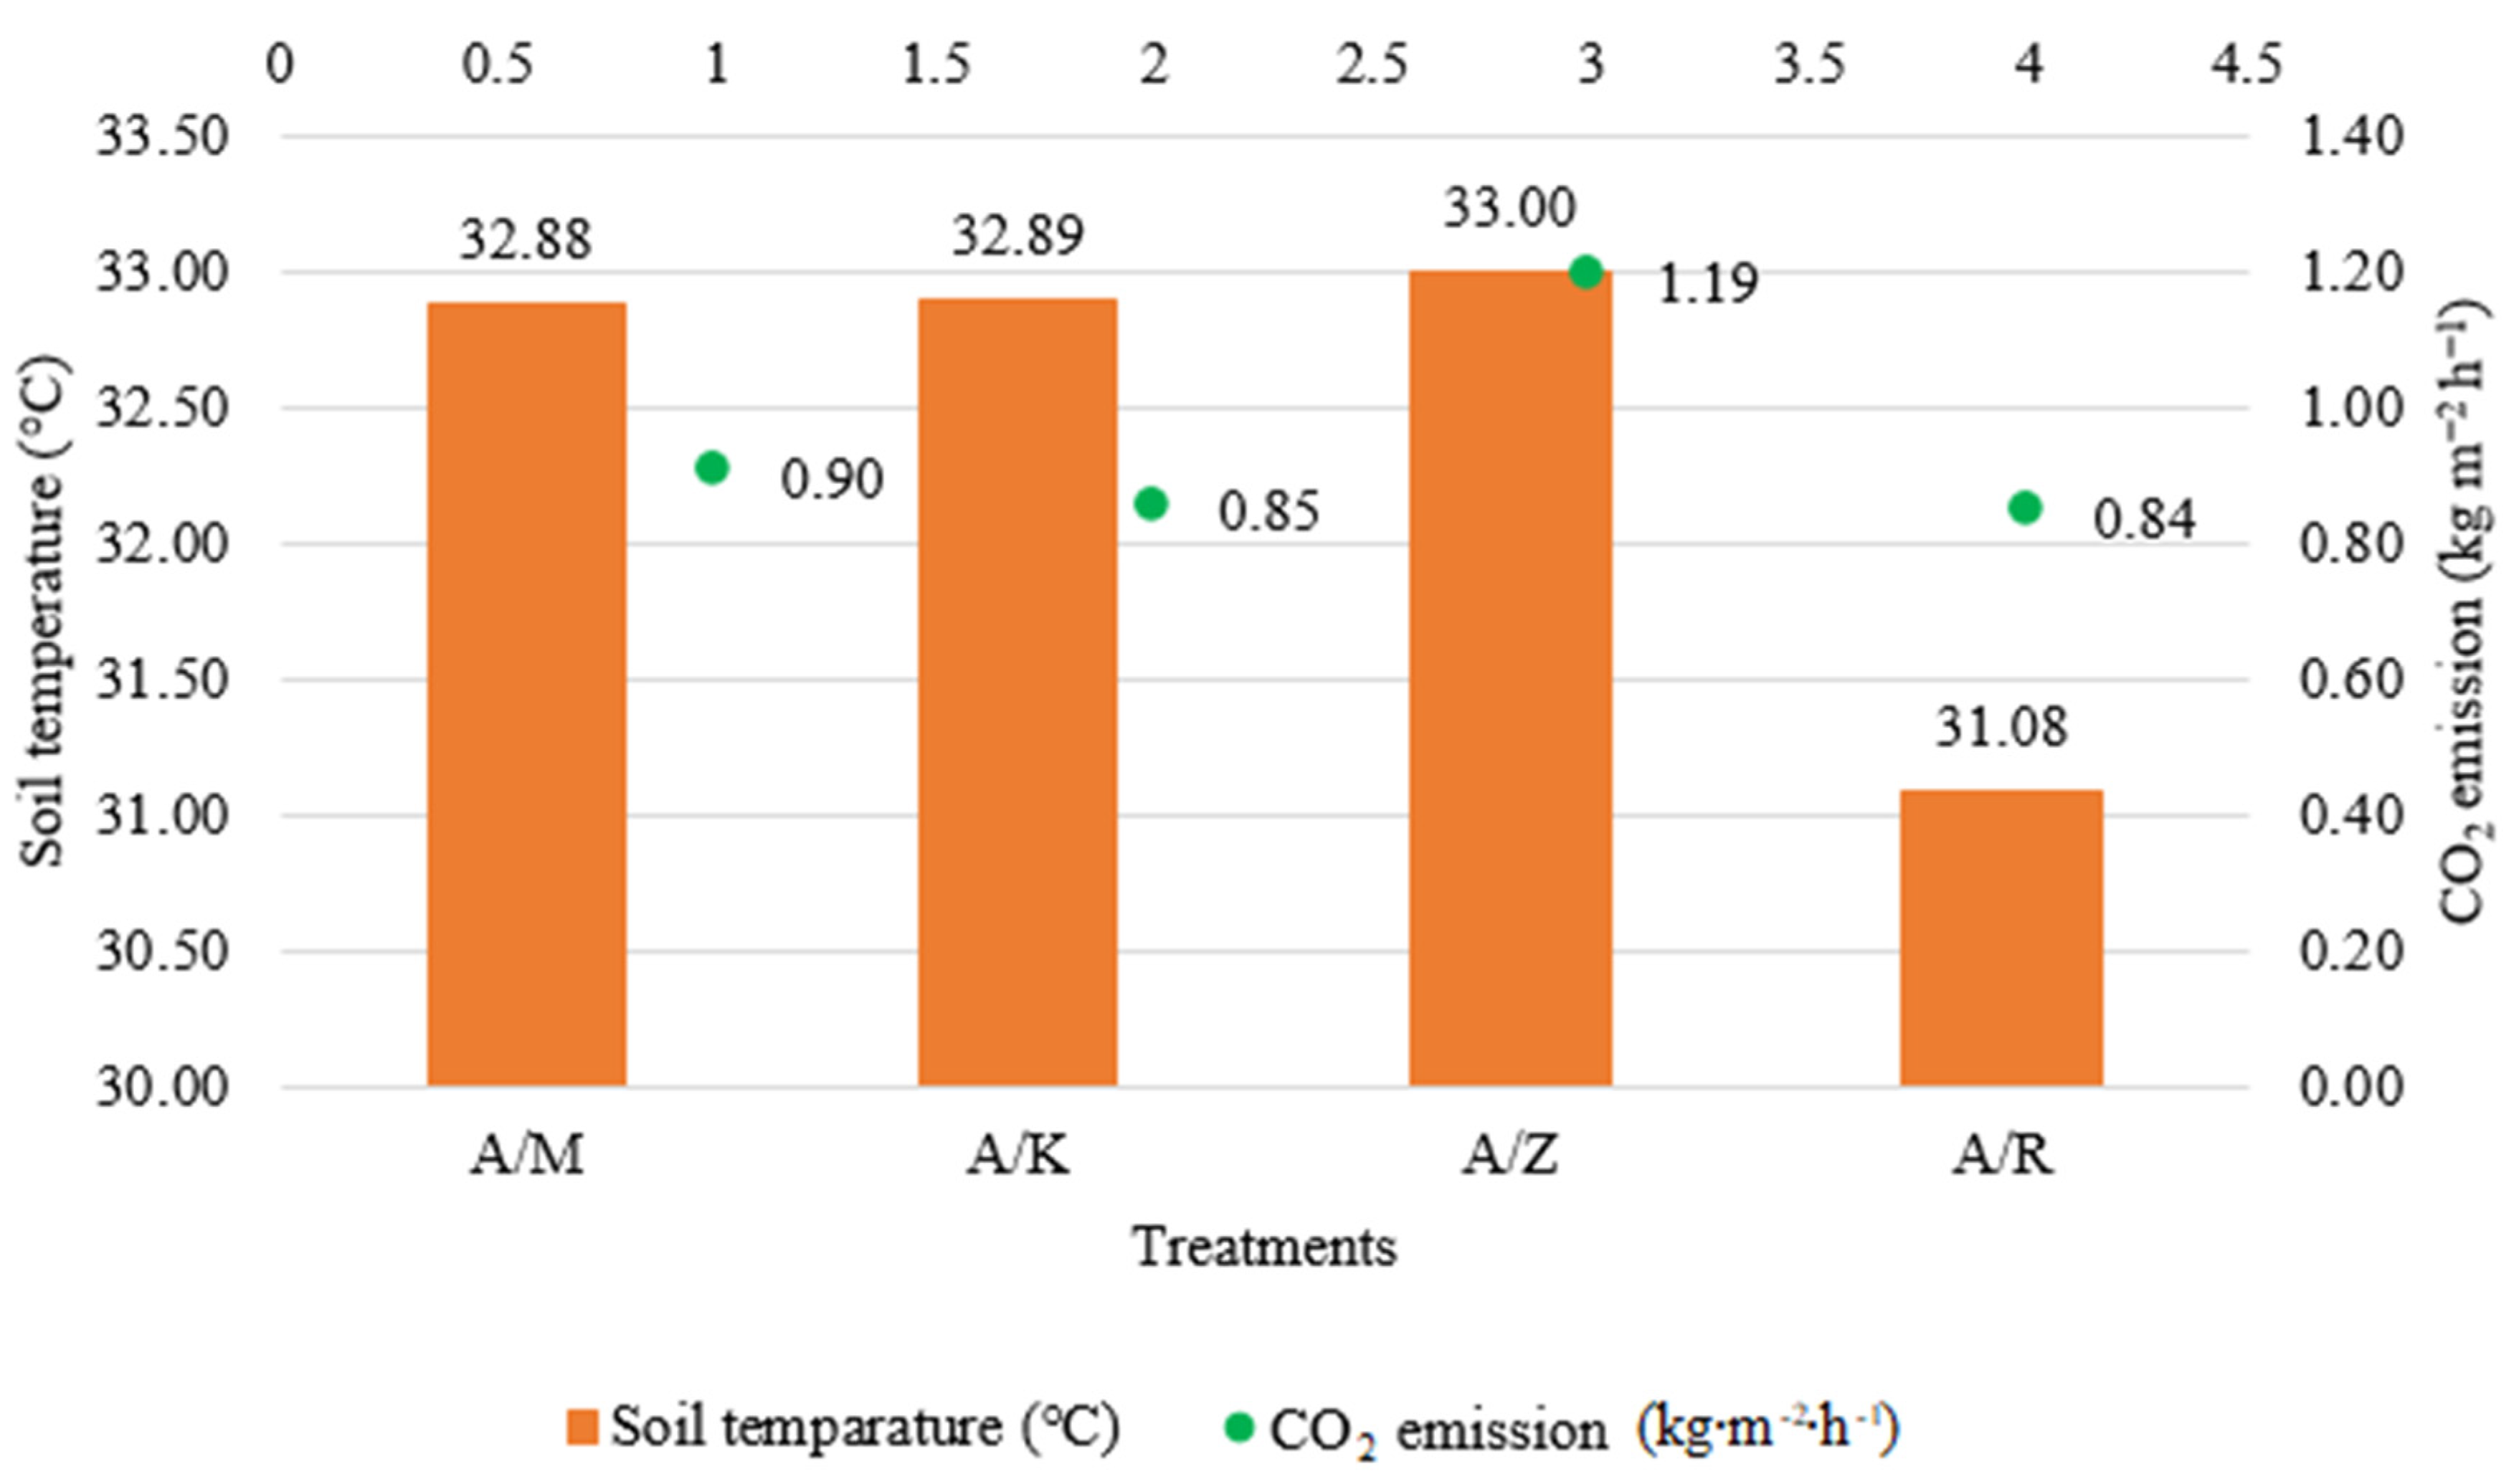
  • Unused/abandonment grassland: since 2009, the area has been unused (designation: A/Z);
  • Mulch treatment: since 3 May 2009 (Desigination: A/M);
  • Mowing treatment: Mowing only once a year, in the third decade of May, and removal of phytomass (designation: A/K);
  • Grassland management: Mowing in the third decade of May, haying, and, in August, sheep grazing on hay (designation: A/R);
In the grassland management, the so-called shepherding, underfoot grazing method, with a stocking rate of 10 sheep/ha, was used to harvest the grassland for the sheep flocks (Figure 1).
Soil CO2 concentrations, soil temperature and soil moisture were measured at regular intervals in 2019 and 2020 (28 March 2019–1 October 2019 and 7 April 2020–9 October 2020). This was generally done every 2 weeks after dew had started to rise, between 9:00 a.m.–10:00 a.m., thus avoiding warming.
Soil CO2 emissions were measured using a framework method developed at the Karcag Research Institute [57]. The instrument consists of a metal frame with a groove, specifically designed for the turf surface, and a vessel to delimit the measurement surface. The vessel used to delimit the measurement surface ensures that the gas does not escape during the measurement of CO2 concentration, which is ensured by filling the rim on the metal frame with water, allowing for an airtight isolation. A Testo 535 infrared gas analyser was used to measure the CO2 concentration. The measurement procedure is as follows: after delimitation of the measurement area, the area is covered, the incubation time (30 min) passes, and the CO2 concentration in the vessels is measured. The 30 min incubation time does not saturate the measuring device and is the most optimal time as it allows the highest CO2 concentration to be measured. The results of values measured at shorter incubation times have too high a standard deviation and longer incubation times decrease the concentration of the gas.
The following Formula (2) was used to calculate the CO2 emission values:
F = d × V/A × (C1 − C2)/t × 273/(273 + T)
where F = CO2 emission (kg m−2·h−1); d= CO2 volume density (1.96 kg m−3); V= volume of the cylinder above ground level (0.0040 m3); A = measurement surface (0,0314 m2); C1= initial CO2 concentration (m3 m−3); C2= post-incubation CO2 concentration (m3 m−3); t= incubation time (1800 s); T= air temperature (°C).
For the soil moisture and soil temperature measurements, we used a Truebner Combine 6000 SMT-100 type instrument, which measures the dielectric conductivity of the soil and calculates the moisture content, expressed as a percentage by volume. The calibration of the instrument is not soil specific; it can be widely used. The instrument measures the values to one decimal place. It can be used to measure the average moisture content of a 0–10 cm layer. It also measures the temperature of the layer at the same time as measuring the moisture content, the results being read from a hand-held data logger display.
One-way analysis of variance was used to statistically evaluate our results. The results are averaged by treatment for better clarity.

3. Results

In our 2019 study, the highest values of carbon dioxide emissions for all treatments were obtained between 23 May and 6 June (Figure 2 and Figure 3). Trends in soil temperature, soil moisture, and carbon dioxide emission for the year were plotted independently of the treatments.
As May 2019 was slightly rainy (0.254 mm/°C) according to the climate index, this fact could be one of the determinants of the previous results. The lowest carbon dioxide emission values were measured for meadow use on 04/07 and 22/07. If we assign climate indices to these measurement dates, June was droughty (0.095 mm/°C), and July was also droughty (0.088 mm/°C) at the experimental site.
Based on the data from our experiment, it is likely that grassland under grazed (meadow) use also contributes less carbon dioxide to the atmosphere than grassland left fallow. When comparing the carbon emission values of the treatments, the following results were obtained. At measurement 11 (15 August 2019), when comparing mulch and meadow cover treatments and mulch and mowing treatments, the carbon emission values of the mulch treatment were higher (p-value: 0.005 and 0.003, respectively). At the same time of measurement, when comparing unused/abandonment grassland with meadow tillage and unused/abandonment grassland with mowing, the carbon emission values of the unused/abandonment grassland treatment were higher (p-value: 0.023 and 0.009, respectively). When comparing the meadow use and mowing treatments, the carbon emission values of the meadow use treatment were higher (p-value: 0.038). In the 13th measurement (11 September 2019), when comparing mulch and meadow cover treatments and mulch and mowing treatments, the carbon emission values of the mulch treatment were higher (p-value: 0.001 and 0.028, respectively). At the same time of measurement, when comparing unused/abandonment grassland with meadow tillage and unused/abandonment grassland with mowing, the carbon emission values of the unused/abandonment grassland treatment were higher (p-value: 0.007 and 0.025, respectively). When comparing the meadow use and mowing treatments, the carbon emission values of the mowing treatment were higher (p-value: 0.013). At the 14th measurement date (1 October 2019), the carbon emission values of the mowing treatment were higher (p-value: 0.046) when comparing the meadow mowing treatment with the mowing treatment.
The soil moisture and temperature of the treatments were measured at the same time as the carbon dioxide measurement dates at a depth of 0–10 cm: 16.23% soil moisture was measured on 8 May 2019, which was the same in the mowing treatment plots, as the previous two weeks had received 74.7 mm of rainfall. August was desert (0.020 mm/°C) and September semi-desert (0.079 mm/°C) in terms of climate index.
The extremely long period of drought in the summer was interrupted by a 22 mm rainfall in the first decade of September, before our measurement date of 11 September (Figure 4 and Figure 5). The highest values of carbon dioxide emissions were then measured for unused/abandonment and mulched grassland use, the lowest for mowing and meadow use. The soil moisture values, on the other hand, show the opposite order.
Carbon dioxide emissions data for 2020 were similar to the previous year, with the highest carbon dioxide emissions also measured in the summer of the year under review (Figure 6 and Figure 7). Trends in soil temperature, soil moisture and carbon dioxide emission for the year are plotted independently of treatments.
In 2020, we were unable to measure any data on two occasions during the measurement period, as a total of 206.1 mm of precipitation fell between 18 June and 27 July 2020, which could not be absorbed into the soil. These months (June, July) were considered as fresh for the climate index (0.194 mm/°C and 0.209 mm/°C). Lower values were recorded in the spring and autumn periods, as April (0.028 mm/°C), May (0.040 mm/°C) and September (0.057 mm/°C) were desert-like.
Temperature and moisture of the soil in the treatments were measured at the same time as the carbon dioxide measurement dates at 0–10 cm depth, similar to 2019. Due to the high rainfall in summer, we measured the highest soil moisture in the mulch treatment: 21.30% (28 July 2020). Soil temperature data were broadly even throughout the year, with the highest temperature data measured in the unused/abandonment grassland plots on 3 June (39.77 °C) (Figure 8 and Figure 9).
When comparing the carbon-dioxide emission values of the treatments, the following results were obtained: in the 2nd measurement (21 April 2020), when comparing mulch and meadow use treatments and unused/abandonment grassland and meadow use treatments, the carbon emission values of the meadow use treatment were higher (p-value: 0.016 and 0.009, respectively). At the same time of measurement, when comparing unused/abandonment grassland and mowing treatments and mulch and mowing treatments, the carbon emission values of the mowing treatment were higher (p-value: 0.024 and 0.039, respectively). At the 5th measurement (3 June 2020), when comparing the unused/abandonment grassland treatment with the meadow mowing treatment and the unused/abandonment grassland treatment with the mowing treatment and the unused/abandonment grassland treatment with the mulch treatment, the carbon emission values of the unused/abandonment grassland treatment were higher (p-value: 0.004, p-value: 0.012, and p-value: 0.0007, respectively). At measurement 9 (28 July 2020), when comparing unused/abandonment grassland and mowing treatments and unused/abandonment grassland and mulch treatments, the carbon emission values of the unused/abandonment grassland treatment were higher (p-value: 0.033, p-value: 0.021).
Similar measurement periods in 2019–2020 were compared using analysis of variance, which found that 2019 had higher CO2 emission content. Our hypothesis was proved by analysis of variance, which showed that no significant result was obtained when comparing the first and the 9th measurement (p-value: 0.072 and 0.603, respectively), while, in the other cases, the analysis of variance results showed a strong correlation.

4. Discussion

Temperature, as well as precipitation, affects the CO2 emissions of the grassland. The results of our studies confirm the findings of Kovács and Szőllősi [20] and Zsembeli et al. [21]; furthermore, Birkás [22] found that CO2 concentrations are higher in mulch-covered areas. Carbon dioxide emission values were verifiably the highest for unused/abandonment grassland at all measurement dates, indicating the potential threat of fallow grasslands in the fight against climate change.
In the unused/abandonment and mulched treatments, the soil surface is covered by a crust of dead phytomass tissue tissue, and in the mowed treatment, dense leafy growth that is not suitable for mowing can reach a height of ~15 cm, already shading by July. However, in meadow utilisation, the leaf litter was grazed by sheep, so the drying effect of the sapping sunshine may have been more pronounced, and the living conditions for carbon dioxide-producing microbes may have been less favourable, and they were least likely to have access to dead organic matter sources in meadow utilization. As temperatures rise, so do CO2-emissions from grasslands [58].
High precipitation increases CO2 emissions [59]. CO2 emissions remained lower under mowing and meadow management under intensive rainfall [60], whereas CO2 emissions increased after high rainfall in areas covered with mulch or straw. In the agricultural sector, we predicted parallel movements in carbon dioxide emissions and soil moisture due to the results of the spreading mulch technologies due to climate change. However, with the accumulation of grass coppice for the 13th year and unusually long periods of no precipitation due to climate change, the results of our measurements did not follow the “paper form” on several occasions.
The accumulation of duff in the unused/abandonment and mulched grassland systems, after a prolonged period of aridity, prevents the rainfall from reaching the soil, up to a certain limit. However, despite this, the duff, which continuously feeds soil bacteria, can result in high soil biological activity that produces high levels of carbon dioxide, even at lower soil moisture values.

5. Conclusions

The extent of carbon emissions from grassland is crucial to the problems of climate change. The higher amounts of precipitation that are predicted to fall after a longer period of drought due to climate change may be partially retained by a thicker layer of fallow grassland, and thus trend-breaking soil moisture values may be measured. The results of our experiment have provided new data to clarify the fact that unutilised grassland covered with phytomass has high carbon emissions, and this is also true during periods of drought and rainfall. Avoiding the accumulation of phytomass is therefore critical for the climate index to reduce carbon emissions. In the Great Plain, the carbon emissions from fallowing and underutilisation should be addressed in as many semi-natural arid grassland associations as possible.

Author Contributions

K.V., A.H., G.P.K. and I.C. conceived and designed the experiments; performed the field experiments and analyzed the data; wrote the paper, and revised the manuscript. All authors have read and agreed to the published version of the manuscript.

Funding

This research received no external funding.

Data Availability Statement

The study did not report any data.

Conflicts of Interest

The authors declare no conflict of interest.

References

  1. Campbell, B.; Frost, P.; Byron, N. Miombo woodlands and their use: Overview and key issues. In The Miombo in Transition: Woodlands and Welfare in Africa; Campbell, B., Ed.; Center for International Forestry Research: Bogor, Indonesia, 1996; pp. 1–10. [Google Scholar]
  2. White, P.R.; Murray, S.; Rohweder, M. Pylot Analysis of Global Ecosystems. Grassland Ecosystems; World Resources Institute: Washington, DC, USA, 2000; pp. 1–89. [Google Scholar]
  3. Hunt, J.E.; Kelliher, F.M.; McSeveny, T.M.; Byers, J.N. Evaporation and carbon dioxide exchange between the atmosphere and a tussock grassland during a summer drought. Agric. For. Meteorol. 2002, 111, 65–82. [Google Scholar] [CrossRef]
  4. Heimsch, L.; Lohila, A.; Tuivinen, J.-P.; Vekuri, H.; Heinonsalo, J.; Nevalainen, O.; Korkiakoski, M.; Liski, J.; Laurila, T.; Kulmala, L. Carbon dioxide fluxes and carbon balance of an agricultural grassland in southern Finland. Biogeosciences 2021, 18, 3467–3483. [Google Scholar] [CrossRef]
  5. Keesstra, S.D.; Bouma, J.; Wallinga, J.; Tittonell, P.; Smith, P.; Cerdà, A.; Montanarella, L.; Quinton, J.N.; Pachepsky, Y.; van der Putten, W.H.; et al. The Significance of Soils and Soil Science towards Realization of the United Nations Sustainable Development Goals. Soil 2016, 2, 111–128. [Google Scholar] [CrossRef] [Green Version]
  6. Feng, J.; Wang, J.; Ding, L.; Yao, P.; Qiao, M.; Yao, S. Meta-Analyses of the Effects of Major Global Change Drivers on Soil Respiration across China. Atmos. Environ. 2017, 150, 181–186. [Google Scholar] [CrossRef]
  7. Singh, M.; Sarkar, B.; Sarkar, S.; Churchman, J.; Bolan, N.; Mandal, S.; Menon, M.; Purakayastha, T.J.; Beerling, D.J. Stabilization of soil organic carbon as influenced by clay mineralogy. Adv. Agron. 2018, 148, 33–84. [Google Scholar] [CrossRef]
  8. Yang, Y.; Tilman, D.; Furey, G.; Lehman, C. Soil carbon sequestration accelerated by restoration of grassland biodiversity. Nat. Commun. 2019, 10, 718. [Google Scholar] [CrossRef] [Green Version]
  9. Minasny, B.; Malone, B.P.; McBratney, A.B.; Angers, D.A.; Arrouays, D.; Chambers, A.; Chaplot, V.; Chen, Z.-S.; Cheng, K.; Das, B.S.; et al. Soil carbon 4 per mille. Geoderma 2017, 292, 59–86. [Google Scholar] [CrossRef]
  10. Szente, K.; Nagy, Z.; Tuba, Z. Enhanced water use efficiency in dry loess grassland species grown at elevated air CO2 concentration. Photosynthetica 1998, 35, 637–640. [Google Scholar] [CrossRef]
  11. Stefler, J.; Nagy, G.; Vinczeffy, I. Különböző adottságú gyepek hasznosíthatósága húsmarhatartással. Állattenyésztés Takarmányozás 2000, 49, 495–496. [Google Scholar]
  12. Magyar, I.E. Gyógynövényes Gyep Telepíthetősége, Gyepgazdálkodási Módszerek Növényállományra Gyakorolt Hatásának Értékelése. Ph.D. Thesis, Szent István Egyetem, Gödöllő, Hungary, 2009. [Google Scholar]
  13. Czóbel, S.; Szirmai, O.; Németh, Z.; Gyuricza, C.; Házi, J.; Tóth, A.; Schellenberger, J.; Vasa, L.; Penksza, K. Short-term effects of grazing exclusion on net ecosystem CO2 exchange and net primary production in a Pannonian sandy grassland. Not. Bot. Horti Agrobot. Cluj-Napoca 2012, 40, 67–72. [Google Scholar] [CrossRef] [Green Version]
  14. Dhital, D.; Prajapati, S.; Maharjan, S.R.; Koizumi, H. Soil Carbon Dioxide Emission: Soil Respiration Measurement in Temperate Grassland, Nepal. J. Environ. Prot. 2019, 10, 289–314. [Google Scholar] [CrossRef] [Green Version]
  15. Lorenz, K.; Lal, R. Carbon Sequestration in Agricultural Ecosystems; Springer: Cham, Switzerland, 2018; pp. 39–136. [Google Scholar] [CrossRef]
  16. Harrison, P.A.; Dunford, R.W.; Holman, I.P.; Cojocaru, G.; Madsen, M.S.; Chen, P.-Y.; Pedde, S.; Sandars, D. Differences between low-end and high-end climate change impacts in Europe across multiple sectors. Reg. Environ. Chang. 2019, 19, 695–709. [Google Scholar] [CrossRef] [Green Version]
  17. Bastos, A.; Ciais, P.; Friedlingstein, P.; Sitch, S.; Pongratz, J.; Fan, L.; Wigneron, J.; Weber, U.; Reichstein, M.; Fu, Z.; et al. Direct and seasonal legacy effects of the 2018 heat wave and drought on European ecosystem productivity. Sci. Adv. 2020, 6, eaba2724. [Google Scholar] [CrossRef] [PubMed]
  18. Tramontana, G.; Jung, M.; Schwalm, C.R.; Ichii, K.; Camps-Valls, G.; Ráduly, B.; Reichstein, M.; Altaf Arain, M.; Cescatti, A.; Kiely, G.; et al. Predicting carbon dioxide and energy fluxes across global FLUXNET sites with regression algorithms. Biogeosciences 2016, 13, 4291–4313. [Google Scholar] [CrossRef] [Green Version]
  19. Balogh, J.; Fóti, S.; Pintér, K.; Cserhalmi, D.; Papp, M.; Koncz, P.; Nagy, Z. A talajok CO2-kibocsátásának jelentősége hazai gyepek szénforgalmában. Kitaibelia 2012, 17, 9. [Google Scholar]
  20. Kovács, G.; Szőllősi, N. A talaj CO2-emissziójának mérésére szolgáló eszközök mérőhelyspecifikus fejlesztése. Agrártudományi Közlemények 2008, 30, 53–58. [Google Scholar]
  21. Zsembeli, J.; Szűcs, L.; Tuba, G.; Czimbalmos, R. Nedvességtakarékos talajművelési rendszer fejlesztése Karcagon. In Környezetkímélő Talajművelési Rendszerek Magyarországon; Madarász, B., Ed.; MTA CSFK FTI: Budapest, Magyarorság, 2015; pp. 122–133. [Google Scholar]
  22. Birkás, M. Földművelés és Földhasználat; Mezőgazda Lap-és Könyvkiadó: Budapest, Magyarország, 2017; pp. 1–482. [Google Scholar]
  23. Kovács, G.; Tuba, G.; Czimbalmos, R.; Csízi, I. Különböző komposztadagok hatása az extenzív gyep talajának néhány tulajdonságára. Gyepgazdálkodási Közlemények 2013, 9–14. [Google Scholar] [CrossRef]
  24. Oertel, C.; Matschullatt, J.; Zurba, K.; Zimmermann, F.; Erasmi, S. Greenhouse gas emissions from soils. A review. Geochemistry 2016, 76, 327–352. [Google Scholar] [CrossRef] [Green Version]
  25. Hénault, C.; Bourennane, H.; Ayzac, A. Management of pH promotes notrous oxide reduction and thus mitigates soil emissions of this greenhouse gas. Sci. Rep. 2019, 9, 20182. [Google Scholar] [CrossRef] [Green Version]
  26. Wu, G.; MinChen, X.; Ling, J.; Li, F.; Li, F.Y.; Peixoto, L.; When, Y.; Zhou, S.L. Effect of soil warming and increased precipitation on greenhouse gas fluxes in spring maize seasons in the North China Plain. Sci. Total Environ. 2020, 734, 139269. [Google Scholar] [CrossRef]
  27. Szemán, L. Gyepgazdálkodási Módszertan; Szent István Egyetem: Gödöllő, Magyarország, 2006; pp. 1–103. [Google Scholar]
  28. Szemán, L. Gyepgazdálkodási Ismeretek; Szent István Egyetem: Gödöllő, Magyarország, 2006; pp. 1–89. [Google Scholar]
  29. Szemán, L. Gyep és Tájgazdálkodás; Szent István Egyetem: Gödöllő, Magyarország, 2008; pp. 1–94. [Google Scholar]
  30. Enyedi, Z.M.; Ruprecht, E.; Deák, M. Long-term effects of the abandonment of grazing on steppe-like grasslands. Appl. Veg. Sci. 2008, 11, 53–60. [Google Scholar] [CrossRef] [Green Version]
  31. Mitchley, J.; Xofis, P. Landscape structure and management regime as indicators of calcareous grassland habitat condition and species diversity. J. Nat. Conserv. 2005, 13, 171–183. [Google Scholar] [CrossRef]
  32. Tasi, J.; Bajnok, M.; Halász, A.; Szabó, F.; Harkányiné Székely, Z.; Láng, V. Magyarországi komplex gyepgazdálkodási adatbázis létrehozásának első lépései és eredményei. Gyepgazdálkodási Közlemények 2014, 57–64. Available online: https://ojs.lib.unideb.hu/gygk/article/view/9770/8699 (accessed on 6 February 2022).
  33. Vincze, J. Az Észak-Magyarországi Régió Állattenyésztésének Fejlesztési Lehetőségei és Irányai. Ph.D. Thesis, Nyugat-Magyarországi Egyetem, Sopron, Hungary, 2008. [Google Scholar]
  34. Wiliems, J.H.; Bik, L.P.M. Restoration of high species density in calcareous grassland: The role of seed rain and soil seed bank. Appl. Seed Ecol. 1998, 1, 91–100. [Google Scholar] [CrossRef]
  35. Török, P.; Arany, I.; Prommer, M.; Valkó, O.; Balogh, A.; Vida, E.; Tóthmérész, B.; Matus, G. Újrakezdett kezelés hatása fokozottan védett kékperjés láprét fitomasszájára, faj-és virággazdagságára. Természetvédelmi Közlemények 2007, 13, 187–198. [Google Scholar]
  36. Kahmen, S.; Poschlod, P.; Schreiber, K.-F. Conservation management of calcareous grasslands. Changes in plant species composition and response of functional traits during 25 years. Biol. Conserv. 2002, 104, 319–328. [Google Scholar] [CrossRef]
  37. Isselstein, J.; Jeangros, B.; Pavlů, V. Agronomic aspects of biodiversity targeted management of temperate grasslands in Europe—A review. Agric. Res. 2005, 3, 139–151. [Google Scholar]
  38. Penksza, K.; Fehér, Á.; Saláta, D.; Pápay, G.S.; Falusi, E.; Kerényi-Nagy, V.; Szabó, G.; Wichmann, B.; Szemethy, L.; Katona, K. Gyepregeneráció és vadhatás vizsgálata cserjeirtás után parádóhutai (Mátra) mintaterületen. Gyepgazdálkodási Közlemények 2016, 14, 31–41. [Google Scholar]
  39. Pápay, G. Cserjeirtás után magára hagyott, legeltetett és kaszált gyepterületek vegetációjának összehasonlító elemzése parádóhutai (Mátra) mintaterületen. Gyepgazdálkodási Közlemények 2016, 14, 37–48. [Google Scholar]
  40. Barcsák, Z.; Baskay-Tóth, B.; Prieger, K. Gyeptermesztés és Hasznosítás; Mezőgazdasági Kiadó: Budapest, Magyarország, 1978; pp. 1–339. [Google Scholar]
  41. Szabó, G.; Zimmermann, Z.; Szentes, S.; Sutyinszki, Z.; Penksza, K. Természetvédelmi és gyepgazdálkodási vizsgálatok a Dinnyési-Fertő gyepeiben. Gyepgazdálkodási Közlemények 2010, 8, 31–38. [Google Scholar]
  42. Bajor, Z.; Zimmermann, Z.; Szabó, G.; Fehér, Z.; Járdi, I.; Lampert, R.; Kerény-Nagy, V.; Penksza, P.L.; Szabó, Z.; Székely, Z.; et al. Effect of conservation management practices on sand grassland vegetation in Budapest, Hungary. Appl. Ecol. Environ. Res. 2016, 14, 233–247. [Google Scholar] [CrossRef]
  43. Hansson, M.; Fogelfors, H. Management of semi-natural grassland; results from a 15-year old experiment in southern Sweden. J. Veg. Sci. 2000, 11, 31–38. [Google Scholar] [CrossRef]
  44. Kozák, L. Élőhely-Kezelés; Debreceni Egyetem, Agrár-és Gazdálkodástudományok Centruma: Debrecen, Magyarország, 2011; pp. 1–86. [Google Scholar]
  45. Szentes, S.; Sutyinszki, Z.; Zimmermann, Z.; Szabó, G.; Járdi, I.; Házi, J.; Penksza, K.; Bartha, S. A fenyérfű (Bothriochloa ischaemum L. Keng 1936.) gyep béta-diverzitására gyakorolt hatásainak vizsgálata és értékelése mikrocönológiai módszerekkel. Tájökológiai Lapok 2011, 9, 463–475. [Google Scholar]
  46. Szentes, S.; Sutyinszki, Z.; Szabó, G.; Zimmermann, Z.; Házi, J.; Wichmann, B.; Hufnágel, L.; Penksza, K.; Bartha, S. Grazed Pannonian grassland beta-diversity changes due to C4 yellow bluestem. Cent. Eur. J. Biol. 2012, 7, 1055–1065. [Google Scholar] [CrossRef]
  47. Perevolotsky, A.; Seligman, N.G. Role of grazing in Mediterranean rangeland ecosystems. Bioscience 1998, 48, 1007–1017. [Google Scholar] [CrossRef] [Green Version]
  48. Bakker, J.P.; Berendse, F. Constraints in the restoration of ecological diversity in grassland and heathland communities. Trends Ecol. Evol. 1999, 14, 63–68. [Google Scholar] [CrossRef]
  49. Ryser, P.; Langenauer, R.; Gigon, A. Species richness and vegetation structure in a limestone grassland after 15 year management with six biomass removal regimes. Folia Geobot. Phytotaxon. 1995, 30, 157–167. [Google Scholar] [CrossRef]
  50. Buermann, W.; Forkel, M.; O’Sullivan, M.; Sitch, S.; Friedlingstein, P.; Haverd, V.; Jain, A.K.; Kato, E.; Kautz, M.; Lienert, S.; et al. Widespread seasonal compensation effects of spring warming on northern plant productivity. Nature 2018, 562, 110–114. [Google Scholar] [CrossRef] [Green Version]
  51. Brockway, D.G.; Gatewood, R.G.; Paris, R.B. Restoring fire as an ecological process in shortgrass prairie ecosystems: Initial effects of prescribed burning during the dormant and growing seasons. J. Environ. Manag. 2006, 65, 135–162. [Google Scholar] [CrossRef] [Green Version]
  52. Ónodi, G.; Kertész, M.; Botta-Dukát, Z.; Altbäcker, V. Grazing Effects on Vegetation Composition and on the Spread of Fire on Open Sand Grasslands. Arid Land Res. Manag. 2008, 22, 273–285. [Google Scholar] [CrossRef]
  53. Varga, K.; Csízi, I.; Monori, I.; Valkó, O. Threats and challenges related to grazing paddocks: Recovery of extremely overgrazed grassland after grazing exclusion. Arid Land Res. Manag. 2021, 35, 346–357. [Google Scholar] [CrossRef]
  54. Vinczeffy, I. Legelő-és Gyepgazdálkodás; Mezőgazda Kiadó: Budapest, Magyarország, 1993; pp. 1–400. [Google Scholar]
  55. Hortobágyi, T.; Simon, T. Növényföldrajz, Társulástan és Ökológia; Nemzeti Tankönyvkiadó: Budapest, Magyarország, 2000; pp. 1–538. [Google Scholar]
  56. Sefferová Stanová, V.; Janák, M.; Ripka, J. Management of Natura 2000 Habitats. 1530*Pannonic Salt Steppes and Salt Marshes; European Commission: Brussels, Belgium, 2008; pp. 1–26. [Google Scholar]
  57. Kovács, G. Mezőgazdasági Hasznosítású Talajok Széndioxid-Emissziójának Vizsgálata Karcag Térségében. Ph.D. Thesis, Debreceni Egyetem, Debrecen, Hungary, 2014. [Google Scholar]
  58. Rustad, L.E.; Campbell, J.L.; Marion, G.M.; Norby, R.J.; Mitchell, M.J.; Hartley, A.E.; Gurevitch, J. A meta-analysis of the response of soil respiration, net nitrogen mineralization, and aboveground plant growth to experimental ecosystem warming. Oecologia 2001, 126, 543–562. [Google Scholar] [CrossRef] [PubMed]
  59. Harper, C.W.; Blair, J.M.; Fay, P.A.; Knapp, A.K.; Carlisle, J.D. Increased rainfall variability and reduced rainfall amount decreases soil CO2 efflux in a grassland ecosystem. Glob. Chang. Biol. 2015, 11, 322–334. [Google Scholar] [CrossRef]
  60. Wan, S.; Luo, Y. Substrate regulation of soil respiration in a tallgrass prairie: Results of a clipping and shading experiment. Glob. Biogeochem. Cycles 2003, 17, 1054. [Google Scholar] [CrossRef] [Green Version]
Figure 1. Plots and photo of the experiment set up in the underutilised area (Karcag, 2019–2020) (own editing and photo).
Agronomy 12 00931 g001
Figure 2. Soil moisture (%) and carbon-dioxide-emission (kg·m−2·h−1) results for the 2019 study period, independent of treatments (Karcag).
Agronomy 12 00931 g002
Figure 3. Soil temperature (°C) and carbon-dioxide-emission (kg·m−2·h−1) results for the 2019 study period, independent of treatments (Karcag).
Agronomy 12 00931 g003
Figure 4. Average results of soil moisture (%), CO2-emission (kg m−2·h−1) by treatment on 11 September 2019 (Karcag). Note: A/Z: Unused/abandonment grassland treatment; A/M: mulch treatment; A/K: Mowing treatment; A/R: Grassland.
Agronomy 12 00931 g004
Figure 5. Average results of soil temperature (°C), CO2-emission (kg m−2·h−1) by treatment on 11 September 2019 (Karcag). Note: A/Z: Unused/abandonment grassland treatment; A/M: mulch treatment; A/K: Mowing treatment; A/R: Grassland.
Agronomy 12 00931 g005
Figure 6. Soil moisture (%) and carbon-dioxide-emission (kg m−2·h−1) results for the 2020 study period, independent of treatments (Karcag).
Agronomy 12 00931 g006
Figure 7. Soil temperature (°C) and carbon-dioxide-emission (kg m−2·h−1) results for the 2020 scheme.
Agronomy 12 00931 g007
Figure 8. Average results of soil moisture (%), CO2-emission (kg m−2·h−1) by treatment on 28 July 2020 (Karcag). Note: A/Z: Unused/abandonment grassland treatment; A/M: mulch treatment; A/K: Mowing treatment; A/R: Grassland.
Agronomy 12 00931 g008
Figure 9. Average results of soil temperature (°C), CO2-emission (kg·m−2·h−1) by treatment on 28 July 2020 (Karcag). Note: A/Z: Unused/abandonment grassland treatment; A/M: mulch treatment; A/K: Mowing treatment; A/R: Grassland.
Agronomy 12 00931 g009
Table 1. Average temperature and precipitation (Karcag) in the period under review (2019–2020).
MonthAverage Temperature (°C)Monthly Rainfall (mm)
2019202020192020
January2.20−1.00−1.3019.80
February0.203.704.7040.20
March3.209.006.6034.40
April16.1012.9011.509.80
May19.8014.6014.5017.80
June21.2023.1020.30118.40
July22.5021.8021.50139.30
August24.0023.8023.0073.30
September18.3017.2018.4031.70
October13.7012.9012.10111.20
November7.109.105.0013.80
December0.803.103.8038.80
Annual12.5013.3011.70648.50
Table 2. Monthly nature of the 2019–2020 climate index (Karcag).
Month, YearMonthly Mean Temperature (°C)Monthly Precipitation Sum (mm)Climate Index (mm/°C)Categories of Climate Index
January, 2019−1.031.2−1.006-
February, 20193.76.20.06desert
March, 20199.08.80.032desert
April, 201912.947.30.122dry
May, 201914.6116.70.258slighty rainy
June, 201923.165.50.095arid
July, 201921.859.50.088arid
August, 201923.814.60.02desert
September, 201917.240.60.079semi-desert
October, 201912.98.40.021desert
November, 20199.172.20.264slighty rainy
December, 20193.134.10.355very rainy
January, 2020−1.319.8−0.491-
February, 20204.740.20.295rainy
March, 20206.634.40.168medium
April, 202011.59.80.028desert
May, 202014.517.80.04desert
June, 202020.3118.40.194above
July, 202021.5139.30.209above
August, 202023.073.30.103arid
September, 202018.431.70.057desert
October, 202012.1111.20.296rainy
November, 20205.013.80.092arid
December, 20203.838.80.329very rainy
Note: 0.05 mm/°C—desert, 0.075 mm/°C—semi-desert, 0.1 mm/°C—arid, 0.125 mm/°C—dry, 0.15 mm/°C—slightly dry, 0.175 mm/°C—medium, 0.2 mm/°C—arid, 0.225 mm/°C—optimal, 0.25 mm/°C—slightly rainy, 0.3 mm/°C—rainy, above 0.3 mm/°C—very rainy.
Publisher’s Note: MDPI stays neutral with regard to jurisdictional claims in published maps and institutional affiliations.

