Article

Effect of Genetics and Climate on Apple Sugars and Organic Acids Profiles

by
Pierre Mignard
1,
Santiago Beguería
2,
Rosa Giménez
1,
Carolina Font i Forcada
1,3,
Gemma Reig
1,3 and
María Ángeles Moreno
1,*
1
Department of Pomology, Estación Experimental de Aula Dei, Consejo Superior de Investigaciones Científicas (EEAD-CSIC), P.O. Box 13034, 50080 Zaragoza, Spain
2
Department of Soil and Water, Estación Experimental de Aula Dei, Consejo Superior de Investigaciones Científicas (EEAD-CSIC), P.O. Box 13034, 50080 Zaragoza, Spain
3
Department of Fruit Production, IRTA Fruitcentre, PCiTAL, Park of Gardeny, Fruitcentre Building, 25003 Lleida, Spain
*
Author to whom correspondence should be addressed.
Agronomy 2022, 12(4), 827; https://doi.org/10.3390/agronomy12040827
Submission received: 9 March 2022 / Revised: 24 March 2022 / Accepted: 25 March 2022 / Published: 29 March 2022
(This article belongs to the Section Horticultural and Floricultural Crops)

Abstract

:
Apple is widely cultivated in temperate regions. The beneficial properties of apple for preventing several illnesses are widely known. Nevertheless, qualitative variables such as sweetness or sourness may influence consumer satisfaction; they are critical factors for fruit consumption and essential in plant breeding. In the present work, 155 apple accessions were assessed during five consecutive years (2014–2018). Four individual sugars and seven organic acids were analysed by HPLC. A mixed-effects model was fitted with accessions and the years’ climatic features as independent variables. A cluster analysis was applied on the mixed-effects model coefficients. Four groups were considered as optimum. Genetics seemed to have the strongest effect and showed clear differences between accession groups, while climate effects were strong only for certain compounds and had a more horizontal behaviour equally affecting the different accession groups. In fact, non-Spanish cultivars tended to concentrate, while autochthone accessions had a much wider spread. Individual sugars and acids concentrations correlated negatively with precipitation and positively with temperature range and solar radiation in all accession groups. The geographic region where the orchard is grown is thus very important in the resulting metabolites profiles. Moreover, apple genetics would also play a decisive role as highlighted in the cluster analysis.

1. Introduction

Apple has been cultivated in Europe and Asia since antiquity [1] and it is currently the largest fruit crop in temperate regions. Globally, apple production ranked 86.4 million tons worldwide [2]. Therefore, its availability in markets all year around makes apple fruit the most consumed fresh fruit in the world.
Apple is well known for being a source of dietary fiber, micro-nutrients such as vitamin C, sugars, organic acids, minerals, and phytochemical compounds [3,4,5,6] and its beneficial properties for human health is also well established [7,8,9,10]. Qualitative traits such as sweetness, sourness, skin colour, fruit firmness, and other organoleptic characteristics strongly influence consumer satisfaction [11,12,13]. Among the latter, sourness and sweetness are the main factors influencing fruit palatability and consumption. Therefore, they are among the most relevant traits considered in plant breeding programs [14]. A combination of organic and mineral acids such as citric, malic, tartaric, quinic, or succinic are responsible for sourness [15]; however, fruit acidity not only affects the overall apple flavour but also influences the perception of other organoleptic traits such as sweetness and aroma [5,16]. Apart from individual acids concentration, sourness is usually assessed by the titratable acidity (TA), while the soluble solids content (SSC) is used as a proxy to fruit sweetness [17,18,19].
Besides playing an important role in fruit consumption, sugars and acids play an essential role in plant development and stress response [20,21]. Sucrose is the main product of photosynthesis in mature green leaves [22] and it can be further transformed to fructose and glucose [23]. Fructose is essential for regulating carbon fluxes in apple sink cells [21,23,24]. Sorbitol accumulation, because of its high level of transport in apple trees, protects the cell membranes, decreases membrane permeability, and increases apple sweetness [14]. It is the major sugar alcohol found in Rosaceae plants. Organic acids, as malate and citrate in lower extend, are the primary acids involved in fruit acidity; they are synthesized in plants during the oxidation of different photosynthetic products [25]. The organic acids play an essential role in plants by providing redox equilibrium, supporting ionic gradients on membranes, and acidifying the extracellular medium [26,27]. Improving our understanding of the genetic variability of apple acids and sugars is therefore highly desirable as it could help breeders develop new apple cultivars with target sourness and sweetness levels.
There are more than 7000 apple cultivars worldwide [28,29]; nevertheless, a relatively small number of well-adapted and closely related cultivars dominate the global apple production. This lack of production diversity impedes consumers in accessing well-adapted local apple accessions from countries where apple is traditionally grown such as Spain [4,29,30,31]. While breeders require more and more genetic variation for plant improvement, apple monoculturalization is causing a loss of genetic diversity and puts autochthone cultivars at risk of disappearing. Therefore, the collection and conservation of local and ancient accessions and wild relatives are top priority activities. Germplasm banks are crucial tools to preserve genetic diversity as well as to provide breeding material [31,32,33,34,35,36]. Spain has very rich apple genetic resources spanning a wide range of agro-climatic conditions, including historical cultivars selected for centuries from wild local populations; this rich heritage is preserved in several apple collections that include traditional cultivars [28,37,38]. These collections also contain non-Spanish accessions and commercial cultivars, enabling comparison between cultivars of varying origin.
In the increasingly relevant context of climate change, preserving genetic variability is especially important [39,40]. Selection and enhancement of climate-change resilient apple varieties is becoming a priority for both growers and scientists [41,42]. Besides orchard management, environmental parameters such as altitude or climate have an enormous effect in apple nutrients and biochemical traits [4,43,44,45]. Sugar concentration in fruit usually decreases with water supply due to dilution [46], but this process depends on the fruit growth dynamics and thus it varies between cultivars and interactions with the environmental conditions [43,47]. It has also been demonstrated that altitude causes concurrent changes in temperature, light intensity, and photoperiod. These elements play a crucial role in controlling plant metabolism and therefore affect the final contents of several biochemical compounds in fruits, highlighting the importance of the region where the fruits are grown [48,49]. Several studies have highlighted the impacts of increasing temperatures on plant growth and development [50,51] and in most regions farmers have already acknowledged its effect on delaying fruit maturity, leading to the adoption of varied adaptation strategies [52,53].
There is an essential need to improve our understanding of the differences between apple cultivars in organoleptic traits and in the concentrations of biochemical compounds and to better know how climate interacts with genetics in their determination. Germplasm banks offer an excellent platform to undertake this assessment [31], although there is still a relatively small number of studies concerning climate and apple quality traits [3,42,52]. Regarding specifically the relationships between climate and individual sugars and organic acids in apple cultivars of varying origin, we are not aware of any previous study.
This study evaluates individual sugars and organic acids of 155 accessions during five consecutive years from the first established Spanish apple collection. The main objectives of the present study are: (i) to improve our knowledge of nutritional and organoleptic traits according to the cultivar’s origin; (ii) to assess the role of each years’ climate on the apple metabolite profiles, and (iii) to improve our understanding of the genetic variability of apple acids and sugars as it could help breeders develop new apple cultivars with target sourness and sweetness levels.

2. Materials and Methods

2.1. Field Trial, Plant Material, and Climate Data

The location, names, and number of the 155 accessions evaluated are described in Supplementary Table S1. All the studied plant material was grafted on MM 106 rootstock, except for four accessions (‘Delgared Infel’, ‘Red Elstar’, ‘Rubinette’ and ‘Regal Prince_1’) which were grafted on the M9 rootstock. Trees were trained to a low density open-vase system (6 m × 5 m). Fertilization and winter pruning were conducted as in a commercial orchard. Trees were hand thinned at 40–45 days after full bloom (DAFB), leaving one fruit per cluster. The orchard was flood irrigated every 12 days during the summer.
The climatic parameters assessed for the years of the study were reported by Mignard et al., [4].

2.2. Fruit Sampling, Individual Sugars, and Organic Acids Analysis

Each year, a representative random sample was harvested for each accession. Fruits were harvested when flesh fruit firmness (FF) attained a value around 70–80 N or when they exhibited the ground colour representative. Maturity date ranged from late June to early December, depending on the accession. Then, apple flesh was sampled during the following 1–2 days as described by Mignard et al., [4]. Three biological replicates per accession were prepared. Individual sugars and organic acids content was analysed by HPLC as reported by Font i Forcada et al., [11]. In summary, sugars were analysed using an Aminex HPX-87C column (300 mm × 7.8 mm, Bio-Rad) with a refractive index detector at 35 °C (Waters 2410, Waters Corporation, Milford, CT, USA) with Milli-Q water as mobile phase. For the organic acids, a Rezex™ ROA-Organic Acid H+ (8%) column (300 mm × 7.8 mm, Phenomenex) was used with a photodiode array detector (Waters 2489, Waters Corporation, Milford, CT, USA) at 210 nm. A sulphuric acid solution (0.005 N) was used as mobile phase in the latter case. Individual sugars (glucose, fructose, sucrose, and sorbitol) and organic acids (citric, malic, oxalic, quinic, succinic, shikimic, and tartaric) concentrations (expressed as g per kg of fresh weight) were determined by their characteristic retention times following standards mentioned in the chemicals paragraph (Section 2.4).

2.3. Data Analysis

All statistical analyses were carried out using the R language [54], involving the following packages: ggplot2, factoextra, FactoMineR, ggpubr, dplyr, Hmisc, corrplot, and nlme [55]. Two-way ANOVA was used to examine accession × year effects. Pearson’s correlation was used to study the relationships among traits and Principal Component Analysis (PCA) was used to simplify the dimensionality of the dataset and find the principal axes of variability.
A mixed-effects model was then constructed using the individual sugars and organic acids traits as dependent variables, the climate characteristics of each growing season as fixed effects, and the accession as the random effect affecting both the intercept and the fixed effects coefficients. All variables were centred at zero and scaled to a common range in order to make the model coefficients comparable. Hierarchical agglomerative cluster analysis based on the Manhattan distance was then used to assess similarities between climatic and biological variables across the accessions.

2.4. Chemicals

Chemicals of analytical grade were used in all analyses. Sugar standards (sucrose, glucose, fructose, and sorbitol) and the sulfuric acid were purchased from Panreac Química, S.A. (Barcelona, Spain), while organic acids standards (citric, malic, oxalic, quinic, succinic, shikimic, and tartaric) were obtained from Sigma-Aldrich (Saint Louis, MO, USA).

3. Results

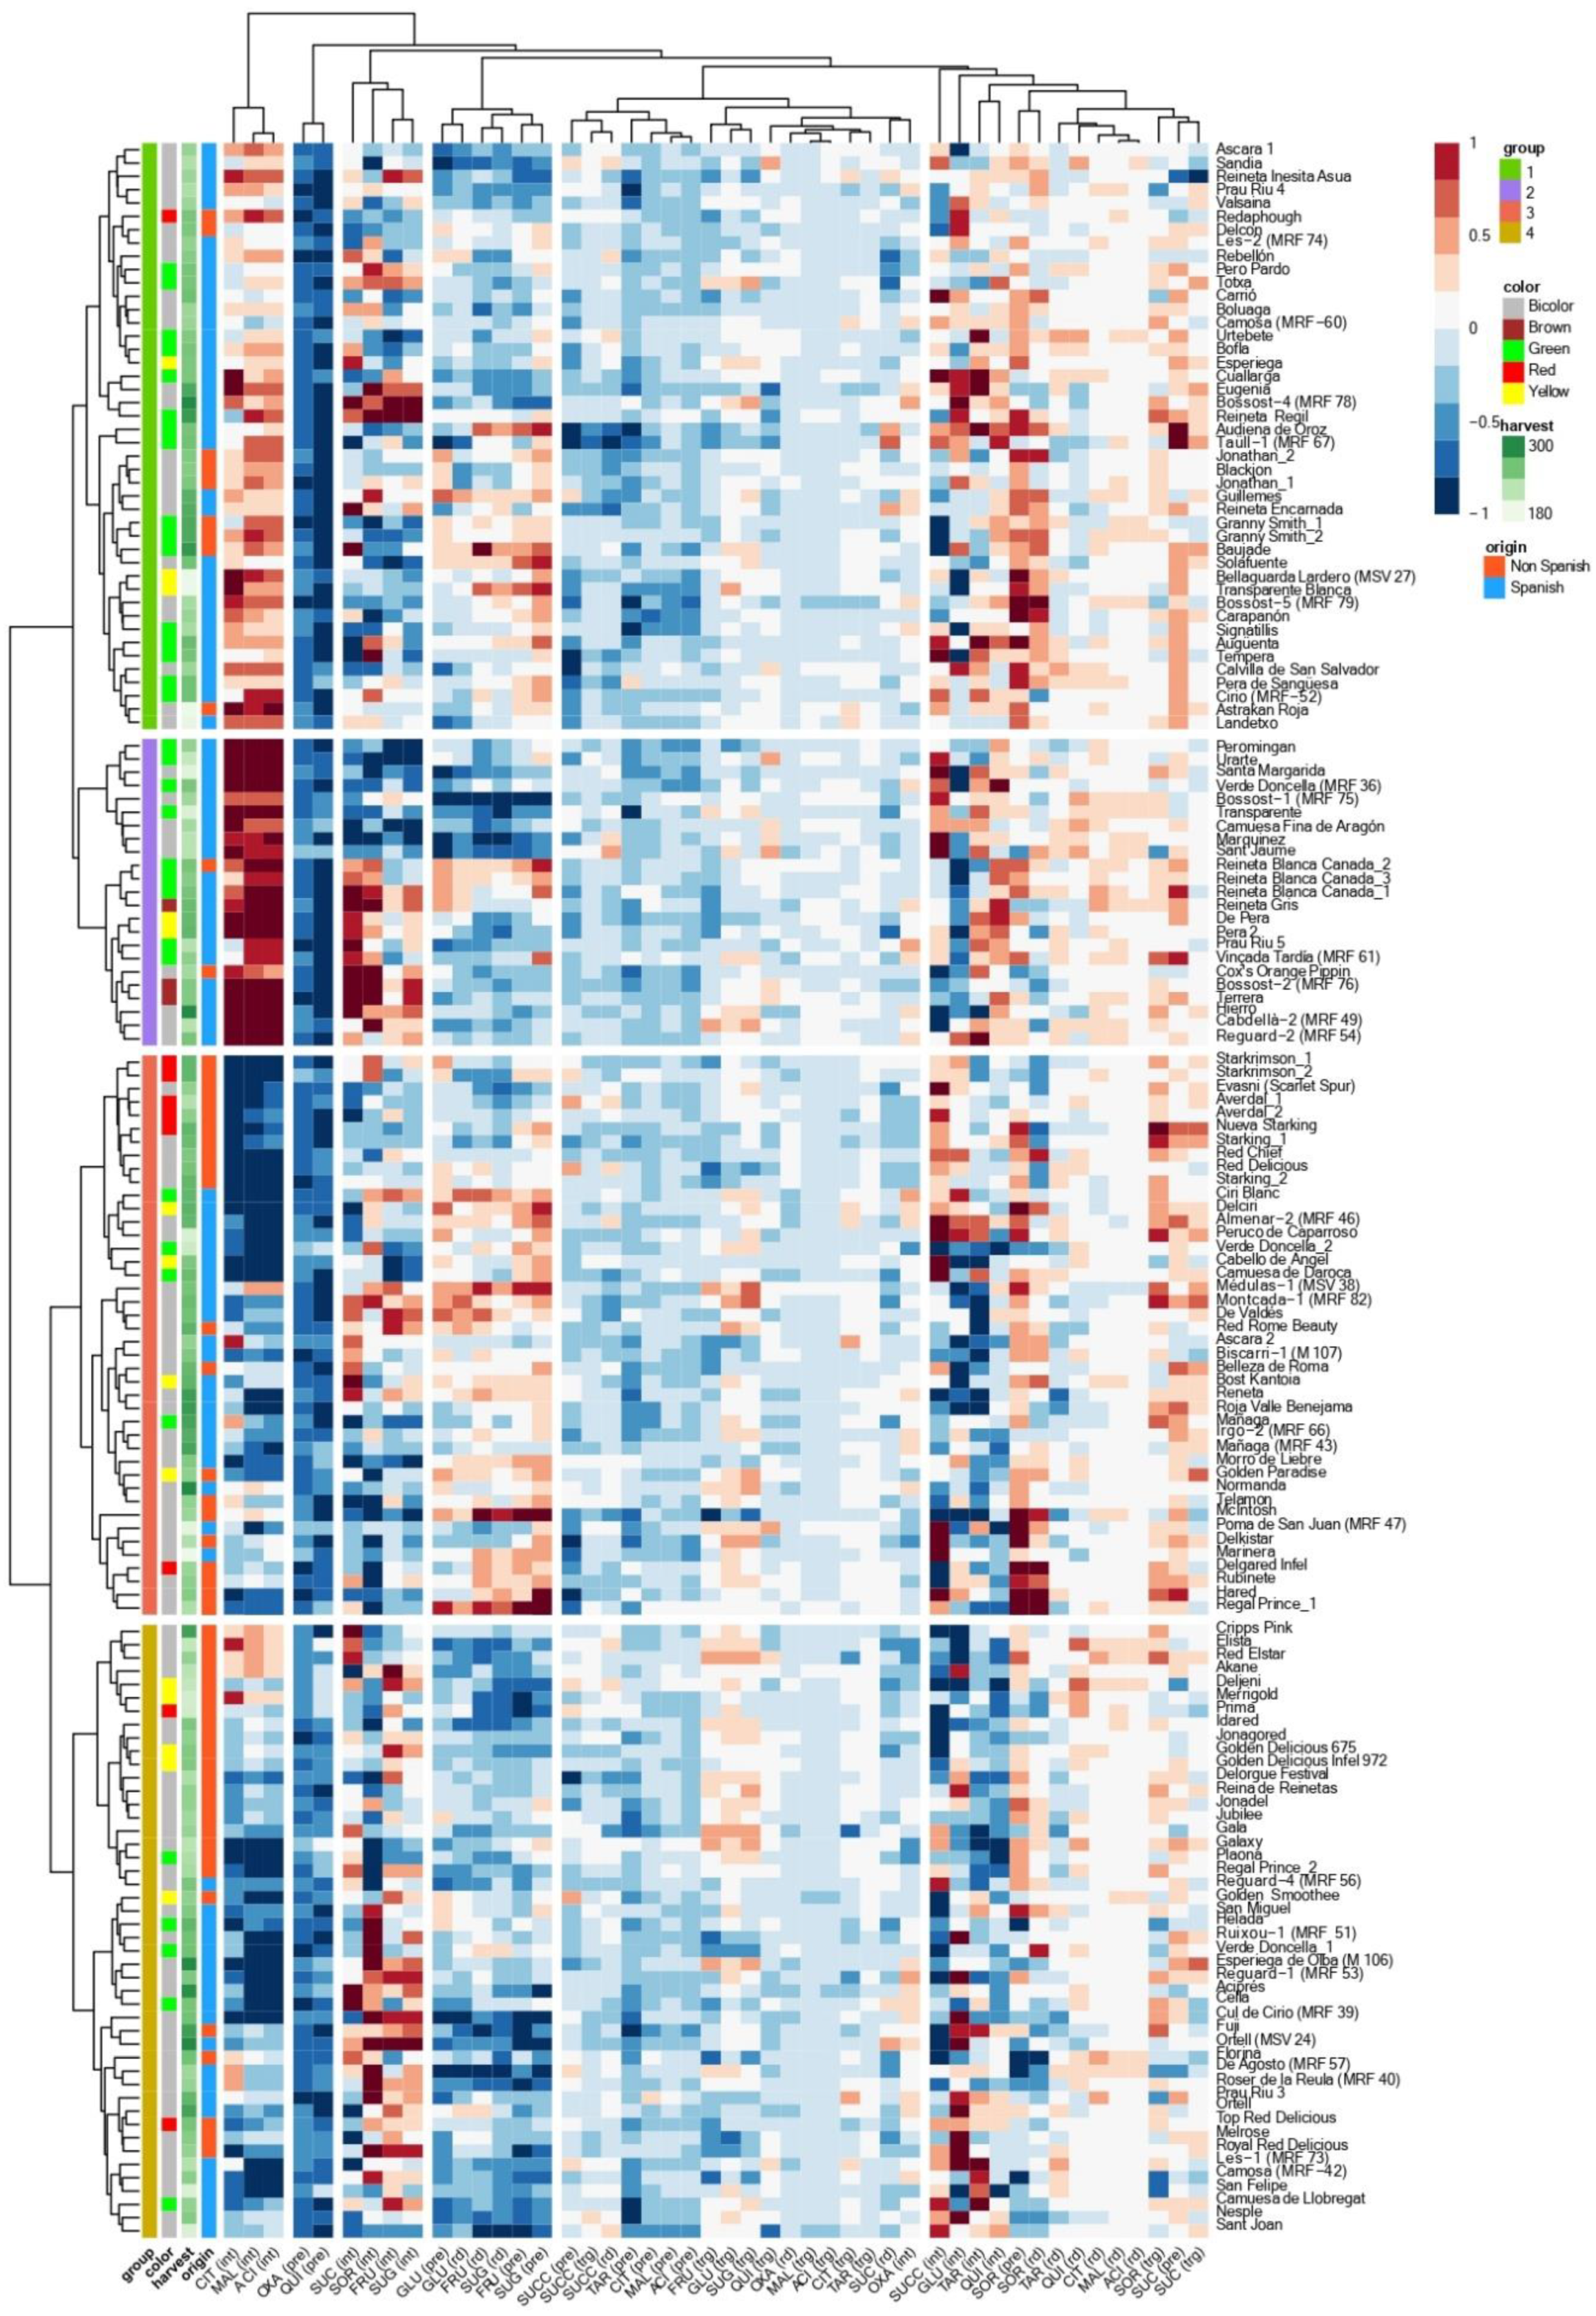
3.1. Accession and Year Effects

There were significant differences among the 155 accessions for all the evaluated traits according to ANOVA analyses. In addition, the interaction between accession and year was significant for all traits evaluated (p ≤ 0.001) (Supplementary Tables S2 and S3, Figure S1).
The climatic characteristics during the fruit growth season also showed significant differences between years. A thorough description of the climatic variables during the five years of study was reported by Mignard et al., [4].

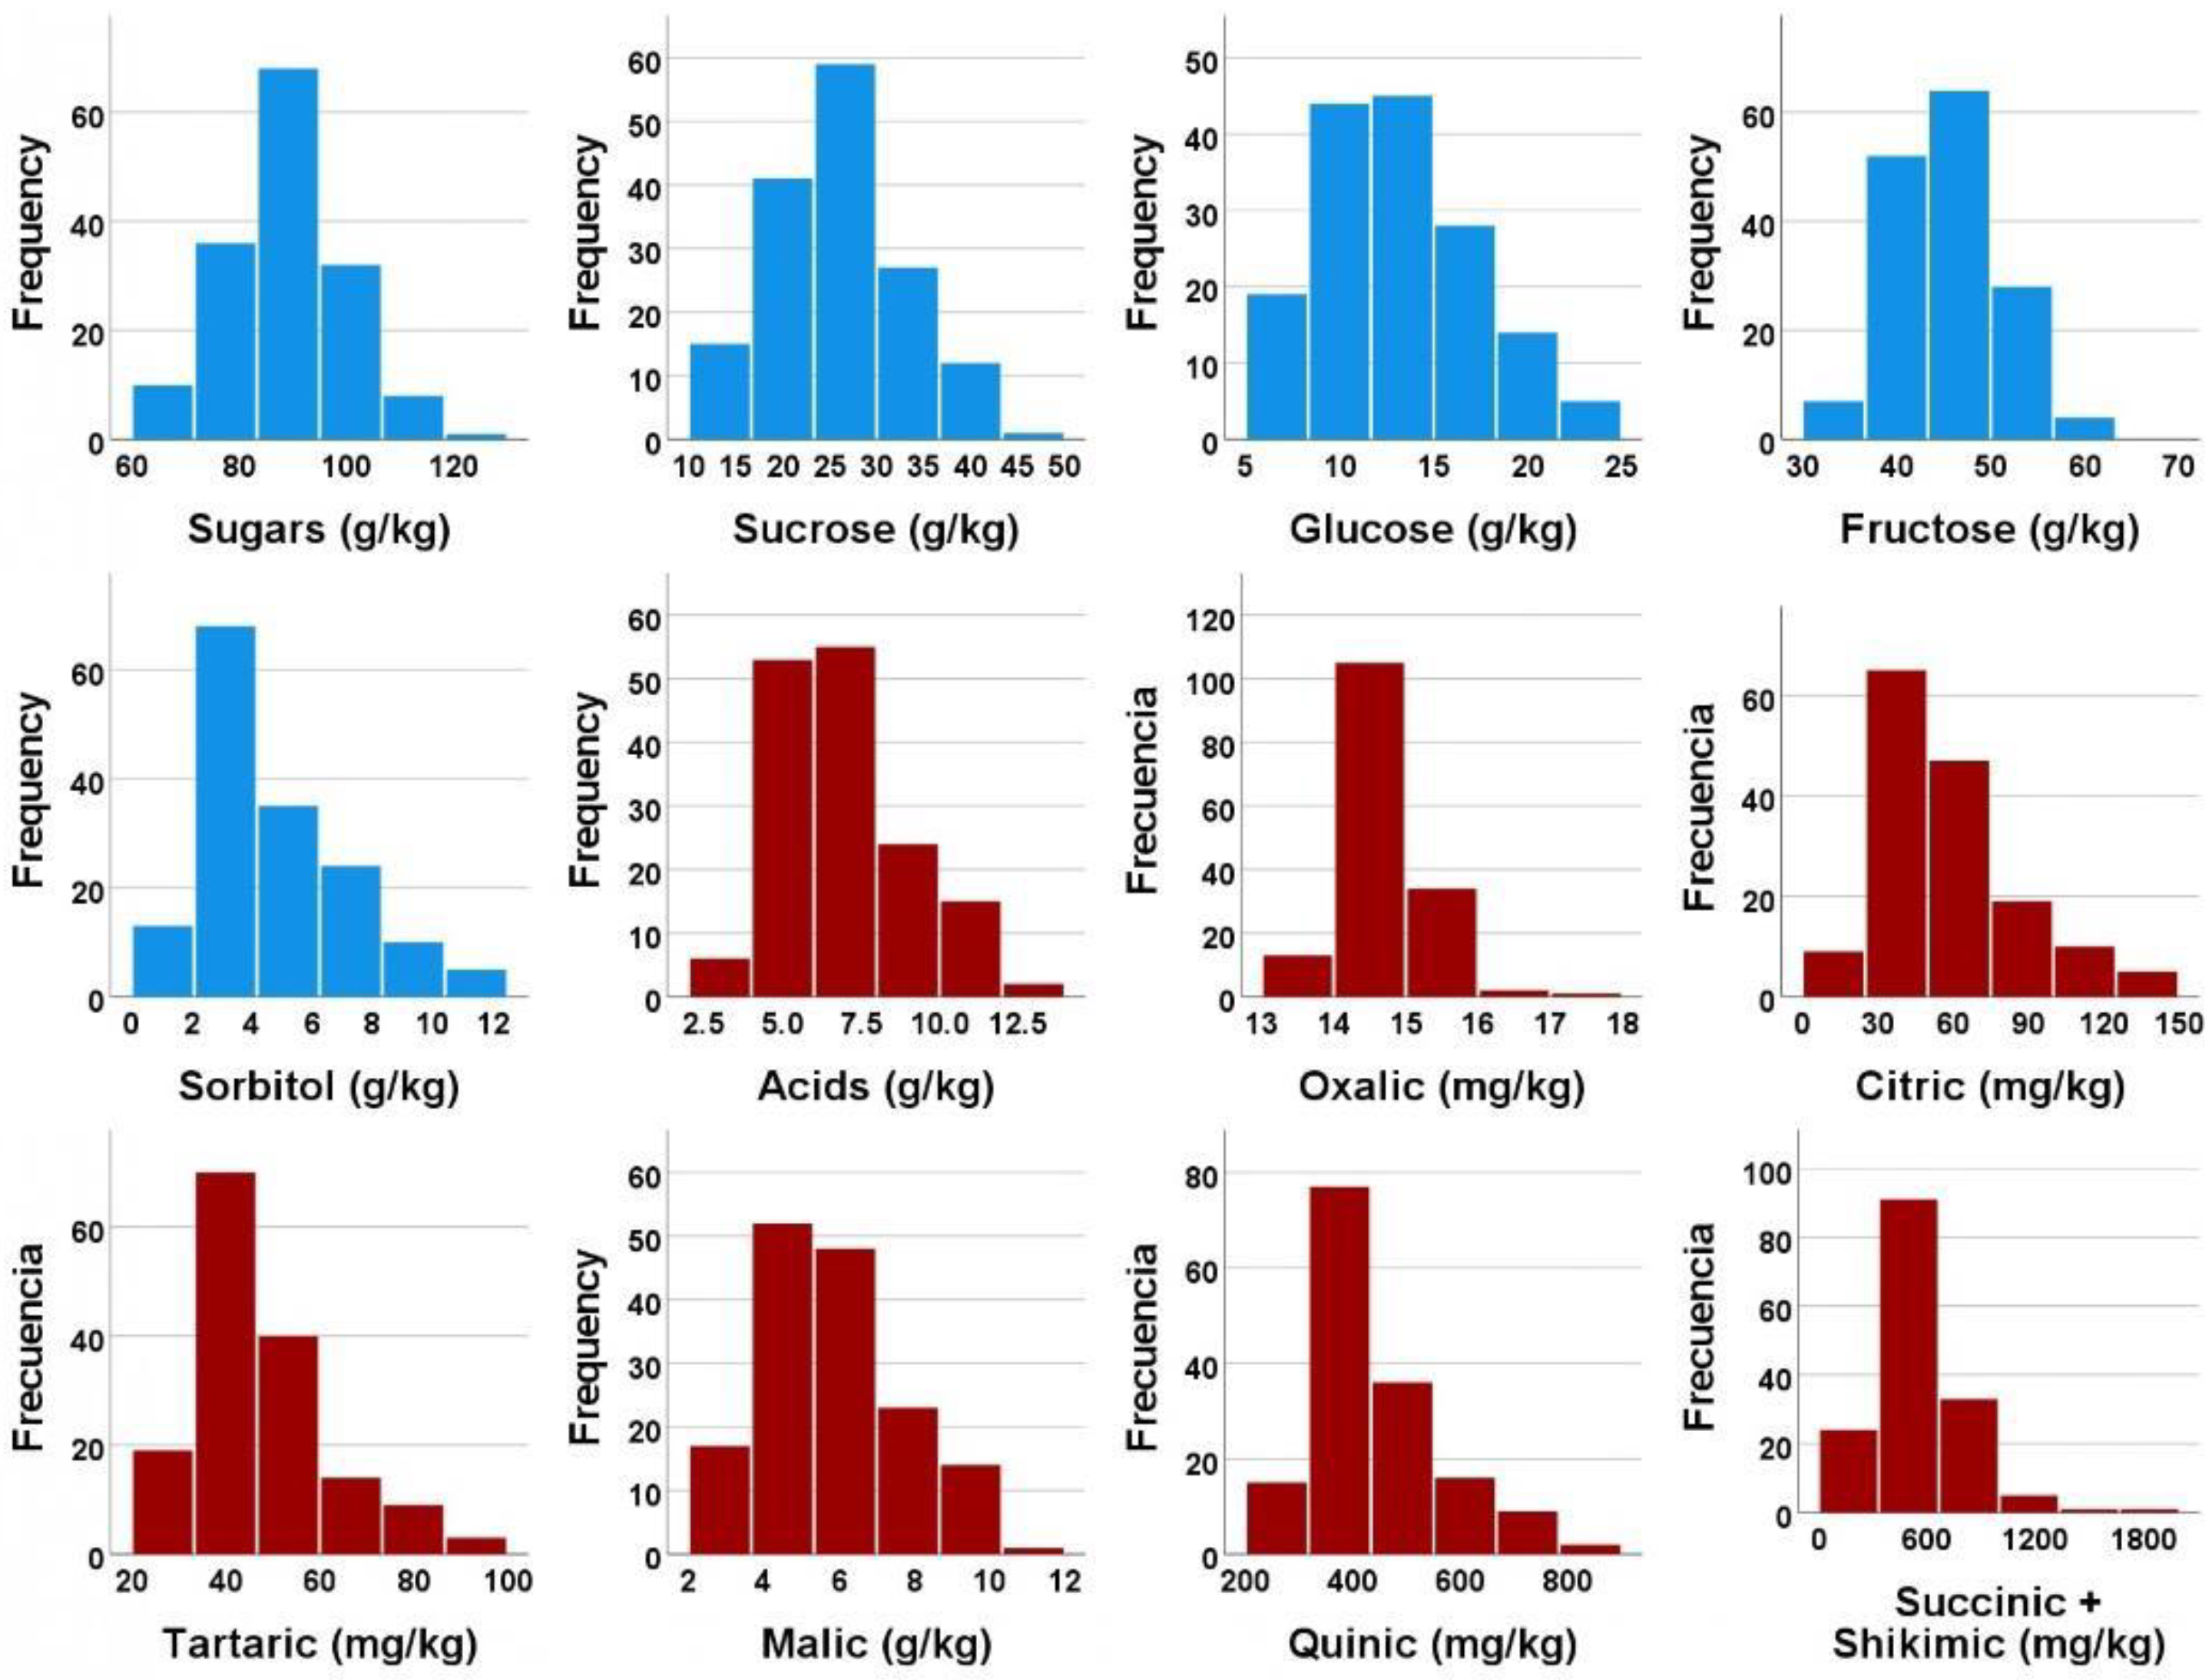
3.2. Individual Sugars and Organic Acids Profiles

Total sugars values (Sugars) ranged significantly among apple accessions and years from 25.02 (‘Morro de Liebre’, 2015) to 159.79 (‘Baujade’, 2015) g kg−1 FW (Table 1). Regarding the individual sugars, sucrose (Suc) values varied considerably, ranging from 3.26 (‘Morro de Liebre’, 2016) to 61.18 (‘Baujade’, 2015) g kg−1 FW. Glucose (Glu) values ranged from 2.18 (‘McIntosh’, 2016) to 37.56 (‘Baujade’, 2015) and fructose (Fru) values ranged from 14.63 (‘Morro de Liebre’, 2016) to 87.40 (‘Médulas_1—MSV 38’, 2015) g kg−1 FW. Finally, the alcohol sugar sorbitol (Sor) values varied from 0.48 (‘Red Chief’, 2018) to 26.23 (‘Bossost_2—MRF 76’, 2015) g kg−1 FW.
The Supplementary Table S3 shows the mean values for the five years of study. Total sugars ranged from 61.85 (‘Urarte’) to 121.61 (‘Reineta Regil’) g kg−1 FW. Sucrose varied from 10.29 (‘Akane’) to 44.47 (‘Reineta Blanca Canada_1’) g kg−1 FW, while glucose and fructose ranged from 6.23 (‘Roja Valle Benejama’) to 24.29 g kg−1 FW (‘Ruixou_1—MRF 51’) and 31.39 (‘Baujade’) to 61.41 (‘Akane’) g kg−1 FW, respectively. Lastly, sorbitol varied from 1.20 (‘Plaona’) to 12.29 (‘Terrera’) g kg−1 FW.
Total acids values (Acids) among accessions and years ranged from 0.77 (‘Golden Smoothee’, 2016) to 22.83 (‘Astrakan Roja’, 2017) g kg−1 FW (Table 1). Regarding the individual acids, oxalic acid (Oxa) values varied from 0.01 (‘Starking_1’, 2018) to 0.02 (‘Terrera’, 2016) g kg−1 FW. Citric acid (Cit) values ranged from 0.01 (‘Roja Valle Benejama’, 2017) to 0.31 (‘Transparente’, 2016) g kg−1 FW and tartaric acid (Tar) values ranged from 0.02 (‘Roja Valle Benejama’, 2017) to 0.27 (‘Transparente’, 2016) g kg−1 FW. Malic acid (Mal) ranged considerably compared with the others from 0.43 (‘Golden Smoothee’, 2016) to 19.84 (‘Astrakan Roja’, 2017) g kg−1 FW and quinic acid (Qui) varied significantly from 0.12 (‘Golden Smoothee’, 2016) to 2.03 (‘Terrera’, 2016) g kg−1 FW. Finally, succinic + shikimic acids (Succ + Shi) varied from 0.08 (‘Delorgue Festival’, 2017) to 2.28 (‘Poma de San Juan—MRF 47’, 2015) g kg−1 FW.
Regarding the five-years mean values (Supplementary Table S3), total acids varied among apple accessions from 3.42 (‘Verde Doncella_2’) to 12.58 (‘Urarte’) g kg−1 FW. Oxalic acid ranged from 0.014 (‘Starking_2’) to 0.018 (‘Prau Riu_5’) g kg−1 FW, whereas citric and tartaric acid ranged from 0.02 (‘Cul de Cirio—MRF 39’) to 0.15 (‘Transparente’) and 0.03 (‘McIntosh’) to 0.09 (‘Camuesa de Llobregat’) g kg−1 FW, respectively. Malic acid varied notably from 2.68 (‘Del Ciri’) to 10.69 (‘Urarte’) g kg−1 FW, while quinic acid ranged from 0.24 (‘Verde Doncella_2’) to 0.87 (‘Urarte’) g kg−1 FW. Finally, succinic + shikimic acids varied from 0.20 (‘Granny Smith_2’) to 1.68 (‘Poma de San Juan—MRF 47’) g kg−1 FW.
The quantitative profiles of the individual sugars and organic acids for the 155 apple accessions for the mean of the five years of study are shown in Figure 1. Firstly, it is easily noticed the great variability found in this study for all the traits assessed. Moreover, for most of the variables, the data set could be well modelled by a normal distribution and thus seemed to be normally distributed. In general, the concentration of the organic acids was lower than the sugars amounts, even though malic acid had higher concentrations. According to the major sugar and the major organic acid, respectively, fructose reached 61.41 g kg−1 FW (‘Akane’), while normally it was between 40–50 g kg−1 FW, and malic acid reached the largest concentration in ‘Urarte’ (10.69 g kg−1 FW), although usually it was within the range 4–8 g kg−1 FW.

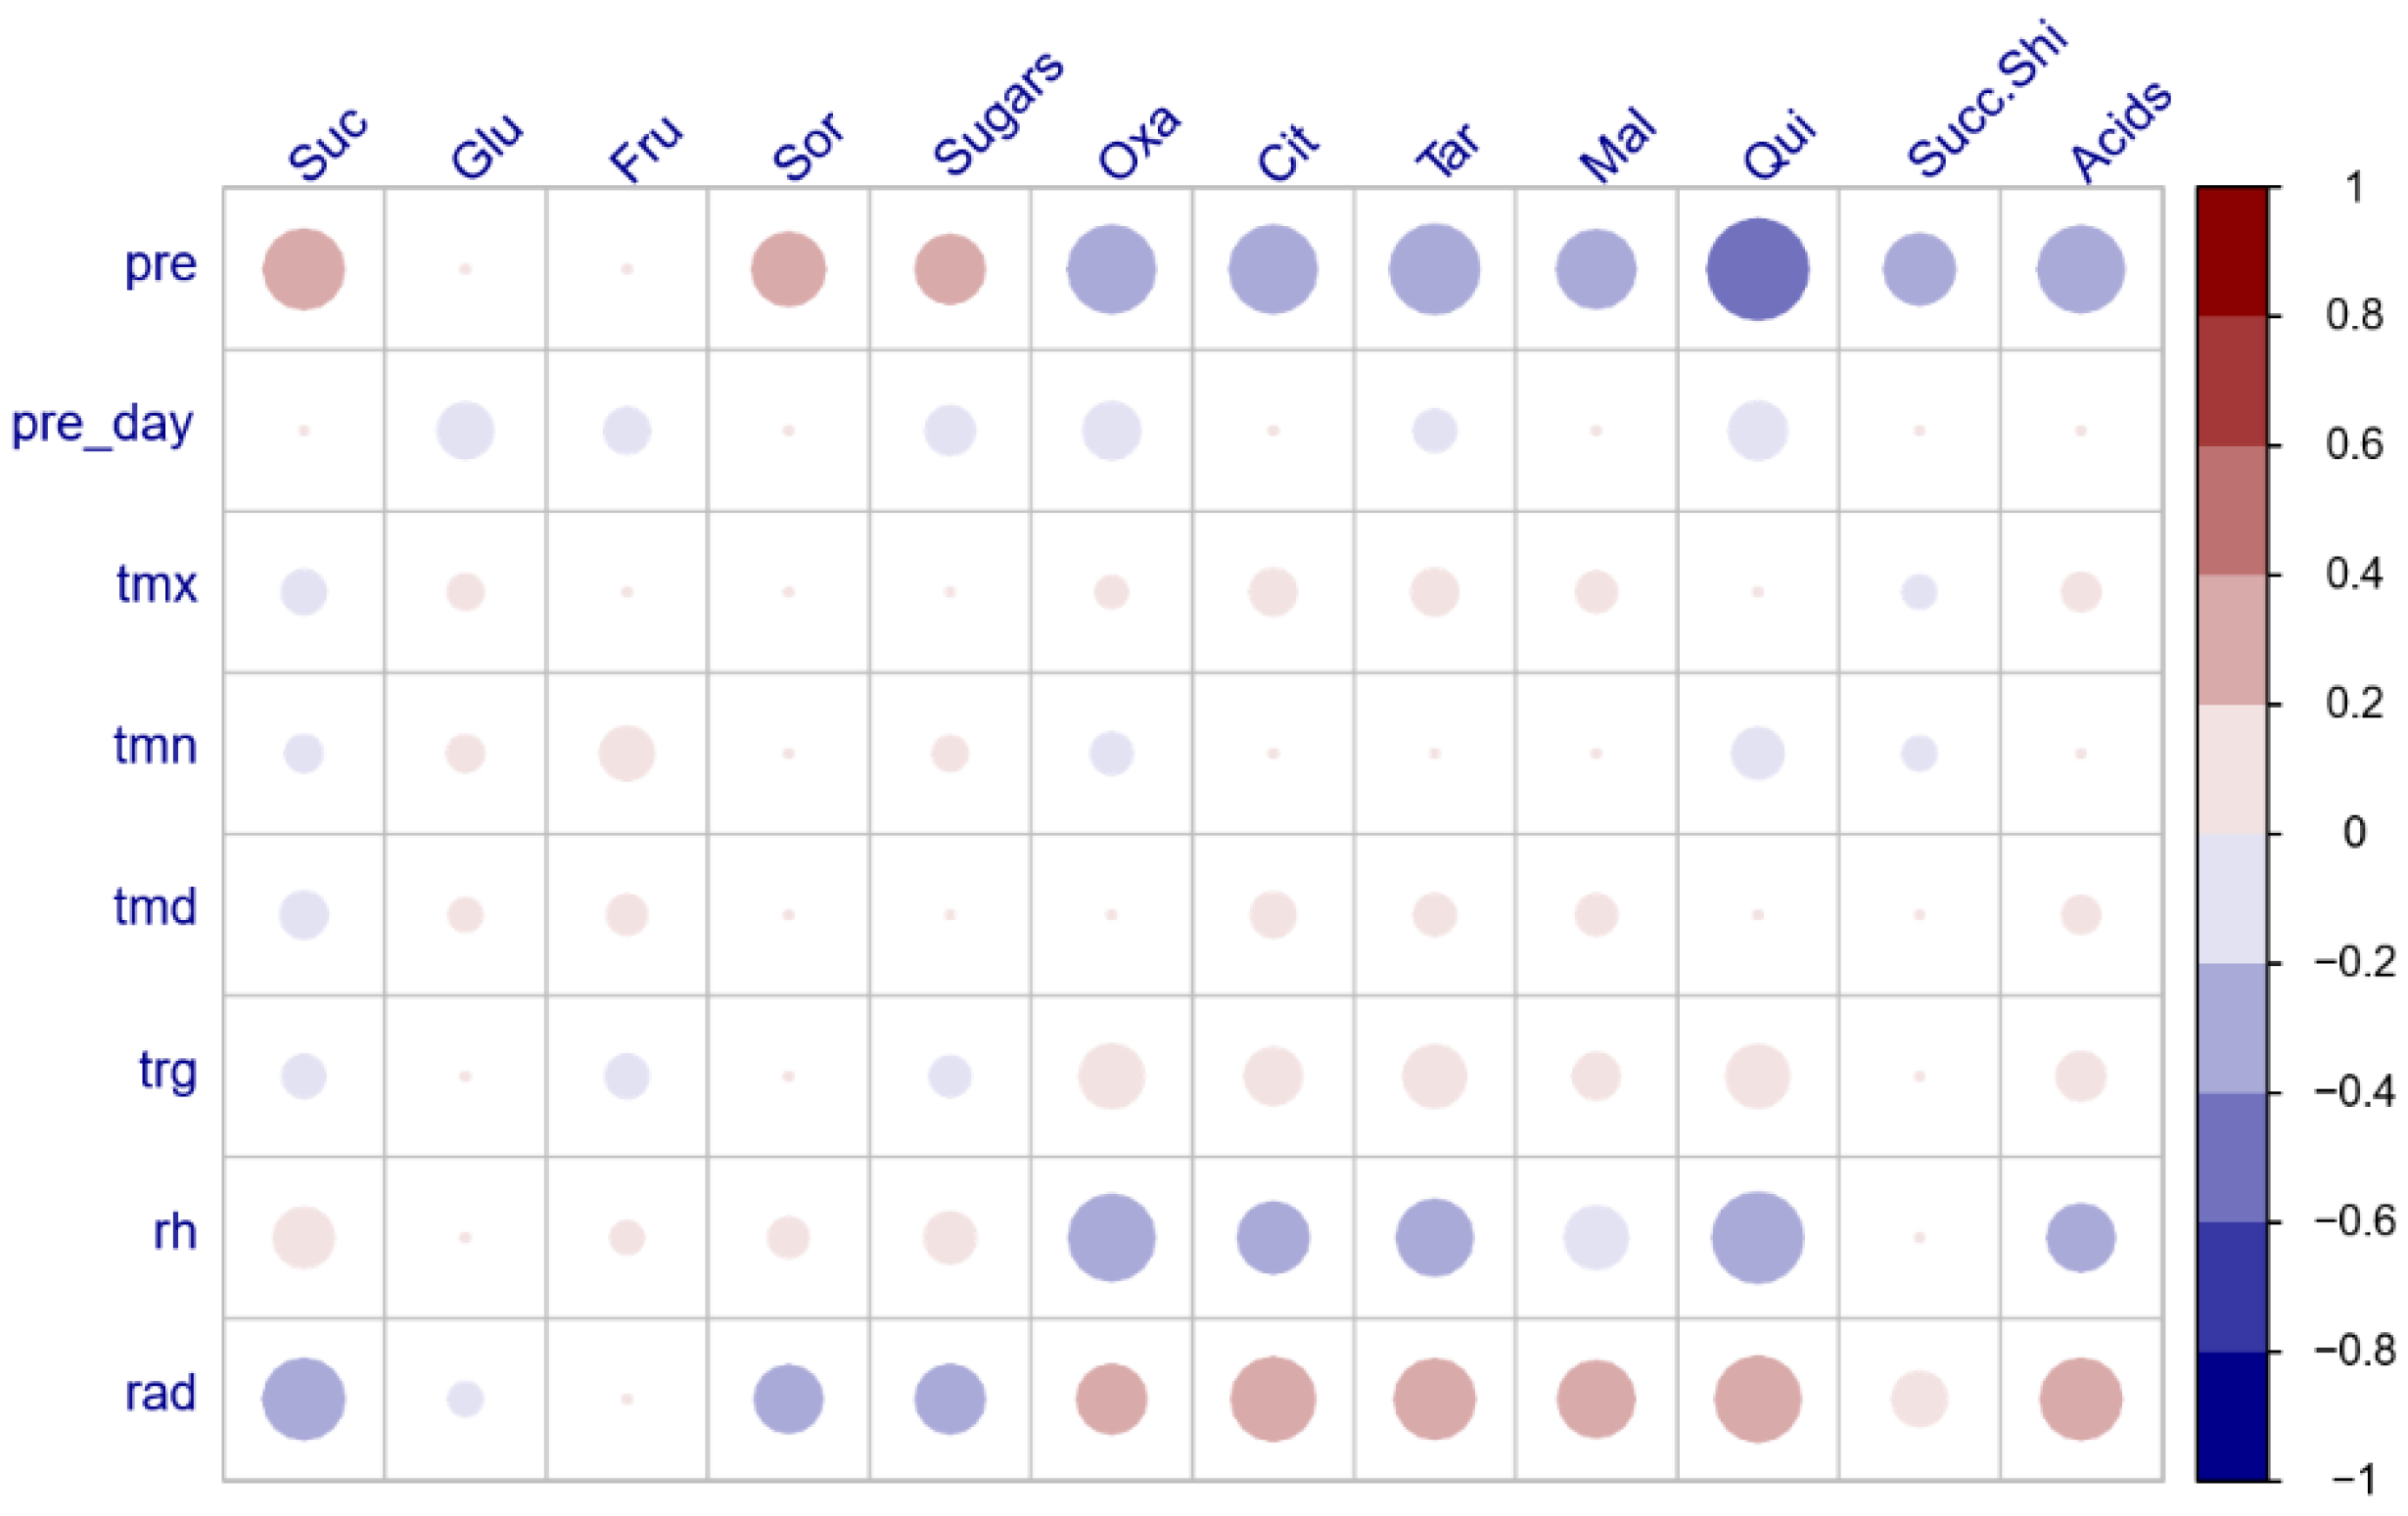
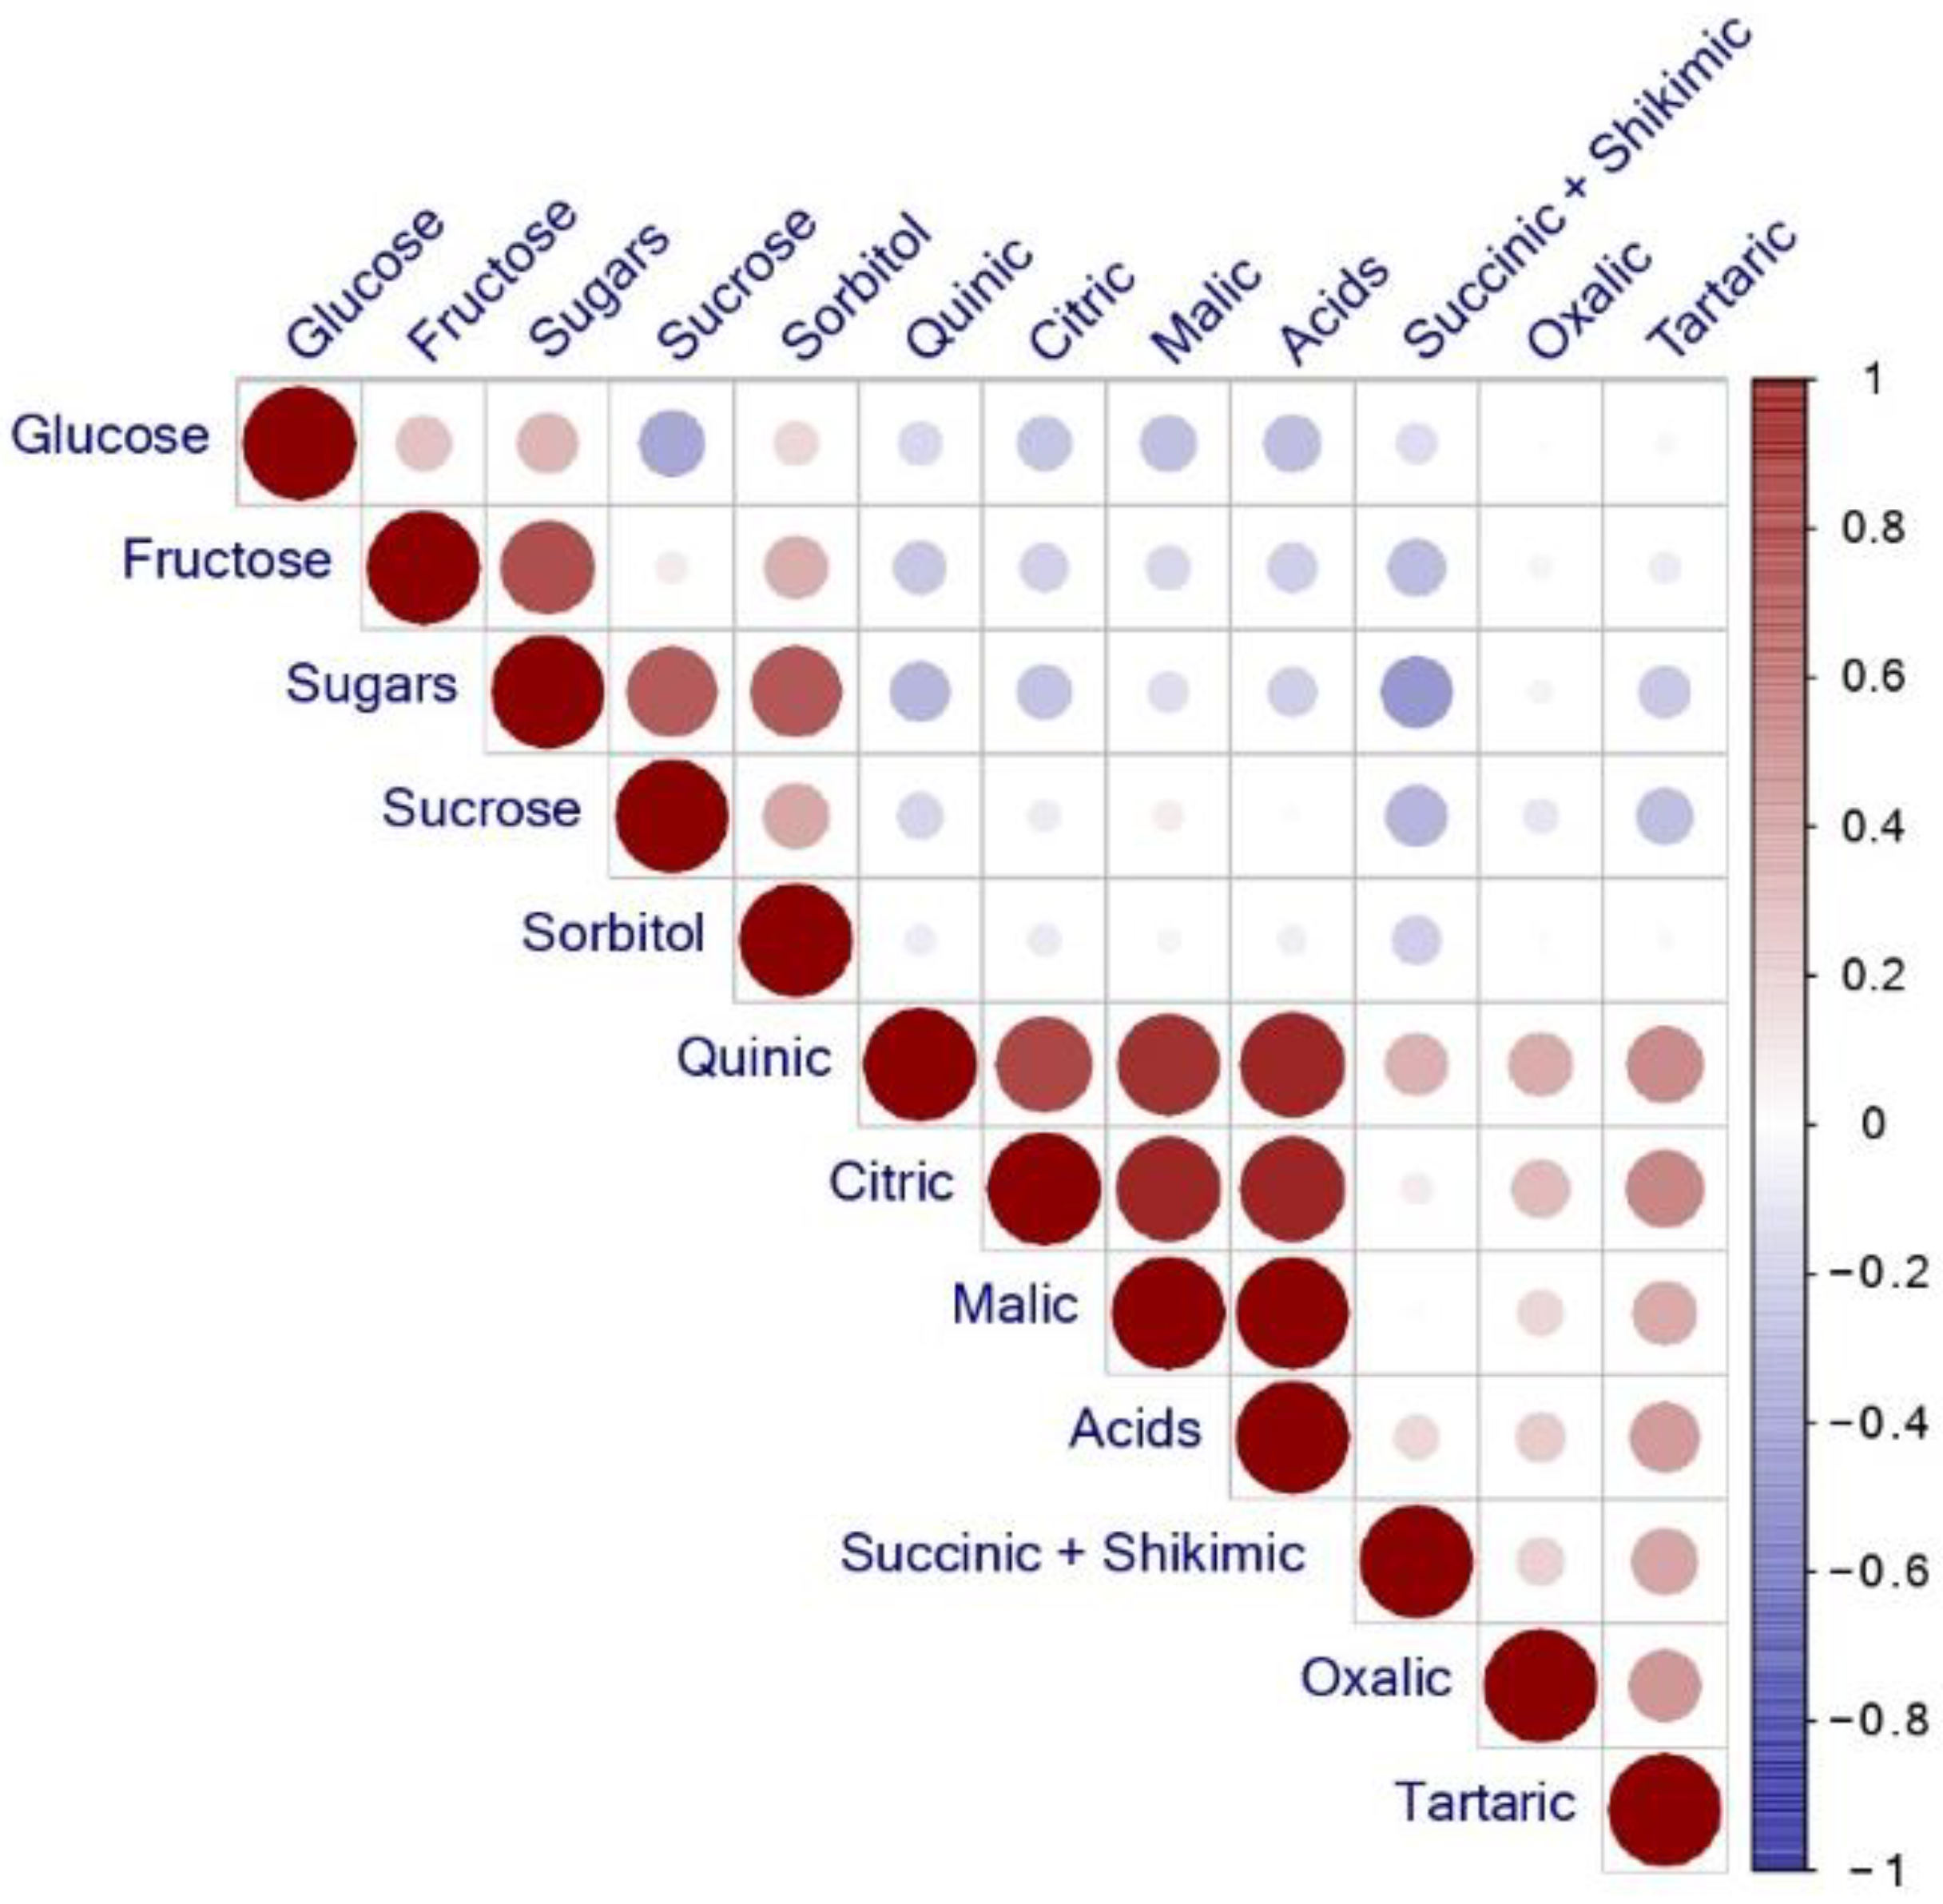
3.3. Pearson Correlation Coefficients

There were significant bilateral correlations between traits (p ≤ 0.01) (Figure 2 and Supplementary Table S4). Total sugars were significantly and positively correlated with the individual sugars (Suc: r = 0.639; Fru: r = 0.691; Sor: r = 0.651; Glu: r = 0.285). Glucose and sucrose were significantly and negatively correlated (r = −0.340). The three major acids (malic, quinic, and citric) were significantly and positively correlated between them and with total acids. First, malic acid showed significant and positive correlations with total acids (r = 0.990), as well as quinic acid (r = 0.803) and citric acid (r = 0.856). Quinic acid was significantly and positively correlated with total acids (r = 0.853) and citric acid (r = 0.724). Moreover, total acids were significantly and positively correlated with citric acid (r = 0.861). In general, individuals and total sugars were negatively correlated with the individuals and total organic acids, when significant.
In addition, a hierarchical agglomerative cluster heatmap on the Pearson correlation coefficients was used to split the different traits into two groups of increasing similarity (Supplementary Figure S2). All the sugars were grouped in one cluster, while a second cluster grouped all the organic acids traits.

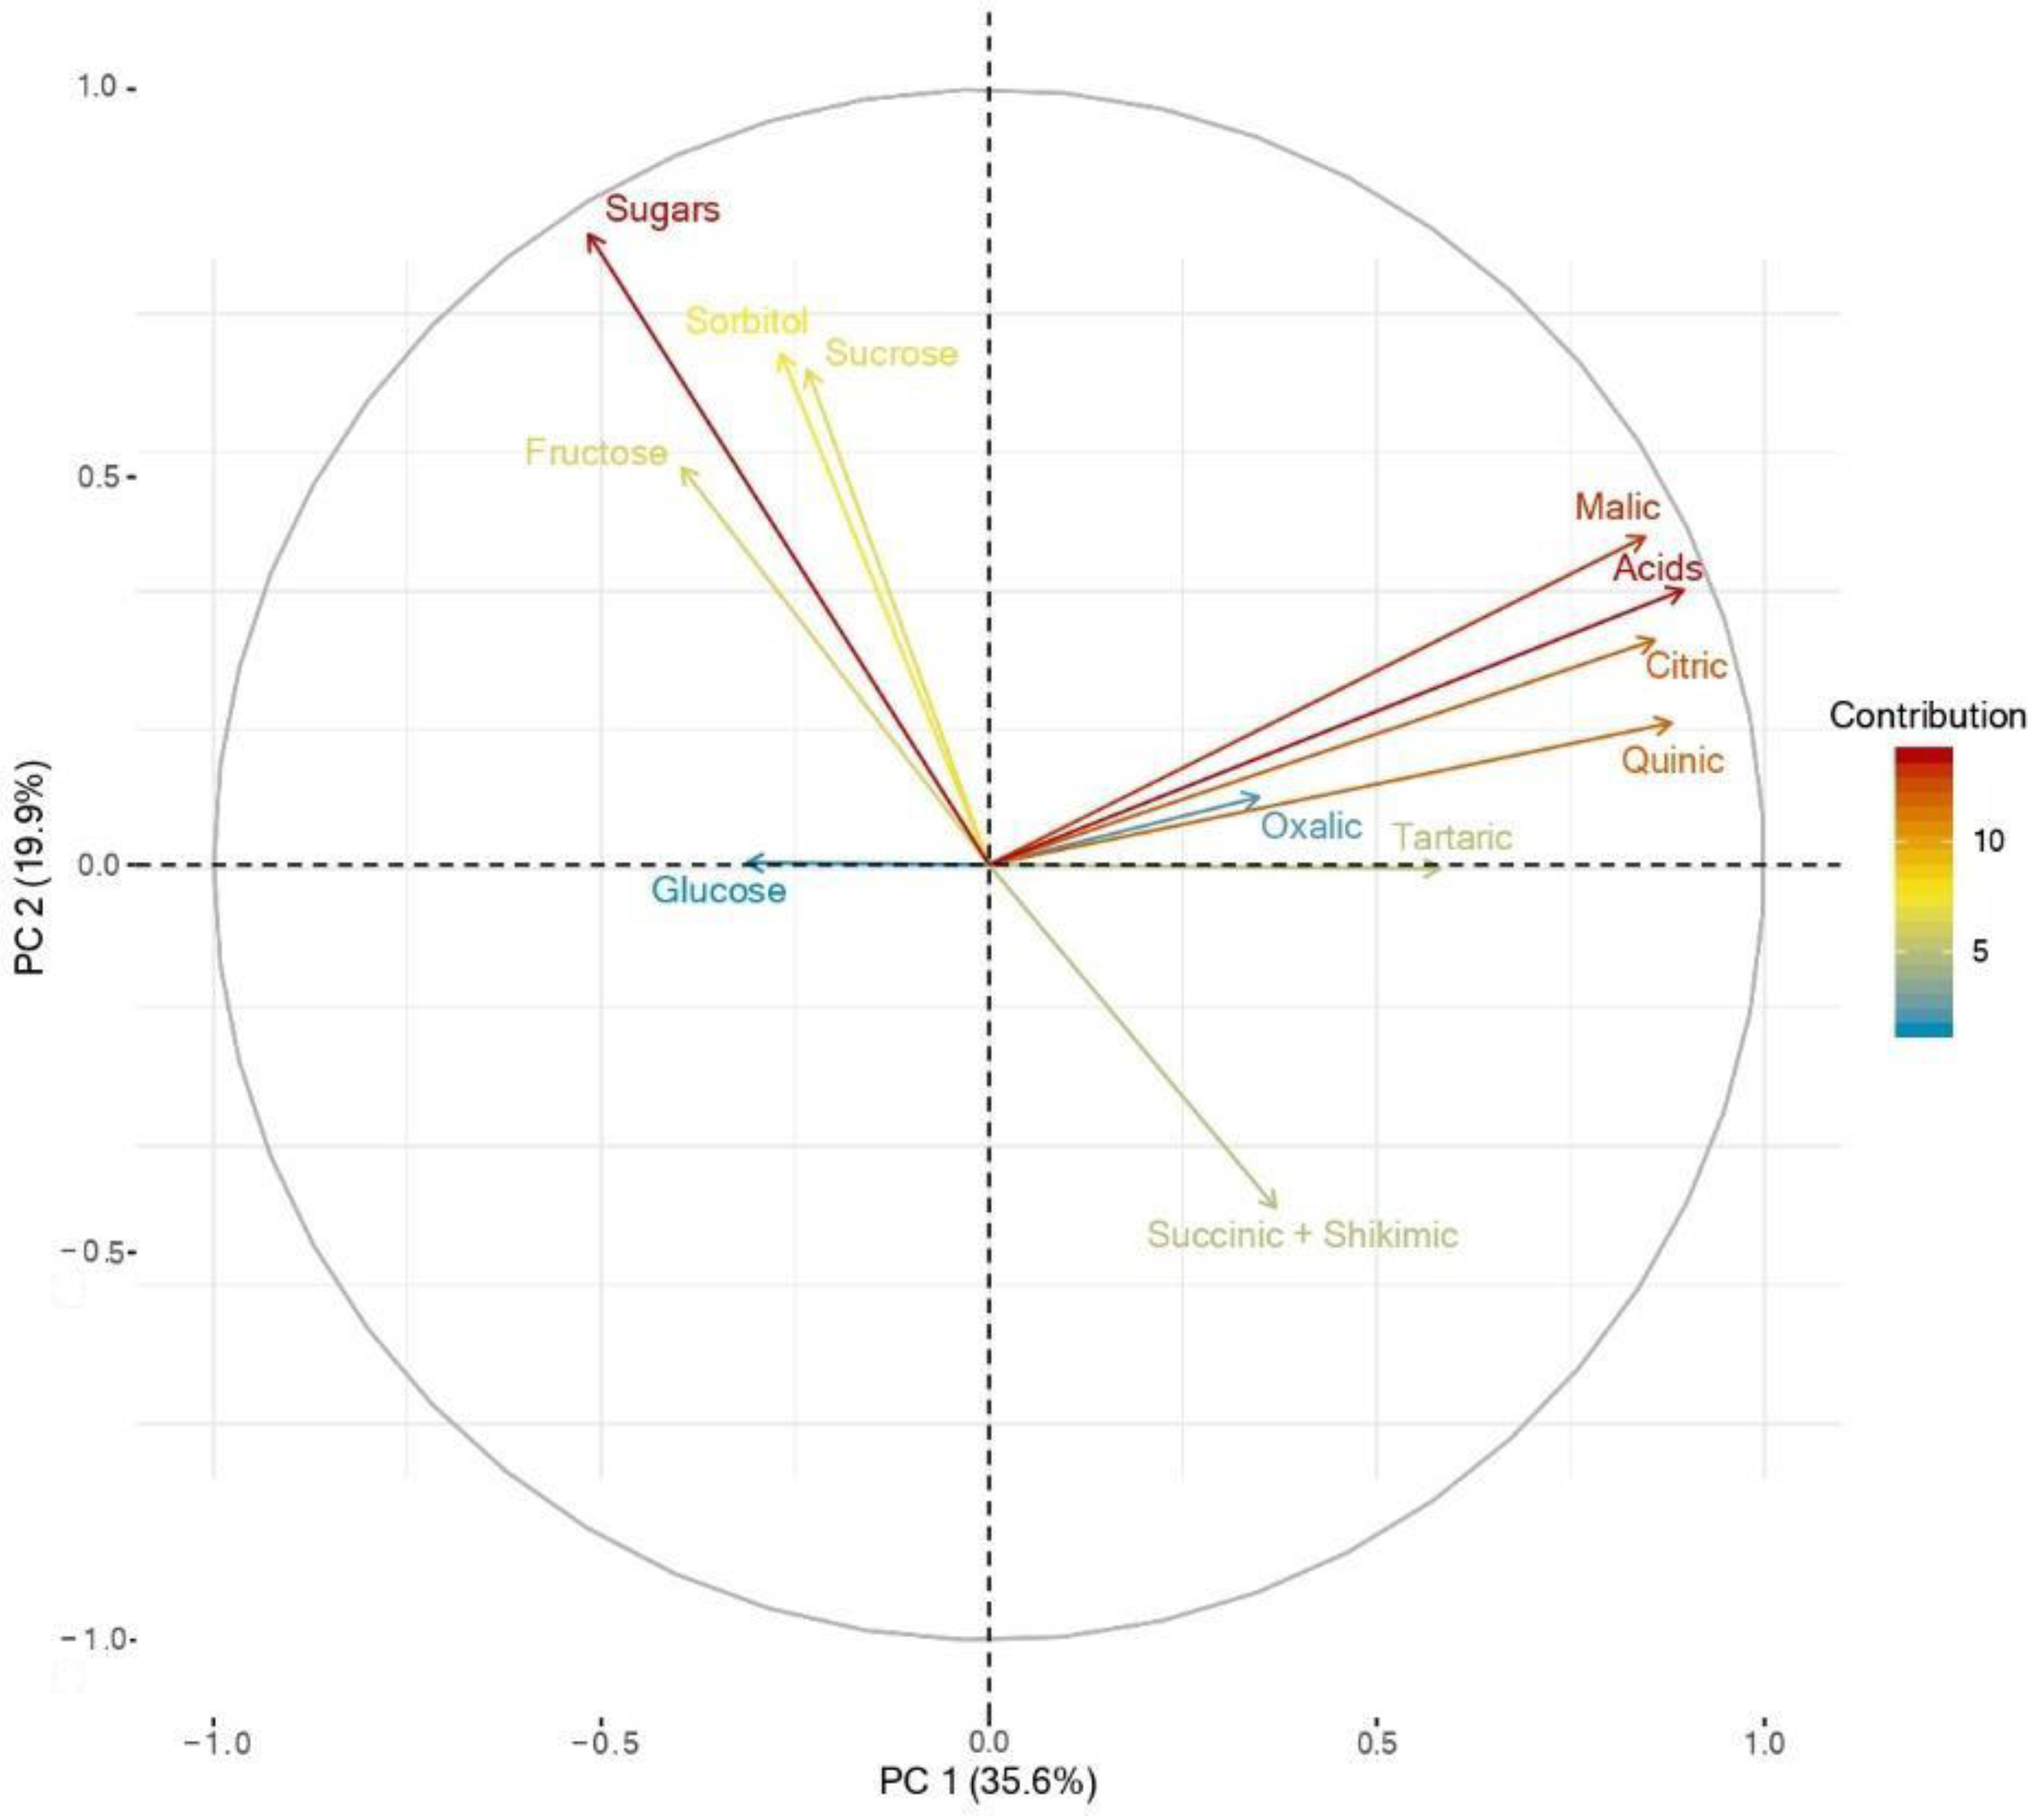
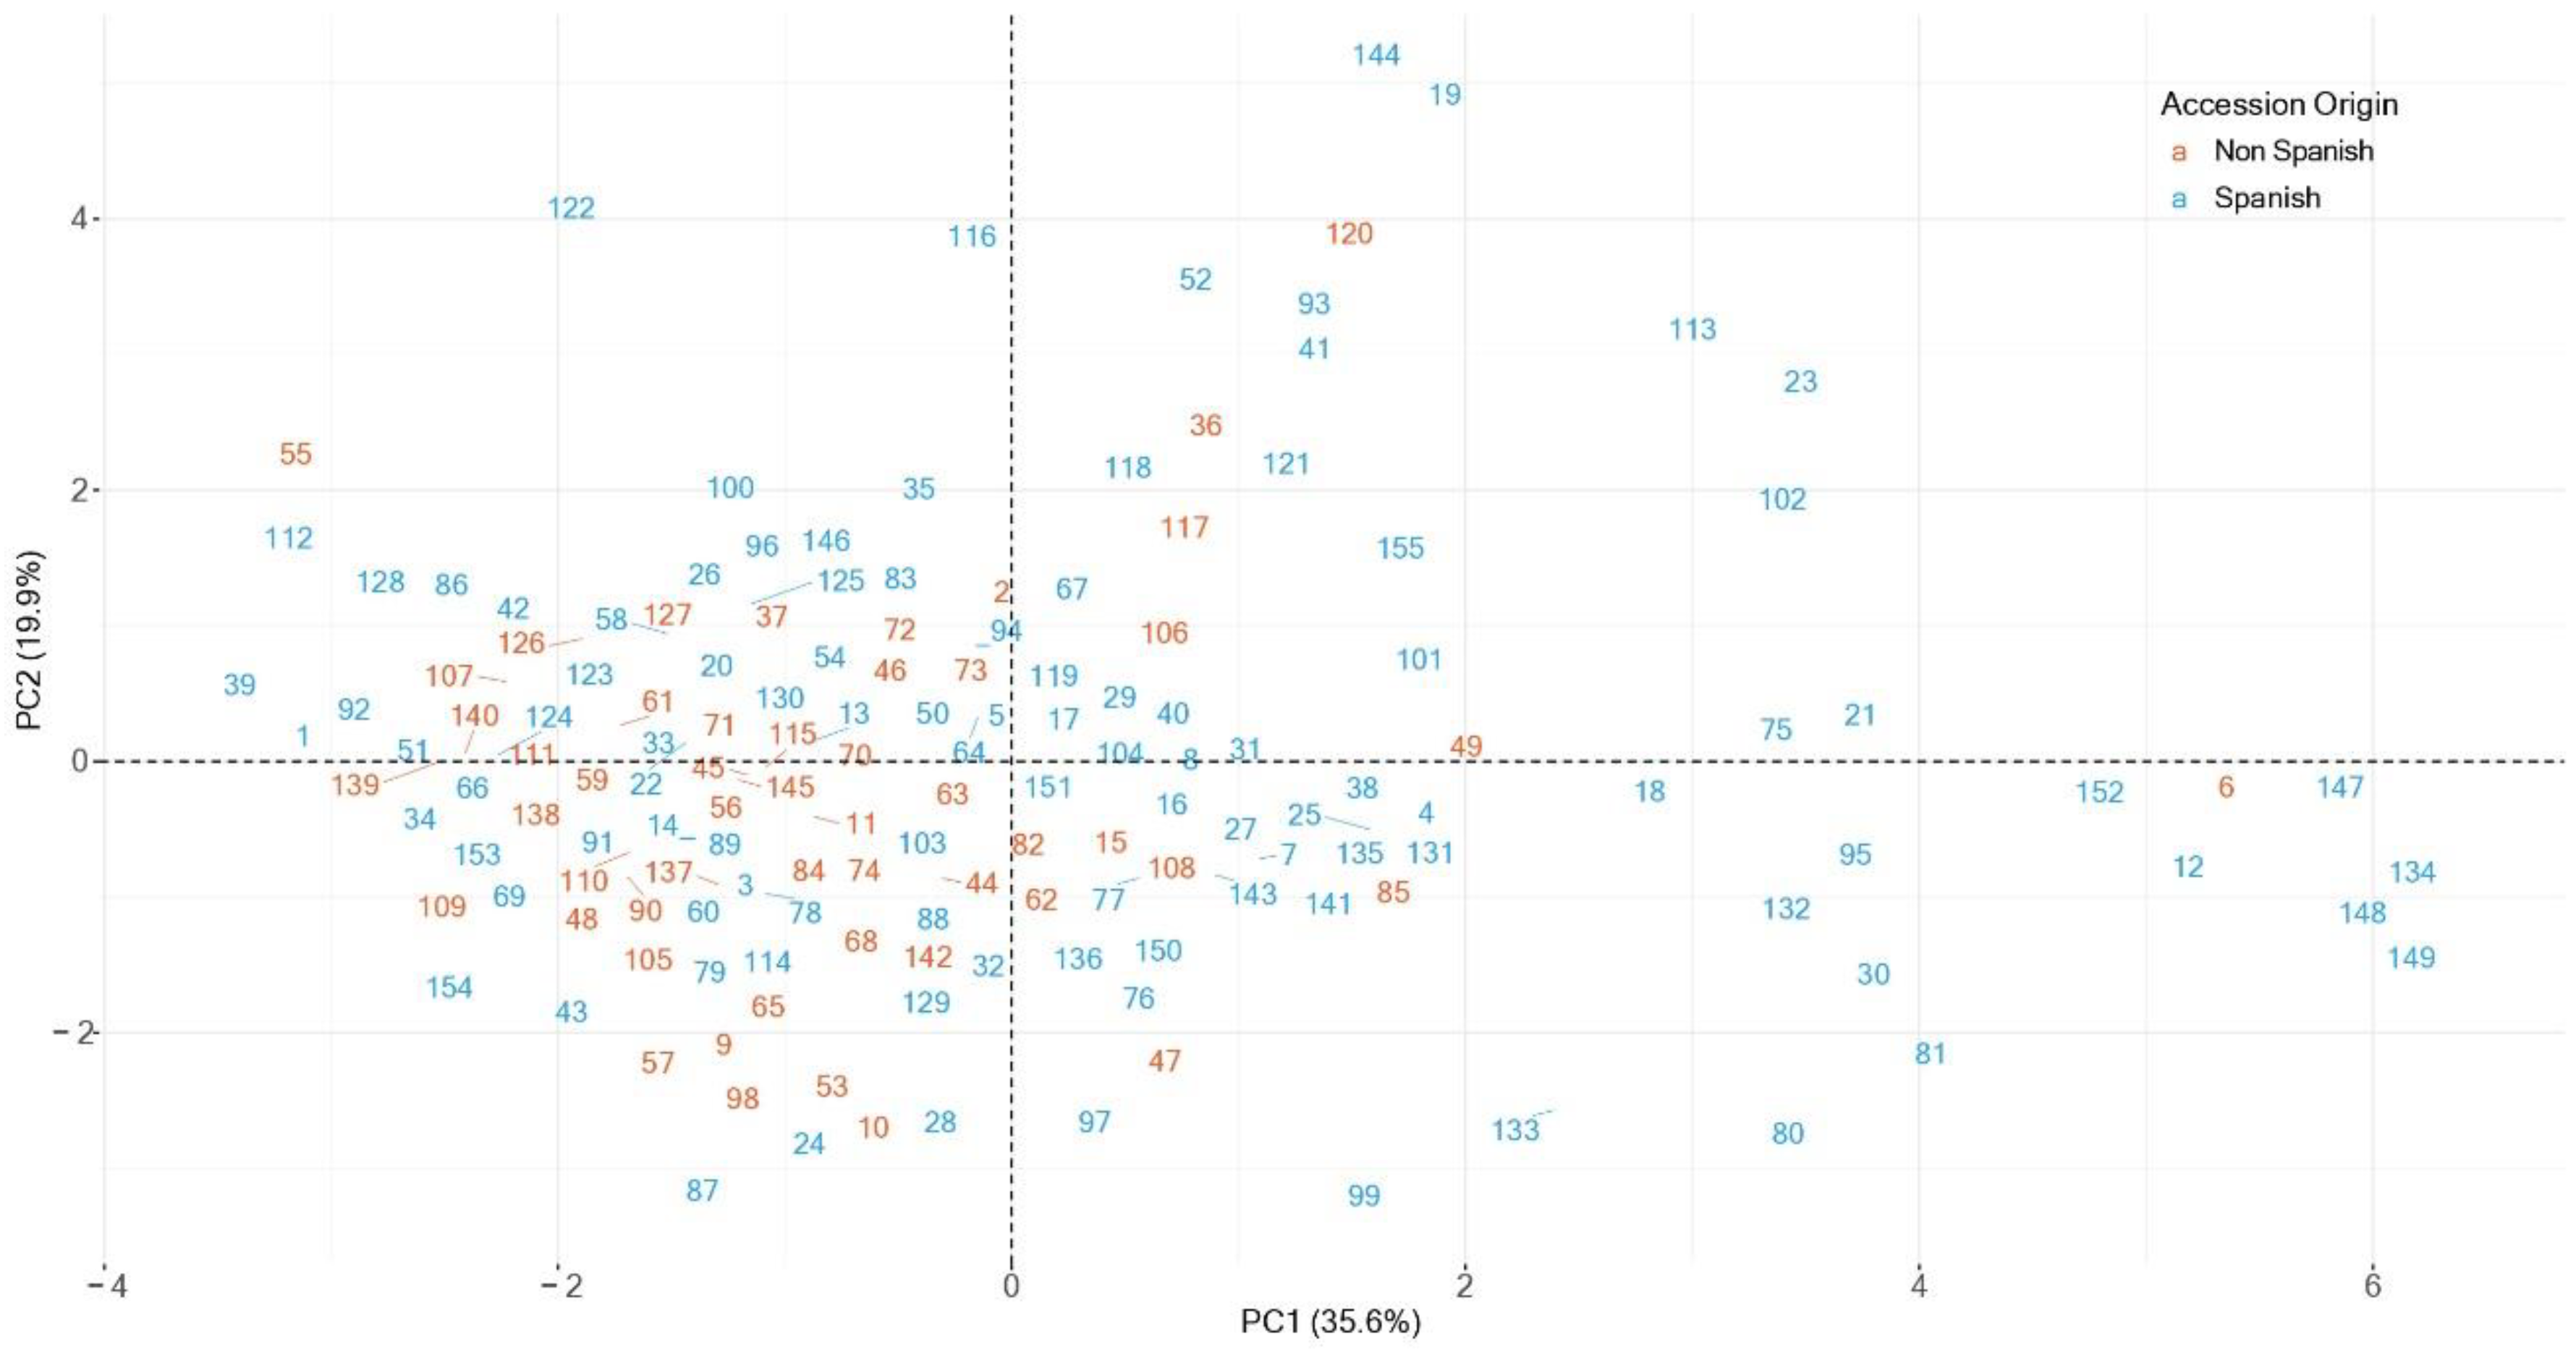
3.4. Principal Components Analysis

The first two components accounted for 55.5% of the total variance, with PC1 accounting for 35.6% and PC2 accounting for 19.9% (Figure 3 and Figure 4 and Supplementary Table S5). Therefore, further analysis was based on these two components.
PC1 correlated mostly with total and individual organic acids (Figure 3 and Supplementary Table S6). Total acids and sugars were the two traits with more contribution in the two-dimensional principal component analysis. Malic, citric, and quinic acids had a great contribution in the total variance, while glucose and oxalic acid had a very low contribution in the two first PCs (Figure 3). Figure 4 showed the PCA plot for the 155 accessions included in this study for the 12 variables studied. Accessions with positive loading on PC1, mainly Spanish accessions (‘Bellaguarda Lardero—MSV 27’, ‘Santa Margarida’, ‘Transparente’, ‘Transparente Blanca’, ‘Urarte’, ‘Verde Doncella_MRF 36’) as well as the non-Spanish accession ‘Astrakan Red’ were characterized by higher values of organic acids and other biochemical compounds. On the contrary, accessions with negative loadings (including 44 out of 56 non-Spanish accessions such as ‘Fuji’, ‘Nueva Starking’, ‘Regal Prince_1’, ‘Galaxy’, ‘Redaphough’, ‘Starkrimson_1’, or ‘Evasni’) had lower values for these traits.
Separation on the PC2 component was mainly due to total and individual sugars (Supplementary Table S6). Accessions with positive loadings on PC2 showed higher values for sweetness traits: ‘Eugenia’, ‘Reineta Regil’, ‘Reineta Blanca Canada_1’, ‘De Pera’ or ‘Pera 2’. Moreover, the three brown accessions of the study (‘Bossost_2—MRF 76’, ‘Reineta Gris’, and ‘Terrera’), should be highlighted for their higher sugar values. Furthermore, it is noteworthy that the non-Spanish accession ‘Fuji’ showed an extreme sweetness value compared to other non-Spanish accessions.

3.5. Mixed-Effect Model Results: Relationships between Climate and Genetic Origin

Figure 5 and Supplementary Table S7 show correlations between the mean values of sugars and organic acids of the 155 accessions and the different climatic traits. Correlations with total precipitation (pre), mean daily temperature range (trg), relative humidity (rh), and solar radiation (rad) tended to attain the highest values. Notwithstanding these results, a stepwise procedure based on the Akaike Information Criterion (AIC) statistic selected the best model (lowest AIC) that included fewer climatic variables than these four. The best model for oxalic acid, for instance, included the following climatic variables: pre and rad. The random effects coefficients revealed differences between accessions in both intercepts (mean Oxa values) and climate coefficients. For the remaining traits (Suc, Glu, Fru, Sor, Sugars, Cit, Tar, Mal, Qui, Succ + Shi, and Acids), the best model included pre, trg, and rad. The model coefficients were significant for all variables (all individual sugars, total sugars, all organic acids, and total acids).
A two-way cluster analysis based on the Manhattan distance was used to hierarchically classify the 155 apple accessions and the independent variables according to the model coefficients (Figure 6). The Manhattan distance is the sum of the distances between the accessions and traits assessed. Groups of accessions would indicate similar mean concentrations of biochemical traits and similar climate influence, while clusters of variables would group together model coefficients that tend to behave similarly across the accessions.
The model intercepts (labelled as ‘int’) correspond to the mean compound concentrations for average climatic conditions; they represent the genetic component as they only vary per accession (Figure 6). The model coefficients (labelled as ‘pre’, ‘rd’, or ‘trg’), on the other hand, capture the climate’s influence, which varies in interaction with the accession. Since the variables were standardised prior to the analysis, their coefficients can be compared among them. Thus, values closer to the limits (−1, 1) indicate a stronger influence than values close to zero.
Reading the heatmap in Figure 6 from left to right, the variable clusters are sorted by their decreasing effect in compound concentration, with the first cluster having the overall strongest effect. The analysis tended to form groups of either genetic effects (intercepts) or climatic variables, with the former (genetics) tending to have stronger effects than the later. Thus, between the first three groups of variables two consisted of intercepts, while the other contained climate coefficients. The first three groups of variables showed clear patterns across the accession groups, while the latter two did not show distinctive patterns and having in general coefficient values closer to zero.
Regarding the genetic variables (model intercepts), there were clear differences between accession groups. The first group of variables that included the intercepts for citric, malic, and total acids showed contrasting values between accession groups one and two with predominantly positive values indicating higher than the global mean concentrations and groups three and four with negative values. Nevertheless, the climate effects did not show large differences across accession groups and tended to have similar values across the dataset instead. Thus, no differences between accession groups were evident in the case of the second group of variables, integrating the effect of precipitation on oxalic and quinic acid. Precipitation for these two variables had a strong negative effect. In fact, precipitation had in general a negative effect for all the traits and most of the accessions.
On the other hand, the fourth group of variables included the effect of radiation on glucose, fructose, and total sugars, with a marked positive effect indicating that higher radiation was related to higher compound concentration in the third group of accessions (Figure 6). Group four showed a negative effect of the solar radiation, while the effect for the first two clusters of accessions was less marked and heterogeneous.
The fifth group of variables included the effects of precipitation, temperature range, and radiation on most of the variables studied and the intercept of oxalic acid. The model coefficients for all these effects were markedly negative for all the accession groups, indicating a negative effect. The last group of variables is more difficult to interpret since, as mentioned earlier, the coefficients tended to be closer to zero and did not show as clear patterns as the previous groups.
Reading the plot in Figure 6 from top to bottom, two large accession clusters were identified. Segregation into four smaller clusters was deemed as optimum. The first two clusters included 44 and 23 accessions, respectively; the third cluster had 42 accessions, while the last one included 46 accessions. As previously seen, there were clear differences between the accession groups regarding the model intercepts, while the climate effects were more homogeneous across the groups.
A relationship between clusters and accession origins was apparent. Indeed, clusters three and four grouped 45 out of 56 non-Spanish cultivars, while clusters one and two grouped 56 out of 99 local Spanish accessions. No relationship between the clustering analysis and the harvest date was detected. Supplementary Table S8 and S9 provide mean values of sugars (Supplementary Table S8) and organic acids (Supplementary Table S9) for each accession cluster according to the accession origin (Spanish or non-Spanish) and skin colour. They show that non-Spanish cultivars had in general lower organic acids and sorbitol contents than autochthone accessions. On the other hand, it is also quickly noticed that brown accessions had higher total sugars content due to high sucrose and sorbitol values and higher total acids content. Indeed, the three brown skin accessions are included in the second group of accessions.

4. Discussion

One of the objectives of this work was to better characterise a large number of apple cultivars and autochthone accessions. Iglesias et al., [56] and Urrestarazu et al., [29] reported that in Spain 87% of apple production is limited to four cultivars: ‘Fuji’, ‘Gala’, ‘Golden Delicious’ (more than 50% of total production), and ‘Red Delicious’. These figures highlight the loss of genetic diversity in the Spanish apple fruit industry.
As expected, there was a large variability in sugars and organic acids content among the 155 accessions. Values for the different traits varied significantly among accessions and years, as reported in previous studies [14,19,57,58,59]. Since the only source of variability between years was the climatic characteristics during the growing season, these results highlight that both accession and inter-annual climate variability have a relevant role in the assessed traits. In other tree crops, year and accession effects were also reported [11,60,61,62]. In addition to a direct impact on fruit physiology and development, metabolite profiles, sugars, and organic acids could also be significantly affected by the growing season climatic characteristics [63].
The measured values for sugars and organic acids were within previously reported ranges [14,19,37,57,64,65]. As it was foreseeable in apple, fructose had the highest values among individual sugars, followed by sucrose, glucose, and the sugar alcohol, sorbitol, in agreement with Liu et al., [66] and Yang et al., [19]. Regarding organic acids, malic was the major acid with values ranging from 10 to 100 times higher than the other acids. Previous works detected a smaller number of organic acids than the present study. Moreover, our measured values varied considerably, probably because of the different genetic background of the large number of accessions studied, when compared with other studies that used only a few commercial cultivars; actually, it is the first work reporting sugar and organic acid profiles for a large number of accessions (99 Spain native accessions and 56 non-Spanish cultivars) over several consecutive seasons (five years). Notably, it is also the first one to relate these traits to climatic characteristics.
The cluster analysis did not show association between the clusters and other characteristics such as the harvest date or the skin colour. Indeed, the 155 accessions studied could not be segregated by their harvest date or skin colour. Nevertheless, it is worth noting that the three brown accessions (fully russeting covered) had higher values for sugars and organic acids (‘Bossost_2—MRF 76’, ‘Reineta Gris’, and ‘Terrera’) than the other skin colour groups. Nevertheless, russeting is usually seen as a negative trait and is not appreciated by consumers, with the exception of a few varieties such as ‘Reineta Blanca Canada’ (which is not fully covered by russeting) or ‘Reineta Gris’. As the cuticle and cork coat protect plant tissues against environmental stresses, changing their components in the pericarp may affect the fruit resistance to biotic and abiotic stresses. Nevertheless, most apple accessions exhibiting russeting are triploids [38,67,68] and thus less suitable in breeding programs, even though russeted apples could improve sugars and organic acids profiles.
Fructose is sweeter than glucose and sucrose [69]; moreover, sorbitol is more beneficial than other sugars for human health [11,70]. Indeed, sorbitol can be used as a glucose substitute in diabetes diets, and it is an alternative natural sweetener to sucrose. Through the polyol pathway, also called the sorbitol-aldose reductase pathway, glucose is reduced to sorbitol and subsequently oxidized to fructose [71]. This process allows explaining the positive and significant correlations between the different individual sugars. Furthermore, sugars were positively and significantly correlated with SSC (r = 0.87) according to Mignard et al., [4], but they did not significantly correlate with TA. Individual organic acids, in turn, were significantly correlated with TA (r = 0.86), but they did not significantly correlate with SSC. These results support the common use of SSC and TA as proxy measures for fruit sweetness and acidity, respectively. Nevertheless, it is challenging to define fruit sweetness or sourness by only chemical methods without counting on the experience of regular panellists or consumers [72].
Spanish native accessions showed in general higher acid levels (e.g., ‘Urarte’, ‘Santa Margarida’, ‘Pero Pardo’, ‘Transparente’, ‘Transparente Blanca’, or ‘Bellaguarda Lardero—MSV 27’). Previous studies determined that total acids negatively correlated with sensory acceptability, reducing panellist acceptance [73]. In general, the equilibrium of sweetness and sourness determine consumer satisfaction for apple flavour. All these compounds influence the organoleptic perception of sweetness, sourness, and aroma [14,19] and contribute to the fruit-eating quality and consumer acceptance. Apple breeding programs should target achieving a good balance between sourness and sweetness in apples. This is not only to achieve good consumer acceptance, as some studies reported an influence of sweetness and sourness characteristics on chemical composition changes during apple ripening [14,74,75].
The Central Ebro Valley area is characterized by a semi-arid climate with warm and dry summers, high radiation, and large day–night temperature variation. For both sugars and organic acids, no previous study has assessed the relationship with climatic characteristics; nonetheless, significant correlations with climate have been reported for antioxidants and basic fruit quality traits [4,45,76,77].
Spanish native accessions exhibited a tendency to show higher values for sorbitol and organic acids than the non-Spanish cultivars. The increment of sugar concentration could respond to the high-energy demand required because of different stress responses and the supply of carbon to the organic and amino acids [24,72]. Moreover, different metabolic pathways could explain the negative correlation between individual sugars and organic acids [22]. Indeed, organic acids degradation can occur through dicarboxylates (malate and other organic acids) decarboxylation. Decarboxylation permits phosphoenolpyruvate (PEP) production, which plays a role in gluconeogenesis activation, resulting in increased glucose production [25].
According to the effect of climate, minor differences between clusters were found except for sorbitol, which was significantly and positively correlated with precipitation for most accessions. Sorbitol is the main photosynthesis product in the Rosaceae family and has a prominent role in osmoregulation. As such, it can be accumulated when plants are under drought, cold, salinity, or other stresses [20,78,79]. Moreover, the effect of radiation on sorbitol could be observed in the obtained two-way hierarchical analysis. In general, when radiation was higher accessions showed higher sorbitol concentration. These results agree with Li et al., [76], who showed that the sun-exposed peel of ‘Jonamac’ apple cultivar had higher sorbitol contents. The sorbitol-6-phosphate dehydrogenase (S6PDH) gene controls sorbitol production, while osmosis regulates its expression [79]. Sorbitol values could be related to the adaptability of plants to different climatic stresses such as water deficit, excessive cold, or salinity throughout osmotic regulation [78,80].
The PCA analysis showed substantial variability between accessions. It identified a pool of non-Spanish cultivars with specific and differentiated biomolecules profiles. The non-Spanish accessions or commercial cultivars seemed to be sweeter and less acidic in general than the autochthone accessions. They also had more similar profiles between them. In contrast, local Spanish accessions were more heterogeneous and tended to have in general higher sorbitol and organic acids concentration. Nevertheless, we can highlight two non-Spanish cultivars which were outliers from the above grouping tendency because of their extreme values: ‘Fuji’ (Nº55) had higher sugar levels, while ‘Astrakan Red’ (Nº6) had very high organic acids values.
Segregation between non-Spanish and local Spanish accessions was already reported by Mignard et al., [4] for the same plant material studying antioxidants traits. Similar results were found by Pereira-Lorenzo et al., [28] using SSRs for a great group of apple genotypes from Spanish germplasm banks. The segregation according to the origin of the accessions was also apparent in the two-way hierarchical analysis on the model coefficients. Consequently, most non-Spanish cultivars were grouped into clusters three and four. This reinforces the similarity between the non-Spanish cultivars and their differences concerning the autochthone accessions.
In a previous study, local Spanish accessions showed higher antioxidant levels than non-Spanish cultivars [4], probably because of their better adaptation to the stressful and thus less optimum agroclimatic conditions of NE Spain [38]. Antioxidants are secondary metabolites involved in division and development and are fundamental in the response to biotic and abiotic stresses [20,24]. The secondary metabolism is merged to primary metabolism (soluble sugars and organic acids) because of the different substrates diverted from primary routes and directed into the secondary pathway [20]. The correlations between individual sugars and organic acids and the different antioxidants (data not shown) showed the linkage between the primary and the secondary metabolisms. Therefore, abiotic and biotic stresses influencing photosynthesis and primary metabolism will affect secondary metabolism [24].
Moreover, the activation of repair mechanisms during the development associated with climate stress, such as high radiation or high temperatures in the ripening period, could lead to a higher need for carbon skeletons, new molecules synthesis, or increased antioxidative enzyme activity. As a reply, the plant generates an antioxidative defensive system composed of enzymes or increased antioxidants and specific sugars as sucrose or sorbitol [20,24,81]. Many of these processes can be supported by photosynthetic activity [81]. The extreme accumulation of reactive oxygen species (ROS), as a consequence of biotic and abiotic stress, could disrupt the regular physiological as well as the cellular effective performance, resulting in cell wall damage and oxidative stress [81].
Lastly, our results emphasize that basic research provides useful insight for selecting and developing new cultivars [5,28] with a particular sensory taste for consumers. Indeed, the present work highlighted climate traits and apple accessions as the main drivers of organic acids, sugars, and fruit quality characteristics. Between these two drivers, genetics seemed to have the strongest effect and showed clear differences between accession groups, while climate effects were strong only for certain compounds and had a more horizontal performance affecting equally the different accession groups. Therefore, accessions with a higher content of sugars or organic acids could be selected to promote their acceptability in the market. Furthermore, the evaluation of the germplasm bank assessed in this study with SSRs [28] or high-density SNP genotyping [82,83,84] may offer supplementary and precious material in understanding the genetics and its control on biochemical traits in apple. Similarly, a selection of the most suitable accessions could be done considering the climatic characteristics of cultivation sites.

5. Conclusions

The present work showed high biodiversity in the EEAD-CSIC apple collection concerning sugar and organic acid contents. Higher contents of organic acids were observed in the Spanish accessions, while the sugar profile was more heterogeneous according to the accession origins. These results strengthen the consciousness of the importance of autochthone phytogenetic resources. Furthermore, the differences shown in sugar and organic acid profiles between accessions stress the relevance of these biomolecules in the global quality of apples. Besides genetics, climatic characteristics during the growing season such as rainfall, solar radiation, and temperature substantially determine metabolite profiles. Organic acids content was in general inversely related to precipitation and positively related to temperature and solar radiation. Sugars were also affected by climate parameters. The climatic parameters emphasize the relevance of the geographic region where the fruit tree is cultivated in the resulting metabolites profiles, even though the genetics seemed to have the strongest effect on them. In future breeding programs, it could be worth considering the climate of the growing area in combination with genetics to further improve the biochemical characteristics of the cultivars and to identify the more resilient genotypes to climate change.

Supplementary Materials

The following supporting information can be downloaded at: https://www.mdpi.com/article/10.3390/agronomy12040827/s1, Supplementary Table S1: Basic information of the 155 apple accessions used on this study. Supplementary Table S2: Statistical significance of accession (A), year (Y), and their interaction (A × Y) on individual sugars and organic acids. Supplementary Table S3: Violin plots showing the variability between accessions (dots) and years of the sugars and organic acids parameters. Supplementary Figure S1: Individual sugars and organic acids mean values (2014–2018) for the 155 apple accessions studied. Supplementary Table S4: Pearson’s correlation coefficients between traits. Supplementary Figure S2: Hierarchical clustering heatmap of Pearson correlation coefficients over sugars, and organic acids pairs (using Pearson distance and average linkage). Supplementary Table S5: Eigenvalues of the ten principal components of the PCA and variance explained by each component. Supplementary Table S6: Eigenvectors of the five principal components (PCs). Supplementary Table S7: Correlations between the different sugars and organic acids of the 155 accessions studied and the climatic traits. Supplementary Table S8: Mean values of the mixed-effects model coefficients (int—intercept; pre—precipitation; trg—temperature range; rad—solar radiation) for the different sugar traits. Results are shown for each cluster according to the accession origin and according to the skin colour. Supplementary Table S9: Mean values of the mixed-effects model coefficients (int—intercept; pre—precipitation; trg—temperature range; rad—solar radiation) for the different organic acid traits. Results are shown for each cluster according to the accession origin and according to the skin colour.

Author Contributions

Conceptualization, M.Á.M.; methodology, P.M., S.B. and R.G.; software, S.B.; validation, P.M., M.Á.M. and S.B.; formal analysis, P.M. and S.B.; investigation, P.M., S.B. and M.Á.M.; resources, M.Á.M. and S.B.; data curation, P.M. and M.Á.M.; writing—original draft preparation, P.M.; writing—review and editing, P.M., M.Á.M., S.B., C.F.i.F. and G.R.; visualization, P.M., S.B. and M.Á.M.; supervision, M.Á.M.; project administration, M.Á.M.; funding acquisition, M.Á.M. All authors have read and agreed to the published version of the manuscript.

Funding

This work was funded by the Spanish Ministry of Science Innovation and Universities grants RFP 2012-00020, RFP 2015-00019 and PIE201640E070, cofounded by FEDER, and the Regional Government of Aragon (A44, T07_17R, A22_20R, and P. Mignard grant).

Institutional Review Board Statement

Not applicable.

Informed Consent Statement

Not applicable.

Acknowledgments

The authors gratefully thank Fernando Gómez and María Pilar Soteras for their support in the field and the laboratory. We also thank María Pilar Vallés and Ana María Castillo at EEAD-CSIC, Spain, for providing equipment access. We thank G.L. Reighard from the University of Clemson (USA) for critical manuscript review.

Conflicts of Interest

The authors declare no conflict of interest.

References

  1. Mushtaq, R.; Wani, A.W.; Nayik, G.A. Apple. In Antioxidants in Fruits: Properties and Health Benefits; Nayik, G.A., Gull, A., Eds.; Springer Nature: Singapore, 2020; pp. 507–522. [Google Scholar]
  2. FAOSTAT. Food and Agricultural Organization. 2021. Available online: http://faostat.fao.org/ (accessed on 21 July 2021).
  3. Kim, I.; Ku, K.; Jeong, M.; Kim, S.S.; Mitchell, A.E.; Lee, J. A comparison of the chemical composition and antioxidant activity of several new early- to mid-season apple cultivars for a warmer climate with traditional cultivars. J. Sci. Food Agric. 2019, 99, 4712–4724. [Google Scholar] [CrossRef] [PubMed]
  4. Mignard, P.; Beguería, S.; Reig, G.; Font i Forcada, C.; Moreno, M.Á. Genetic origin and climate determine fruit quality and antioxidant traits on apple (Malus x domestica Borkh). Sci. Hortic. 2021, 285, 110142. [Google Scholar] [CrossRef]
  5. Verma, S.; Evans, K.; Guan, Y.; Luby, J.J.; Rosyara, U.R.; Howard, N.P.; Bassil, N.; Bink, M.C.A.M.; Van De Weg, W.E.; Peace, C.P. Two large-effect QTLs, Ma and Ma3, determine genetic potential for acidity in apple fruit: Breeding insights from a multi-family study. Tree Genet. Genomes 2019, 15, 18. [Google Scholar] [CrossRef] [Green Version]
  6. Zhen, Q.; Fang, T.; Peng, Q.; Liao, L.; Zhao, L.; Owiti, A.; Han, Y. Developing gene-tagged molecular markers for evaluation of genetic association of apple SWEET genes with fruit sugar accumulation. Hortic. Res. 2018, 5, 14. [Google Scholar] [CrossRef] [Green Version]
  7. Boeing, H.; Bechthold, A.; Bub, A.; Ellinger, S.; Haller, D.; Kroke, A.; Leschik-Bonnet, E.; Müller, M.J.; Oberritter, H.; Schulze, M.; et al. Critical review: Vegetables and fruit in the prevention of chronic diseases. Eur. J. Nutr. 2012, 51, 637–663. [Google Scholar] [CrossRef] [Green Version]
  8. Zhang, T.; Wei, X.; Miao, Z.; Hassan, H.; Song, Y.; Fan, M. Screening for antioxidant and antibacterial activities of phenolics from Golden Delicious apple pomace. Chem. Cent. J. 2016, 10, 47. [Google Scholar] [CrossRef] [Green Version]
  9. Gibney, E.; Milenkovic, D.; Combet, E.; Ruskovska, T.; Greyling, A.; González-Sarrías, A.; De Roos, B.; Tomás-Barberán, F.A.; Morand, C.; Rodríguez-Mateos, A. Factors influencing the cardiometabolic response to (poly)phenols and phytosterols: A review of the COST Action POSITIVe activities. Eur. J. Nutr. 2019, 58, 37–47. [Google Scholar] [CrossRef] [Green Version]
  10. Ho, K.K.H.Y.; Ferruzzi, M.G.; Wightman, J.D. Potential health benefits of (poly)phenols derived from fruit and 100% fruit juice. Nutr. Rev. 2019, 78, 145–174. [Google Scholar] [CrossRef]
  11. Font i Forcada, C.; Reig, G.; Giménez, R.; Mignard, P.; Mestre, L.; Moreno, M.Á. Sugars and organic acids profile and antioxidant compounds of nectarine fruits influenced by different rootstocks. Sci. Hortic. 2019, 248, 145–153. [Google Scholar] [CrossRef]
  12. Jakobek, L.; Ištuk, J.; Buljeta, I.; Voća, S.; Žlabur, J.; Babojelić, M.S. Traditional, Indigenous Apple Varieties, a Fruit with Potential for Beneficial Effects: Their Quality Traits and Bioactive Polyphenol Contents. Foods 2020, 9, 52. [Google Scholar] [CrossRef] [Green Version]
  13. Minas, I.S.; Tanou, G.; Molassiotis, A. Environmental and orchard bases of peach fruit quality. Sci. Hortic. 2018, 235, 307–322. [Google Scholar] [CrossRef]
  14. Aprea, E.; Charles, M.; Endrizzi, I.; Corollaro, M.L.; Betta, E.; Biasioli, F.; Gasperi, F. Sweet taste in apple: The role of sorbitol, individual sugars, organic acids and volatile compounds. Sci. Rep. 2017, 7, 44950. [Google Scholar] [CrossRef] [PubMed]
  15. Briand, L.; Salles, C. Taste perception and integration. In Flavor; Woodhead Publishing: Sawston, UK, 2016; pp. 101–119. [Google Scholar]
  16. Iwanami, H.; Moriya, S.; Kotoda, N.; Mimida, N.; Takahashi-Sumiyoshi, S.; Abe, K. Mode of inheritance in fruit acidity in apple analysed with a mixed model of a major gene and polygenes using large complex pedigree. Plant Breed. 2012, 131, 322–328. [Google Scholar] [CrossRef]
  17. Zhang, Y.; Li, P.; Cheng, L. Developmental changes of carbohydrates, organic acids, amino acids, and phenolic compounds in ‘Honeycrisp’ apple flesh. Food Chem. 2010, 123, 1013–1018. [Google Scholar] [CrossRef]
  18. Charles, M.; Aprea, E.; Gasperi, F. Factors influencing sweet taste in apple. In Bioactive Molecules in Food; Mérillon, J.M., Ramawat, K.G., Eds.; Springer: Cham, Switzerland, 2018. [Google Scholar] [CrossRef]
  19. Yang, S.; Meng, Z.; Li, Y.; Chen, R.; Yang, Y.; Zhao, Z. Evaluation of Physiological Characteristics, Soluble Sugars, Organic Acids and Volatile Compounds in ‘Orin’ Apples (Malus domestica) at Different Ripening Stages. Molecules 2021, 26, 807. [Google Scholar] [CrossRef]
  20. Amri, R.; Font i Forcada, C.; Giménez, R.; Pina, A.; Moreno, M.Á. Biochemical Characterization and Differential Expression of PAL Genes Associated With “Translocated” Peach/Plum Graft-Incompatibility. Front. Plant Sci. 2021, 10, 622578. [Google Scholar] [CrossRef]
  21. Zhao, H.; Sun, S.; Zhang, L.; Yang, J.; Wang, Z.; Ma, F.; Li, M. Carbohydrate metabolism and transport in apple roots under nitrogen deficiency. Plant Physiol. Biochem. 2020, 155, 455–463. [Google Scholar] [CrossRef]
  22. Ruan, Y.-L. Sucrose Metabolism: Gateway to Diverse Carbon Use and Sugar Signaling. Annu. Rev. Plant Biol. 2014, 65, 33–67. [Google Scholar] [CrossRef]
  23. Yang, J.; Zhu, L.; Cui, W.; Zhang, C.; Li, D.; Ma, B.; Cheng, L.; Ruan, Y.-L.; Ma, F.; Li, M. Increased activity of MdFRK2, a high-affinity fructokinase, leads to upregulation of sorbitol metabolism and downregulation of sucrose metabolism in apple leaves. Hortic. Res. 2018, 5, 71. [Google Scholar] [CrossRef] [Green Version]
  24. Li, M.; Feng, F.; Cheng, L. Expression Patterns of Genes Involved in Sugar Metabolism and Accumulation during Apple Fruit Development. PLoS ONE 2012, 7, e33055. [Google Scholar] [CrossRef] [Green Version]
  25. Vallarino, J.G.; Osorio, S. Organic acids. In Postharvest Physiology and Biochemistry of Fruits and Vegetables; Woodhead Publishing: Sawston, UK, 2019; pp. 207–224. [Google Scholar] [CrossRef]
  26. Igamberdiev, A.U.; Eprintsev, A.T. Organic Acids: The Pools of Fixed Carbon Involved in Redox Regulation and Energy Balance in Higher Plants. Front. Plant Sci. 2016, 7, 1042. [Google Scholar] [CrossRef] [PubMed] [Green Version]
  27. Maeda, H.; Dudareva, N. The Shikimate Pathway and Aromatic Amino Acid Biosynthesis in Plants. Annu. Rev. Plant Biol. 2012, 63, 73–105. [Google Scholar] [CrossRef] [PubMed]
  28. Pereira-Lorenzo, S.; Urrestarazu, J.; Ramos-Cabrer, A.; Miranda, C.; Pina, A.; Dapena, E.; Moreno, M.Á.; Errea, P.; Llamero, N.; Díaz-Hernández, M.; et al. Analysis of the genetic diversity and structure of the Spanish apple genetic resources suggests the existence of an Iberian genepool. Ann. Appl. Biol. 2017, 171, 424–440. [Google Scholar] [CrossRef]
  29. Urrestarazu, J.; Denancé, C.; Ravon, E.; Guyader, A.; Guisnel, R.; Feugey, L.; Poncet, C.; Lateur, M.; Houben, P.; Ordidge, M.; et al. Analysis of the genetic diversity and structure across a wide range of germplasm reveals prominent gene flow in apple at the European level. BMC Plant Biol. 2016, 16, 2411–2502. [Google Scholar] [CrossRef] [PubMed]
  30. Ordidge, M.; Kirdwichai, P.; Baksh, M.F.; Venison, E.P.; Gibbings, J.G.; Dunwell, J.M. Genetic analysis of a major international collection of cultivated apple varieties reveals previously unknown historic heteroploid and inbred relationships. PLoS ONE 2018, 13, e0202405. [Google Scholar] [CrossRef] [PubMed] [Green Version]
  31. Swarup, S.; Cargill, E.J.; Crosby, K.; Flagel, L.; Kniskern, J.; Glenn, K.C. Genetic diversity is indispensable for plant breeding to improve crops. Crop Sci. 2020, 61, 839–852. [Google Scholar] [CrossRef]
  32. Font i Forcada, C.; Gradziel, T.M.; Gogorcena, Y.; Moreno, M.Á. Phenotypic diversity among local Spanish and foreign peach and nectarine [Prunus persica (L.) Batsch] accessions. Euphytica 2014, 197, 261–277. [Google Scholar] [CrossRef] [Green Version]
  33. Guajardo, V.; Solís, S.; Almada, R.; Saski, C.; Gasic, K.; Moreno, M.Á. Genome-wide SNP identification in Prunus rootstocks germplasm collections using Genotyping-by-Sequencing: Phylogenetic analysis, distribution of SNPs and prediction of their effect on gene function. Sci. Rep. 2020, 10, 1467. [Google Scholar] [CrossRef] [Green Version]
  34. McClure, K.A.; Gong, Y.; Song, J.; Vinqvist-Tymchuk, M.; Palmer, L.C.; Fan, L.; Burgher-MacLellan, K.; Zhang, Z.; Celton, J.-M.; Forney, C.F.; et al. Genome-wide association studies in apple reveal loci of large effect controlling apple polyphenols. Hortic. Res. 2019, 6, 107. [Google Scholar] [CrossRef] [Green Version]
  35. Muranty, H.; Denancé, C.; Feugey, L.; Crépin, J.-L.; Barbier, Y.; Tartarini, S.; Ordidge, M.; Troggio, M.; Lateur, M.; Nybom, H.; et al. Using whole-genome SNP data to reconstruct a large multi-generation pedigree in apple germplasm. BMC Plant Biol. 2020, 20, 2. [Google Scholar] [CrossRef] [Green Version]
  36. Vanderzande, S.; Howard, N.P.; Cai, L.; Linge, C.D.S.; Antanaviciute, L.; Bink, M.C.A.M.; Kruisselbrink, J.W.; Bassil, N.; Gasic, K.; Iezzoni, A.; et al. High-quality, genome-wide SNP genotypic data for pedigreed germplasm of the diploid outbreeding species apple, peach, and sweet cherry through a common workflow. PLoS ONE 2019, 14, e0210928. [Google Scholar] [CrossRef] [PubMed] [Green Version]
  37. Castel, L.; Pina, A.; Irisarri, P.; Errea, P. Sugar content and organic acid profiles of local apple cultivars recovered from mountain zones. J. Appl. Bot. Food Qual. 2020, 93, 217–224. [Google Scholar] [CrossRef]
  38. Reig, G.; Blanco, A.; Castillo, A.M.; Gogorcena, Y.; Moreno, M.Á. Phenotypic diversity of Spanish apple (Malus x domestica Borkh) accessions grown at the vulnerable climatic conditions of the Ebro Valley, Spain. Sci. Hortic. 2015, 185, 200–210. [Google Scholar] [CrossRef] [Green Version]
  39. Parajuli, R.; Thoma, G.; Matlock, M.D. Environmental sustainability of fruit and vegetable production supply chains in the face of climate change: A review. Sci. Total Environ. 2018, 650, 2863–2879. [Google Scholar] [CrossRef] [PubMed]
  40. Parry, M.L. Climate Change and World Agriculture; Routledge: London, UK, 2019. [Google Scholar] [CrossRef] [Green Version]
  41. Beguería, S.; López-Moreno, J.I.; Lorente, A.; Seeger, M.; García-Ruiz, J.M. Assessing the Effect of Climate Oscillations and Land-use Changes on Streamflow in the Central Spanish Pyrenees. Ambio 2003, 32, 283–286. [Google Scholar] [CrossRef]
  42. Boudichevskaia, A.; Kumar, G.; Sharma, Y.; Kapoor, R.; Singh, A.K. Challenges and strategies for developing climate-smart apple varieties through genomic approaches. In Genomic Designing of Climate-Smart Fruit Crops; Springer: Cham, Switzerland, 2020; pp. 23–71. [Google Scholar]
  43. Cirilli, M.; Bassi, D.; Ciacciulli, A. Sugars in peach fruit: A breeding perspective. Hortic. Res. 2016, 3, 15067. [Google Scholar] [CrossRef] [PubMed] [Green Version]
  44. Stewart, A.L.; Ahmed, S. Effects of climate change on fruit nutrition. In Fruit Crops; Elsevier: Amsterdam, The Netherlands, 2020; pp. 77–93. [Google Scholar] [CrossRef]
  45. Yuri, J.A.; Neira, A.; Quilodran, A.; Motomura, Y.; Palomo, I. Antioxidant activity and total phenolics concentration in apple peel and flesh is determined by cultivar and agroclimatic growing regions in Chile. J. Food Agric. Environ. 2009, 7, 513–517. [Google Scholar]
  46. Mills, T.; Behboudian, M.; Clothier, B. Water Relations, Growth, and the Composition of ‘Braeburn’ Apple Fruit under Deficit Irrigation. J. Am. Soc. Hortic. Sci. 1996, 121, 286–291. [Google Scholar] [CrossRef]
  47. Cakpo, C.B.; Vercambre, G.; Baldazzi, V.; Roch, L.; Dai, Z.; Valsesia, P.; Memah, M.-M.; Colombié, S.; Moing, A.; Gibon, Y.; et al. Model-assisted comparison of sugar accumulation patterns in ten fleshy fruits highlights differences between herbaceous and woody species. Ann. Bot. 2020, 126, 455–470. [Google Scholar] [CrossRef]
  48. Kumar, P.; Sethi, S.; Sharma, R.R.; Singh, S.; Saha, S.; Sharma, V.K.; Shashi, S.K.; Eldho, V. Influence of altitudinal variation on the physical and biochemical characteristics of apple (Malus domestica). Indian J. Agric. Sci. 2019, 89, 145–152. [Google Scholar]
  49. Li, M.; Ma, F.; Shang, P.; Zhang, M.; Hou, C.; Liang, D. Influence of light on ascorbate formation and metabolism in apple fruits. Planta 2009, 230, 39–51. [Google Scholar] [CrossRef] [PubMed]
  50. Fujisawa, M.; Kobayashi, K. Climate change adaptation practices of apple growers in Nagano, Japan. Mitig. Adapt. Strat. Glob. Chang. 2011, 16, 865–877. [Google Scholar] [CrossRef]
  51. Li, M.; Guo, J.; He, J.; Xu, C.; Li, J.; Mi, C.; Tao, S. Possible impact of climate change on apple yield in Northwest China. Arch. Meteorol. Geophys. Bioclimatol. Ser. B 2019, 139, 191–203. [Google Scholar] [CrossRef] [Green Version]
  52. Ahmadi, H.; Ghalhari, G.F.; Baaghideh, M. Impacts of climate change on apple tree cultivation areas in Iran. Clim. Chang. 2018, 153, 91–103. [Google Scholar] [CrossRef]
  53. Gitea, M.A.; Gitea, D.; Tit, D.M.; Purza, L.; Samuel, A.D.; Bungau, S.; Badea, G.E.; Aleya, L. Orchard management under the effects of climate change: Implications for apple, plum, and almond growing. Environ. Sci. Pollut. Res. 2019, 26, 9908–9915. [Google Scholar] [CrossRef]
  54. R Core Team. R: A language and Environment for Statistical Computing. R Foundation for Statistical Computing; Vienna, Austria. 2019. Available online: https://www.R-project.org/ (accessed on 8 March 2022).
  55. Pinheiro, J.; Bates, D.; DebRoy, S.; Sarkar, D.; R Core Team. Nlme: Linear and Nonlinear Mixed Effects Models_. R Package Version 3.1-140. 2019. Available online: https://CRAN.R-project.org/package=nlme (accessed on 8 March 2022).
  56. Iglesias, I.; Carbo, J.; Bonany, J. Innovación Varietal manzana: Situación y perspectivas de futuro. Rev. Frutic. 2016, 52, 6–37. [Google Scholar]
  57. Begić-Akagić, A.; Spaho, N.; Gaši, F.; Drkenda, P.; Vranac, A.; Meland, M.; Besim, S. Sugar and organic acid profiles of the traditional and international apple cultivars for processing. J. Hyg. Eng. Des. 2014, 7, 190–196. [Google Scholar]
  58. Bureau, S.; Ścibisz, I.; Le Bourvellec, C.; Renard, C.M. Effect of Sample Preparation on the Measurement of Sugars, Organic Acids, and Polyphenols in Apple Fruit by Mid-infrared Spectroscopy. J. Agric. Food Chem. 2012, 60, 3551–3563. [Google Scholar] [CrossRef]
  59. Donahue, D.; Córdoba, G.R.; Elone, S.; Wallis, A.; Basedow, M. ‘Honeycrisp’ Bitter Pit Response to Rootstock and Region under Eastern New York Climatic Conditions. Plants 2021, 10, 983. [Google Scholar] [CrossRef]
  60. Font i Forcada, C.; Gogorcena, Y.; Moreno, M.Á. Agronomical Parameters, Sugar Profile and Antioxidant Compounds of “Catherine” Peach Cultivar Influenced by Different Plum Rootstocks. Int. J. Mol. Sci. 2014, 15, 2237–2254. [Google Scholar] [CrossRef]
  61. Iglesias, I.; Giné-Bordonaba, J.; Garanto, X.; Reig, G. Rootstock affects quality and phytochemical composition of ‘Big Top’ nectarine fruits grown under hot climatic conditions. Sci. Hortic. 2019, 256, 108586. [Google Scholar] [CrossRef]
  62. Gómez-Martínez, H.; Bermejo, A.; Zuriaga, E.; Badenes, M. Polyphenol content in apricot fruits. Sci. Hortic. 2020, 277, 109828. [Google Scholar] [CrossRef]
  63. Davey, M.W.; Auwerkerken, A.; Keulemans, J. Relationship of apple vitamin C and antioxidant contents to harvest date and postharvest pathogen infection. J. Sci. Food Agric. 2007, 87, 802–813. [Google Scholar] [CrossRef]
  64. Jing, C.; Feng, D.; Zhao, Z.; Wu, X.; Chen, X. Effect of environmental factors on skin pigmentation and taste in three apple cultivars. Acta Physiol. Plant. 2020, 42, 69. [Google Scholar] [CrossRef]
  65. Oszmiański, J.; Lachowicz, S.; Gamsjäger, H. Phytochemical analysis by liquid chromatography of ten old apple varieties grown in Austria and their antioxidative activity. Eur. Food Res. Technol. 2020, 246, 437–448. [Google Scholar] [CrossRef]
  66. Liu, Y.; Zhang, X.; Zhao, Z. Effects of fruit bagging on anthocyanins, sugars, organic acids, and color properties of ‘Granny Smith’ and ‘Golden Delicious’ during fruit maturation. Eur. Food Res. Technol. 2012, 236, 329–339. [Google Scholar] [CrossRef]
  67. Busatto, N.; Matsumoto, D.; Tadiello, A.; Vrhovsek, U.; Costa, F. Multifaceted analyses disclose the role of fruit size and skin-russeting in the accumulation pattern of phenolic compounds in apple. PLoS ONE 2019, 14, e0219354. [Google Scholar] [CrossRef] [Green Version]
  68. Wang, Y.-Z.; Dai, M.-S.; Zhang, S.-J.; Shi, Z.-B. Exploring Candidate Genes for Pericarp Russet Pigmentation of Sand Pear (Pyrus pyrifolia) via RNA-Seq Data in Two Genotypes Contrasting for Pericarp Color. PLoS ONE 2014, 9, e83675. [Google Scholar] [CrossRef] [Green Version]
  69. Zhang, J.; Nie, J.-Y.; Li, J.; Zhang, H.; Li, Y.; Farooq, S.; Bacha, S.A.S.; Wang, J. Evaluation of sugar and organic acid composition and their levels in highbush blueberries from two regions of China. J. Integr. Agric. 2020, 19, 2352–2361. [Google Scholar] [CrossRef]
  70. Forni, E.; Erba, M.; Maestrelli, A.; Polesello, A. Sorbitol and free sugar contents in plums. Food Chem. 1992, 44, 269–275. [Google Scholar] [CrossRef]
  71. Lu, Q.; Hao, M.; Wu, W.; Zhang, N.; Isaac, A.T.; Yin, J.; Zhu, X.; Du, L.; Yin, X. Antidiabetic cataract effects of GbE, rutin and quercetin are mediated by the inhibition of oxidative stress and polyol pathway. Acta Biochim. Pol. 2017, 65, 35–41. [Google Scholar] [CrossRef] [PubMed] [Green Version]
  72. Giné-Bordonaba, J.; Cantín, C.M.; Echeverría, G.; Ubach, D.; Larrigaudière, C. The effect of chilling injury-inducing storage conditions on quality and consumer acceptance of different Prunus persica cultivars. Postharvest Biol. Technol. 2016, 115, 38–47. [Google Scholar] [CrossRef]
  73. Keenan, D.F.; Valverde, J.; Gormley, R.; Butler, F.; Brunton, N.P. Selecting apple cultivars for use in ready-to-eat desserts based on multivariate analyses of physico-chemical properties. LWT 2012, 48, 308–315. [Google Scholar] [CrossRef]
  74. Bayarri, S.; Calvo, C.; Costell, E.; Durán, L. Influence of Color on Perception of Sweetness and Fruit Flavor of Fruit Drinks. Food Sci. Technol. Int. 2001, 7, 399–404. [Google Scholar] [CrossRef]
  75. Corollaro, M.L.; Aprea, E.; Endrizzi, I.; Betta, E.; Demattè, M.L.; Charles, M.; Bergamaschi, M.; Costa, F.; Biasioli, F.; Grappadelli, L.C.; et al. A combined sensory-instrumental tool for apple quality evaluation. Postharvest Biol. Technol. 2014, 96, 135–144. [Google Scholar] [CrossRef]
  76. Li, P.; Ma, F.; Cheng, L. Primary and secondary metabolism in the sun-exposed peel and the shaded peel of apple fruit. Physiol. Plant. 2012, 148, 9–24. [Google Scholar] [CrossRef]
  77. McGhie, T.K.; Hunt, A.M.; Barnett, L.E. Cultivar and Growing Region Determine the Antioxidant Polyphenolic Concentration and Composition of Apples Grown in New Zealand. J. Agric. Food Chem. 2005, 53, 3065–3070. [Google Scholar] [CrossRef]
  78. Dietrich, H.; Krüger-Steden, E.; Patz, C.D.; Will, F.; Rheinberger, A.; Hopf, I. Increase of sorbitol in pear and apple juice by water stress, a consequence of climatic change. Fruit Process. 2007, 6, 348–355. [Google Scholar]
  79. Zhang, J.Y.; Tian, R.R.; Dong, J.L.; Zhao, K.; Li, T.H.; Wang, T. Response and regulation of the S6PDH gene in apple leaves under osmotic stress. J. Hortic. Sci. Biotechnol. 2011, 86, 563–568. [Google Scholar] [CrossRef]
  80. Gao, Z.; Jayanty, S.; Beaudry, R.; Loescher, W. Sorbitol Transporter Expression in Apple Sink Tissues: Implications for Fruit Sugar Accumulation and Watercore Development. J. Am. Soc. Hortic. Sci. 2005, 130, 261–268. [Google Scholar] [CrossRef] [Green Version]
  81. Pandey, V.P.; Awasthi, M.; Singh, S.; Tiwari, S.; Dwivedi, U.N. A Comprehensive Review on Function and Application of Plant Peroxidases. Biochem. Anal. Biochem. 2017, 6, 308. [Google Scholar] [CrossRef]
  82. Font i Forcada, C.; Guajardo, V.; Chin-Wo, S.R.; Moreno, M.Á. Association Mapping Analysis for Fruit Quality Traits in Prunus persica Using SNP Markers. Front. Plant Sci. 2019, 9, 2005. [Google Scholar] [CrossRef] [PubMed] [Green Version]
  83. Jung, M.; Roth, M.; Aranzana, M.J.; Auwerkerken, A.; Bink, M.; Denancé, C.; Dujak, C.; Durel, C.-E.; Font i Forcada, C.; Cantín, C.M.; et al. The apple REFPOP—A reference population for genomics-assisted breeding in apple. Hortic. Res. 2020, 7, 189. [Google Scholar] [CrossRef] [PubMed]
  84. Winfield, M.; Burridge, A.; Ordidge, M.; Harper, H.; Wilkinson, P.; Thorogood, D.; Copas, L.; Edwards, K.; Barker, G. Development of a minimal KASP marker panel for distinguishing genotypes in apple collections. PLoS ONE 2020, 15, e0242940. [Google Scholar] [CrossRef]
Figure 1. Quantitative profiles of the individual sugars and organic acids for the 155 apple accessions during the five years of study (2014–2018).
Agronomy 12 00827 g001
Figure 2. Pearson’s correlation coefficients for the traits studied for the 155 accessions assessed during the five years of study. Abbreviations: Sugars—total sugars; Acids—total organic acids. The size of the circle for each correlation and the colour depicts the significance and the magnitude of the correlation coefficient, respectively.
Agronomy 12 00827 g002
Figure 3. Two-dimensional principal component analysis (PCA) plot for all the 12 variables assessed. The colours showed the contributions of variables accounting for the total variability. Abbreviations: Sugars—total sugars; Acids—total organic acids.
Agronomy 12 00827 g003
Figure 4. PCA plot showing the relation among the 12 evaluated traits on the 155 apple accessions.
Agronomy 12 00827 g004
Figure 5. Correlations between the different sugars and organic acids of the 155 accessions studied and the climatic traits. Abbreviations: Suc—sucrose; Glu—glucose; Fru—fructose; Sor—sorbitol; Sugars—total sugars; Oxa—oxalic acid; Cit—citric acid; Tar—tartaric acid; Mal—malic acid; Qui—quinic acid; Succ + Shi—succinic + shikimic acid; Acids—total organic acid; pre—total precipitation; pre_day—mean daily precipitation; tmx—mean daily maximum temperature; tmn—mean daily minimum temperature; tmd—mean daily temperature; trg—mean daily temperature range; rh—relative humidity; rad—solar radiation. The size of the circle for each correlation and the colour depicts the significance and the magnitude of the correlation coefficient, respectively.
Agronomy 12 00827 g005
Figure 6. Heatmap of the 155 accessions grouped into five groups. Abbreviations: intercept—int; temperature range—trg; total precipitation—pre; radiation—rd; Suc—sucrose; GLU—glucose; FRU—fructose; SOR—sorbitol; SUG—total sugars; OXA—oxalic acid; CIT—citric acid; TAR—tartaric acid; MAL—malic acid; QUI—quinic acid; SUCC—succinic + shikimic acid; ACI—total organic acid.
Agronomy 12 00827 g006
Table 1. Average values for individual sugars and organic acids traits over accessions and years: units, minimum, maximum, mean values, and standard deviation (SD).
TraitUnitsMinimumMaximumMeanSD
Sugarsg kg−125.02159.7988.9417.80
Sucroseg kg−13.2661.1825.759.17
Glucoseg kg−12.1837.5613.165.68
Fructoseg kg−114.6387.4045.388.96
Sorbitolg kg−10.4826.234.653.41
Acidsg kg−10.77322.8326.7862.336
Oxalicg kg−10.0100.0200.0150.001
Citricg kg−10.0100.3120.0570.034
Tartaricg kg−10.0170.2710.0470.021
Malicg kg−10.43519.8435.6892.119
Quinicg kg−10.1162.0350.4350.210
Succinic + Shikimicg kg−10.0802.2840.5550.285
Publisher’s Note: MDPI stays neutral with regard to jurisdictional claims in published maps and institutional affiliations.

