Article

Genetic Bases of Flow- and Sink-Related Traits in Rice Revealed by Genome-Wide Association Study

1
Rice Research Institute, Shenyang Agricultural University, Shenyang 110866, China
2
Institute of Crop Sciences/National Key Facility for Crop Gene Resources and Genetic Improvement, Chinese Academy of Agricultural Sciences, Beijing 100081, China
3
Guangdong Laboratory of Lingnan Modern Agriculture, Genome Analysis Laboratory of the Ministry of Agriculture, Agricultural Genomics Institute at Shenzhen, Chinese Academy of Agricultural Sciences, Shenzhen 518120, China
4
National Nanfan Research Institute (Sanya), Chinese Academy of Agricultural Sciences, Sanya 572024, China
*
Authors to whom correspondence should be addressed.
These authors contributed equally to this work.
Agronomy 2022, 12(4), 776; https://doi.org/10.3390/agronomy12040776
Submission received: 26 February 2022 / Revised: 20 March 2022 / Accepted: 22 March 2022 / Published: 23 March 2022
(This article belongs to the Special Issue Advances in Rice Physioecology and Sustainable Cultivation)

Abstract

:
Rice yield is determined by source, sink, and flow and the coordination of these factors. However, the genetic base of the sink-flow is still unknown. We conducted on genome-wide association to detect quantitative trait loci (QTL) related to sink size (the number of rachis branches and spikelet number in rachis branches) and flow vascular bundle (large and small vascular bundles number in panicle neck and second internode) using 440 germplasm resources. The accessions exhibited marked variation in all traits and demonstrated complex phenotypic correlations. A total of 138 QTL affecting the 8 traits were detected using 3,188,500 high-quality single nucleotide polymorphism markers. Sixteen QTL clusters simultaneously affected flow and sink traits, which might explain the genetic base of significant correlations between flow and sink traits. The nine candidate genes in two consistent chromosomal regions simultaneously affecting multiple vascular bundle and sink size traits by performing gene-based association analysis and haplotype analysis. Among them, D2 (LOC_Os01g10040) and Gn1a (LOC_Os01g10110) for qPLVN1.1, qSLVN1.1, and qPRN1.2 and OsPIN5b (LOC_Os08g41720) for qPLVN8, qSLVN8, qSSVN8, and qSTSN8.2 were considered the most likely candidate genes based on functional annotations. The results provide useful information for improving rice yield potential via balancing sink–flow relationships by marker-assisted selection.

1. Introduction

Rice yield is a complex trait multiplicatively determined by the source (the top most three leaves, especially flag leaf), sink (spikelets number and grain size), translocation capacity (i.e., flow) of assimilates and the degree of coordination between them. Among these, the vascular bundle is the transport system connecting source and sink, and it plays an important role in transporting mineral nutrients, photosynthate, and water from source to sink. The grain yield has been positively correlated with vascular bundle number in rice [1], wheat [2], and oats [3]. Xu et al., (1998) reported that the large and small vascular bundles number in the panicle neck were positively correlated with the rachis branches number and spikelets number per panicle, indicating that the number of vascular bundles in the panicle neck is the basis of the formation of large panicles [4]. The ability of the vascular system to efficiently transport various assimilates from source to sink has been shown to be a limiting factor in increasing rice yield [1].
There is a wide variation in the number of large vascular bundles in the panicle neck (PLVN) between indica (xian) and japonica (geng) cultivars. The PLVN is an important parameter determining differentiation between xian and geng rice [4,5]. Additionally, the ratio of the PLVN to the number of primary rachis branches (PRN), which is called the V/R ratio, is also an important parameter distinguishing xian from geng. Generally, xian varieties tend to have more PLVN and higher V/R ratios than geng varieties. Therefore, genetic analysis of vascular bundles in the panicle neck and second internode is of great significance not only for the increase of yield potential using heterosis between xian and geng but also for studies on xiangeng differentiation.
In the past two decades, the application of QTL mapping has greatly improved the understanding of the genetic mechanism of many complex agronomic traits. A wide range of genetic studies has been carried out to detect the QTL controlling the number of large and small vascular bundles in rice panicle neck [6,7,8,9,10]. Several QTL affecting sink and flow traits have been further cloned, including sink-related genes such as FON4 [11], Ghd7 [12], OsPTR6 [13], OSHT [14], Gn1a [15], IPA1 [16,17], and GNP6 [18] for grain number and flow-related genes such as APO1 [19]. Notably, some QTL influencing the PLVN have been mapped to chromosomal regions close to those associated with sink-related traits such as spikelet number per panicle and PRN, hinting at the possible pleiotropy or tight linkage of genes affecting sink and flow traits [6,7]. Additionally, some genes simultaneously associated with the number of large vascular bundles and sink-related traits in rice have been further cloned, such as APO1 [19] and DEP1 [10,20]. However, the genetic basis of the vascular bundle in the second internode remains unclear. In addition, in order to better understand the genetic basis of flow- and sink-related traits, the QTL or genes underlying these related traits need to be validated and dissected.
In this study, we report to identify the genetic relationship between flow (number of large and small vascular bundles in panicle neck and second internode) and sink (the number of rachis branches and spikelet number in rachis branches) based on genome-wide association analysis (GWAS) using a panel of diversity germplasms resouces collected worldwide with high-quality single nucleotide polymorphism (SNP) markers. The candidate genes in two consistent QTL regions simultaneously affecting multiple vascular bundle and sink size traits were selected by gene-based association analysis and haplotype analysis. The aim of the study is to identify phenotypic relationships between flow- and sink-related traits and their genetic bases.

2. Materials and Methods

2.1. Materials and Phenotypic Investigation

A total of 440 accessions were selected from the 3 K RGP [21]. The panel consisted of 12 types, including 238 xian accessions (31 xian-1A, 53 xian-1B, 48 xian-2, 25 xian-3, and 81 xian-adm), 158 geng accessions (50 geng-tmp, 76 geng-trp, 19 geng-sbtrp, and 13 geng-adm), 16 accessions of intermediate type, 18 aus/boro accessions, and 10 basmati/sadri accessions (Table S1).
Field trial were conducted in Sanya (18.3° N, 109.3° E) during December 2015–April 2016. Each accession was planted in a plot of two rows, with 10 plants in each row at a spacing of 17 × 25 cm for two replications. The field management followed the local farmers’ standard practices.
At the full heading stage, five uniform plants in the middle of each accession were selected. The transverse sections of stem were made uniformly at 2 cm above the neck-panicle node and second internode and then kept in formalin-acetic-alcohol (FAA) fixative solution. The number of large (PLVN) and small (PSVN) vascular bundles in the panicle neck and the number of large (SLVN) and small (SSVN) vascular bundles in the second internode were observed using microscopy (ZEISS AXIO, Germany). At maturity, eight uniform plants in the middle of each accession were harvested and measured, including number of primary rachis branches (PRN), number of secondary rachis branches (SRN), total spikelets number on primary rachis branches (PTSN), and total spikelets number on secondary rachis branches (STSN). The V/R value was calculated by the ratio of PLVN to PRN.

2.2. Genotypic Data

The 4.8 M SNP genotype data of the 440 accessions were generated from the 3000 Genomes Rice Project [13] using PLINK 1.9 software [22]. In order to minimize the effect of false positives, SNPs with missing rate ≥ 20% and minor allele frequency ≤ 5% were removed. Heterozygous SNPs were also eliminated [23]. The remaining 3,188,500 high-quality SNPs, evenly distributed over the chromosomes, were used for GWAS.

2.3. Genome-Wide Association Study (GWAS)

We performed a GWAS to excavate SNPs that were significantly associated with 8 measured traits (PLVN, PSVN, SLVN, SSVN, PRN, SRN, PTSN, STSN) using the 3,188,500 SNPs and the mean trait values of the 440 accessions using EMMA eXpedited (EMMAX) software [24]. In this study, the model of mixed linear (MLM), PCA + K, was used in the association analysis. The effective number of independent markers was calculated using GEC software [25], and the significance thresholds were p  = 1.11 × 10⁻⁷. Manhattan plots were plotted by the R package “CMplot” using the GWAS results (https://github.com/YinLiLin/CMplot, accessed on 5 February 2022). The chromosomal region of each QTL was determined when the LD decayed to half of the maximum value [26].

2.4. Candidate Gene Analysis

We selected important QTL simultaneously influencing sink- and flow-related traits to excavate candidate genes affecting target traits based on GWAS for the flow- and sink-related traits. The LD block where the significant trait-associated SNPs were situated was defined as the candidate region. The LDs between SNPs were evaluated using squared Pearson’s correlation coefficient (r2) calculated with the R package “genetics”. LD heatmaps surrounding peaks in the GWAS were constructed with the R package “LD heatmap” [27]. Candidate regions were estimated using an r2 ≥ 0.6 [28].
Gene-based association analysis was performed to identify candidate genes for important QTL. All the genes located in the candidate regions for each important QTL were retrieved from the Rice Annotation Project Database [29]. All available high-quality SNPs with a minor allele frequency of more than 0.05 and/or a missing rate of less than 20% located inside of these genes were searched from 18 M SNP data generated from 3 K RGP in the Rice SNP-Seek Database [30]. Then, we performed gene-based association analyses through MLM using the PCA and K applied in GWAS. The threshold was defined as −log10P of the peak SNP of the detected QTL −1 [31,32]. Haplotype analysis of all the candidate genes detected by gene-based association analysis was conducted according to all available non-synonymous SNPs located inside these genes in the whole, xian, and geng populations. Haplotypes containing more than 10 rice accessions were used to analyze the significant differences in phenotype. Finally, the most likely candidate genes were selected for comprehensive analysis based on the significance of the haplotype analyses (analysis of variance (ANOVA)) and their functional annotations.

3. Results

3.1. Phenotypic Variation and Correlation

All eight measured traits showed tremendous variations in the whole, xian, and geng populations (Figure 1a; Table S1). Based on the informations of 3010 rice accessions [21], 238 accessions belonged to the xian subpopulation, and 158 accessions belonged to the geng subpopulation for further phenotypic analysis (Table S1). Among the eight measured traits, xian varieties showed significantly higher PLVN, SRN, and STSN than geng varieties, while there were no significant differences on the other five traits (PSVN, SLVN, SSVN, PRN, and PTSN) between the xian and geng groups (Figure 1a). For the V/R value, xian accessions showed significantly higher values than those from geng accessions (Figure 1a).
There were significant positive correlations among the four flow-related traits (PLVN, PSVN, SLVN, and SSVN). Similarly, strong positive correlations were observed among the four sink-related traits (PRN, SRN, PTST, and STSN). The four vascular bundle traits (PLVN, PSVN, SLVN, and SSVN) were all significantly positively correlated with four sink-related traits (PRN, SRN, PTST, and STSN). As expected, V/R, a xian-geng characteristic trait, showed significant positive correlations with PLVN but significant negative correlations with PRN (Figure 1b). The results suggested that QTL might be mapped the same regions for the traits with high correlation. In addition, we observed that compared with geng cultivars, the increase of PLVN in xian cultivars did not lead to an increase in the number of primary branches. Instead, it increased the number of secondary branches (Figure 1c).

3.2. QTL Mapping

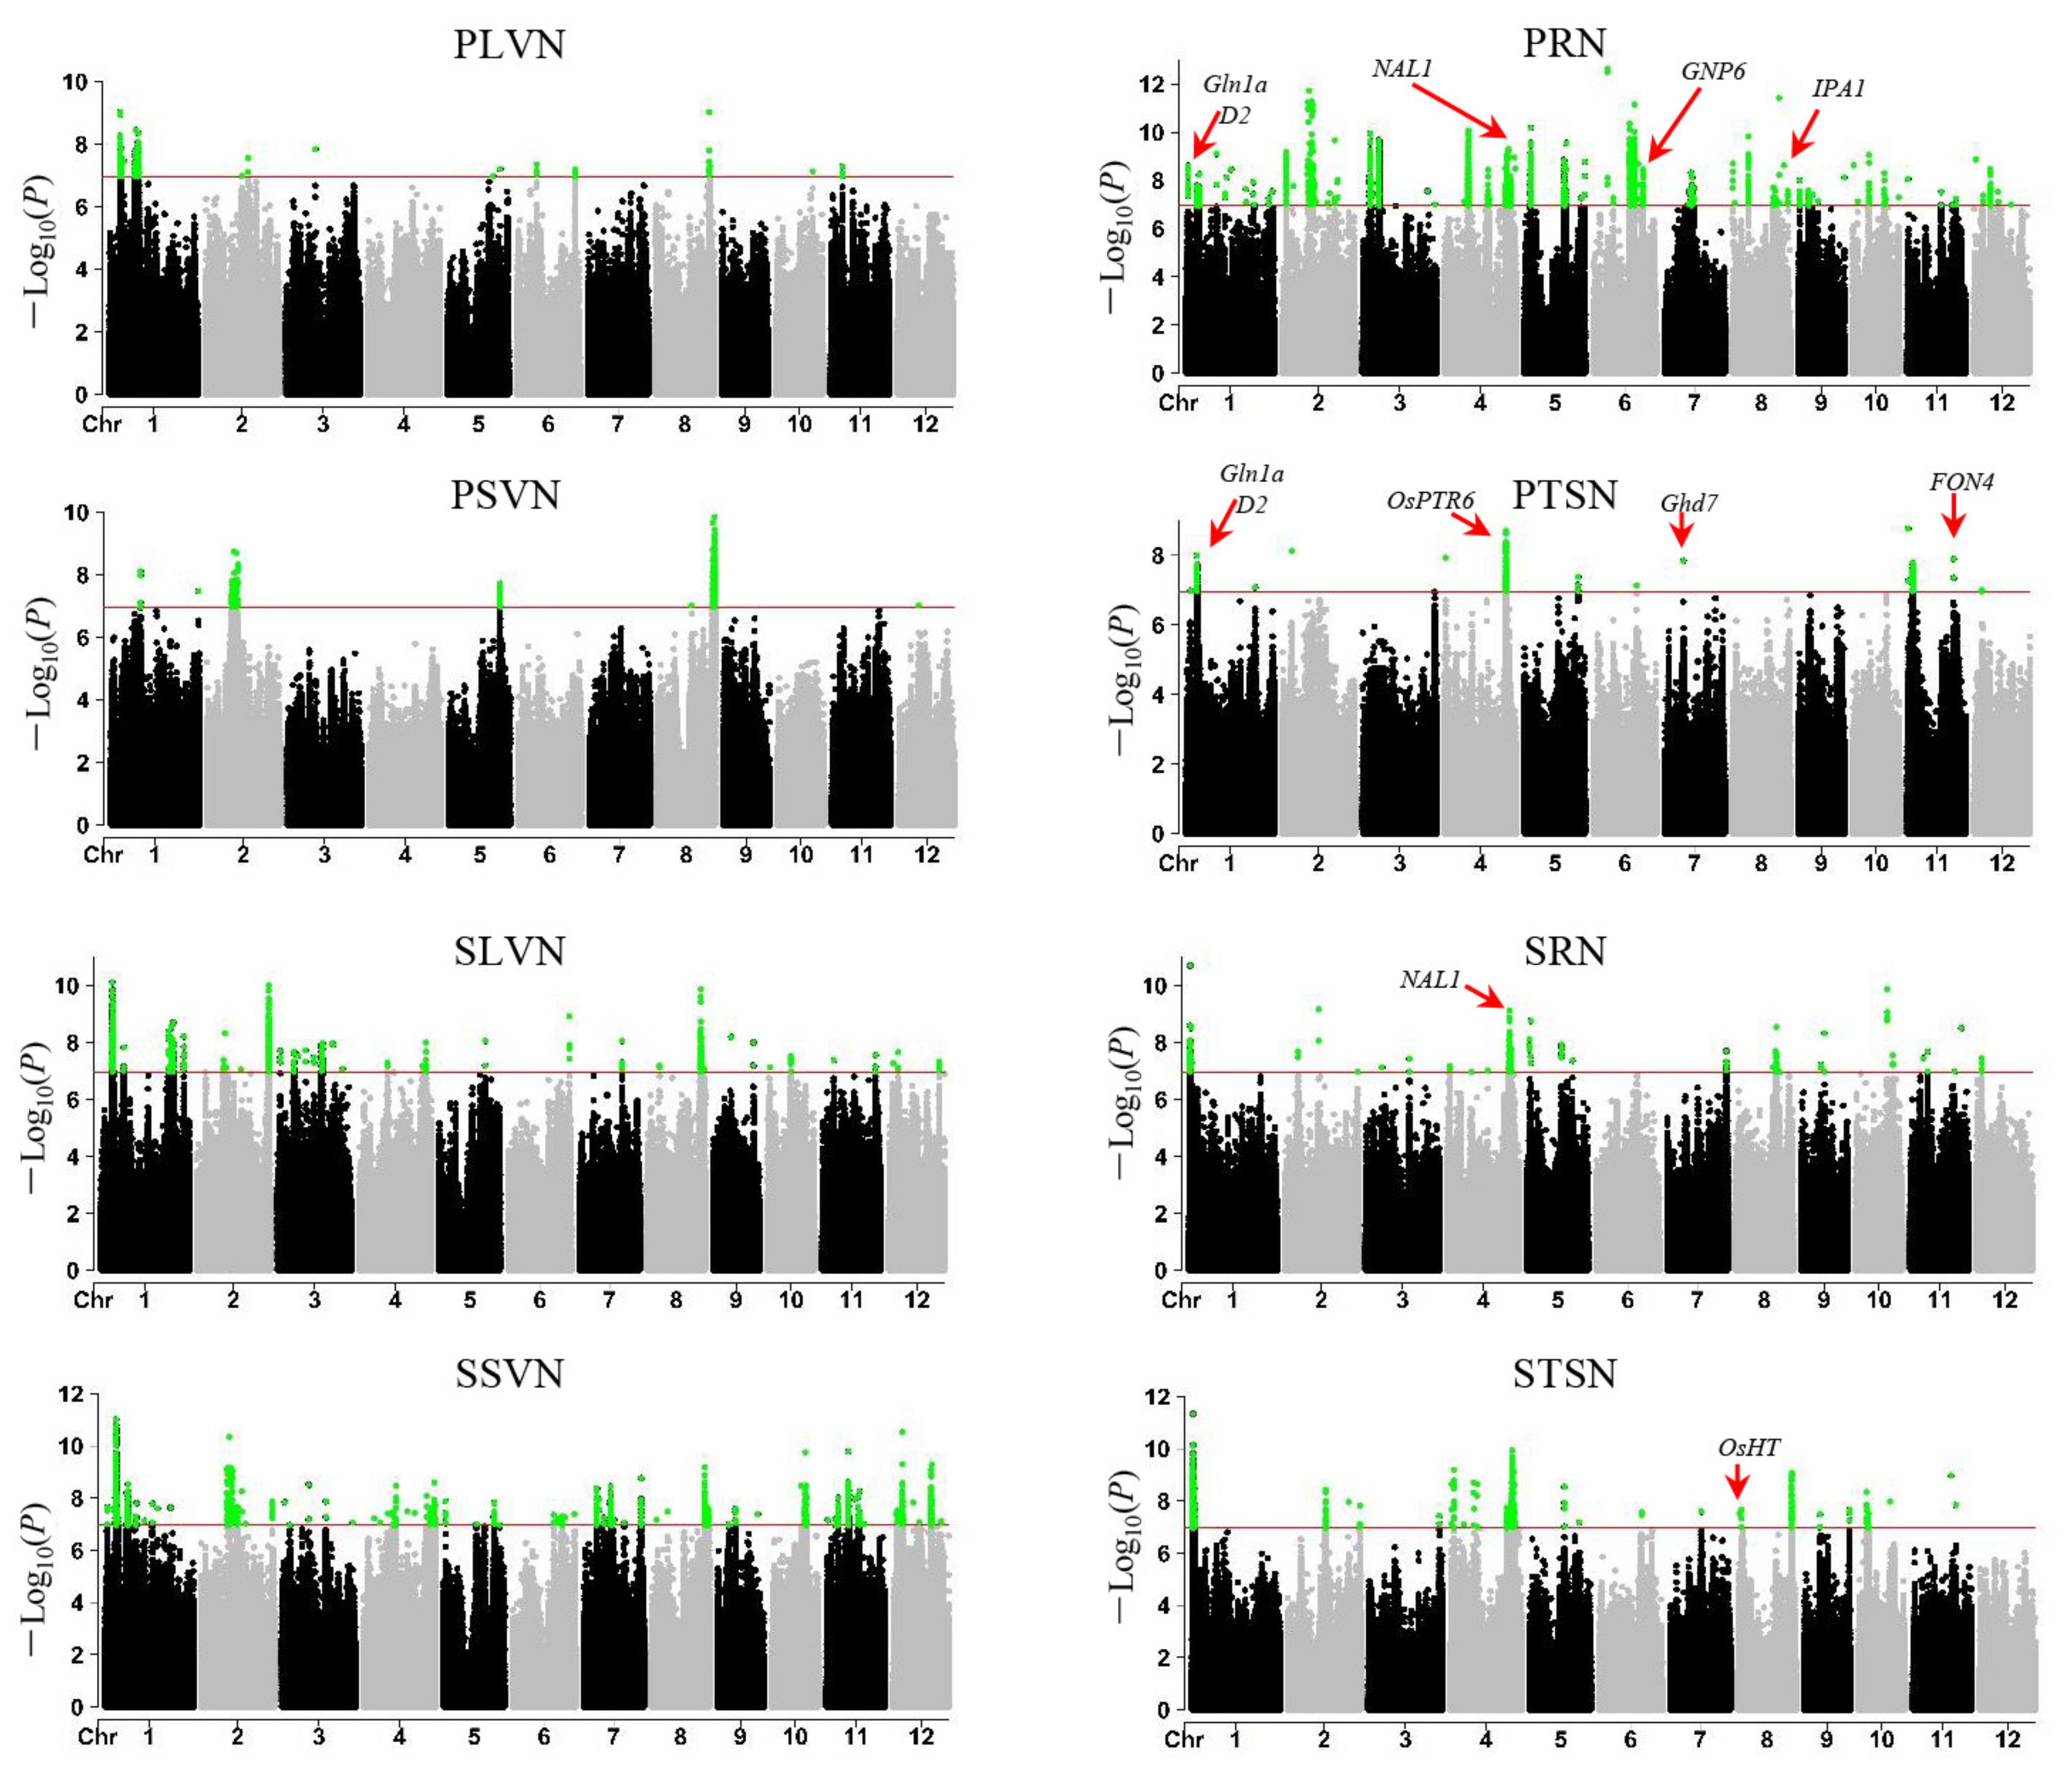
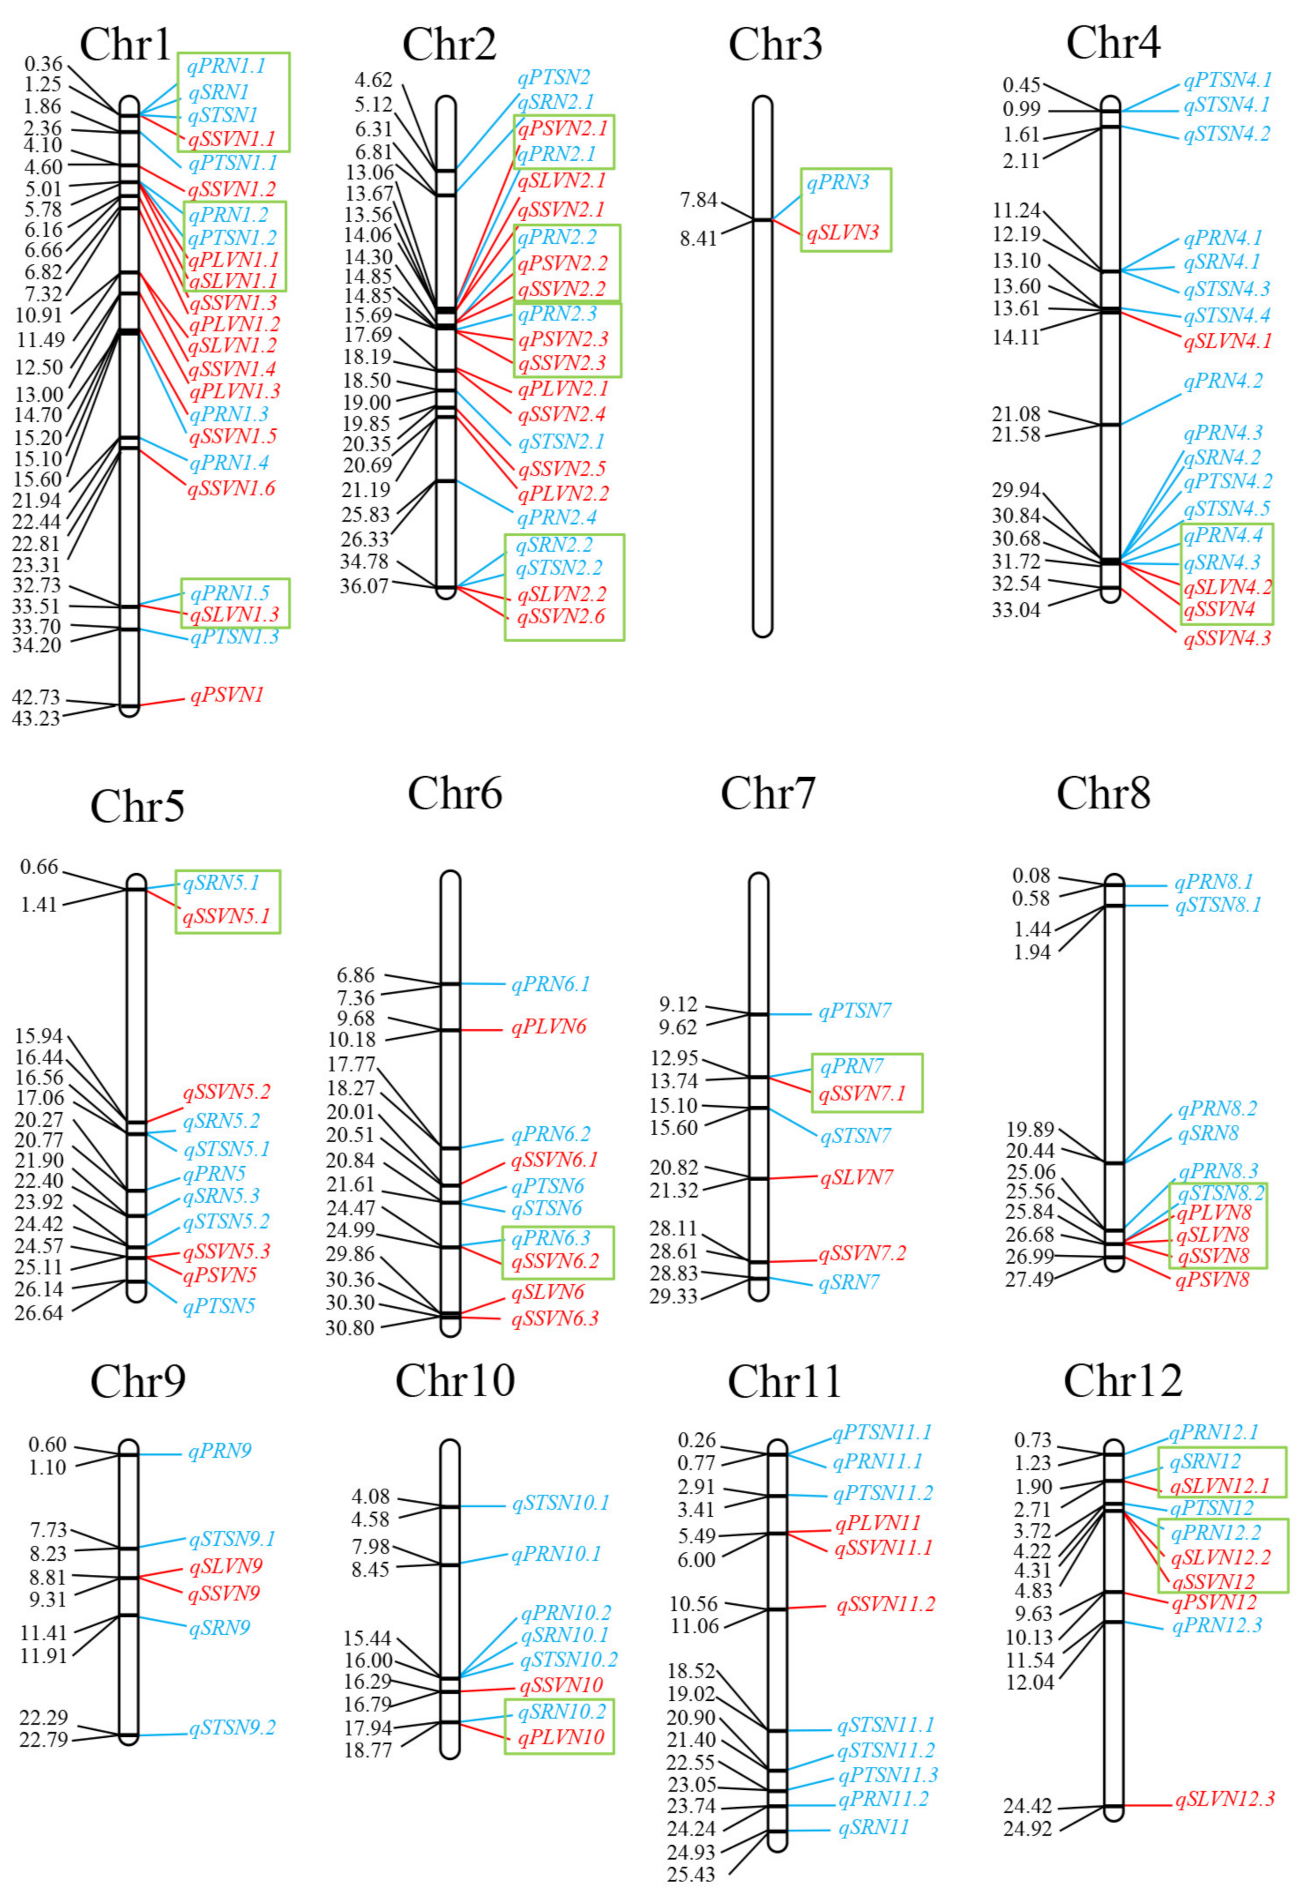
We performed principal component analysis (PCA) and kinship (KI) to quantify the population structure of these 440 varieties (Figure 2a,b). The score plot of principal components showed that accessions clustered together in subpopulations (Figure 2a), and the heat map of the kinship-relatedness matrix showed the same result (Figure 2b). We determined the chromosomal regions for each QTL around the peak-SNP based on the calculated LD decay rate of 250 kb (Figure 2c). A total of 138 QTL were identified for the 8 traits, including 59 QTL influencing flow-related traits (PLVN, PSVN, SLVN, and SSVN) and 79 QTL for sink-related traits (PRN, SRN, PTSN, and STSN) (Figure 3 and Figure 4; Table S2).
Among the 59 QTL influencing vascular-bundle-related traits, three chromosomal regions were consistently identified, influencing the PSVN and SSVN, including in the region of 14.3–14.81 Mb on chromosome 2 harboring qPSVN2.2 and qSSVN2.2, the region of 15.01–15.69 Mb on chromosome 2 harboring qPSVN2.3 and qSSVN2.3, and the region of 24.57–25.11 Mb on chromosome 5 harboring qPSVN5 and qSSVN5.3. One chromosomal region harboring qPLVN1.1 and qSLVN1.1, controlling PLVN and SLVN, was consistently found in the region of 5.01–5.78 Mb on chromosome 1. Six chromosomal regions controlling SLVN and SSVN were consistently identified, including in the region of 10.91–11.49 Mb on chromosome 1 harboring qSLVN1.2 and qSSVN1.4, the region of 13.56–14.06 Mb on chromosome 2 harboring qSLVN2.1 and qSSVN2.1, the region of 34.78–36.07 Mb on chromosome 2 harboring qSLVN2.2 and qSSVN2.6, the region of 30.68–31.72 Mb on chromosome 4 harboring qSLVN4.2 and qSSVN4, the region of 8.81–9.31 Mb on chromosome 9 harboring qSLVN9 and qSSVN9, and the region of 4.31–4.83 Mb on chromosome 12 harboring qSLVN12 and qSSVN12. In addition, a chromosomal region harboring qPLVN8, qSLVN8, and qSSVN8, affecting the three vascular bundles traits (PLVN, SLVN, and SSVN), was consistently detected in the region of 25.84–26.68 Mb on chromosome 8 (Figure 3 and Figure 4; Table S2).
Of the 79 QTL for sink-related traits, two, two, and two chromosomal regions were identified simultaneously affecting the PRN and SRN, PRN and PTSN, and SRN and STSN, respectively. Specifically, three chromosomal regions were consistently identified to influence the PRN, SRN, and STSN, including the region of 0.36–1.21 Mb on chromosome 1 harboring qPRN1.1, qSRN1, and qSTSN1, the region of 11.24–12.19 Mb on chromosome 4 harboring qPRN4.1, qSRN4.1, and qSTSN4.3, and the region of 15.44–16.00 Mb on chromosome 10 harboring qPRN10.2, qSRN10.1, and qSTSN10.2. In the region of 29.94–30.84 Mb on chromosome 4, a chromosomal region harboring qPTSN4.2, qSTSN4.5, qPRN4.3, and qSRN4.2 was found to associate with the four sink-related traits (PRN, SRN, PTSN, and STSN) (Figure 3 and Figure 4; Table S2).

3.3. Coincidence of QTL for Sink- and Flow-Related Traits

In comparisons of 59 QTL affecting flow-related traits with 79 QTLs associated with sink-related traits, 45 QTL affecting vascular bundles characteristics located on 16 chromosomal regions were close to those related to sink traits, hinting at the possible pleiotropy or tight linkage of genes affecting sink and flow traits (Figure 4). Among these, eight chromosomal regions were identified influencing multiple flow- and sink-related traits, including the region of 0.36–1.25 Mb on chromosome 1 harboring qSRN1 for SRN, qSTSN1 for STSN, qPRN1.1 for PRN, and qSSVN1.1 for SSVN; the region of 5.01–5.78 Mb on chromosome 1 harboring qPLVN1.1, qPTSN1.2, qSLVN1.1, and qPRN1.2 for PLVN, PTSN, SLVN, and PRN, respectively; the region of 34.78–36.07 Mb on chromosome 2 harboring qSRN2.2 for SRN, qSTSN2.2 for STSN, qSLVN2.2 for SLVN, and qSSVN2.6 for SSVN; the region of 30.68–31.72 Mb on chromosome 4 harboring qPRN4.3, qSRN4.2, qSSVN4, and qSLVN4.2 for PRN, SRN, SSVN, and SLVN, respectively; the region of 25.84–26.68 Mb on chromosome 8 harboring qSSVN8 for SSVN, qPLVN8 for PLVN, qSLVN8 for SLVN, and qSTSN8.2 for STSN; the region of 14.30–14.85 Mb on chromosome 2 harboring qSSVN2.2 for SSVN, qPSVN2.2 for PSVN, and qPRN2.2 for PRN; the region of 14.85–15.69 Mb on chromosome 2 harboring qPSVN2.3 for PSVN, qPRN2.3 for PRN, and qSSVN2.3 for SSVN; the region of 4.31–4.83 Mb on chromosome 12 harboring qPRN12.2, qSLVN12.2, and qSSVN12 for PRN, SLVN, and SSVN, respectively. In addition, the remaining eight chromosomal regions were detected for one flow- and one sink-related trait (Figure 4).

3.4. Candidate Gene Analysis for Important QTL

For the 59 QTL affecting flow-related traits and 79 QTL controlling sink-related traits, we performed gene-based association analyses and haplotype analyses to identify candidate genes for the eight important QTL located in the two chromosomal regions consistently affecting multiple flow- and sink-related traits by GWAS. In addition, considering that there significantly differed in the PLVN and STSN between xian and geng subpopulations, we conducted haplotype analysis in xian and geng subpopulations.
A QTL cluster consistently influencing two vascular bundles traits (PLVN and SLVN) and two sink-related traits (PRN and PTSN) was mapped in the region of 4.90–5.71 Mb (809.7 kb) on chromosome 1 based on LD block analysis, containing 100 genes according to the Rice Genome Annotation Project Database (RAP-DB) (Figure 5a). Based on the results of gene-based association analysis using a total of 1721 SNP, four (LOC_Os01g10040, LOC_Os01g10060, LOC_Os01g10080, and LOC_Os01g10110), six (LOC_Os01g10000, LOC_Os01g10030, LOC_Os01g10040, LOC_Os01g10090, LOC_Os01g10100, and LOC_Os01g10110), six (LOC_Os01g10000, LOC_Os01g10010, LOC_Os01g10030, LOC_Os01g10040, LOC_Os01g10110, and LOC_Os01g10410) and three (LOC_Os01g09580, LOC_Os01g10180, and LOC_Os01g10350) genes associated with PLVN, SLVN, PRN, and PTSN, respectively, were further used for haplotype analysis (Figure 5b). Haplotype analysis demonstrated that three (LOC_Os01g10040, LOC_Os01g10060, and LOC_Os01g10110), three (LOC_Os01g10040, LOC_Os01g10090, and LOC_Os01g10110), and four (LOC_Os01g10030, LOC_Os01g10040, LOC_Os01g10110, and LOC_Os01g10410) candidate genes were identified with significances in the mean PLVN, SLVN, and PRN, respectively, among the different haplotypes in the whole population (Table S3). Of these, two candidate genes (LOC_Os01g10040 and LOC_Os01g10110) showed significant differences for three traits (PLVN, SLVN, PRN) among haplotypes in the whole population (Figure 6; Table S3). No significant differences in SSVN were found among haplotypes in the whole population and two subpopulations. For the other three traits, two (LOC_Os01g10040 and LOC_Os01g10110), three (LOC_Os01g10040, LOC_Os01g10090, and LOC_Os01g10110), and two (LOC_Os01g10030 and LOC_Os01g10040) candidate genes were detected with significances in PLVN, SLVN, and PRN, respectively, among the different haplotypes in the xian and/or geng subpopulations (Table S3). Among them, highly significant differences in the three traits were detected among different haplotypes of LOC_Os01g10040 in the xian subpopulation. In addition, LOC_Os01g10110 exhibited significant differences for PLVN and SLVN among different haplotypes in the geng subpopulation (Figure 6; Table S3). LOC_Os01g10040 (D2) encoded a cytochrome P450 (CYP90D2) involved in the brassinosteroid biosynthetic pathway [33]. LOC_Os01g10110, which is identical to Gn1a, is a gene for cytokinin oxidase/dehydrogenase (OsCKX2) [15]. The results indicated that LOC_Os01g10040 and LOC_Os01g10110 might be candidate genes affecting both flow- and sink-related traits.
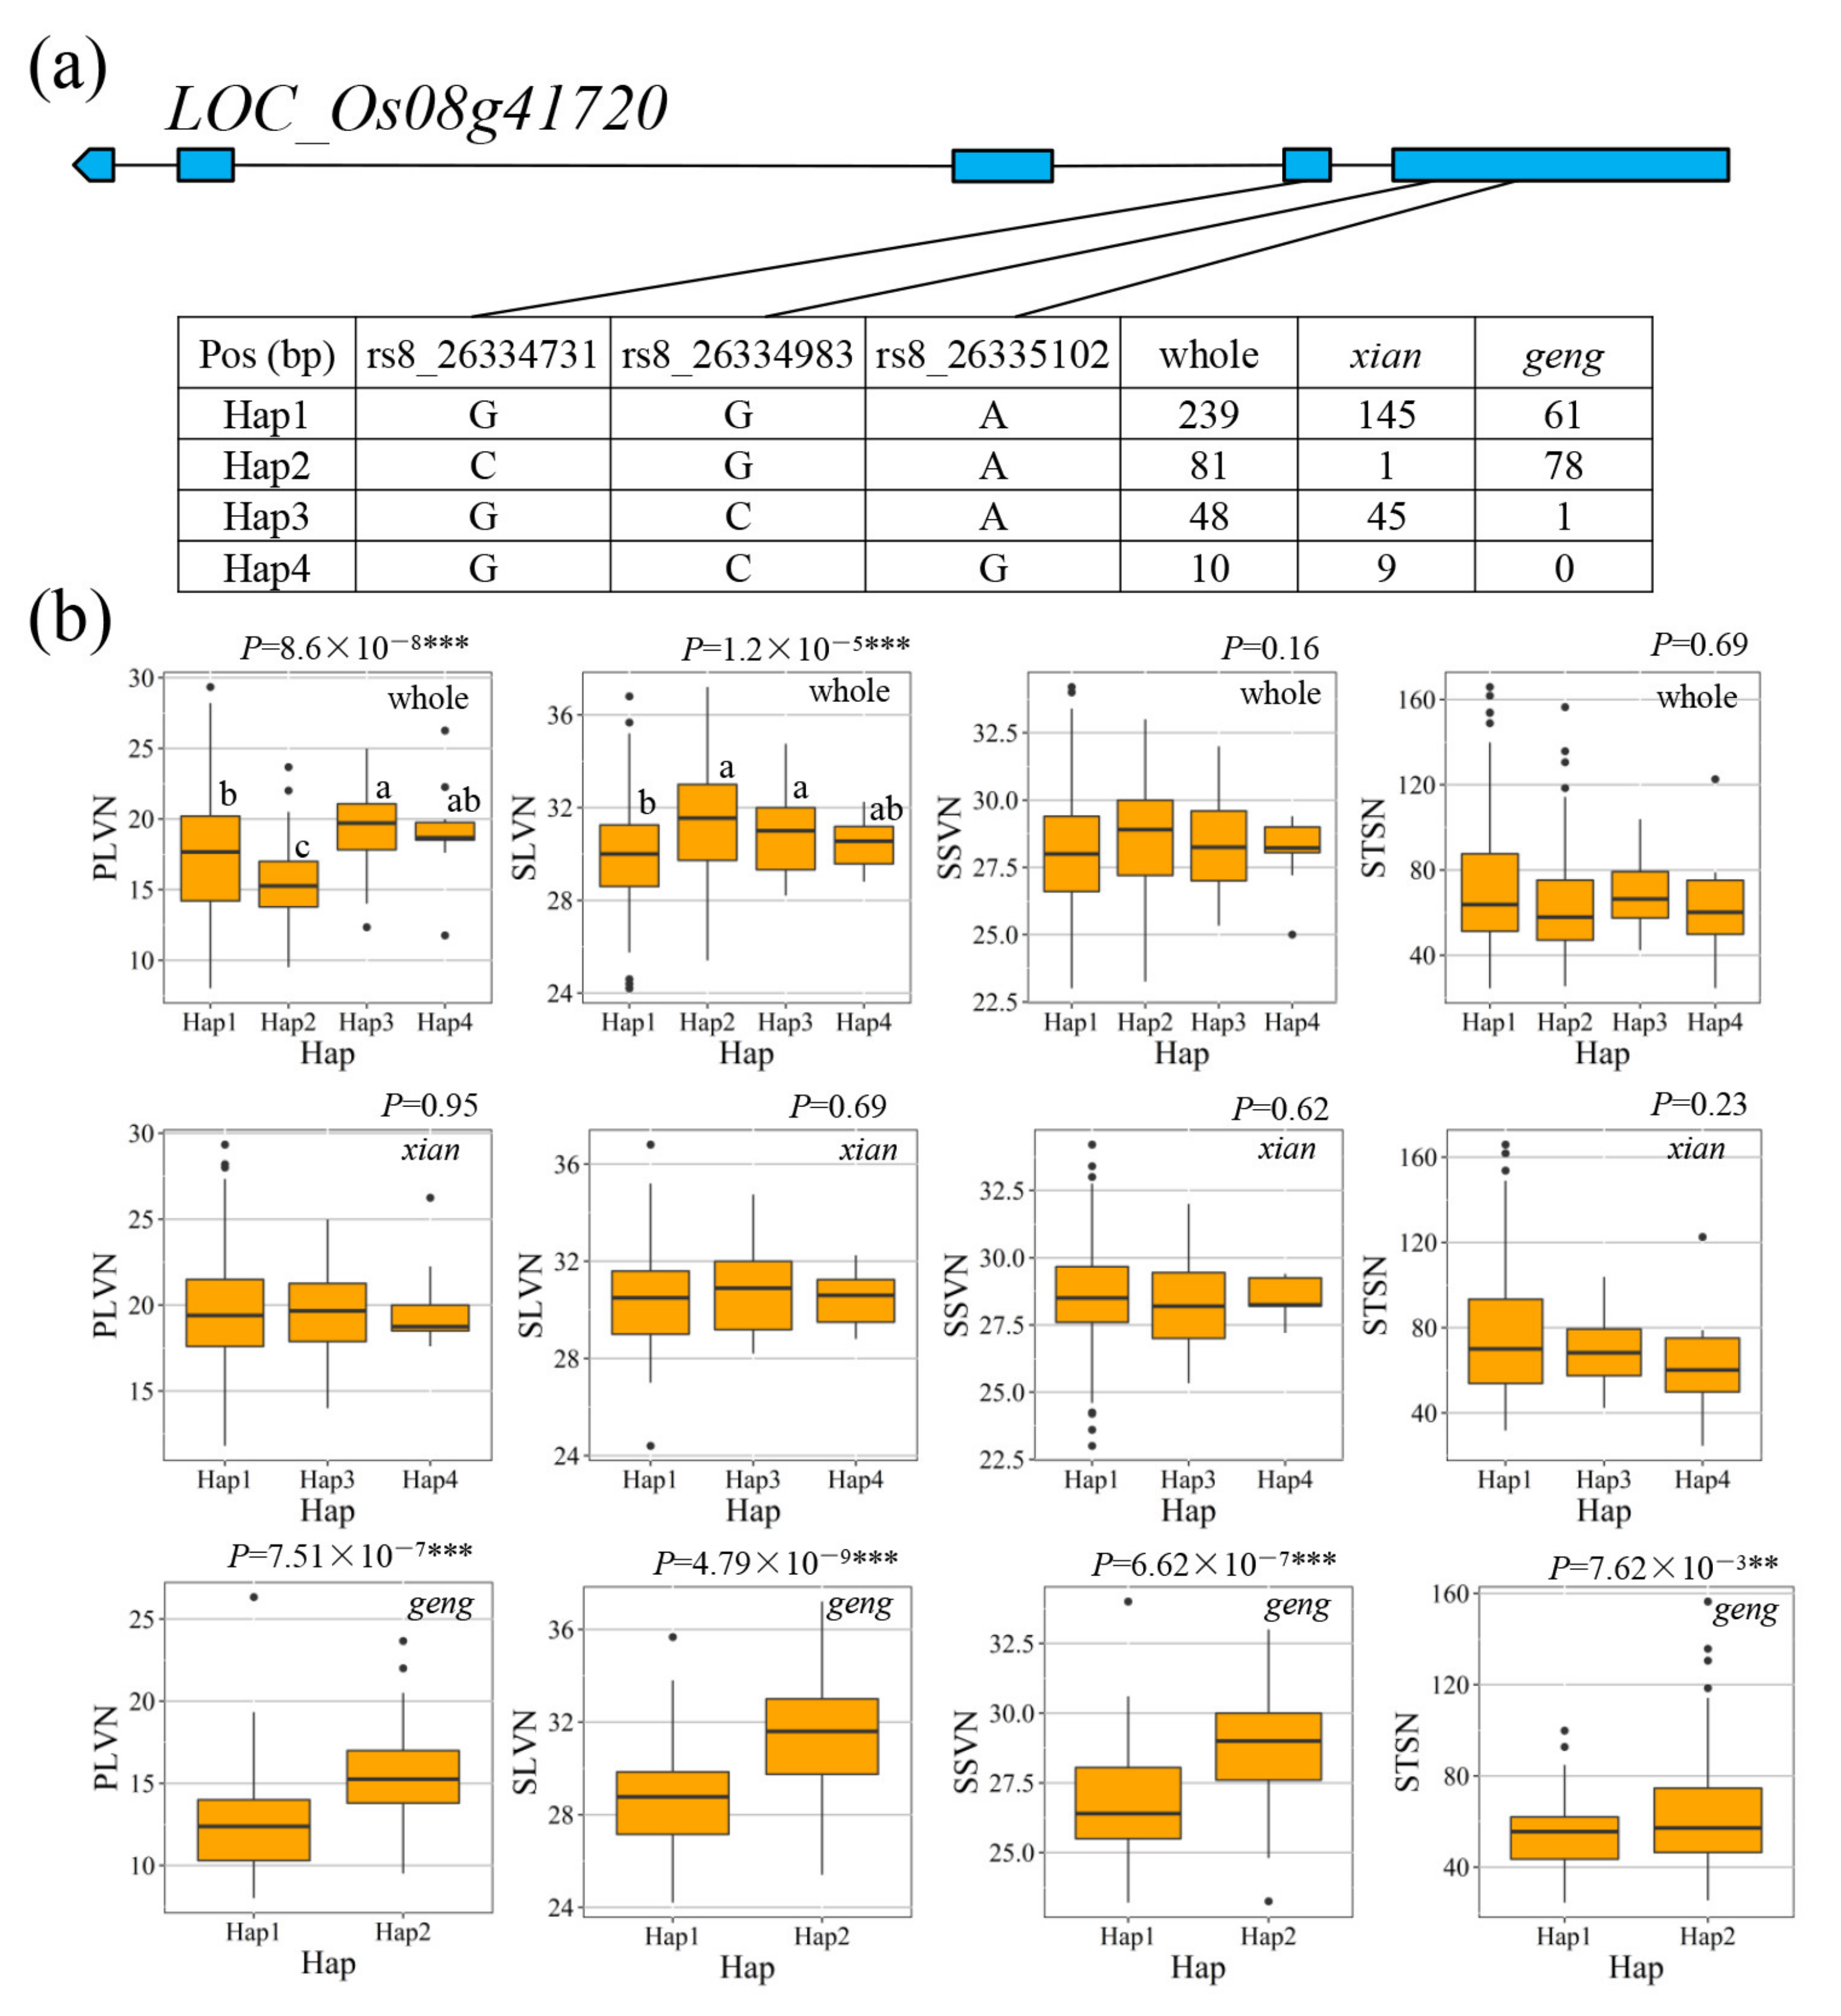
The other QTL cluster (qPLVN8, qSSVN8, qSLVN8, and qSTSN8.2) was identified in the region of 25.88–26.61 Mb (727.3 kb) on chromosome 8 harboring 115 annotated genes (Figure 7a). Based on the results of gene-based association analysis, two (LOC_Os08g41560 and LOC_Os08g41720), three (LOC_Os08g41710, LOC_Os08g41720, and LOC_Os08g41730), two (LOC_Os08g41720 and LOC_Os08g41690), and two (LOC_Os08g41720 and LOC_Os08g41740) genes associated with PLVN, SLVN, SSVN, and STSN, respectively, were conducted for haplotype analysis (Figure 7b). Of these, two (LOC_Os08g41560 and LOC_Os08g41720), two (LOC_Os08g41720 and LOC_Os08g41730), one (LOC_Os08g41720), and one (LOC_Os08g41720) candidate genes showed significant differences in PLVN, SLVN, SSVN, and STSN, respectively, among haplotypes in the xian and/or geng subpopulations (Table S4). Among them, the LOC_Os08g41720 candidate gene exhibited significant differences for the four traits (PLVN, SLVN, SSVN, and STSN) in the geng subpopulation (Figure 8; Table S4). LOC_Os08g41720 was identical to OsPIN5b, which was reported as an auxin efflux carrier-like gene, participating in auxin homeostasis, transport, and distribution in vivo [34]. Haplotype analysis demonstrated that Hap2 (CGA) exhibited significantly higher PLVN, SLVN, SSVN, and STSN than Hap1 (GGA) in the geng subpopulation (Figure 8). The results suggested that LOC_Os08g41720 might be the candidate gene affecting both flow- and sink-related traits.

4. Discussion

4.1. Characteristics of Vascular Bundle between Xian and Geng Groups

The two subpopulations of Asian cultivated rice (Oryza sativa L.), namely, Oryza sativa ssp. xian and O. sativa ssp. geng, exhibit obvious differences between them in many morphological and physiological traits. Among them, the differentiations in PLVN and the V/R ratio are two important parameters determining the differentiation between the two subspecies. Our studies have demonstrated that xian cultivars exhibit significantly more PLVN compared to geng cultivars (Figure 1a), which is in agreement with previous studies [9,10]. Chen et al., (2007) revealed that the V/R ratio was nearly 1.0 in geng but approximately 2.0 in xian [35]. In Japanese geng rice varieties, each large vascular bundle is directly connected to a primary rachis branch, giving rise to almost the same PLVN and PRN. However, due to the abundance of large vascular bundles in xian cultivars, some are directly connected to the secondary rachis branches [19,36]. In the present study, the V/R ratio of xian varieties (average 1.96) was also significantly higher than that of geng varieties (average 1.36), but the average V/R ratio of geng rice reached 1.36 (Figure 1a). Further analysis showed that a large variation in the V/R ratio was observed in four geng types (subtropical geng, admixed geng, tropical geng, temperate geng) in the study (Table S5). The V/R ratio of temperate geng (with a mean of 1.18) was basically consistent with previous studies [35,37]. However, the V/R ratio of the other three geng types (with a mean of 1.56 in admixed geng, 1.74 in subtropical geng, and 1.34 in tropical geng) was obviously higher than that of temperate geng in the study. In the admixed geng type, the maximum V/R ratio was 2.7, which was far lagar than the average V/R ratio for xian cultivars (Table S5). These results indicated that the V/R ratio could be optimized to obtain high yield vari-eties through inter-subspecies hybridization and selection. Additionally, the vascular bundle characteristics of different subspecies determined the different breeding strategies of xian and geng. The production of high-yielding xian rice cultivars is usually achieved by raising the number of primary rachis branches and spikelets, while the cultivation of high-yielding geng rice cultivars requires an increase in the panicle number per unit area.

4.2. Comparisons of QTL Detected in this Study with Previously Reported Cloned Genes

Among the 138 QTL associated with 8 flow- and sink-related traits, 10 QTL covered or were adjacent to previously reported cloned genes in rice (Table S2). For example, the previously reported gene FON4 for total spikelet number per panicle was contained in qPTSN11.3 for PTSN, which was mapped in the region of 22.55–23.05 Mb on chromosome 11 [11]; qPTSN7 and qPTSN4.2 affecting PTSN, located in the regions of 9.12–9.62 Mb on chromosome 7 and 29.94–30.44 Mb on chromosome 4, were co-located with Ghd7 [12] and OsPTR6 [13] for total spikelet number per panicle, respectively; qSRN4.3 influencing SRN in the region 30.68–31.72 Mb and qPRN4.4 influencing PRN in the region 31.22–31.72 Mb on chromosome 4 were co-located with NAL1, a gene influencing the arrangement pattern of vascular bundles by regulating polar auxin transport [38]; qSTSN8.1 in the region of 1.44–1.94 Mb on chromosome 8 was co-located with the previously reported OSHT gene regulating the total spikelet number per panicle in rice [14]; qPRN8.3 in the regions 25.06–25.56 Mb on chromosome 8 was co-located with IPA1, which controls grain yield by promoting panicle branching [16,17]; qPRN6.3 in the region 24.47–24.99 Mb on chromosome 6 was close to GNP6, which affects panicle length, primary branch stem, secondary branch stem, and grain number per panicle [38]. qPTSN1.2 in the region 5.01–5.78 Mb and qPRN1.2 in the region 5.16–5.66 Mb on chromosome 1 were co-located with Gn1a, which regulates rice grain production by increasing spikelet number per panicle [15], and D2, which controls grain yield by affecting grain number per panicle and thousand seed weight [33]. Allelic correspondences of the above genes influencing the flow- and sink-size-related traits identified in this study with previously reported genes will need to be further verified by fine mapping and QTL cloning.

4.3. Candidate Gene Identification for Important QTL

Gene-based association analysis and haplotype analysis of candidate genes showed 16 candidate genes governing the 8 QTL in 2 chromosomal regions simultaneously affecting multiple flow- and sink-related traits. Based on the functional annotation of candidate genes, we speculated on the most likely candidate genes of LOC_Os01g10040, LOC_Os01g10110, and LOC_Os08g41720.
A QTL cluster (qPLVN1.1, qSLVN1.1, qPRN1.2, and qPTSN1.2) was identified in the region of 4.90–5.71 Mb on chromosome 1, containing six candidate genes. Among them, LOC_Os01g10040 and LOC_Os01g10110 were selected as the most likely candidate genes for qPLVN1.1, qSLVN1.1, and qPRN1.2 based on the results of gene-based association analysis and haplotype analysis (Figure 6; Table S3). LOC_Os01g10040 (D2) encoded a cytochrome P450 (CYP90D2) involved in the brassinosteroid biosynthetic pathway [39], while Gn1a (LOC_Os01g10110) is a cytokinin oxidase/dehydrogenase (OsCKX2) gene encoding an enzyme that can degrade the phytohormone cytokinin [15]. Compared with wild-type, overexpression of D2/SMG11 increased grain size and weight and significantly increased rice yield at appropriate levels [33]. A large number of studies have shown that brassinosteroids (BRs) have an impact on the vascular development of vegetative organs. In addition, some BR mutants in rice [40] and Arabidopsis [41] show various vascular differentiation defects. In the present study, four haplotypes of LOC_Os1g10040 were detected in the whole population, with Hap 4 being associated with significantly larger PLVN, SLVN, and PRN values than the other three haplotypes (Figure 6b). In addition, Hap 4 had significantly larger PLVN, SLVN, and PRN values than Hap1 in the xian subpopulation, indicating that LOC_Os1g10040 is a likely candidate gene of qPLVN1.1, qSLVN1.1, and qPRN1.2, which probably consistently affects PLVN, SLVN, and PRN in rice. For LOC_Os01g10110, the decreased expression of the gene results in the accumulation of cytokinins in the inflorescence meristem, which increases the number of reproductive organs, grain number per panicle, and, finally, the grain yield of rice. Gn1a regulates cytokinin levels in the vascular system of auxetic culms [15]. In this study, three haplotypes of LOC_Os01g10110 were observed, whose Hap 2 showed significantly higher PLVN and SLVN values than those of Hap 3 in the geng subpopulation (Figure 6d). However, no significant difference in the PRN was detected among different haplotypes in the geng subpopulation, and only one prevalent haplotype (contained in more than 10 accessions) was observed in the xian subpopulation, even though there existed significant differences for PRN between different haplotypes in the whole population. This result suggested that xian/geng differentiation might result in significant phenotypic differences in PRN among different haplotypes. Up to now, D2 and Gn1a have not been reported to be associated with PLVN, SLVN, and PRN. Reverse genetic approaches might be used to test whether D2 or Gn1a is the candidate gene of qPLVN1.1, qSLVN1.1, and qPRN1.2.
The region 25.88–26.61 Mb (727.3 kb) on chromosome 8, harboring qPLVN8 for PLVN, qSLVN8 for SLVN, qSSVN8 for SSVN, and qSTSN8.2 for STSN, contains five candidate genes (LOC_Os08g41560, LOC_Os08g41690, LOC_Os08g41720, LOC_Os08g41730, and LOC_Os08g41740) according to gene-based association analysis and haplotype analysis (Table S4). Among them, an auxin efflux carrier-like gene, OsPIN5b (LOC_Os08g41720), participates in auxin homeostasis, transport, and distribution in vivo, thus regulating rice plant type and yield [34]. Reduced expression of OsPIN5b resulted in higher tiller numbers, a more vigorous root system, longer panicles, and increased yield [34]. Many studies have proved that polar auxin transport is necessary for the formation of continuous vascular patterns and the establishment of procambium bundles [42]. It has previously been reported that the ABNORMAL VASCULAR BUNDLES (AVB) gene is involved in procambium establishment following auxin signaling in lateral primordia [43]. The NAL1 gene influencing the vascular patterns of rice plants plays a role in leaf morphogenesis by regulating polar auxin transport [38]. OsPIN5b affects auxin levels, auxin transport, and auxin-related gene expression. In the present study, haplotype analysis of LOC_Os08g41720 revealed that haplotype 2 (CGA) was associated with significantly larger PLVN, SLVN, and SSVN and more STSN than haplotypes 1 (GGA) in the geng subpopulation (Figure 8). Therefore, OsPIN5b (LOC_Os08g41720) is considered a possible candidate gene of qPLVN8, qSLVN8, qSSVN8, and qSTSN8.2, which simultaneously affect vascular bundle and grain number traits. Transgenic experiments are underway to verify the functionalities of the candidate genes.

4.4. Application in Rice Breeding for High Yield Potential

The grain yield of rice is determined by the size and coordination of source, sink, and flow. At present, super-high-yielding rice varieties often exhibit large sink and sufficient source, which increases the burden of the “flow” between source and sink—the transport tissue. Therefore, it is necessary to strengthen the selection of vascular bundle traits in hybrid rice and conventional rice. The high positive correlations of vascular bundle characteristics (e.g., number of large and small vascular bundles in panicle neck and second node) and sink-related traits (e.g., the number of primary branches and secondary branches and the spikelet number of primary branches and secondary branches) were in agreement with previous studies [1,4]. In addition, we observed that compared with geng cultivars, the increase of PLVN of xian cultivars did not lead to an increase in the number of primary branches. Instead, it led to an increase in the number of secondary branches, which ultimately led to an increase in the spikelet number on secondary branches (Figure 1c). This might be explained by the fact that the increase in the PLVN is not accompanied by an increase in the number of primary branches, leading to an increase in the PLVN directly connected to secondary branches. In hybrid rice, the spikelet number per panicle increases but the number of large vascular bundles decreases compared with the xian parent, resulting in an increased spikelet load of vascular bundle per unit area, which might influence the grain filling of hybrid rice. As the spikelets on primary branches show superior seed setting rate and grain weight compared with those on secondary branches, it might be the goal for breeders and scientists to increase the yield of xiangeng cross hybrid rice by simultaneously increasing the number of large vascular bundles and the number of primary branches.
In this study, LOC_Os01g10040 (D2) is considered the most likely candidate gene of qPLVN1.1 and qPRN1.2. Haplotype analysis revealed that haplotype 4 was associated with significantly more PLVN and PRN than haplotype 1 in xian accessions (Figure 6). Two xian accessions with haplotype 4, IRIS_313-9706 (with mean PLVN 29.33; mean PRN 14) and B108 (with mean PLVN 24.25; mean PRN 12.67), exhibiting more PLVN and PRN, were identified in this panel (Table S1). Haplotype 4 of LOC_Os01g10040 from the two xian accessions showed a larger additive effect for increased PLVN and PRN in xian accessions (Figure 6). Thus, the elite haplotypes from IRIS_313-9706 and B108 could be introgressed by MAS into geng and other xian varieties to develop super high-yielding rice cultivars with both larger vascular bundles and more primary rachis branches.

Supplementary Materials

The following supporting information can be downloaded at: https://www.mdpi.com/article/10.3390/agronomy12040776/s1, Table S1: List of the 440 accessions including country of origin, subpopulation, PC score, and phenotypic value of measured traits; Table S2: QTL identified for flow- and sink-related traits by GWAS; Table S3: Comparison of the flow- and sink-related traits among the haplotypes of 13 candidate genes in the region of 4.90–5.71 Mb on chromosome 1 in whole, xian, and geng populations; Table S4: Comparison of the flow- and sink-related traits among the haplotypes of six candidate genes in the region of 25.88–26.61 Mb on chromosome 8 in whole, xian, and geng populations; Table S5: Distribution of V/R in different subpopulations.

Author Contributions

Conceptualization, W.Z. and J.X.; methodology, L.Z.; software, L.Z.; validation, J.X. and W.Z.; formal analysis, L.Z.; investigation, L.Z., L.C. and K.S.; resources, W.Z. and J.X.; data curation, L.Z and A.Y.; writing—original draft preparation, L.Z. and Y.W.; writing—review and editing, L.Z. and Y.W.; visualization, L.Z.; supervision, Y.W.; project administration, Y.W.; funding acquisition, J.X., W.Z. and Y.W. All authors have read and agreed to the published version of the manuscript.

Funding

This work was funded by the National Natural Science Foundation of China (32072035) and the Key Research and Development Program of Hainan Province (ZDYF2021XDNY128).

Data Availability Statement

The data used to support the findings of this study are available from the corresponding author upon request.

Conflicts of Interest

The authors declare no conflict of interest. The funder had no role in the de-sign of the study; in the collection, analyses, or interpretation of data; in the writing of the manu-script, or in the decision to publish the results.

References

  1. Ashraf, M.; Akbar, M.; Salim, M. Genetic improvement in physiological traits of rice yield. In Genetic Improvement of Field Crops; Slafer, G.A., Ed.; Marcel Dekker Incorporates: New York, NY, USA, 1994; pp. 413–455. [Google Scholar]
  2. Evans, L.T.; Dunstone, R.L.; Rawson, H.M.; Williams, R.F. The Phloem of the Wheat Stem in Relation to Requirements for Assimilate by The Ear. Aust. J. Biol. Sci. 1970, 23, 743–752. [Google Scholar] [CrossRef]
  3. Peterson, D.M.; Housley, T.L.; Luk, T.M. Oat stem vascular size in relation to kernel number and weight. II. Field Environment. Crop Sci. 1982, 22, 274–278. [Google Scholar] [CrossRef]
  4. Xu, Z.J.; Chen, W.F.; Chao, H.R. Relation between the characters of panicle and vascular bundle in neck-panicle if rice. Acta Agron. Sin. 1998, 24, 43–54. [Google Scholar]
  5. Fukuyama, T.; Takayama, T. Variations of the vascular bundle system in Asian rice cultivars. Euphytica 1995, 86, 227–231. [Google Scholar] [CrossRef]
  6. Zhang, Z.H.; Li, P.; Wang, L.X.; Tan, C.J.; Hu, Z.L.; Zhu, Y.G.; Zhu, L.H. Identification of quantitative trait loci (QTLs) for the characters of vascular bundles in peduncle related to indica-japonica differentiation in rice (Oryza sativa L.). Euphytica 2002, 128, 279–284. [Google Scholar] [CrossRef]
  7. Cui, K.; Peng, S.; Xing, Y.; Yu, S.; Xu, C.; Zhang, Q. Molecular dissection of the genetic relationships of source, sink and transport tissue with yield traits in rice. Theor. Appl. Genet. 2003, 106, 649–658. [Google Scholar] [CrossRef]
  8. Bai, X.F.; Wu, B.; Xing, Y.Z. Yield-related QTLs and their applications in rice genetic improvement. J. Integr. Plant Biol. 2012, 54, 300–311. [Google Scholar] [CrossRef]
  9. Zhai, L.; Zheng, T.; Wang, X.; Wang, Y.; Chen, K.; Wang, S.; Wang, Y.; Xu, J.; Li, Z. QTL mapping and candidate gene analysis of peduncle vascular bundle related traits in rice by genome-wide association study. Rice 2018, 11, 13. [Google Scholar] [CrossRef] [Green Version]
  10. Fei, C.; Geng, X.; Xu, Z.J.; Xu, Q. Multiple areas investigation reveals the genes related to vascular bundles in rice. Rice 2019, 12, 17. [Google Scholar] [CrossRef]
  11. Ren, D.; Xu, Q.; Qiu, Z.; Cui, Y.; Zhou, T.; Zeng, D.; Guo, L.; Qian, Q. FON4 prevents the multi-floret spikelet in rice. Plant Biotechnol. J. 2019, 17, 1007–1009. [Google Scholar] [CrossRef] [Green Version]
  12. Xue, W.; Xing, Y.; Weng, X.; Zhao, Y.; Tang, W.; Wang, L.; Zhou, H.; Yu, S.; Xu, C.; Li, X.; et al. Natural variation in Ghd7 is an important regulator of heading date and yield potential in rice. Nat. Genet. 2008, 40, 761–767. [Google Scholar] [CrossRef] [PubMed]
  13. Fang, N.; Xu, R.; Huang, L.; Zhang, B.; Duan, P.; Li, N.; Luo, Y.; Li, Y. SMALL GRAIN 11 Controls Grain Size, Grain Number and Grain Yield in Rice. Rice 2016, 9, 64. [Google Scholar] [CrossRef] [PubMed] [Green Version]
  14. Guo, N.; Gu, M.; Hu, J.; Qu, H.; Xu, G. Rice OsLHT1 Functions in Leaf-to-Panicle Nitrogen Allocation for Grain Yield and Quality. Front. Plant Sci. 2020, 11, 1150. [Google Scholar] [CrossRef] [PubMed]
  15. Ashikari, M.; Sakakibara, H.; Lin, S.; Yamamoto, T.; Takashi, T.; Nishimura, A.; Angeles, E.R.; Qian, Q.; Kitano, H.; Matsuoka, M. Cytokinin oxidase regulates rice grain production. Science 2005, 309, 741–745. [Google Scholar] [CrossRef] [PubMed]
  16. Jiao, Y.; Wang, Y.; Xue, D.; Wang, J.; Yan, M.; Liu, G.; Dong, G.; Zeng, D.; Lu, Z.; Zhu, X.; et al. Regulation of OsSPL14 by OsmiR156 defines ideal plant architecture in rice. Nat. Genet. 2010, 42, 541–544. [Google Scholar] [CrossRef] [PubMed]
  17. Miura, K.; Ikeda, M.; Matsubara, A.; Song, X.J.; Ito, M.; Asano, K.; Matsuoka, M.; Kitano, H.; Ashikari, M. OsSPL14 promotes panicle branching and higher grain productivity in rice. Nat. Genet. 2010, 42, 545–549. [Google Scholar] [CrossRef]
  18. Zhang, Z.Y.; Sun, X.M.; Ma, X.Q.; Xu, B.X.; Zhao, X.; Ma, Z.Q.; Li, G.L.; Khan, N.U.; Pan, Y.H.; Liang, Y.T.; et al. GNP6, a novel allele of MOC1, regulates panicle and tiller development in rice. Crop J. 2021, 9, 57–67. [Google Scholar] [CrossRef]
  19. Terao, T.; Nagata, K.; Morino, K.; Hirose, T. A gene controlling the number of primary rachis branches also controls the vascular bundle formation and hence is responsible to increase the harvest index and grain yield in rice. Theor. Appl. Genet. 2010, 120, 875–893. [Google Scholar] [CrossRef]
  20. Fu, X.; Huang, X.; Qian, Q.; Liu, Z.; Sun, H.; He, S.; Luo, D.; Xia, G.; Chu, C.; Li, J. Natural variation at the DEP1 locus enhances grain yield in rice. Nat. Genet. 2009, 41, 494–497. [Google Scholar] [CrossRef]
  21. Wang, W.; Mauleon, R.; Hu, Z.; Chebotarov, D.; Tai, S.; Wu, Z.; Li, M.; Zheng, T.; Fuentes, R.R.; Zhang, F.; et al. Genomic variation in 3010 diverse accessions of Asian cultivated rice. Nature 2018, 557, 43–49. [Google Scholar] [CrossRef]
  22. Purcell, S.; Neale, B.; Todd-Brown, K.; Thomas, L.; Ferreira, M.A.; Bender, D.; Maller, J.; Sklar, P.; de Bakker, P.I.; Daly, M.J.; et al. PLINK: A tool set for whole-genome association and population-based linkage analyses. Am. J. Hum. Genet. 2007, 81, 559–575. [Google Scholar] [CrossRef] [PubMed] [Green Version]
  23. Tabangin, M.E.; Woo, J.G.; Martin, L.J. The effect of minor allele frequency on the likelihood of obtaining false positives. BMC Proc. 2009, 3 (Suppl. S7), S41. [Google Scholar] [CrossRef] [Green Version]
  24. Kang, H.M.; Sul, J.H.; Service, S.K.; Zaitlen, N.A.; Kong, S.; Freimer, N.B.; Sabatti, C.; Eskin, E. Variance component model to account for sample structure in genome-wide association studies. Nat. Genet. 2010, 42, 348–354. [Google Scholar] [CrossRef] [PubMed] [Green Version]
  25. Li, M.X.; Yeung, J.M.Y.; Cherny, S.S.; Sham, P.C. Evaluating the effective numbers of independent tests and significant p-value thresholds in commercial genotyping arrays and public imputation reference datasets. Hum. Genet. 2011, 131, 747–756. [Google Scholar] [CrossRef] [Green Version]
  26. Bradbury, P.J.; Zhang, Z.; Kroon, D.E.; Casstevens, T.M.; Ramdoss, Y.; Buckler, E.S. TASSEL: Software for association mapping of complex traits in diverse samples. Bioinformatics 2007, 23, 2633–2635. [Google Scholar] [CrossRef] [PubMed]
  27. Shin, J.H.; Blay, S.; Mcneney, B.; Graham, J. LDheatmap: An R function for graphical display of pairwise linkage disequilibria between single nucleotide polymorphisms. J. Stat. Softw. 2006, 16, 1–9. [Google Scholar] [CrossRef] [Green Version]
  28. Yano, K.; Yamamoto, E.; Aya, K.; Takeuchi, H.; Lo, P.C.; Hu, L.; Yamasaki, M.; Yoshida, S.; Kitano, H.; Hirano, K.; et al. Genome-wide association study using whole-genome sequencing rapidly identifies new genes influencing agronomic traits in rice. Nat. Genet. 2016, 48, 927–934. [Google Scholar] [CrossRef]
  29. Sakai, H.; Lee, S.S.; Tanaka, T.; Numa, H.; Kim, J.; Kawahara, Y.; Wakimoto, H.; Yang, C.C.; Iwamoto, M.; Abe, T.; et al. Rice Annotation Project Database (RAP-DB): An integrative and interactive database for rice genomics. Plant Cell Physiol. 2013, 54, e6. [Google Scholar] [CrossRef]
  30. Alexandrov, N.; Tai, S.; Wang, W.; Mansueto, L.; Palis, K.; Fuentes, R.R.; Ulat, V.J.; Chebotarov, D.; Zhang, G.; Li, Z.; et al. SNP-Seek database of SNPs derived from 3000 rice genomes. Nucleic. Acids Res. 2015, 43, D1023–D1027. [Google Scholar] [CrossRef]
  31. Wang, X.Q.; Pang, Y.L.; Wang, C.C.; Chen, K.; Zhu, Y.J.; Shen, C.; Ali, J.; Xu, J.L.; Li, Z.K. New candidate genes affecting rice grain appearance and milling quality detected by genome-wide and gene-based association analyses. Front. Plant Sci. 2017, 7, 1998. [Google Scholar] [CrossRef] [Green Version]
  32. Zhang, J.; Chen, K.; Pang, Y.L.; Naveed, S.A.; Zhao, X.Q.; Wang, X.Q.; Wang, Y.; Dingkuhn, M.; Pasuquin, J.; Li, Z.K.; et al. QTL mapping and candidate gene analysis of ferrous iron and zinc toxicity tolerance at seedling stage in rice by genomewide association study. BMC Genom. 2017, 18, 828. [Google Scholar] [CrossRef] [PubMed]
  33. Fang, Z.; Bai, G.; Huang, W.; Wang, Z.; Wang, X.; Zhang, M. The Rice Peptide Transporter OsNPF7.3 Is Induced by Organic Nitrogen, and Contributes to Nitrogen Allocation and Grain Yield. Front. Plant Sci. 2017, 8, 1338. [Google Scholar] [CrossRef] [PubMed] [Green Version]
  34. Lu, G.; Coneva, V.; Casaretto, J.A.; Ying, S.; Mahmood, K.; Liu, F.; Nambara, E.; Bi, Y.M.; Rothstein, S.J. OsPIN5b modulates rice (Oryza sativa) plant architecture and yield by changing auxin homeostasis, transport and distribution. Plant J. 2015, 83, 913–925. [Google Scholar] [CrossRef] [PubMed]
  35. Chen, S.Q.; Xu, Z.J.; Chen, W.F.; Xu, H.; Liu, H.G.; Zhu, C.J.; Wang, Y.; Wang, J.Y. The relation between the characters of vascular bundle and panicle in the filial generation from Indica and japonica Rice. Acta Agr Boreali-Sin. 2007, 5, 8–14. [Google Scholar]
  36. Fukushima, A.; Akita, S. Varietal differences of the course and differentiation time of large vascular bundles in the rachis of rice. Jpn. J. Crop Sci. 1997, 66, 24–28. [Google Scholar] [CrossRef] [Green Version]
  37. Liu, T.S.; Bi, W.J.; Zhang, J.; Cui, Y.; Yan, Z.Q.; Wang, Y.Z.; Fei, C.; Xu, H.; Tang, L.; Chen, W.F.; et al. Characterization of the relationship between vascular bundles features and indica-allelic frequency using a seventh filial generations of indica × japonica rice crosses. Euphytica 2016, 209, 739–748. [Google Scholar] [CrossRef]
  38. Qi, J.; Qian, Q.; Bu, Q.; Li, S.; Chen, Q.; Sun, J.; Liang, W.; Zhou, Y.; Chu, C.; Li, X.; et al. Mutation of the rice narrow leaf1 gene, which encodes a novel protein, affects vein patterning and polar auxin transport. Plant Physiol. 2008, 147, 1947–1959. [Google Scholar] [CrossRef] [Green Version]
  39. Hong, Z.; Ueguchi-Tanaka, M.; Umemura, K.; Uozu, S.; Fujioka, S.; Takatsuto, S.; Yoshida, S.; Ashikari, M.; Kitano, H.; Matsuoka, M. A rice brassinosteroid-deficient mutant, ebisu dwarf (d2), is caused by a loss of function of a new member of cytochrome P450. Plant Cell 2003, 15, 2900–2910. [Google Scholar] [CrossRef] [Green Version]
  40. Nakamura, A. The role of OsBRI1 and its homologous genes, OsBRL1 and OsBRL3, in rice. Plant Physiol. 2006, 140, 580–590. [Google Scholar] [CrossRef] [Green Version]
  41. Caño-Delgado, A.; Yin, Y.H.; Yu, C.; Vafeados, D.; Mora-García, S.; Cheng, J.C.; Nam, K.H.; Li, J.M.; Chory, J. BRL1 and BRL3 are novel brassinosteroid receptors that function in vascular differentiation in Arabidopsis. Development 2004, 131, 5341–5351. [Google Scholar] [CrossRef] [Green Version]
  42. Berleth, T.; Scarpella, E.; Prusinkiewicz, P. Towards the systems biology of auxin-transport-mediated patterning. Trends Plant Sci. 2007, 12, 151–159. [Google Scholar] [CrossRef] [PubMed]
  43. Ma, L.; Sang, X.; Zhang, T.; Yu, Z.; Li, Y.; Zhao, F.; Wang, Z.; Wang, Y.; Yu, P.; Wang, N.; et al. ABNORMAL VASCULAR BUNDLES regulates cell proliferation and procambium cell establishment during aerial organ development in rice. New Phytol. 2017, 213, 275–286. [Google Scholar] [CrossRef] [PubMed] [Green Version]
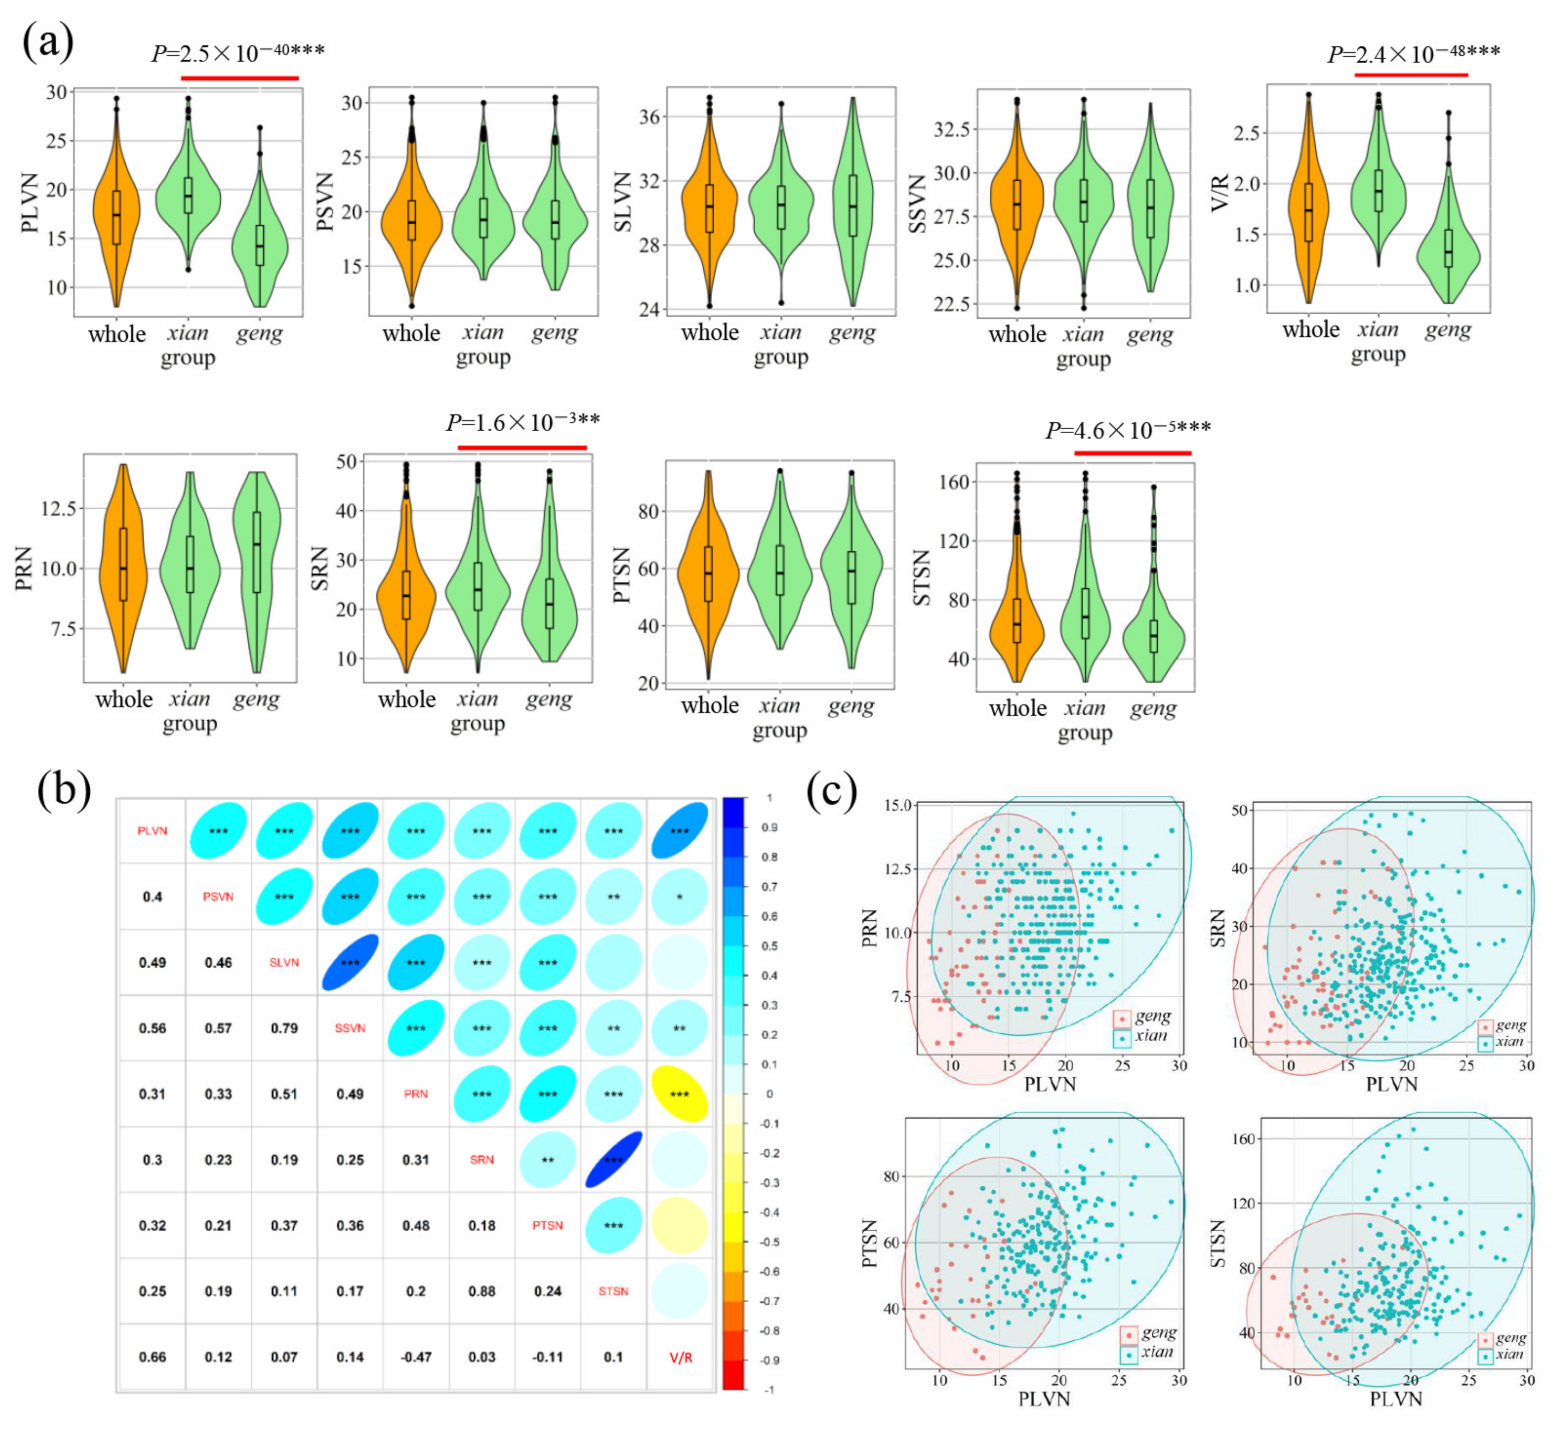
Figure 1. Values and correlations of flow- and sink-related traits. (a) Box plots of the nine flow- and sink-related traits in whole, xian, and geng population panels. Orange and light green colors indicate whole population and subpopulations (xian and geng), respectively. ** and *** denote the significance of Student’s t-test at p < 0.01 and p < 0.001, between xian and geng, respectively. (b) Correlations between the nine tested traits. The values are correlation coefficients. The areas and colors of ellipses correspond to absolute values of the corresponding r. Right and left oblique ellipses indicate positive and negative correlations, respectively. Values without glyphs were insignificant at the 0.05 probability level. *, **, and *** represent significant correlations at p < 0.05, p < 0.01, and p < 0.001, respectively. (c) Relationship between PLVN and four sink-related traits in xian and geng subpopulations. PLVN: number of large vascular bundles in panicle neck; PSVN: number of small vascular bundles in panicle neck; SLVN: number of large vascular bundle in second internode; SSVN: number of small vascular bundle in second internode; PRN: number of primary rachis branches; SRN: number of secondary rachis branches; PTSN: total spikelets number on primary rachis branches; STSN: total spikelets number on secondary rachis branches; V/R: number of large vascular bundles in panicle neck to number of primary rachis branches.
Agronomy 12 00776 g001
Figure 2. Genotypic analysis. (a) PCA plot based on the screen plot in the rice diversity panel. (b) Heat map of kinship with the tree shown on the top and left. (c) LD decay based on genotypic data in this study. The red line shows half of the maximum LD value.
Agronomy 12 00776 g002
Figure 3. Manhattan plots of genome-wide association for flow- and sink-related traits in the 440 panel. Orange dashed line in Manhattan plots represents the significant thresholds (–log10P = 6.95). Highlighted SNPs in light green are significantly associated with the measured traits.
Agronomy 12 00776 g003
Figure 4. Distribution of QTL identified in the 440 panel. Red and blue indicate the QTL affecting flow- and sink-related traits, respectively. Green rectangles represent the QTL regions simultaneously affecting flow- and sink-related traits. Numbers on the chromosome indicate the physical position of each QTL.
Agronomy 12 00776 g004
Figure 5. LD block and gene-based association analysis of the QTL cluster associated with qPLVN1.1, qSLVN1.2, qPRN1.2, and qPTSN1.2 on chromosome 1. (a) Local Manhattan plot (top) and LD block (bottom) surrounding the peak SNP on chromosome 1. Black lines indicate the candidate region for the peak SNP. (b) Gene-based association analysis of targeted genes within the LD block. Dash lines show the threshold to determine significant SNP.
Agronomy 12 00776 g005
Figure 6. Haplotype analysis of the LOC_Os01g10040 and LOC_Os01g10110 candidate genes for PLVN, SLVN, and PRN at qPLVN1.1, qSLVN1.1, and qPRN1.2 (a) Exon-intron structure of LOC_Os01g10040 and DNA polymorphism in that gene. (b) Boxplots for PLVN, SLVN, and PRN based on the haplotypes (Hap) for LOC_Os01g10040 in the whole and xian populations. (c) Exon-intron structure of LOC_Os01g10110 and DNA polymorphism in that gene. (d) Boxplots for PLVN, SLVN, and PRN based on the haplotypes (Hap) for LOC_Os01g10110 in the whole and xian populations. * and *** represent significance of ANOVA at p < 0.05 and p < 0.001, respectively. Letters on the histogram (a, b, and c) are ranked by Duncan’s test at p < 0.05. PLVN: number of large vascular bundles in panicle neck; SLVN: number of large vascular bundles in second internode; PRN: number of primary rachis branches.
Agronomy 12 00776 g006
Figure 7. LD block and gene-based association analysis of the QTL cluster associated with qPLVN8, qSLVN8, qSSVN8, and qSTSN8.2 on chromosome 8. (a) Local Manhattan plot (top) and LD block (bottom) surrounding the peak on chromosome 8. Black lines indicate the candidate region for the peak. (b) Gene-based association analysis of targeted genes within the LD block. Dash lines show the threshold to determine significant SNP.
Agronomy 12 00776 g007
Figure 8. Haplotype analysis of the LOC_Os08g41720 candidate gene for PLVN, SLVN, SSVN, and STSN at qPLVN8, qSLVN8, qSSVN8, and qSTSN8.2. (a) Exon-intron structure of LOC_Os01g41720 and DNA polymorphism in that gene. (b) Boxplots for PLVN, SLVN, SSVN, and STSN based on the haplotypes (Hap) for LOC_Os01g41720 in the whole, xian, and geng populations. ** and *** represent significance of ANOVA at p < 0.01 and p < 0.001, respectively. Letters on the histogram (a and b) are ranked by Duncan’s test at p < 0.05. PLVN: number of large vascular bundles in panicle neck; SLVN: number of large vascular bundles in second internode; SSVN: number of small vascular bundles in second internode; STSN: total spikelets number on secondary rachis branches.
Agronomy 12 00776 g008
Publisher’s Note: MDPI stays neutral with regard to jurisdictional claims in published maps and institutional affiliations.