Article

Green Manure Amendment in Paddies Improves Soil Carbon Sequestration but Cannot Substitute the Critical Role of N Fertilizer in Rice Production

1
Key Laboratory of Agro-Environment in Downstream of Yangze Plain, Ministry of Agriculture and Rural Affairs of China, Jiangsu Academy of Agricultural Sciences, Nanjing 210014, China
2
Co-Innovation Center for Sustainable Forestry in Southern China, College of Forestry, Nanjing Forestry University, Nanjing 210037, China
3
School of Engineering, Newcastle University, Newcastle upon Tyne NE1 7RU, UK
4
Premier Tech Water and Environment, County Durham SR8 2RA, UK
*
Author to whom correspondence should be addressed.
Agronomy 2022, 12(7), 1548; https://doi.org/10.3390/agronomy12071548
Submission received: 2 June 2022 / Revised: 23 June 2022 / Accepted: 26 June 2022 / Published: 28 June 2022
(This article belongs to the Special Issue Advances in Rice Physioecology and Sustainable Cultivation)

Abstract

:
Clarifying the benefits of carbon sequestration and crop production of continuous green manure amendment is crucial for sustainable agricultural development. Here, using a long-term located experiment, we assessed the effects of 18 years’ ryegrass/milk vetch amendment with (NF, 150 kg N ha1) or without nitrogen (N) fertilizer input (CK), on soil carbon management indices, paddy methane (CH4) emissions and rice yields. The results showed that green manure, rather than fertilization, played a critical role in soil CMI, increasing the carbon pool index but reducing the carbon management index. The increased soil organic carbon and the reduced labile organic carbon were the main causes for this performance. Additionally, the effects of both fertilization and green manure amendment on CH4 emissions were insignificant; however, fertilization significantly increased grain yield by 39.30% compared to CK. As a result, the methane emission intensity under fertilization treatment was notably lower than that from CK. The findings suggest that green manure amendment is a profitable manipulation for enhancing carbon sequestration without increasing paddy CH4 emissions. However, this cannot substitute the critical role of N fertilizer in rice production.

1. Introduction

Agricultural soil carbon pool is the most active carbon (C) source in terrestrial ecosystems, greatly influenced by human farming activity, affecting the global carbon cycle [1]. Increasing soil organic carbon (SOC) content is an important way to improve soil fertility and ensure sustainable agricultural production [2,3]. Notably, SOC can be divided into labile and recalcitrant C [4], of which labile organic C (LOC) refers to the C available for microbial activity related to nitrogen (N) transformation and methanogenesis [5,6,7]. Limited LOC is detrimental to crop production, while in excess it can increase methane (CH4) emissions, especially in anaerobic paddies. Generally, soil LOC is very sensitive to agricultural practices, thus affecting soil carbon management index [8]. Therefore, it is crucial to systematically estimate the suitability of agricultural activities by introducing carbon management indices combined with crop yield and farmland greenhouse gas (GHG) emissions indicators.
Rice is one of the most important cereals for maintaining global food security; however, its often-anaerobic growth conditions render rice agro-ecosystems a powerful source of CH4 emissions [9,10]. Green manure amendment is recognized as an effective measure for soil fertility improvement in paddy–upland rotation, especially for SOC [11,12]. More importantly, such amendments can affect crop yields and GHG emissions. Raheem et al. (2019) pointed out that green manure amendment can increase rice yield from 6% to 15%, but its effect on paddy CH4 emissions varies on green manure type [13]. Specifically, ryegrass/rape amendment increases the CH4 emissions from paddies compared to the fallow control; however, milk vetch amendment can decrease methane emissions. Hou et al. (2022) also found that ryegrass (high C/N) amendment promoted paddy methane emissions compared to fallow control due to the higher copies of mcrA gene and SOC content, while milk vetch (low C/N) emitted equivalent CH4 emissions with the control [12]. These observations suggest that the C/N ratio of green manure, other than soil physicochemical properties and microorganisms, plays a decisive role in methane formation and emissions from paddies. Since amendments contain a wide C/N ratio, often exceeding the 24:1 (optimal C/N ratio), soil microorganisms must be able to use the environmental N to mediate the “litter” decomposition process [14]. Referring to the C/N ratio of green manure material, it is necessary to understand the supply of N substrate for its decomposition.
On one hand, the application of chemical N fertilizer is not only an important measure to ensure crop production, but also a means to provide the N required for microbial activity. However, the actual impact of N fertilizer on methane emissions from paddies remains an unresolved problem [15]. Using a meta-analysis, Banger et al. (2012) found that N fertilizer could promote CH4 emissions, especially at low-N application doses [16]. This seems plausible; after all, N fertilizer can increase root exudates (an important substrate for methanogens). On the other hand, Craine et al. (2007) demonstrated that soil microorganisms could promote the decomposition of deciduous leaves using the N from recalcitrant organic matter in low-N soils [17]. Additionally, Hobbie (2008) confirmed that N fertilizer cannot affect lignin decomposition and soils lacking chemical N show a faster decomposition rate [18]. This means that green manure amendment without fertilization may promote soil carbon turnover with the SOC turnover rates varying as per the C/N ratio of the green manure. Based on the above analysis, the questions emerging are: (i) which strategy (fertilization vs. green manure) has the greater impact on methane emissions? (ii) do the current results on the impact of green manure amendment on methane emissions “mask” the effects of N fertilizer? (iii) if so, the cause(s) of the differences among methane emissions under different management strategies also mandate further clarity.
Here, we hypothesized that long-term green manure amendment and N fertilizer application may interactively affect paddy CH4 emissions in rice–fallow/green manure rotation by altering the soil carbon pool, the soil physicochemical properties and the microbial community related to methane emissions. Furthermore, assuming that the increase in soil carbon from the green manure amendment mainly enriches with stable carbon, then fertilization may have a greater impact on methane emissions. To test this hypothesis, we analyzed the effects of long-term green manure amendment under fertilization/no-fertilization conditions on the soil carbon pool and paddy CH4 emissions. The relationship between the proposed strategy with soil physicochemical properties and microbial functional genes were also quantified.

2. Materials and Methods

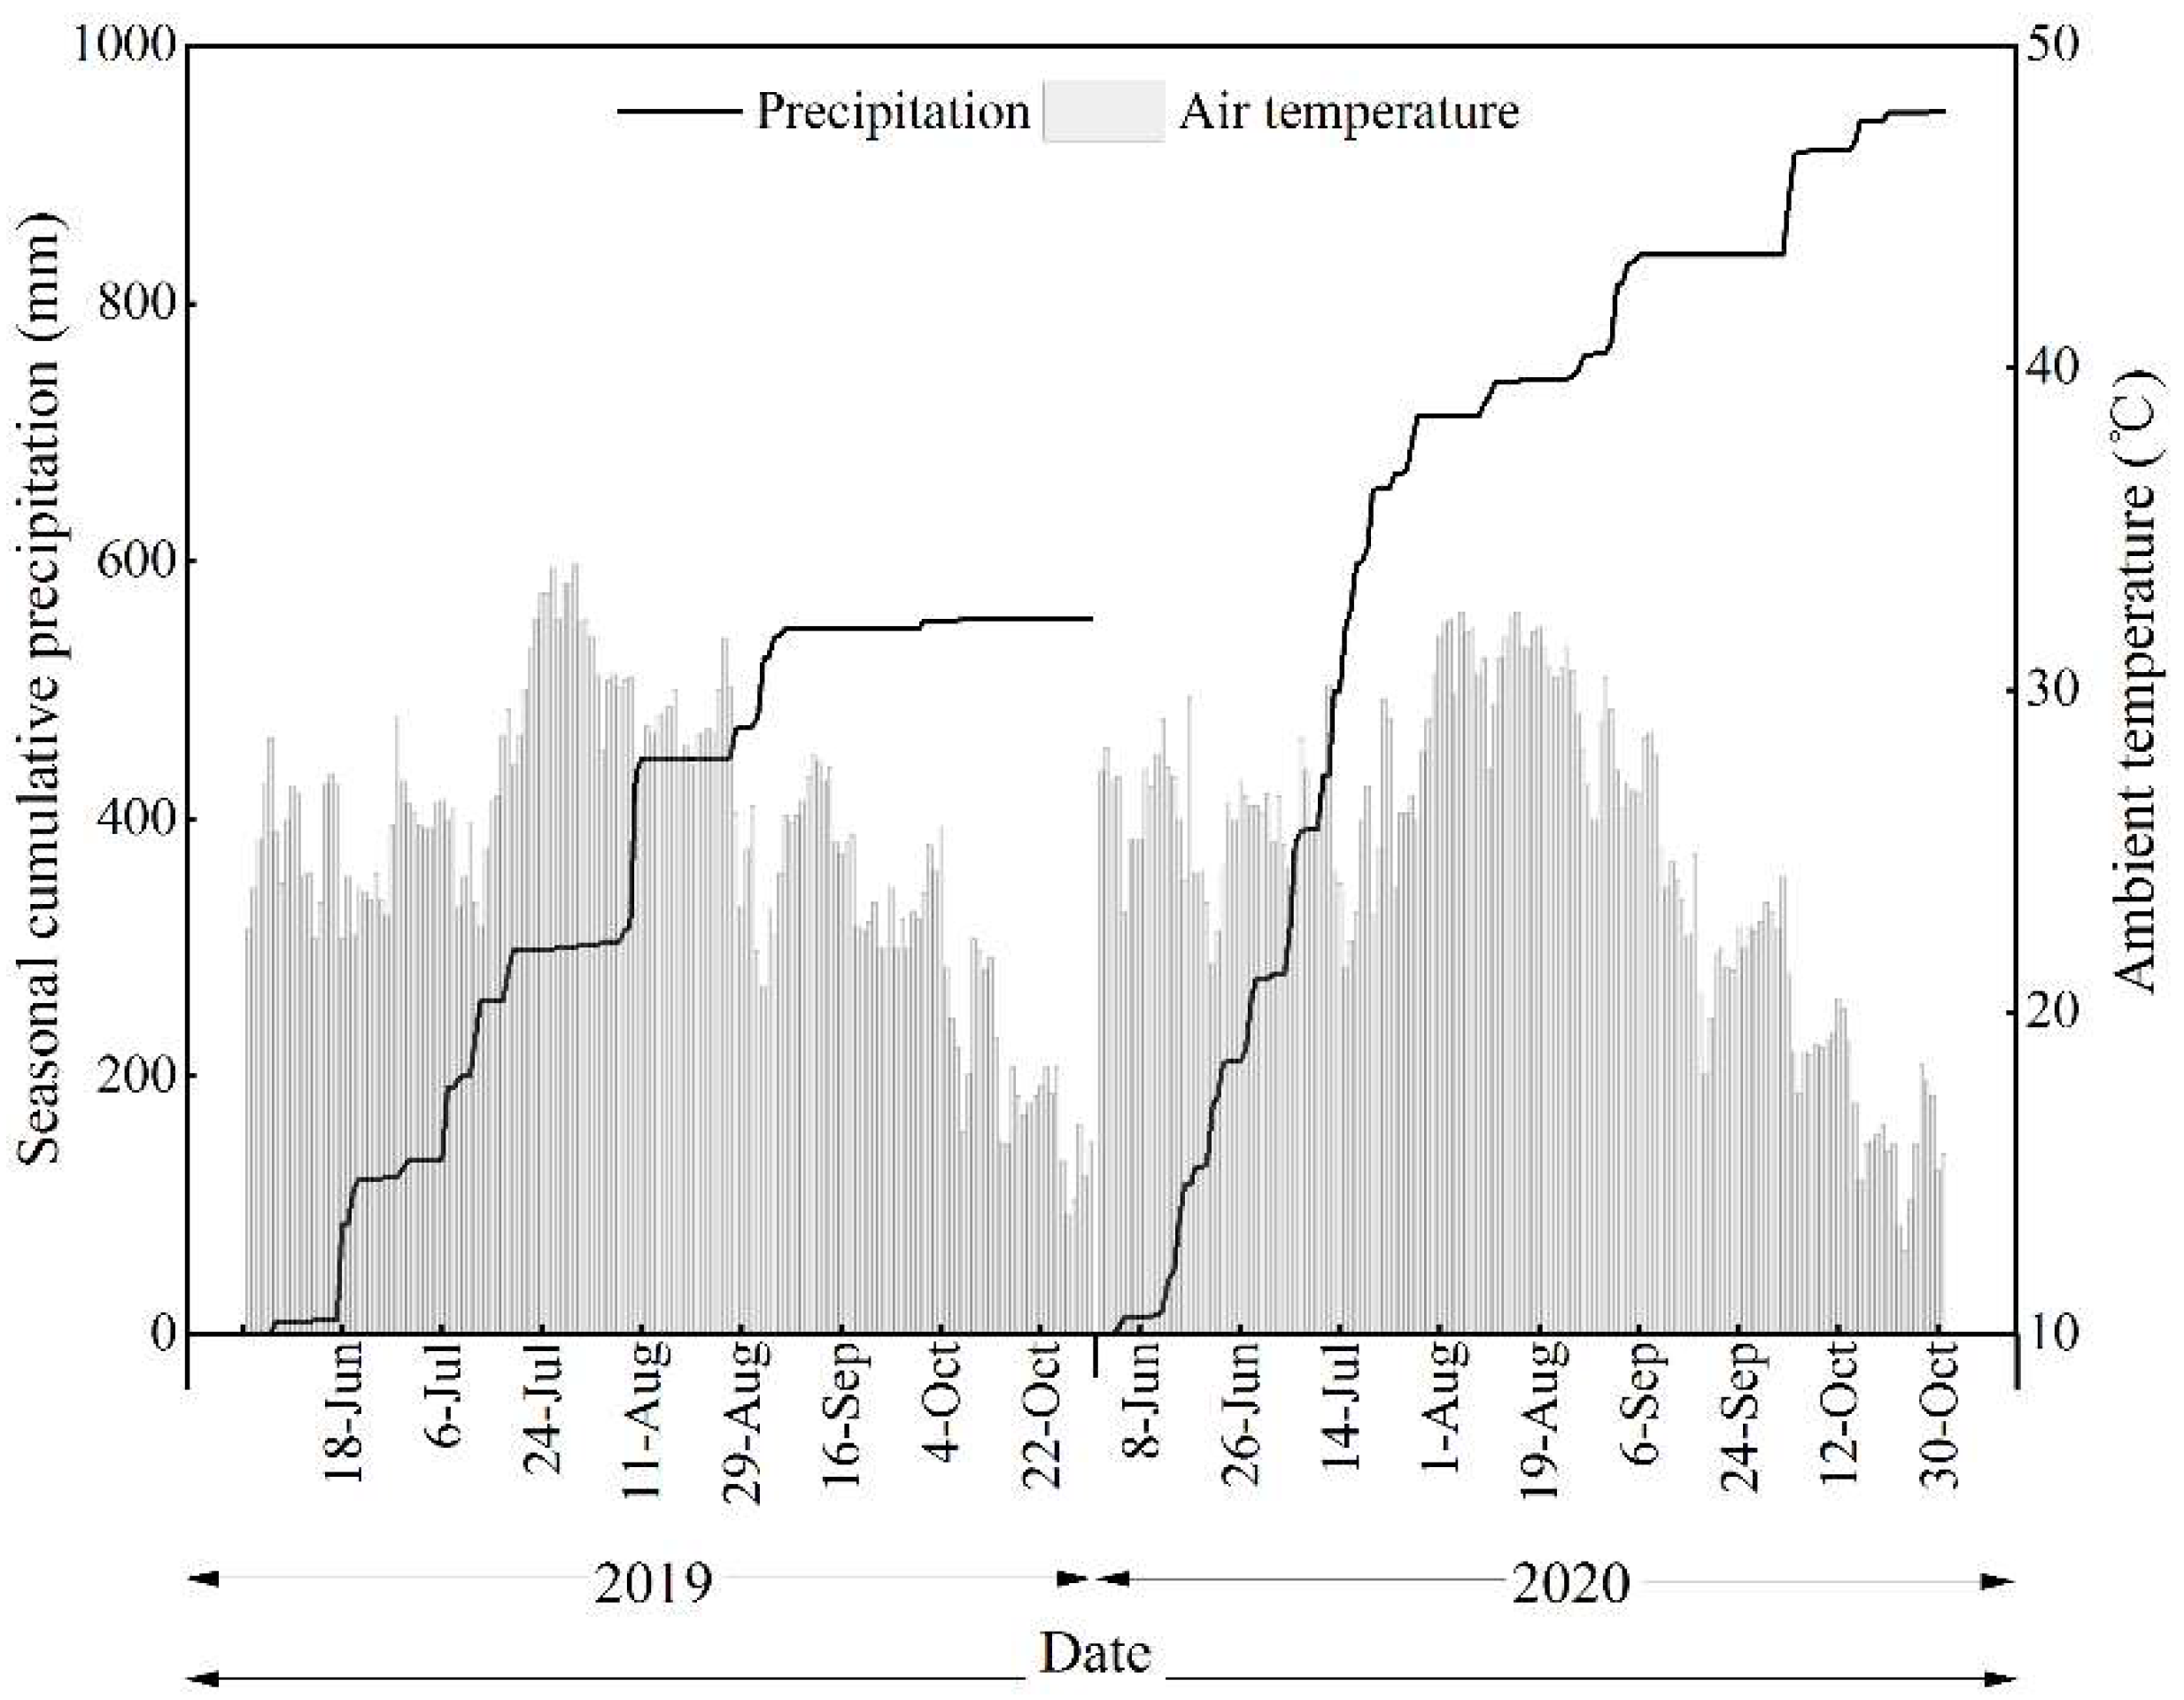
2.1. Experimental Design

The field experiment was located at Weidu village, Dapu town, Wuxi City, China (119.85° E, 31.29° N). The experimental plots were set up in 2003 and have continued since the rice season of that year. Soil physicochemical properties in the initial year (2003) were pH 6.23, soil organic C (SOC) 12.6 g kg1, total N (TN) 1.3 g kg1, C/N ratio 9.69. Field sampling was carried out in the 17th (2019) and 18th (2020) year of operation. The daily temperature and precipitation for the two sampling seasons are listed in Figure 1.
The experiment was carried out with two-factor randomized complete block design. Three cropping systems (rice–ryegrass (Lolium multiflorum Lam.), rice–milk vetch (Astragalus sinicus L.), and rice–fallow control) were selected as the main factor; while fertilization (NF) and no N fertilizer input (CK) in the rice-growing season in all three systems as sub-factor were applied. Six treatments were labeled as follows: ryegrass—NF, ryegrass—CK, milk vetch—NF, milk vetch—CK, fallow—NF, and fallow—CK. Each treatment was repeated thrice with an area of 40 m2. The field operations for the experiment were as follows:
In fallow season, ryegrass/milk vetch seeds for the trialed plots were sown after rice harvest annually in late October; the plants were mowed and mixed with topsoil (~10 cm) in April of the following year (approximately 2 months prior rice transplanting). During growth stage, the two plants were grown under natural conditions without manual intervention except artificial ditching for drainage purposes. The annual retention amounts aboveground and underground were approximately 3125 kg ha1 and 4875 kg ha1 for ryegrass, and 4125 kg ha1 and 8313 kg ha1 for milk vetch, respectively. Additionally, the C/N ratios of ryegrass and milk vetch were approximately 36 and 15, respectively.
For the rice season, the rice seedlings were planted via artificial transplanting annually in late June. For NF treatment, the optimized fertilization doses and methods of N, P2O5, and K2O were selected according to a regional recommended fertilizer formula in rice–fallow/green manure rotation [19]. Specifically, the N fertilizer was manually applied into the trialed plots at basal, tilling, and booting stages with 41, 40, and 69 kg N ha−1, respectively. Meanwhile, all phosphorus (81 kg P2O5 ha−1) and potassium (81 kg K2O ha−1) fertilizers were applied to the field as basal fertilizer prior rice transplanting. The dose and application method of phosphorus and potassium fertilizers in the CK treatment were the same as the NF treatment, except that no N fertilizer was applied. The specific fertilizer applications are shown in Table 1. The “pre-flooding, mid-aeration and post-drying (pre-harvest)” mode was used as the irrigation strategy; further details are provided by Hou et al. (2021) [20].

2.2. Sampling and Measurements

At maturity stage, 4 m2 plant samples were harvested for the assessment of the rice yield from each plot. Gas sampling was carried out using a static chamber every 7–10 days and lasted from 8:00 to 10:00 a.m.; it was also performed three times within a week after the three fertilizations and mid-aeration stages. The CH4 concentrations were further quantified using Agilent 7890B; and the CH4 emission rates per sampling time were calculated using a slope of CH4 concentrations from four samples collected every 10 min [21]. Thereafter, cumulative seasonal CH4 emissions were calculated via the summation of the emissions estimated from each of the two sampling intervals. Fresh soil samples, collected during tillering stage in 2020, were used for the analysis of the copy numbers of mcrA and pmoA genes using qPCR. The referenced primers of the functional genes and the operational steps/protocol for the qPCR are described in Hou et al. (2020) [22].
Soil samples (0–20 cm depth) were collected after harvesting the rice in 2020 to assess the response of soil fertility to different treatment after 18 years. The soil was collected from five points randomly, and mixed into one sample in each plot. The soil sample was air-dried for measuring the soil chemical characteristics after removing the surface organic materials and fine roots. The pH was measured with a ratio of soil to water (m/V) of 1:2.5; and the other soil fertility indexes, such as SOC, TN, and alkaline hydrolysis N (AN), were measured according to the Chinese Soil Society Guidelines (Lu, 2000) [23].

2.3. Data Analyses

To systematically evaluate the soil carbon pool, the soil labile organic C (LOC) content and carbon management indices under different treatments were analyzed and calculated according to Blair et al. (1995) [24]. The soil carbon pool index (CPI), lability of carbon (L), lability index (LI), and carbon management index (CMI) are calculated as follows:
CPI = SOCT ÷ SOCR
L = LOC ÷ (SOC − LOC)
LI = LT ÷ LR
CMI = CPI × LI × 100
where SOCT and SOCR stand for the organic carbon content of trialed and referenced (no green manure amendment and no N fertilizer input plot) soils, respectively; LOC is the soil labile organic carbon content; LT and LR refer to the lability of carbon of the trialed and referenced soils, respectively.
Referencing Mosier et al. (2006) [25], the methane emission intensity (CH4 emission/yield, g kg1) was characterized using the ratio of cumulative CH4 emissions to grain yield.

2.4. Statistical Analyses

SPSS 21.0 was used for statistical analysis. Due to the data of rice yield, methane emissions and methane emission intensity were collected continuously for 2 years, and the effects of trial year on these variables were also conducted. Therefore, the interactive effects of green manure amendment (M), fertilization (F), and trial year (Y) on rice yield, methane emissions, and methane emission intensity were analyzed using three-way ANOVA. The interactive effects of M and F on soil carbon management indices and microbial functional genes were all analyzed using two-way ANOVA. Comparisons between fertilization/trial year of different variables were made using an independent T-test, and comparisons among green manure amendment treatments were made using the Duncan test (p < 0.05). Data mapping and correlation analysis were performed using OriginPro software.

3. Results

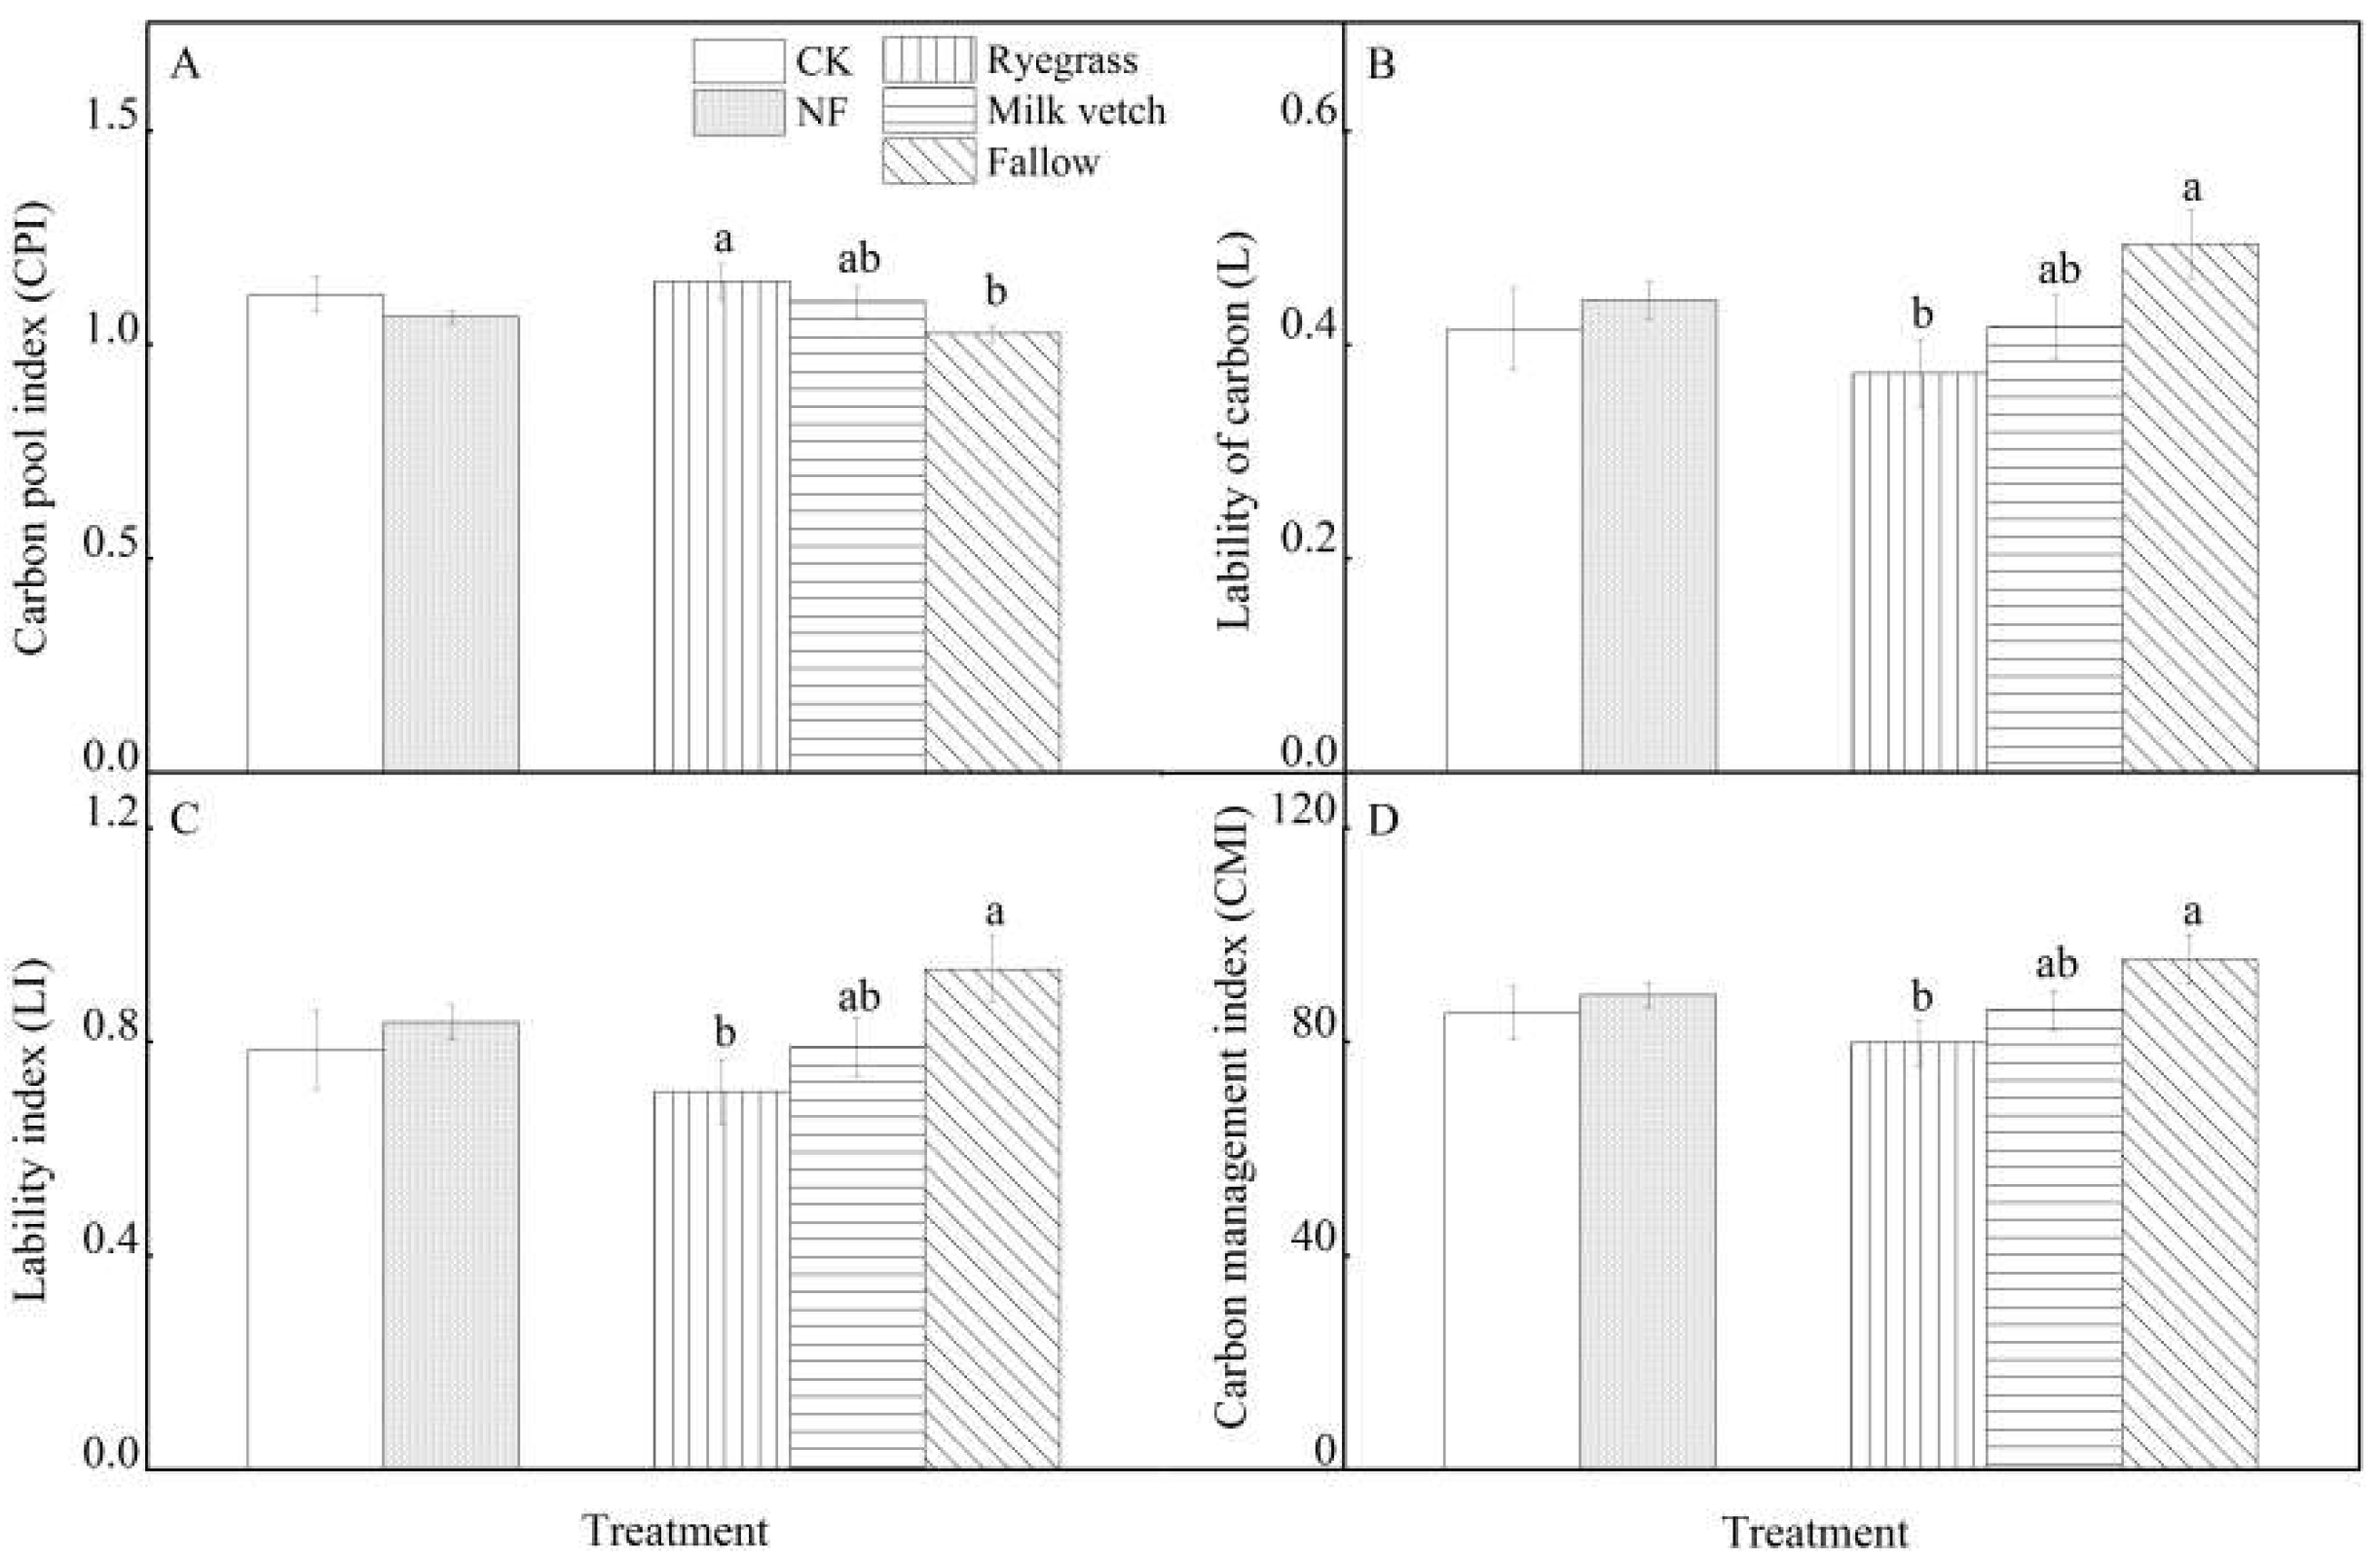
3.1. Soil Fertility and Carbon Management Indices

Table 2 showed that fertilization and green manure amendment both had no significant effect on soil pH, LOC, and AN. It is worth noting that the LOC contents from fallow with/without fertilization treatments were higher than those from the other treatments. The SOC contents were significantly affected by green manure amendment, but not from fertilization. Compared with fallow control, green manure amendment was beneficial to improve the SOC content, especially under no-fertilization control. The TN contents subjected from green manure amendment treatments were also increased. Notably, the interaction effect of fertilization and green manure on soil TN content was statistically significant. The TN content of ryegrass—CK was remarkably higher than ryegrass—NF treatment; however, value in milk vetch—CK treatment was lower than that in milk vetch—NF treatment.
As shown on Table 3, the interactive effects of fertilization and green manure amendment on CPI, L, LI, and CMI were not significant. The soil carbon management indices were notably affected by green manure but not from fertilization. Green manure amendment increased CPI; and the difference between ryegrass treatment and fallow control was statistically significant (Figure 2A). The CPI in ryegrass treatment was 11.65% higher than that in the fallow control. Contrary to the CPI performance, green manure amendment reduced L, LI, and CMI (Figure 2B–D). All three indices from ryegrass treatments were remarkably lower than the fallow control. Specifically, the L, LI, and CMI from the treatments subjected to green manure amendment decreased by 24.49%, 24.46%, and 16.22% (ryegrass) and 14.29%, 15.96%, and 9.95% (milk vetch) in comparison to the fallow control.

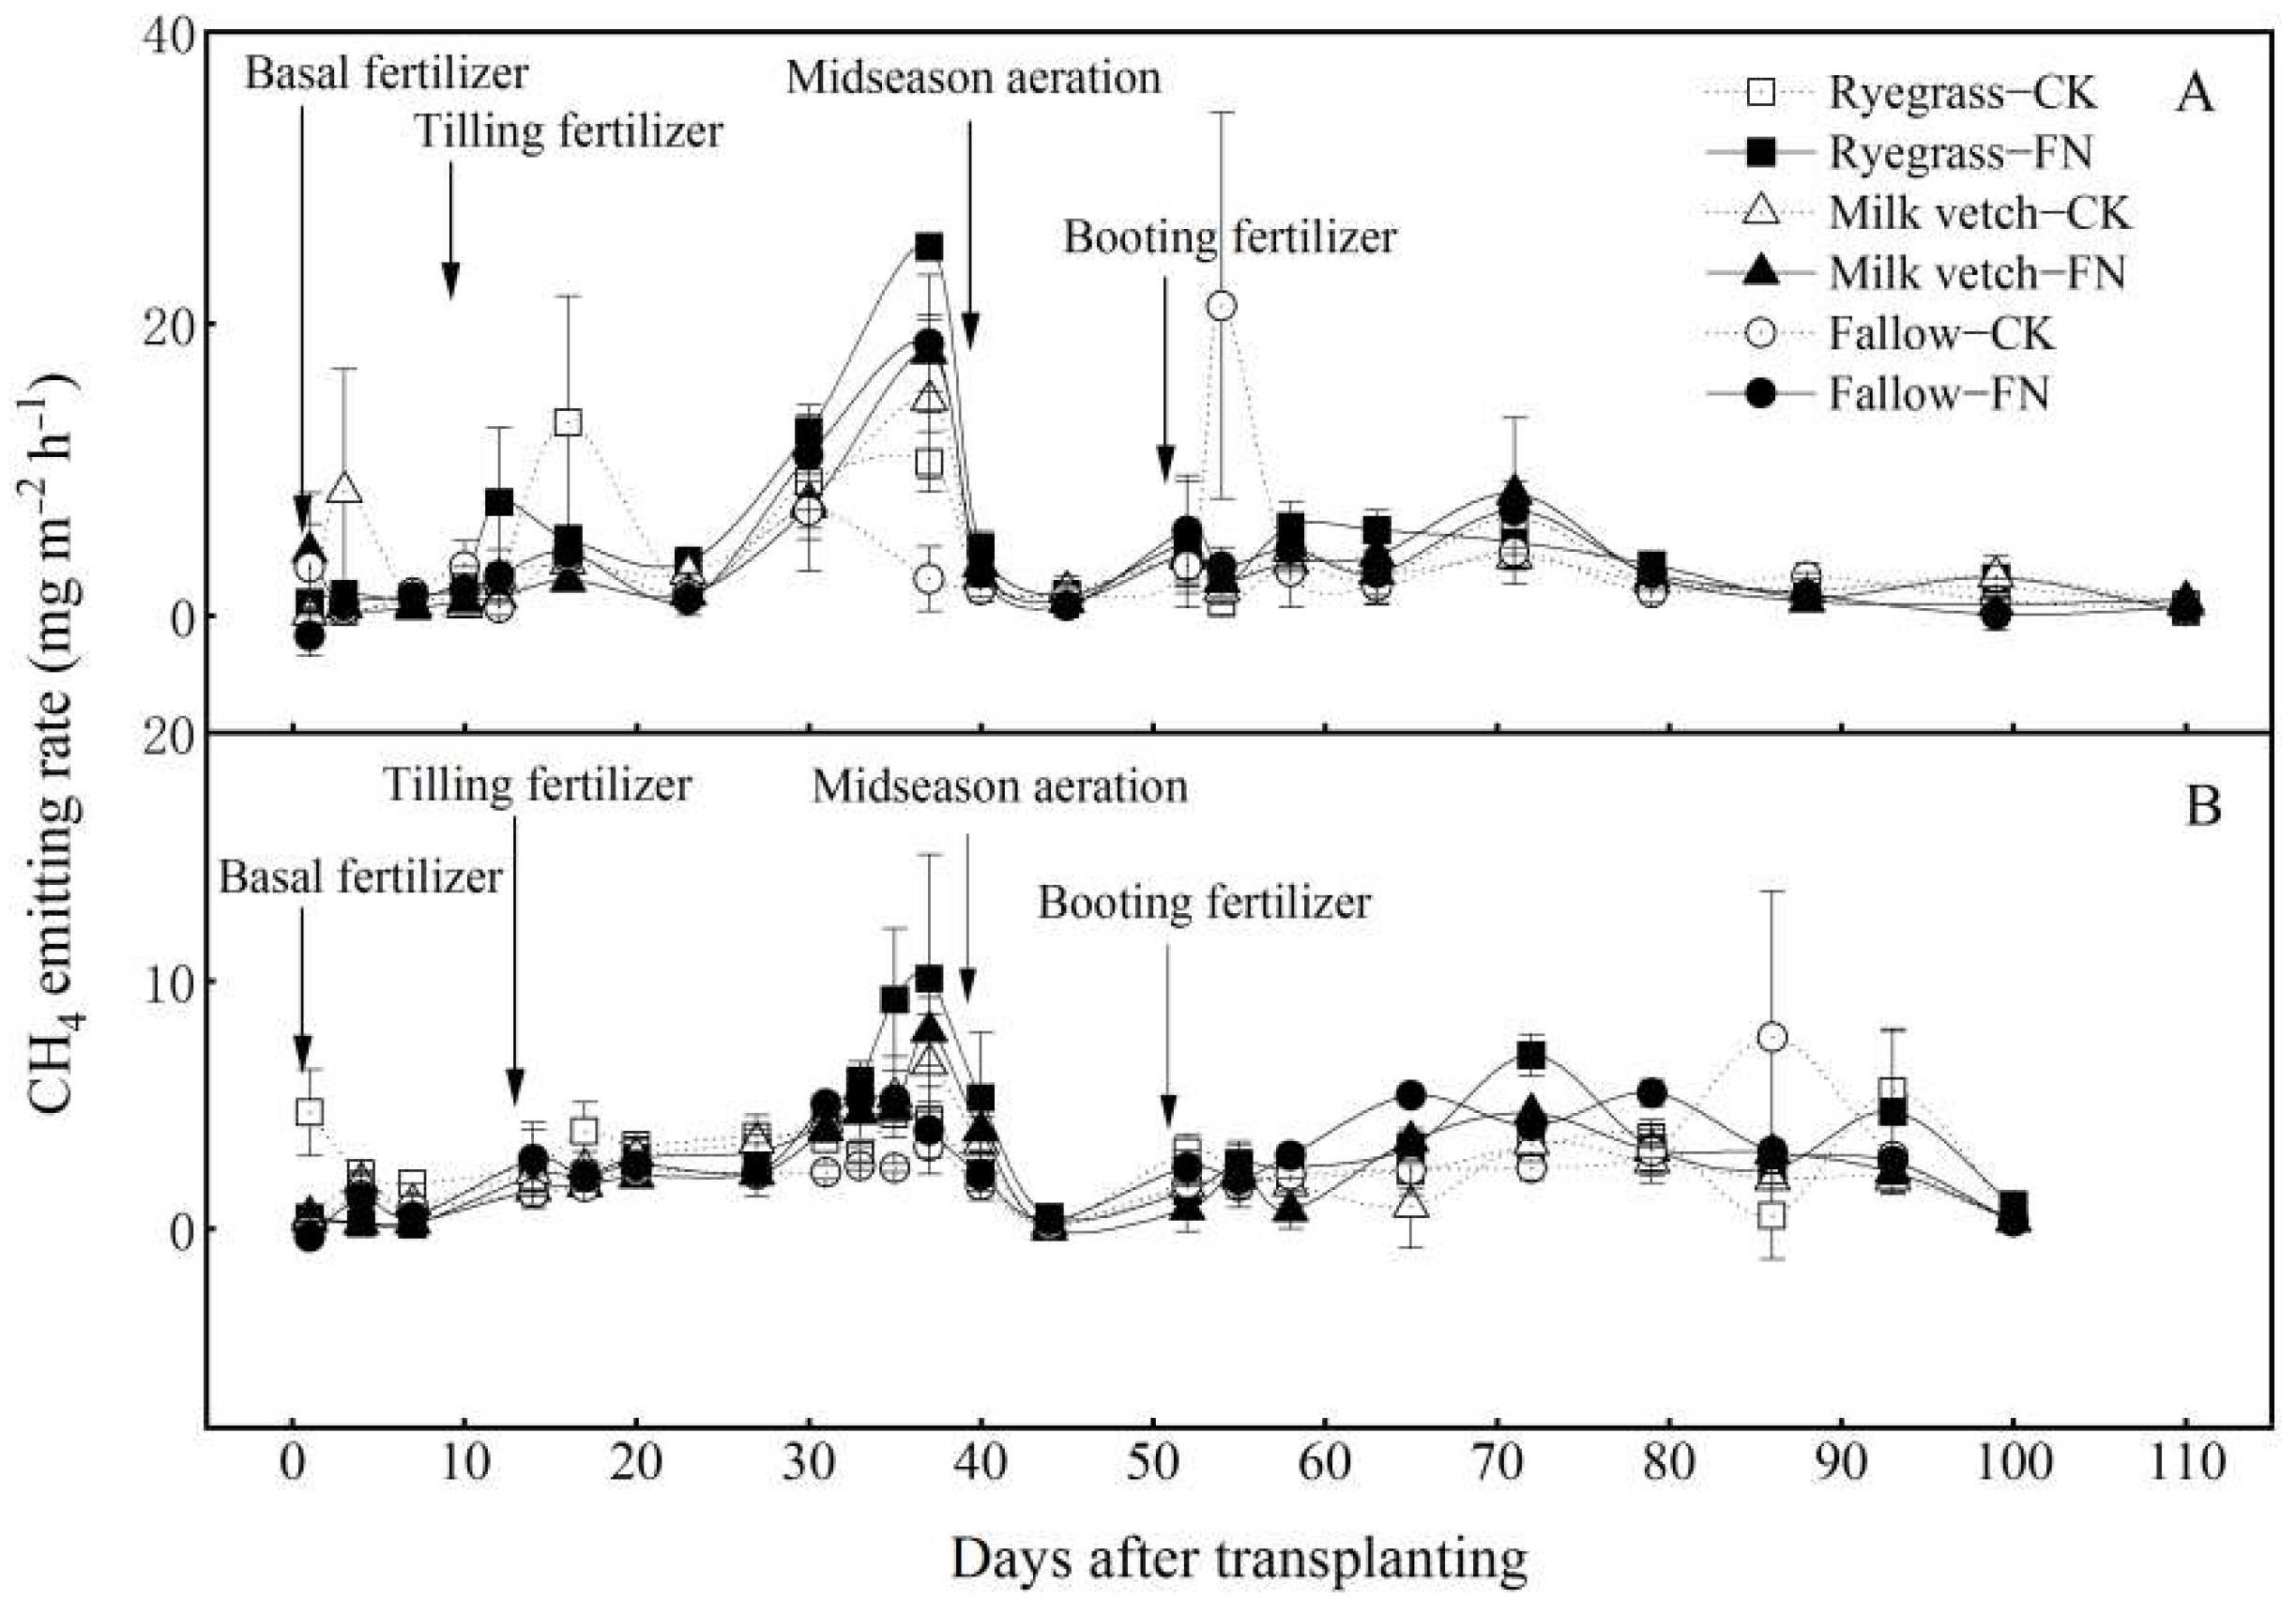
3.2. CH4 Emitting Rate

The obtained results (Figure 3) showed that the CH4 emitting rates in 2019 were remarkably higher than those in 2020. The CH4 emissions among the treatments were mainly concentrated during the early growth stage prior to midseason aeration. Emissions subjected to different treatments followed similar emitting patterns and only differed temporally, mainly in amplitude. The peak of CH4 emissions in ryegrass amendment with fertilization (NF) treatment was higher than those from all other treatments for both years, with 25.26 and 10.08 mg m−2 h−1 for 2019 and 2020, respectively.
In terms of average emitting rate, statistical analysis indicated that the combined effect of fertilization and green manure amendment was found to be insignificant (Table 4). When compared with the no-N fertilizer control (CK), fertilization treatment (NF) tended to increase the average CH4 emitting rate (by 14.98%). Additionally, the average CH4 emitting rate in ryegrass amendment treatment was higher than the rates from the fallow control and milk vetch amendment treatments; the difference among the treatments, though, was insignificant.

3.3. Rice Yield and Cumulative CH4 Emissions

The interactive effect of fertilization (F), green manure (M), and trial year (Y) (F × M, F × Y, M × Y, F × M × Y) on rice grain yield was not significant (Table 4). The grain yield was remarkably affected by fertilization and trial year, but not by green manure. Compared with no-N fertilizer control (CK), fertilization (NF) significantly increased the grain yield by 39.30%. Additionally, the grain yield achieved in 2019 (7.13 t ha−1) was notably higher than that achieved in 2020 (6.15 t ha−1).
Methane emissions and CH4 emission intensity were clearly affected by fertilization (p < 0.1 or 0.05) and trial year (p < 0.001 or 0.01); the effects, though, were not affected by green manure. The seasonal methane emissions under NF treatment increased by 20.73% in comparison to CK. Conversely, with CH4 emissions, the methane emission intensity of NF was notably lower than the CK treatment, likely due to the rice yield benefits of N fertilizer. Meanwhile, the cumulative seasonal CH4 emissions and CH4 emission intensity in 2019 were remarkably lower than those in 2020. Additionally, the cumulative seasonal CH4 emissions and CH4 emission intensity in ryegrass amendment treatment was higher than the fallow control and milk vetch amendment treatments, although the differences were insignificant.

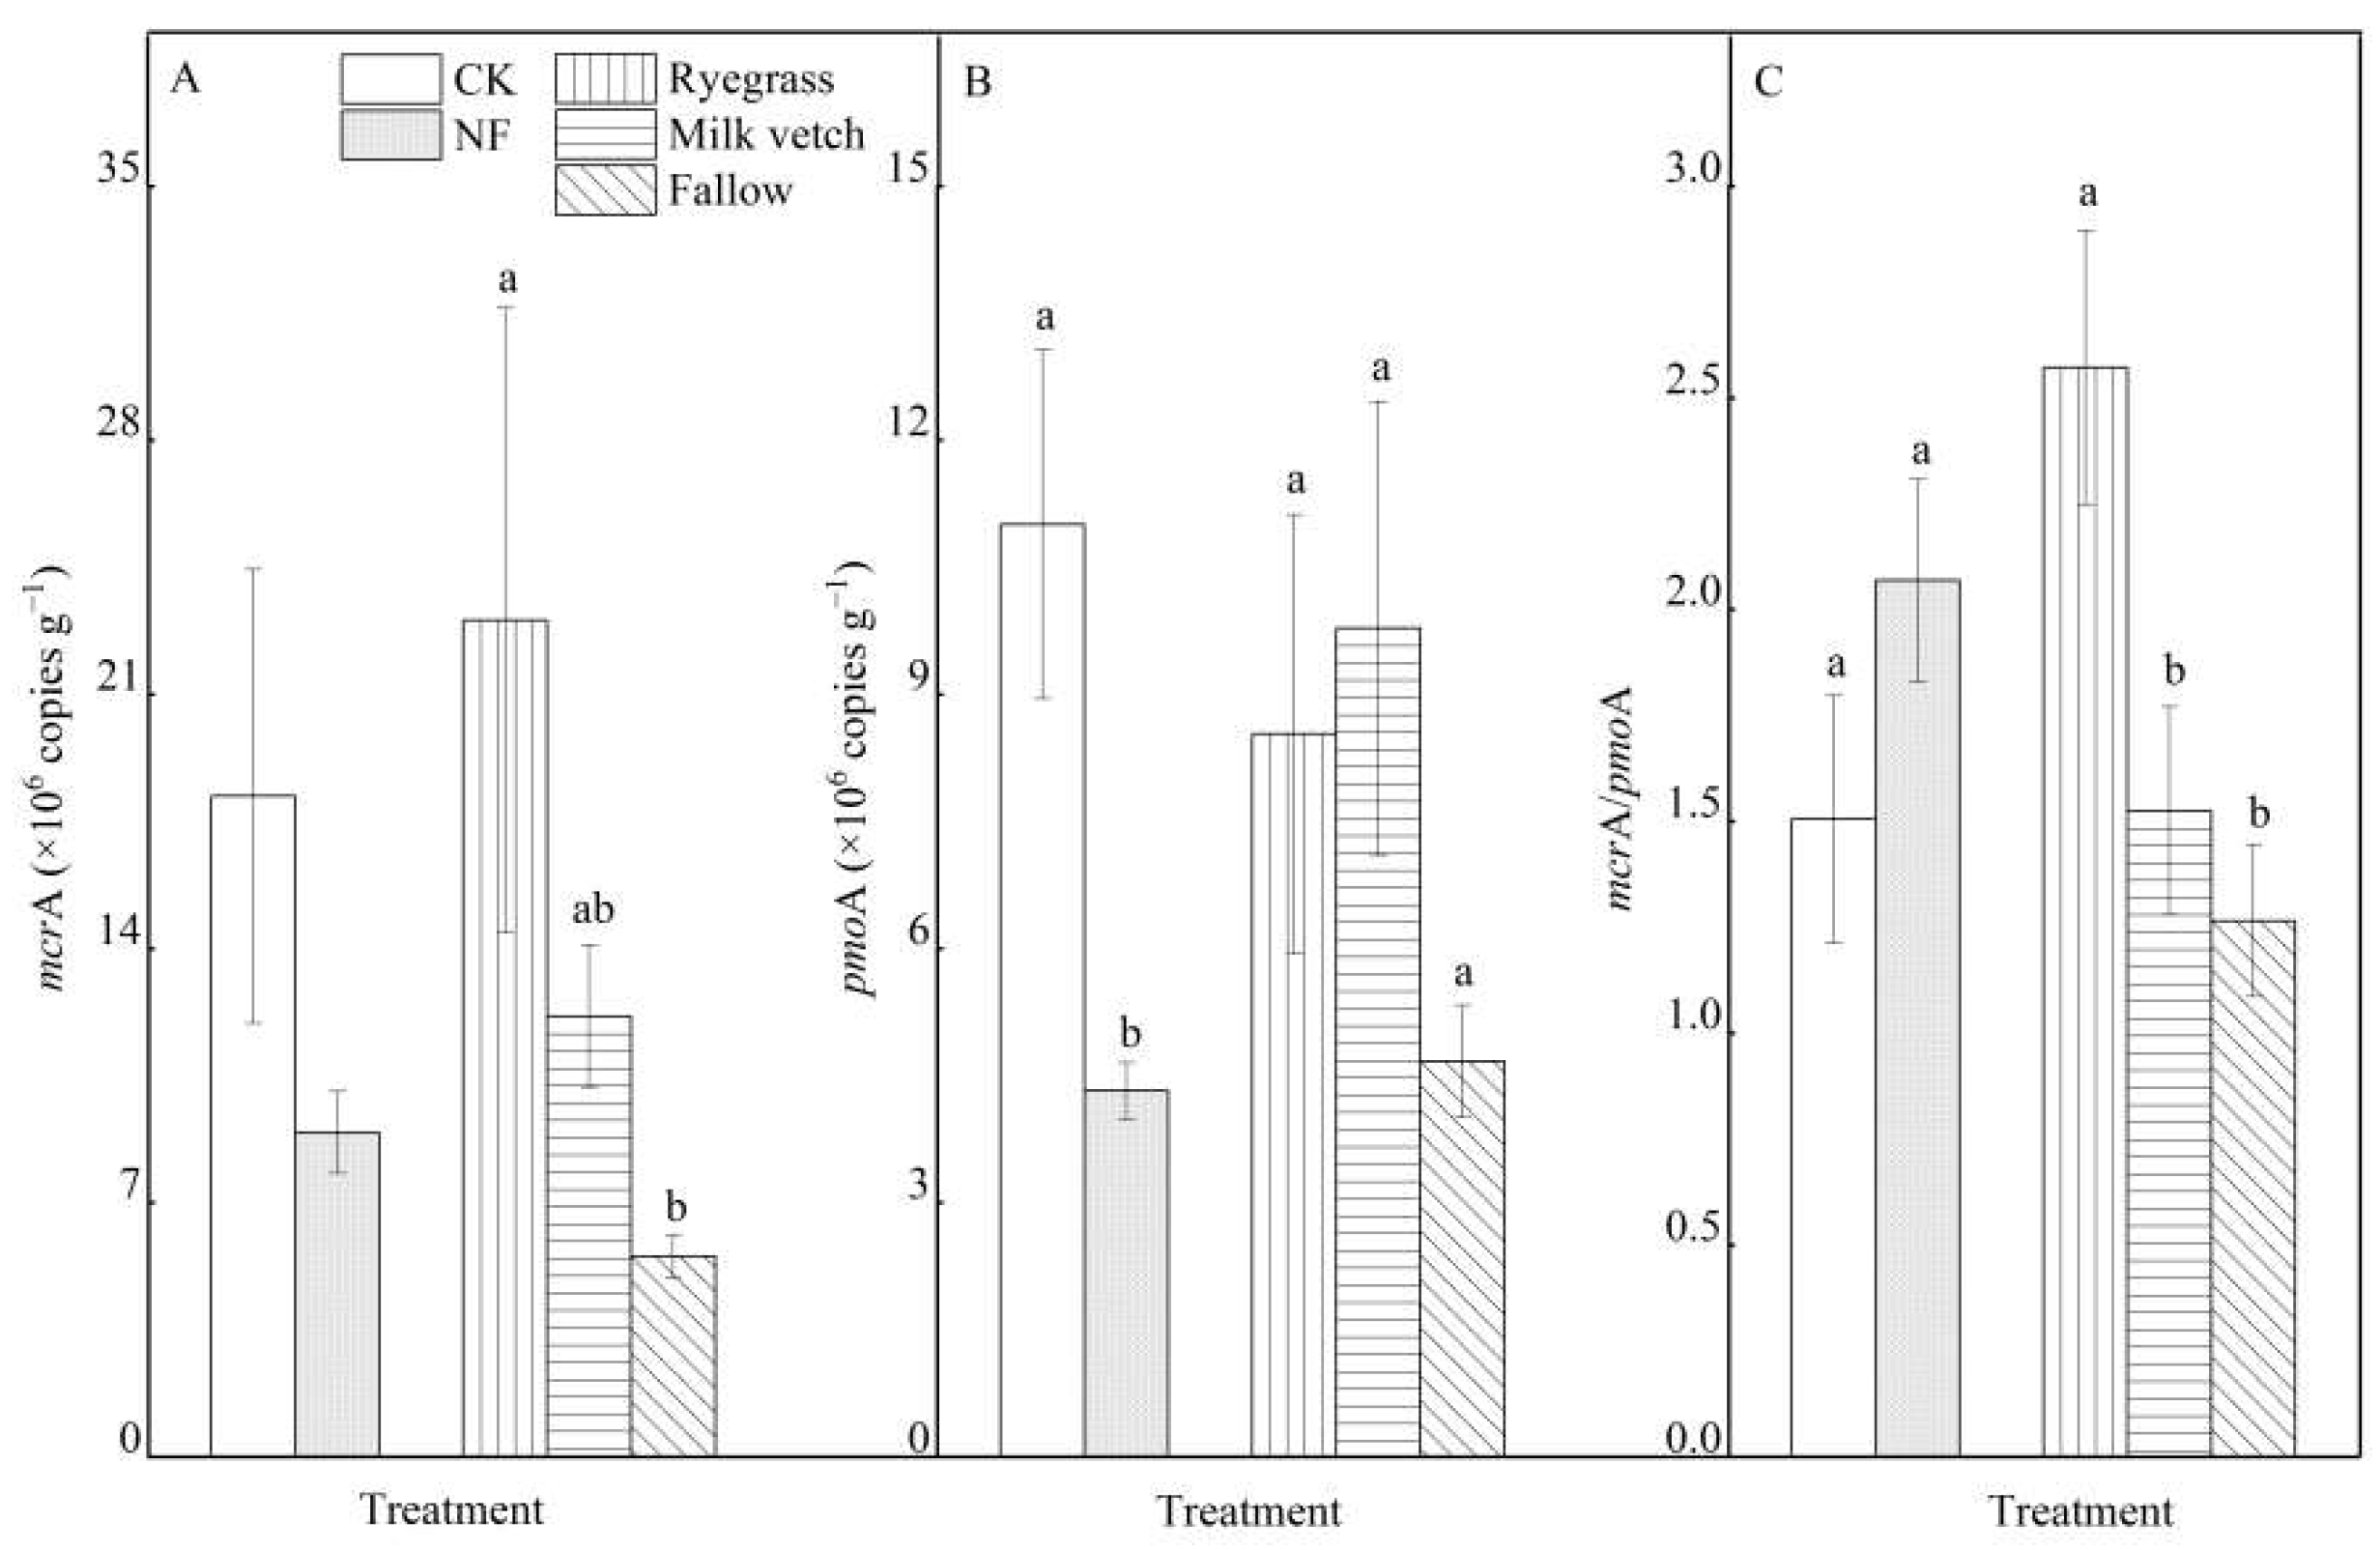
3.4. mcrA and pmoA Genes

The interactive effects of fertilization and green manure amendment on the copies of mcrA and pmoA genes, as well as the mcrA/pmoA ratio were not significant (Table 3). Fertilization had an obvious effect on the copies of pmoA gene (p < 0.05) and mcrA/pmoA ratio (p < 0.1), and green manure amendment apparently affected the copies of mcrA (p < 0.1), pmoA genes (p < 0.1), and mcrA/pmoA (p < 0.01). Accordingly, the copy numbers of soil microbial functional genes subjected to fertilization and green manure amendment are presented in Figure 4. The results indicate that fertilization significantly reduces the copy numbers of pmoA gene by 60.73% compared to those detected from the no-N fertilizer control; the mcrA/pmoA was also increased by 37.09%. Additionally, green manure amendment stimulated the copies of mcrA and pmoA genes with the highest value observed in ryegrass treatment for mcrA gene, and in milk vetch treatment for pmoA gene. Due to the higher increment of mcrA, the mcrA/pmoA of ryegrass treatment was remarkably higher than the fallow control and milk vetch treatments.

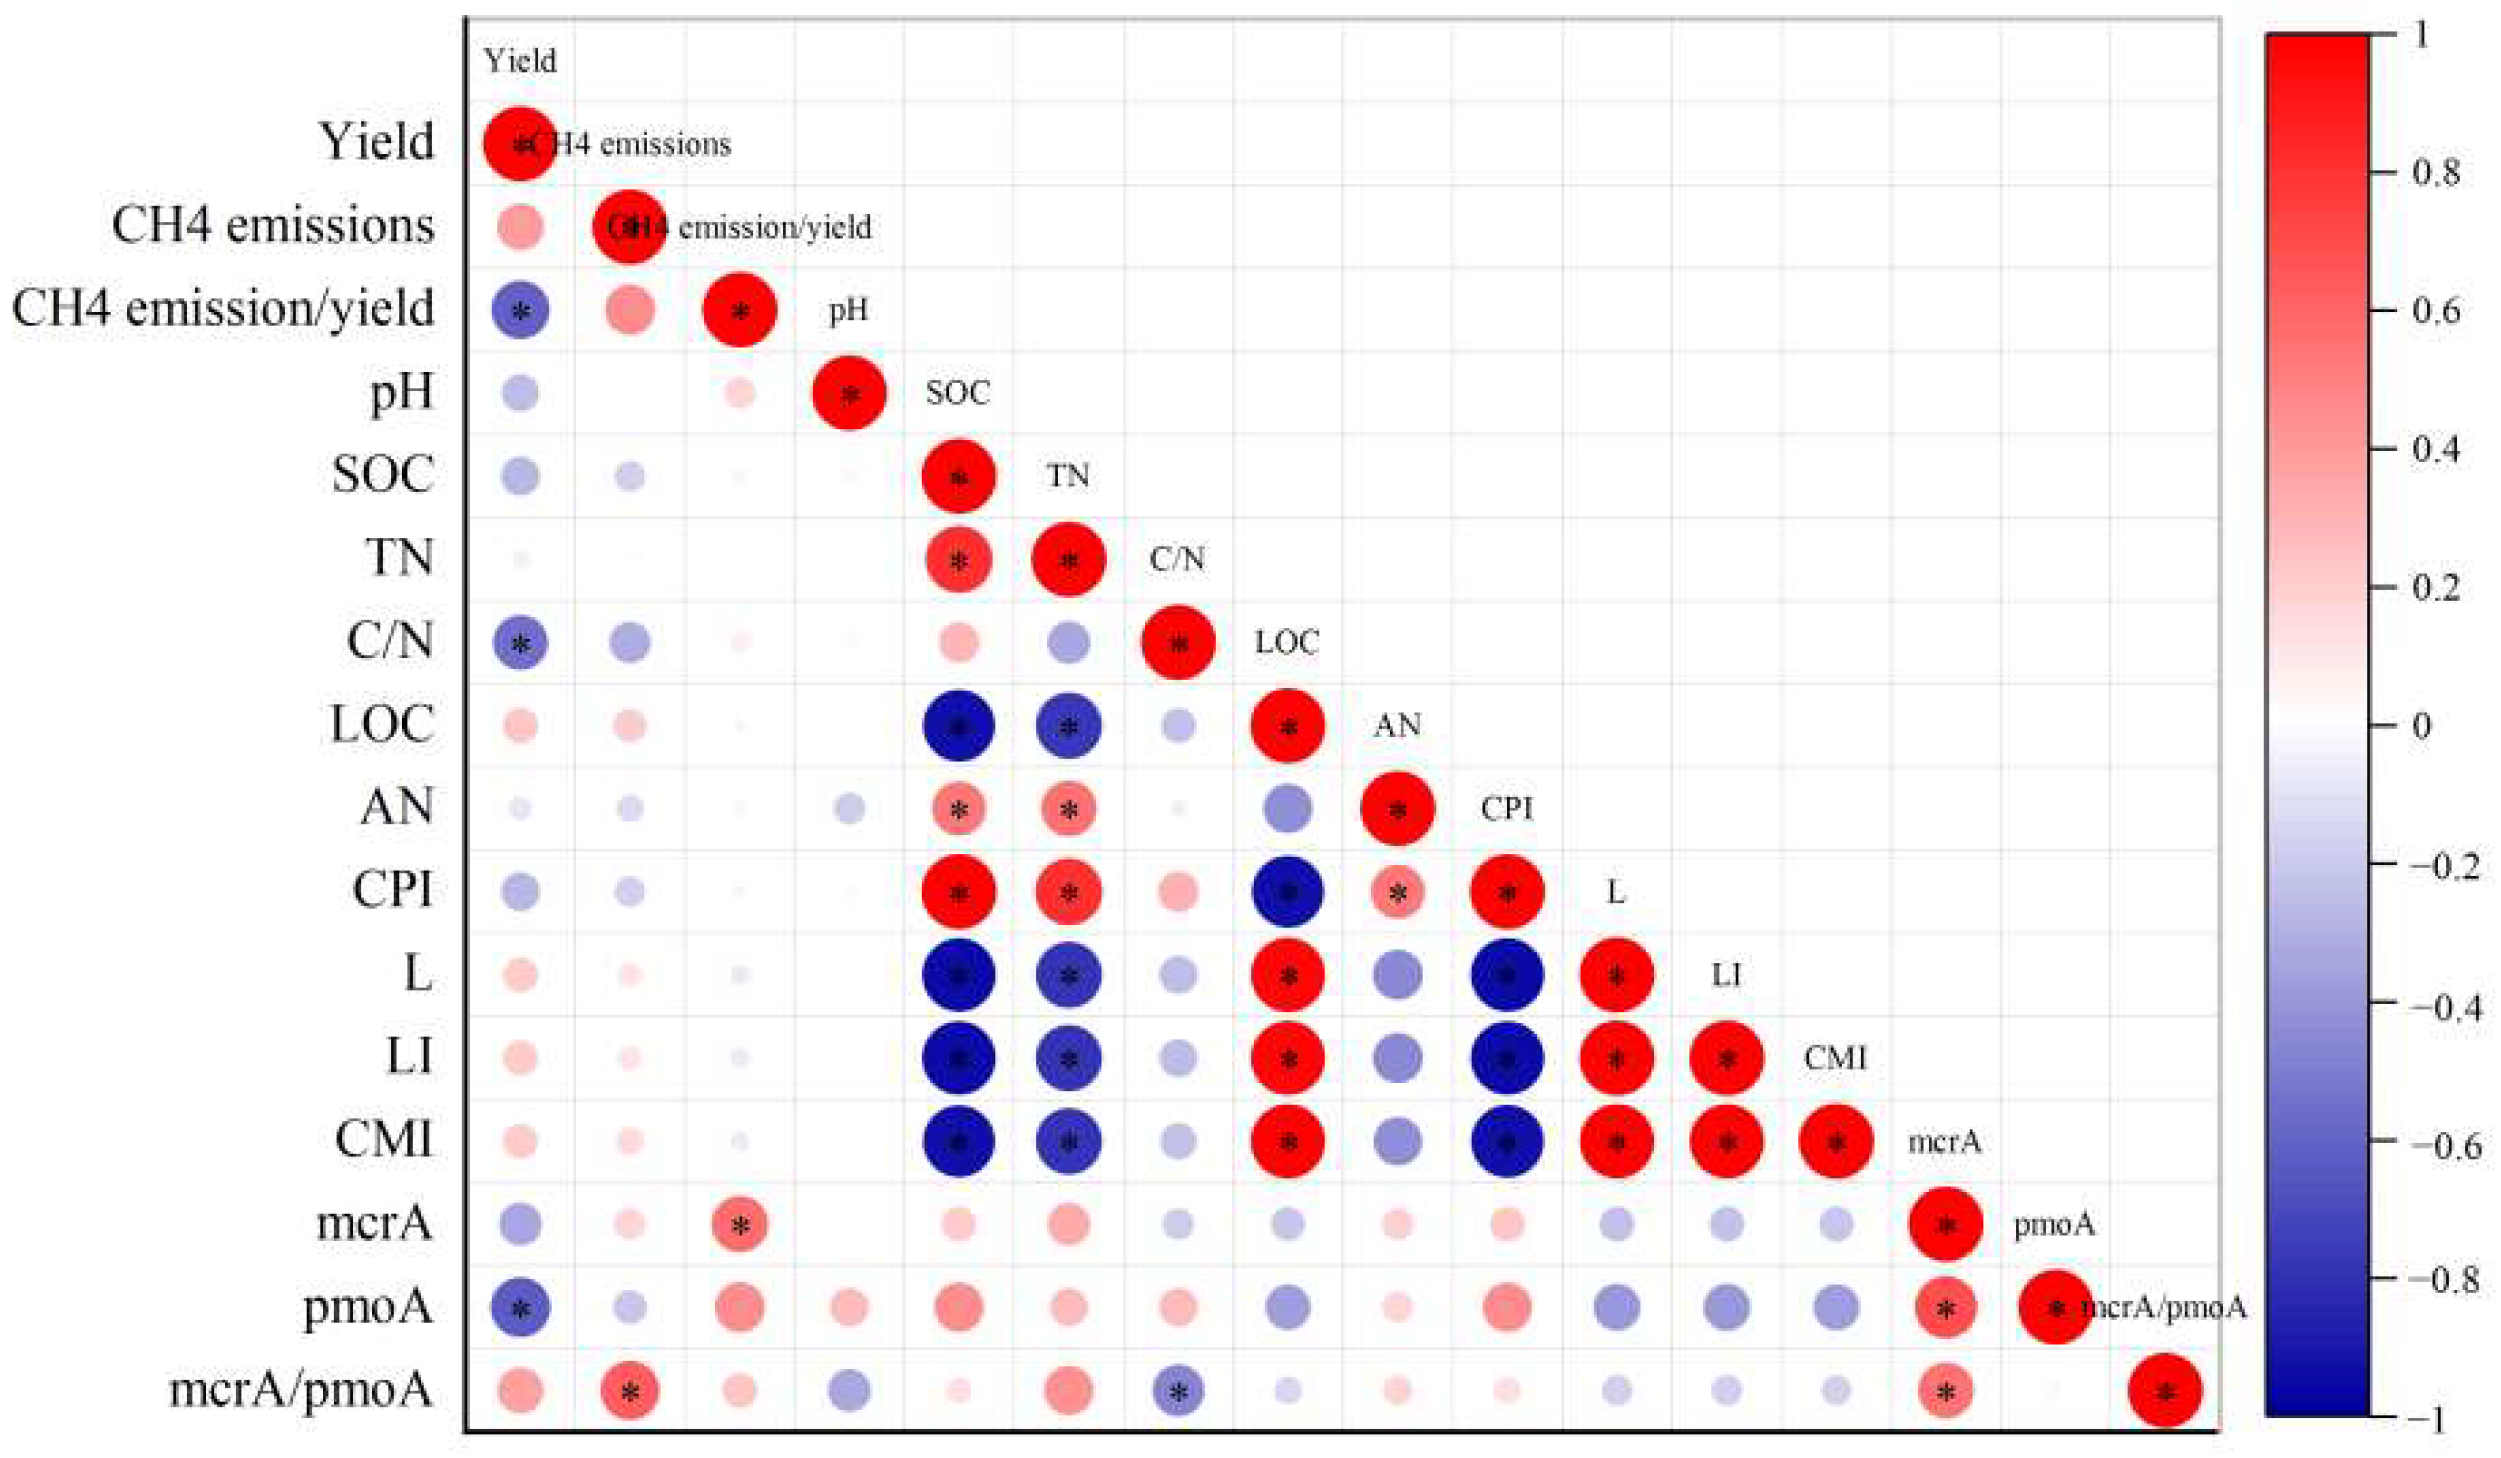
3.5. Correlation Analysis between Grain Yield, CH4 Emissions and Soil Index

The results indicate that rice yield is notably negatively correlated with the soil C to N ratio (C/N) (Figure 5). The methane emissions are positively correlated with soil mcrA/pmoA (p < 0.05); the soil mcrA/pmoA is negatively associated with soil C/N (p < 0.05). It is worth noting that the CH4 emission intensity is, remarkably, only negatively associated with rice yield. SOC was positively associated with CPI (p < 0.05), and negatively correlated with LOC, L, LI and CMI (all p < 0.05). Notably, there was a significant “co-frequency resonance” relationship between SOC, TN, and alkaline hydrolysis N (AN) content, i.e., the higher the SOC, the higher the TN and AN.

4. Discussion

4.1. Soil Carbon Management Indices

We found that soil carbon management indices were notably dictated by green manure amendment but not fertilization. Green manure amendment increased the CPI and reduced the CMI due to the higher SOC and lower LOC. These findings highlight the key role of soil LOC in soil carbon management index when subjected to green manure amendment [26]. Lenka et al. (2015) also confirmed that the CMI compares the change that occurs in SOC and LOC as a result of agricultural practices [8]. The present results showed that in comparison with fallow control without N fertilizer input, green manure amendment after 18 years led to an increase in SOC and decreased the LOC content (Table 2). The change in soil aggregate, the basic unit of soil structure, may be the main reason for the variation. Yang et al. (2014) pointed out that the increased SOC mineralization/roots’ secretions subjected to green manure amendment can bound together with microbial secretions, which may enhance the soil aggregate stability [27]. As a result, 28 years’ green manure amendment consistently increases SOC and enriches soil with micro-aggregates (stable carbon). The above observations indicate that green manure amendment, besides increasing SOC pool, improve carbon stability by decreasing LOC due to the polymerization of mineralized macro-aggregates/roots’ secretions and microbial secretions.
Notably, excessive LOC may increase GHG emissions, while a limited amount may be detrimental to the stability of crop production [5,6,7]. Hence, we consider that marginally high or low CMI is not necessarily optimum. As Blair et al. (1995) [24] mentioned, CMI does not have an “ideal” value, which can represent the point of reference index describing soil carbon pool dynamics. Additionally, we found that there was a significant “co-frequency resonance” relationship between SOC, TN and AN content, i.e., the higher the SOC, the higher the TN and AN. Generally, high SOC, in addition to its own content advantages, seems to be able to hold satisfactory amounts of mineral N due to biological and abiotic immobilization [28]. This is likely be the main reason justifying the “co-frequency resonance” relationship observed.

4.2. CH4 Emissions

The results showed that the CH4 emissions in 2019 were significantly higher than those in 2020 (Table 4). Conversely, the seasonal cumulative precipitation in 2019 was lower than that in 2020 (Figure 1). The difference in CH4 emissions per trial year is plausibly related to the temporal distribution and frequency of seasonal precipitation [29]. Although precipitation in 2019 was low, it occurred mainly during the early growth stage. Meanwhile, it is a widely proved phenomenon that CH4 emissions from paddies are predominantly emitted during the early growth stage prior midseason aeration [30]. Methane emission is the result of a combined interaction between methanogens and methanotrophs [31]. Frequent precipitation may affect crop growth and root oxygen secretion, therefore reducing methane oxidation and promoting methane emissions. Hence, the frequency precipitation during the early growth stage may be the main reason for the higher methane emissions in 2019.
Our results also found that fertilization had a greater effect than green manure on paddy methane emissions, although the difference between NF and CK was insignificant. Seasonal CH4 emissions from NF treatment increased by 20.73% compared to those from the CK. Kong et al. (2019) found that fertilization in a rice-wheat rotation significantly increased the CH4 emissions from paddies by increasing the copy numbers of the mcrA gene and mcrA/pmoA [32]. However, Fan et al. (2016) highlighted that fertilization had no significant effect on methane emissions from paddies, although it decreased the mcrA gene copy numbers [33]. These observations highlight the deterministic role played by methanogens in gaseous emissions, while illustrating the uncertainty in the response of methanogens to fertilization.
In the present rotation system, we found that fertilization reduced the copies of both mcrA and pmoA, but increased the mcrA/pmoA, with the CH4 emissions positively correlated with mcrA/pmoA (p < 0.05). These findings suggest that it is mcrA/pmoA ratio, rather than mcrA or pmoA individually, that is the key indicator dictating paddy methane emissions. Notably, we found that soil C/N was not significantly correlated with paddy methane emission, but negatively associated with mcrA/pmoA (p < 0.05). This implicitly suggests that the lower the SOC content, the higher methane emission potential. This phenomenon seems to be explained by the changes in soil LOC, an important substrate for microbial activity related to the methanogenesis process [5,6,7]. Fertilization increased the LOC content under the same green manure amendment treatments (Table 2), which may promote methane emissions. These suggest that soil C fraction rather than total C content plays an important role in regulating methane emissions.
Here we also found that green manure stimulated the copies of both mcrA and pmoA genes as well as mcrA/pmoA. Researchers have proved that methanogens play a vital role in methane emissions from paddy fields subjected to green manure amendment [12,34]. Fortunately, the methane emissions in the two green manure amendment fields did not significantly increase when compared with the fallow control. The difference in soil carbon fractions between treatments may be the main reason for the different CH4 emission performance observed [35]. As mentioned above, it is the soil LOC, rather than total C pool, that is the carbon-source driving microbial metabolism related to methanogenesis processes and subsequently responsible for GHG emissions [6,7]. Therefore, although green manure could increase SOC content, it did not contribute significantly to methane emissions due to the low LOC content. Nevertheless, it is worth noting that ryegrass amendment tended to increase CH4 emissions from paddies. The trend reveals that although the increased carbon mainly enriches the stable organic C, the effect of ryegrass amendment on methane emissions deserves attention due to the increased methanogenic genes observed [30,34].

4.3. Grain Yield and CH4 Emission Intensity

N fertilizer application plays a vital role in ensuring global food security [36,37]. The results from this study confirmed that grain yield was significantly improved by fertilization but remained unaffected by green manure amendment. Thus, although fertilization tended to increase CH4 emissions (p < 0.1), it significantly reduced methane emission intensity. Notably, the yield was also affected by trial year. The seasonal precipitation between trial years is expected to be responsible for the difference of grain yield [38]. It has been proved that the ability of photosynthesis to synthesize carbohydrates after anthesis is a crucial factor affecting rice yield [20,39]. In this context, high-frequency precipitation after anthesis in 2020 (Figure 1) could reduce rice yield by affecting photosynthesis. The results also showed that the interactive effect of fertilization and trial year to the grain yield was insignificant. This means that the yield-increasing effect of fertilization cannot be affected by inter-annual climate variations. Therefore, facing the twin challenge of (i) a growing world population and (ii) a warming climate subjected to change, it is worthwhile to consider an acceptable threshold value for achieving a win–win result from the “yield-environment” benefits of fertilization.

5. Conclusions

Green manure amendment increased the carbon pool index (CPI) and reduced the carbon management index (CMI) due to higher SOC and lower LOC contents. The impacts of fertilization and green manure amendment on CH4 emissions were both insignificant. The grain yield was remarkably affected by fertilization but not by green manure. Fertilization could increase the grain yield and reduce the methane emission intensity. These reveal that continuous green manure amendment is conducive to carbon sequestration but cannot replace the crucial role of N fertilizer in rice production. The mechanism of soil carbon turnover under continuous green manure amendment should be of concern for future research endeavors. The effect of ryegrass amendment on methane emissions also deserves attention due to the increased methanogenic genes.

Author Contributions

Conceptualization, L.Y. and L.X. (Lihong Xue); methodology, P.H.; validation, L.X. (Lihong Xue) and L.Y.; formal analysis, P.H. and J.W.; investigation, P.H. and L.X. (Lixiang Xue); data curation, P.H.; writing—original draft preparation, P.H.; writing—review and editing, P.H., J.W., E.P. and L.X. (Lihong Xue); supervision, L.Y. All authors have read and agreed to the published version of the manuscript.

Funding

This research was funded by the National Key Research and Development Program of China under the numbers of 2021YFD1700803 and 2017YFD0300104, the National Natural Science Foundation of China under number 42077092, and Jiangsu Carbon Peak Carbon Neutrality Science and Technology Innovation Fund under number BE2022308.

Conflicts of Interest

The authors declare no conflict of interest.

References

  1. Lal, R. Soil carbon sequestration impacts on global climate change and food security. Science 2004, 304, 1623–2627. [Google Scholar] [CrossRef] [Green Version]
  2. Jarecki, M.K.; Lal, R. Crop management for soil carbon sequestration. Crit. Rev. Plant Sci. 2003, 22, 471–502. [Google Scholar] [CrossRef]
  3. Oechaiyaphum, K.; Ullah, H.; Shrestha, R.P.; Datta, A. Impact of long-term agricultural management practices on soil organic carbon and soil fertility of paddy fields in Northeastern Thailand. Geoderma Reg. 2020, 22, e00307. [Google Scholar] [CrossRef]
  4. Haynes, R.J. Labile organic matter fractions as central components of the quality of agricultural soils: An overview. In Advances in Agronomy; Academic Press: Cambridge, MA, USA, 2005; pp. 221–268. [Google Scholar]
  5. Lenka, S.; Choudhary, R.; Lenka, N.K.; Saha, J.K.; Amat, D.; Patra, A.K.; Gami, V.; Singh, D. Nutrient management drives the direction and magnitude of nitrous oxide flux in crop residue-returned soil under different soil moisture. Front. Environ. Sci. 2022, 10, 857233. [Google Scholar] [CrossRef]
  6. Hurisso, T.T.; Culman, S.W.; Horwath, W.R.; Wade, J.; Cass, D.; Beniston, J.W.; Bowles, T.M.; Grandy, A.S.; Franzluebbers, A.J.; Schipanski, M.E.; et al. Comparison of permanganate-oxidizable carbon and mineralizable carbon for assessment of organic matter stabilization and mineralization. Soil Sci. Soc. Am. J. 2016, 80, 1352–1364. [Google Scholar] [CrossRef]
  7. Kim, S.Y.; Gutierrez, J.; Kim, P.J. Unexpected stimulation of CH4 emissions under continuous no-tillage system in mono-rice paddy soils during cultivation. Geoderma 2016, 267, 34–40. [Google Scholar] [CrossRef]
  8. Lenka, S.; Lenka, N.K.; Singh, R.C.; Manna, M.C.; Misra, A.K.; Rautaray, S.K. Tillage and manure induced changes in carbon storage and carbon management index in soybean-wheat cropping system in the vertisols of central India. Natl. Acad. Sci. Lett. 2015, 38, 461–464. [Google Scholar] [CrossRef]
  9. Carlson, K.M.; Gerber, J.S.; Mueller, N.D.; Herrero, M.; MacDonald, G.K.; Brauman, K.A.; Havlik, P.; O’Connell, C.S.; Johnson, J.A.; Saatchi, S.; et al. Greenhouse gas emissions intensity of global croplands. Nat. Clim. Chang. 2017, 7, 63–68. [Google Scholar] [CrossRef]
  10. Seck, P.A.; Diagne, A.; Mohanty, S.; Wopereis, M.C.S. Crops that feed the world 7: Rice. Food Secur. 2012, 4, 7–24. [Google Scholar] [CrossRef]
  11. Hong, X.; Ma, C.; Gao, J.; Su, S.; Li, T.; Luo, Z.; Duan, R.; Wang, Y.; Bai, L.; Zeng, X. Effects of different green manure treatments on soil apparent N and P balance under a 34-year double-rice cropping system. J. Soils Sediments 2019, 19, 73–80. [Google Scholar] [CrossRef]
  12. Hou, P.; Xue, L.; Wang, J.; Petropoulos, E.; Deng, X.; Qiao, J.; Xue, L.; Yang, L. Continuous milk vetch amendment in rice-fallow rotation improves soil fertility and maintains rice yield without increasing CH4 emissions: Evidence from a long-term experiment. Agric. Ecosyst. Environ. 2022, 325, 107774. [Google Scholar] [CrossRef]
  13. Raheem, A.; Zhang, J.; Huang, J.; Jiang, Y.; Siddik, M.A.; Deng, A.; Gao, J.; Zhang, W. Greenhouse gas emissions from a rice-rice-green manure cropping system in South China. Geoderma 2019, 353, 331–339. [Google Scholar] [CrossRef]
  14. USDA. Carbon to Nitrogen Ratios in Cropping Systems; USDA NRCS East National Technology Support Center: Greensboro, NC, USA, 2011.
  15. Cai, Z.; Shan, Y.; Xu, H. Effects of nitrogen fertilization on CH4 emissions from rice fields. Soil Sci. Plant Nutr. 2007, 53, 353–361. [Google Scholar] [CrossRef]
  16. Banger, K.; Tian, H.; Lu, C. Do nitrogen fertilizers stimulate or inhibit methane emissions from rice fields? Glob. Chang. Biol. 2012, 18, 3259–3267. [Google Scholar] [CrossRef]
  17. Craine, J.M.; Morrow, C.; Fierer, N. Microbial nitrogen limitation increases decomposition. Ecology 2007, 88, 2105–2113. [Google Scholar] [CrossRef]
  18. Hobbie, S.E. Nitrogen effects on decomposition: A five-year experiment in eight temperate sites. Ecology 2008, 89, 2633–2644. [Google Scholar] [CrossRef]
  19. Lu, P.; Shan, Y.-H.; Yang, L.-Z.; Han, Y. Influence of green manure crop on nitrogen concentration in soil solution of paddy field and rice yield. Soils 2006, 38, 270–275. (In Chinese) [Google Scholar]
  20. Hou, P.; Yuan, W.; Li, G.; Petropoulos, E.; Xue, L.; Feng, Y.; Xue, L.; Yang, L.; Ding, Y. Deep fertilization with controlled-release fertilizer for higher cereal yield and N utilization in paddies: The optimal fertilization depth. Agron. J. 2021, 113, 5027–5039. [Google Scholar] [CrossRef]
  21. Liu, S.; Zhang, Y.; Lin, F.; Zhang, L.; Zou, J. Methane and nitrous oxide emissions from direct-seeded and seedling-transplanted rice paddies in southeast China. Plant Soil 2014, 374, 285–297. [Google Scholar] [CrossRef]
  22. Hou, P.; Yu, Y.; Xue, L.; Petropoulos, E.; He, S.; Zhang, Y.; Pandey, A.; Xue, L.; Yang, L.; Chen, D. Effect of long term fertilization management strategies on methane emissions and rice yield. Sci. Total Environ. 2020, 725, 138261. [Google Scholar] [CrossRef]
  23. Lu, R.K. Methods of Soil and Agro-Chemical Analysis; Chinese Agriculture Science and Technology Press: Beijing, China, 2000. (In Chinese) [Google Scholar]
  24. Blair, G.J.; Lefroy, R.D.B.; Lisle, L. Soil carbon fractions based on their degree of oxidation, and the development of a carbon management index for agricultural systems. Aust. J. Agric. Res. 1995, 46, 1459–1466. [Google Scholar] [CrossRef]
  25. Mosier, A.R.; Halvorson, A.D.; Reule, C.A.; Liu, X.J. Net global warming potential and greenhouse gas intensity in irrigated cropping systems in northeastern Colorado. J. Environ. Qual. 2006, 35, 1584–1598. [Google Scholar] [CrossRef] [PubMed] [Green Version]
  26. Dheri, G.S.; Nazir, G. A review on carbon pools and sequestration as influenced by long-term management practices in a rice–Wheat cropping system. Carbon Manag. 2021, 12, 559–580. [Google Scholar] [CrossRef]
  27. Yang, Z.; Zheng, S.; Nie, J.; Liao, Y.; Xie, J. Effects of long-term winter planted green manure on distribution and storage of organic carbon and nitrogen in water-stable aggregates of reddish paddy soil under a double-rice cropping system. J. Integr. Agric. 2014, 13, 1772–1781. [Google Scholar] [CrossRef] [Green Version]
  28. Wang, W.; Zhu, W. Soil retention of 15N in a simulated N deposition study: Effects of live plant and soil organic matter content. Plant Soil 2012, 351, 61–72. [Google Scholar] [CrossRef]
  29. Yao, Z.; Zheng, X.; Dong, H.; Wang, R.; Mei, B.; Zhu, J. A 3-year record of N2O and CH4 emissions from a sandy loam paddy during rice seasons as affected by different nitrogen application rates. Agric. Ecosyst. Environ. 2012, 152, 1–9. [Google Scholar] [CrossRef]
  30. Malyan, S.K.; Bhatia, A.; Kumar, A.; Gupta, D.K.; Singh, R.; Kumar, S.S.; Tomer, R.; Kumar, O.; Jain, N. Methane production, oxidation and mitigation: A mechanistic understanding and comprehensive evaluation of influencing factors. Sci. Total Environ. 2016, 572, 874–896. [Google Scholar] [CrossRef]
  31. Le Mer, J.; Roger, P. Production, oxidation, emission and consumption of methane by soils: A review. Eur. J. Soil Biol. 2001, 37, 25–50. [Google Scholar] [CrossRef]
  32. Kong, D.; Li, S.; Jin, Y.; Wu, S.; Chen, J.; Hu, T.; Wang, H.; Liu, S.; Zou, J. Linking methane emissions to methanogenic and methanotrophic communities under different fertilization strategies in rice paddies. Geoderma 2019, 347, 233–243. [Google Scholar] [CrossRef]
  33. Fan, X.; Yu, H.; Wu, Q.; Ma, J.; Xu, H.; Yang, J.; Zhuang, Y. Effects of fertilization on microbial abundance and emissions of greenhouse gases (CH4 and N2O) in rice paddy fields. Ecol. Evol. 2016, 6, 1054–1063. [Google Scholar] [CrossRef] [Green Version]
  34. Zhou, G.; Gao, S.; Xu, C.; Dou, F.; Shimizu, K.; Cao, W. Rational utilization of leguminous green manure to mitigate methane emissions by influencing methanogenic and methanotrophic communities. Geoderma 2020, 361, 114071. [Google Scholar] [CrossRef]
  35. Dash, P.K.; Roy, K.S.; Neogi, S.; Nayak, A.K.; Bhattacharyya, P. Gaseous carbon emission in relation to soil carbon fractions and microbial diversities as affected by organic amendments in tropical rice soil. Arch. Agron. Soil Sci. 2014, 60, 1345–1361. [Google Scholar] [CrossRef]
  36. Tegeder, M.; Masclaux-Daubresse, C. Source and sink mechanisms of nitrogen transport and use. New Phytol. 2018, 217, 35–53. [Google Scholar] [CrossRef] [PubMed] [Green Version]
  37. Ladha, J.K.; Pathak, H.; Krupnik, T.J.; Six, J.; van Kessel, C. Efficiency of fertilizer nitrogen in cereal production: Retrospects and prospects. In Advances in Agronomy; Academic Press: Cambridge, MA, USA, 2005; pp. 85–156. [Google Scholar]
  38. Ray, D.K.; Gerber, J.S.; MacDonald, G.K.; West, P.C. Climate variation explains a third of global crop yield variability. Nat. Commun. 2015, 6, 5989. [Google Scholar] [CrossRef] [PubMed] [Green Version]
  39. Zhang, Q.; Tang, W.; Peng, S.; Li, Y. Limiting factors for panicle photosynthesis at the anthesis and grain filling stages in rice (Oryza sativa L.). Plant J. 2022, 109, 77–91. [Google Scholar] [CrossRef]
Figure 1. Daily temperature and precipitation for the two sampling seasons.
Agronomy 12 01548 g001
Figure 2. Soil carbon management indices ((A), CPI; (B), L; (C), LI; (D), CMI) (means ± se) under fertilization and green manure amendment. Results were averaged across fertilization and green manure amendment treatment because there were no significant 2-way interactions. Different letter on the bars means the significant difference with confidence level set at 0.05.
Agronomy 12 01548 g002
Figure 3. CH4 emitting dynamics (means ± se) under green manure amendment with/without fertilization for the two sampling seasons ((A), 2019; (B), 2020).
Agronomy 12 01548 g003
Figure 4. Copy numbers of soil mcrA (A), pmoA (B) genes and mcrA/pmoA ratio (C) (means ± se) under fertilization and green manure amendment. Results were averaged across fertilization and green manure amendment treatment because there were no significant 2-way interactions. Different letter on the bars means the significant difference with confidence level set at 0.05.
Agronomy 12 01548 g004
Figure 5. Correlation analysis between grain yield, CH4 emissions and soil index. Red circle and blue circle refer to positive correlation and negative correlation, respectively. * p < 0.05.
Agronomy 12 01548 g005
Table 1. Fertilizer application method.
TreatmentN (kg ha1)P2O5 (kg ha1)K2O (kg ha1)
BasalTillingBootingTotalBasalTotalBasalTotal
RyegrassCK000081818181
NF41406915081818181
Milk vetchCK000081818181
NF41406915081818181
FallowCK000081818181
NF41406915081818181
Note: N in urea; P2O5 in calcium superphosphate; K2O in potassium chloride.
Table 2. Soil properties after rice harvest in 2020.
TreatmentpHSOC
(g kg−1)
TN
(g kg−1)
C/NLOC
(g kg−1)
AN
(mg kg−1)
RyegrassCK6.08 a14.67 a1.69 a8.65 bc3.61 b172.33 a
NF5.99 a13.53 abc1.53 b8.86 abc3.92 ab151.33 ab
Milk vetchCK6.22 a14.30 ab1.51 b9.43 a3.85 ab149.67 ab
NF5.99 a12.80 bc1.55 ab8.28 c4.00 ab131.90 b
FallowCK6.12 a12.27 c1.34 c9.17 ab4.22 a136.33 ab
NF6.03 a12.97 abc1.49 bc8.71 bc4.05 ab152.67 ab
F values
Fertilization (F)nsnsns7.92 *nsns
Green manure (M)ns4.13 *8.01 **nsnsns
F × Mnsns4.96 *5.68 *nsns
Note: CK, no N fertilizer control; NF, fertilization treatment; SOC, soil organic carbon content; TN, soil total N content; C/N, the ratio of SOC to TN; LOC, soil labile organic carbon content; AN, soil alkaline hydrolysis N content. Data followed by different letters are significantly different with confidence level set at 0.05. ns, not significant; * p < 0.05; ** p < 0.01.
Table 3. F values for the effects and the interaction effects of green manure amendment (M) and fertilization (F) on soil carbon management indices and the copies of mcrA and pmoA genes.
Soil FertilityFertilization (F)Green Manure (M)M × F
CPIns4.09 *ns
Lns4.20 *ns
LIns4.20 *ns
CMIns3.47 †ns
mcrAns3.61 †ns
pmoA7.99 *2.82 †ns
mcrA/pmoA4.08 †8.21 **ns
Note: ns, not significant; † p < 0.1; * p < 0.05; ** p < 0.01. The same below.
Table 4. Grain yields and CH4 emissions under fertilization and green manure amendment.
TreatmentYield
(t ha−1)
Average CH4
Emission Rate
(mg m−2 h−1)
Cumulative CH4 Emissions
(kg ha−1)
CH4 Emission/Yield
(g kg−1)
Fertilization (F)
CK5.02 b3.0781.2416.19 a
NF8.27 a3.53102.4812.36 b
Green manure (M)
Ryegrass6.433.73105.3416.99
Milk vetch6.853.0686.3312.89
Fallow6.653.1083.9112.94
Year (Y)
20197.13 a3.90 a119.63 a17.11 a
20206.15 b2.69 b64.09 b11.43 b
F values
Fertilization (F)90.01 ***ns4.04 †5.32 *
Green manure (M)nsnsnsns
Year (Y)8.21 **10.50 **27.57 ***11.69 **
F × Mnsnsnsns
F × Ynsnsnsns
M × Ynsnsnsns
F × M × Ynsnsnsns
Note: Data followed by different letters are significantly different with confidence level set at 0.05. ns, not significant; † p < 0.1; * p < 0.05; ** p < 0.01; *** p < 0.001.
Publisher’s Note: MDPI stays neutral with regard to jurisdictional claims in published maps and institutional affiliations.

