Article

Morphological and Physiological Characteristics of Rice Cultivars with Higher Yield and Nitrogen Use Efficiency at Various Nitrogen Rates

1
Rice Research Institute, Agronomy College, Shenyang Agricultural University, Shenyang 110866, China
2
Rice Research Institute of Northeast Agricultural University, Harbin 150038, China
3
Graduate School of Agricultural Science, Tohoku University, Sendai 981-8555, Japan
*
Authors to whom correspondence should be addressed.
These authors contributed equally to this work.
Agronomy 2022, 12(2), 358; https://doi.org/10.3390/agronomy12020358
Submission received: 6 January 2022 / Revised: 27 January 2022 / Accepted: 27 January 2022 / Published: 31 January 2022
(This article belongs to the Special Issue Advances in Rice Physioecology and Sustainable Cultivation)

Abstract

:
An understanding of the leaf and root traits associated with high nitrogen (N) absorption and utilization is very important in the development of N-efficient varieties in crop breeding programs. However, in rice, the relations between these traits and nitrogen use efficiencies (NUEs) have yet to be identified. Therefore, the responses of leaf and root traits and yields of the three main japonica rice cultivars in northern China were examined at a range of N application rates. The rice cultivars, Shennong 265 (SN265), Tiejing 11 (TJ11), and Fengjing (FJ), were grown in the field at six N rates (0, 60, 120, 180, 240, and 300 kg ha−1) applied during two growing seasons (2018 and 2019). With the increase in N rate, the grain yield of SN265 and TJ11 increased, whereas the grain yield of FJ first increased and then decreased. The grain yield of FJ was higher than that of SN265 and TJ11 at lower N rates, whereas the grain yields of SN265 and TJ11 were higher than that of FJ at higher N rates. The NUEs decreased with the increase in N rates. At lower N rates, the ability of rice to obtain N was the main limitation on rice yield, but with the increase in N rates, the limitation on yield due to N absorption capacity gradually weakened. However, at higher N rates, rice yields were restricted by the ability to utilize N. Compared with TJ11 or FJ, SN265 had higher N utilization capacity primarily because of its higher Rubisco activity, NR activity, GS activity, and ROA. Compared with SN265 or TJ11, FJ had a higher N absorption capacity that was attributed to its larger root architecture, which might have also been one of the reasons for lower N utilization. Therefore, by improving N absorption and utilization-related leaf and root traits, high yields and NUEs can be achieved in rice production at different N application rates.

1. Introduction

Nitrogen (N) is an essential macronutrient for plant growth and development that is important in cell composition and energy metabolism [1,2]. Rice is the most important food crop worldwide, and its sustainable development is essential to ensure global food security. Under the severe situation of increasing populations and decreasing cultivated area contradictions, rice yield has steadily increased because of improved rice varieties, advanced cultivation techniques, and increased production inputs. One effective measure to increase rice yields is to increase N inputs [3,4]. However, behind the substantial increase in rice production, especially in the single-season rice area in northeastern China, excessive and unreasonable N fertilizer inputs have also caused several problems, such as reduced N fertilizer utilization, increased production costs, and environmental pollution, that seriously restrict the development of sustainable rice production [5,6].
How to improve the efficiency of N absorption and utilization in rice while simultaneously increasing the yield has been the focus of extensive research. However, N use is a very complex biological process that includes absorption, transport, and assimilation [7,8,9], and despite the research focus, many theoretical issues remain that need to be studied. First, how do N absorption and utilization interact physiologically? On the basis of high N absorption levels, can high N utilization be coordinated to improve the interaction? Second, what is the biological basis of NUE in rice? Nitrogen use efficiency (NUE) is expressed in the mass of plant dry matter produced per unit of nitrogen and is the result of the coordination between carbon (C) and N metabolism during plant growth and development. It is critical that the effects and mechanisms of N fertilizer on the C and N metabolism of rice are better understood to coordinate metabolic processes and increase yields [10,11,12,13,14]. Third, how can the efficient uptake of N in rice be improved? In previous studies, the focus has been on the genes related to N absorption and transport. However, these approaches are insufficient to fully understand N absorption, because it is also regulated by root morphology, C and N metabolism, the amino-acid cycle, and other biological processes [15,16,17].
The root system is an important organ that absorbs and transports N, directly utilizes soil nutrients, and is an important contributor to rice yield [18,19]. Previous studies have shown that regulation of root morphophysiological characteristics can improve N uptake and utilization, thereby improving crop yield and nutrient efficiency in agricultural systems [9,18]. Root morphology, root phytohormones, spatial distribution in soil, root activity, and root tip cell state play important roles in root function [18,19]. Much attention has been paid to improving grain yield by improving root distribution, structure, and function in modern rice varieties. However, little is known about the effects of N supply on morphophysiological characteristics and their relationship to N acquisition and grain yield formation throughout the growth cycle.
Northeastern China is an important commercial grain base and is also the largest production area of high-quality japonica rice. However, the NUE of rice remains at a relatively low level overall, indicating that absorption and utilization are not synchronized. Therefore, it is urgent to explore the physiological mechanisms of N absorption and utilization to simultaneously improve them and develop rice with both high yields and N use efficiency. In this study, the grain yield and NUE of three rice cultivars with similar growth periods, Shennong 265 (SN265), Tiejing 11 (TJ11), and Fengjing (FJ), were examined at different N application rates in a field test. The relations between leaf and root morphological and physiological characteristics, yield, and NUE were analyzed. The aim of the study was to obtain insights into the mechanisms underlying high grain yield and high NUE in rice and then provide breeders with information to develop N-efficient cultivars without sacrificing grain yield potential.

2. Materials and Methods

2.1. Plant Materials and Site Description

Field experiments were conducted on a farm at Shenyang Agricultural University (41°49′ N, 123°34′ E) during the rice-growing season (April to October) in 2018 and 2019. Three japonica rice cultivars with similar growth periods (155 d) were examined in the study: Shennong 265 (SN265), Tiejing 11 (TJ11), and Fengjing (FJ), which were the main rice cultivars in northern China. The average air temperature, sunshine hours, precipitation, and relative humidity during the rice-growing season in each study year were measured at a weather station near the experimental site (Figure 1).

2.2. Experimental Design

The experiment was arranged in a completely randomized block design with three replications. The seeds were sown on 24 April 2018 and 23 April 2019. At the four-leaf heart stage, seedlings with similar growth were selected and transplanted on 25 May in both years, at a hill spacing of 13.3 × 30.0 cm, with two seedlings per hill. The plot size was 45 m2 in both years. Plots were separated at their perimeters by a polyvinyl chloride partition (0.14 cm thick, with 40.0 cm aboveground and 25 cm belowground) to prohibit the exchange of irrigation water and fertilizer between plots. The tests included six N application rate treatments: 0, 60, 120, 180, 240, and 300 kg ha−1. The N was applied as urea (46%) as a basal fertilizer (36% of the total) and at tillering (24%) and panicle (40%) stages. Phosphorous (112.5 kg P2O5 ha−1) was applied in the basal fertilizer, and potassium (56.25 kg K2O ha−1) was applied in the basal fertilizer and at the panicle stage. With the exception of the different N fertilizer application rates, the other cultivation requirements were identical for all plots in both years. To avoid yield losses, chemicals were used to control weeds, diseases, and insects.

2.3. Sampling and Measurements

2.3.1. Leaf Photosynthesis and Physiological Variables

At the heading stage, the latest full-grown leaves on the main plant stems were collected from six representative hills in each plot to examine the differences in contents of compounds and activities of key enzymes. The leaf N content was determined with an elemental analyzer (Elementar Vario MACRO cube, Hanau, Germany). The Rubisco content was determined by formamide extraction of SDS–PAGE-separated, Coomassie Brilliant Blue R-250-stained bands corresponding to the large and small subunits of Rubisco [20]. The soluble sugar content was determined by the anthrone colorimetric method [21], and the sucrose content was determined according to Zhang and Qu [22]. The activity of nitrate reductase (NR) was determined by absorbance at a wavelength of 340 nm according to Gibon et al. [23]. The activity of glutamine synthetase (GS) was determined according to Sun et al. [19], extracts were incubated in a medium containing 50 mM HEPES/KOH, pH 7.5, 10% (v/v) glycerol, 10 mM MgCl2, 2 mM EDTA, 0.2 mM NaVO3, 40 mM 5′,5′-diadenosinpentaphosphate, 2 mM ammonium chloride, 5 mM ATP, 1 mM phosphoenolpyruvate, 0.6 mM NADH, 1 unitmL1 PK, 0.7 unitmL1 lactate dehydrogenase, and 0 (blank) or 45 mM (maximal activity) glutamate. The absorbance was then read at 340 nm until the rate was stabilized (20 to 30 min). The activity of Rubisco was determined according to SDS–PAGE-separated, Coomassie Brilliant Blue R-250-stained bands with bovine serum albumin (BSA) as the standard [24]. The activity of sucrose phosphate synthase (SPS) was determined according to spectrophotometry [25]. The photosynthetic rate (Pn) of full-grown leaves on the main plant stems was measured from 0900 to 1100 using a CIRAS-3 portable photosynthetic instrument (PP Systems, Amesbury, MA, USA). During measurements, leaf temperature was maintained at 27 °C, leaf chamber humidity was maintained at 48% to 50%, and the photosynthetic photon flux density was 1200 μmol m−2 s−1. Photosynthetic nitrogen-use efficiency (PNUE, μmol g−1 s−1) was calculated as follows [9]:
PNUE   =   P n Leaf   N   content

2.3.2. Root Morphology and Physiological Variables

At the heading stage, to examine root morphology and physiological variables, roots were sampled with a cube-shaped sample core (20 cm length × 20 cm width × 40 cm depth) around individual hills. Six representative hills were sampled in each treatment. Total root length (RL) was measured with WinRHIZO Pro 2013e software (Regent Instruments Inc., Quebec, Canada), and then, roots were oven dried at 80 °C to a constant weight to measure root dry weight (RDW). The root N content was determined with an elemental analyzer (Elementar Vario MACRO cube, Hanau, Germany). The free amino acid content of roots was determined according to Cao et al. [26]. The root oxidation activity (ROA) was determined using triphenyl tetrazolium chloride. [27]. The activity of nitrate reductase (NR) was determined according to Gibon et al. [23]. The activity of glutamine synthetase (GS) was determined according to Sun et al. [19].

2.3.3. Grain Yield and Nitrogen Use Efficiency

At maturity, grain yield was determined, except for border plants, within a 1-m2 area (three replicates) in each plot, and adjusted to the moisture content of 0.14 g H2O g−1 fresh weight. The plants in nine representative hills of each plot were sampled to determine the yield components. Plant samples from each hill were separated into straw and panicles. The panicle number of each hill was recorded to determine the panicle number per hectare. Filled and unfilled grains of the panicles were manually separated to measure the grain number per panicle and the seed-setting rate. The dry weights of rachis, filled and unfilled grains, and straw were determined after oven drying at 70 °C to a constant weight. Randomly selected filled grains from each hill were used to determine the 1000-grain weight. Tissue N content was determined with an elemental analyzer to calculate aboveground N uptake. Total N accumulation (kg ha−1) was the total amount of N accumulated in a plant at maturity. The N agronomic use efficiency (NAE, kg kg−1), N recovery efficiency (NRE, %), and N physiological efficiency (NPE, kg kg−1) were calculated as follow [28]:
NAE   =   Y N Y 0 T N
NRE = U N U 0 T N
NPE = Y N Y 0 U N U 0
where Y0 and U0 are the grain yield (kg ha−1) and the N accumulation in aboveground biomass at maturity (kg ha−1) of the N0 treatment, respectively; YN and UN are the grain yield (kg ha−1) and the N accumulation in aboveground biomass at maturity (kg ha−1) of the N application treatment, respectively; TN is the total N (kg ha−1) per application treatment.

2.4. Statistical Analysis

For experimental variables, one-way of variance (ANOVA) was applied to assess differences among treatments with SPSS 22.0 (Softonic International, Barcelona, Spain) software. Significant differences (p < 0.05) between treatments are indicated by different letters according to Fisher’s LSD. Graphs were drawn with the Origin 2018 software (OriginLab, Northampton, MA, USA).

3. Results

3.1. Grain Yield and Yield Components

The grain yield of SN265 and TJ11 increased with increasing N rate, whereas the grain yield of FJ first increased and then decreased with the increasing N rate and had the highest grain yield at 180 (in 2018) or 240 (in 2019) kg ha−1 (Figure 2). Compared with SN265 or TJ11, FJ had higher yields at the N rates 0, 60, and 120 kg ha−1. Compared with TJ11 or FJ, SN265 had higher grain yields at the N rates 180, 240, and 300 kg ha−1. At the highest N rate (300 kg ha−1), the grain yields of SN265 and TJ11 were higher than that of FJ, which was mainly attributed to either a more stable seed setting rate or a higher 1000-grain weight (Table 1).

3.2. Nitrogen Uptake and Utilization Efficiency

The NRE, NPE, and NAE decreased with increasing N rate in all cultivars (Table 2). The NRE of FJ was significantly higher than that of SN265 or TJ11 at each N rate. The NPE of SN265 was significantly higher than that of TJ11 or FJ at each N rate. The NAE of SN265 was significantly higher than that of TJ11 or FJ at the N rates 180, 240, and 300 kg ha−1. On the basis of the NRE, we divided the three rice cultivars into one N-efficient absorption type (FJ) and two N-inefficient absorption types (SN265 and TJ11). On the basis of the NPE, we divided the three cultivars into one N-efficient utilization type (SN265), one moderately N-efficient utilization type (TJ11), and one N-inefficient utilization type (FJ).

3.3. Leaf Photosynthesis and Physiology

The leaf N content increased and the PNUE decreased with increasing N rate in all cultivars (Figure 3). In 2018, the Pn of SN265 and TJ11 increased with increasing N rate. In 2019, the Pn of TJ11 and FJ first increased and then decreased with the increasing N rate, with the highest values at 240 kg ha−1 (Figure 3).
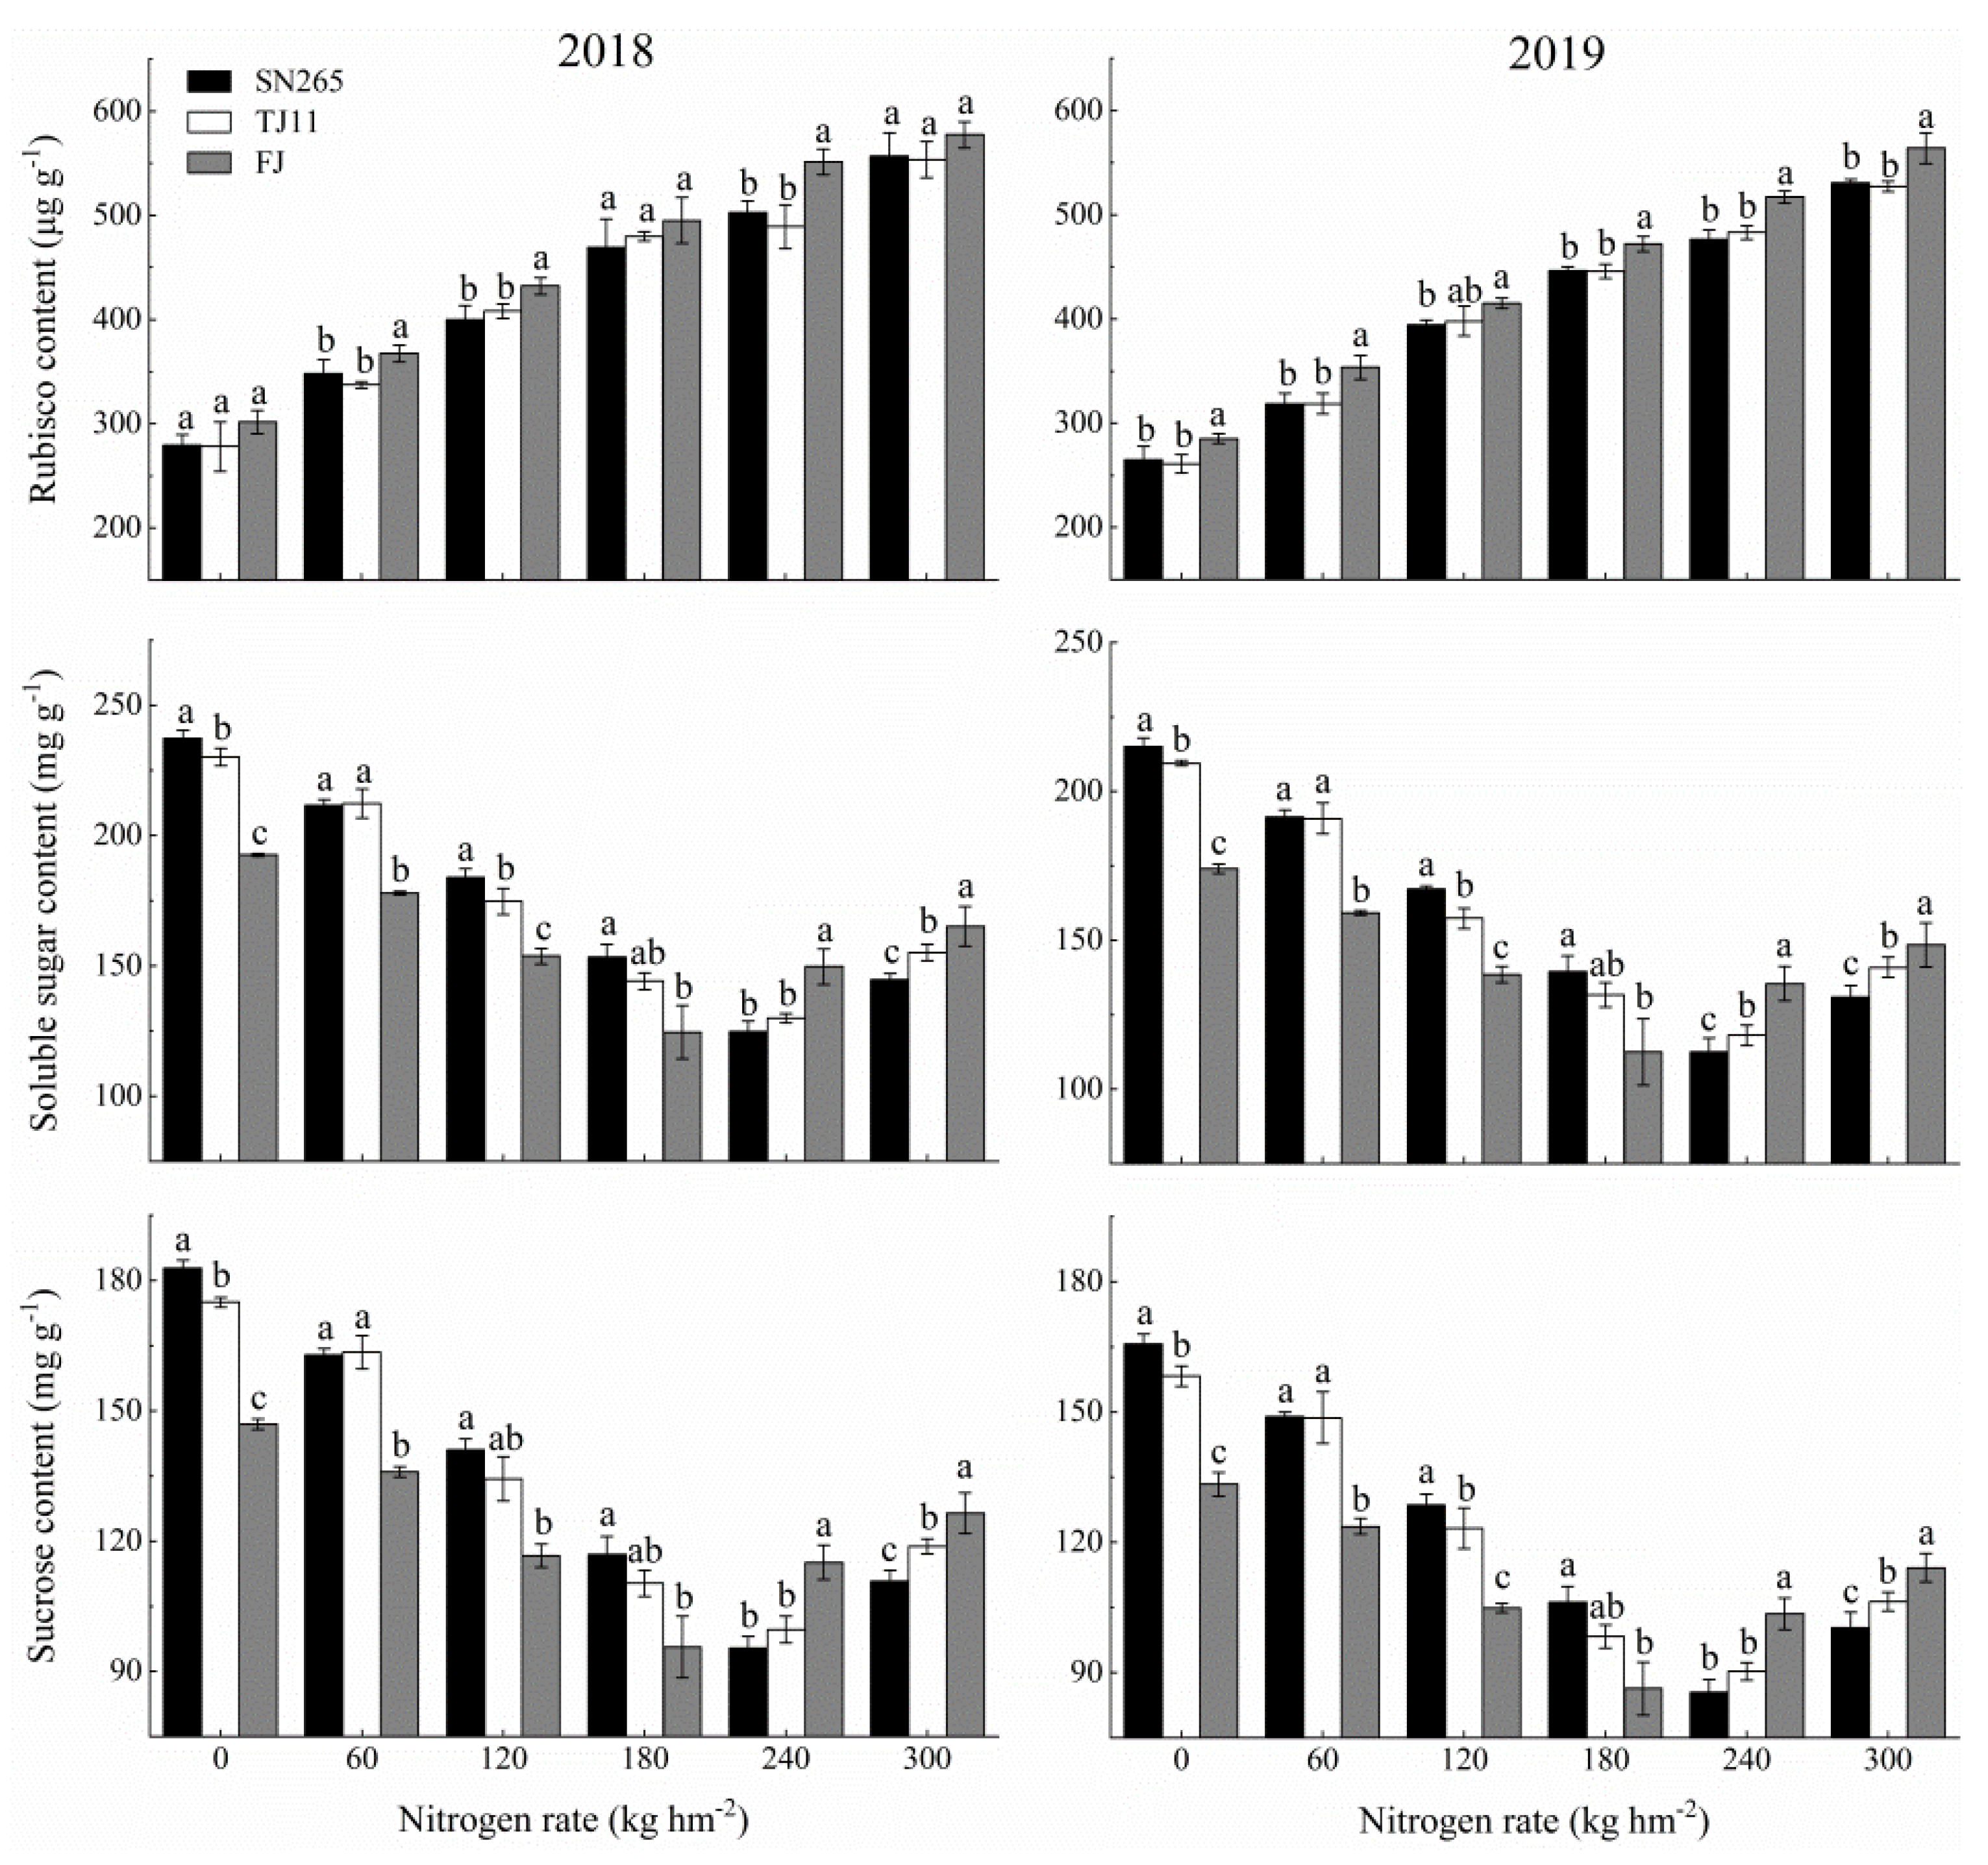
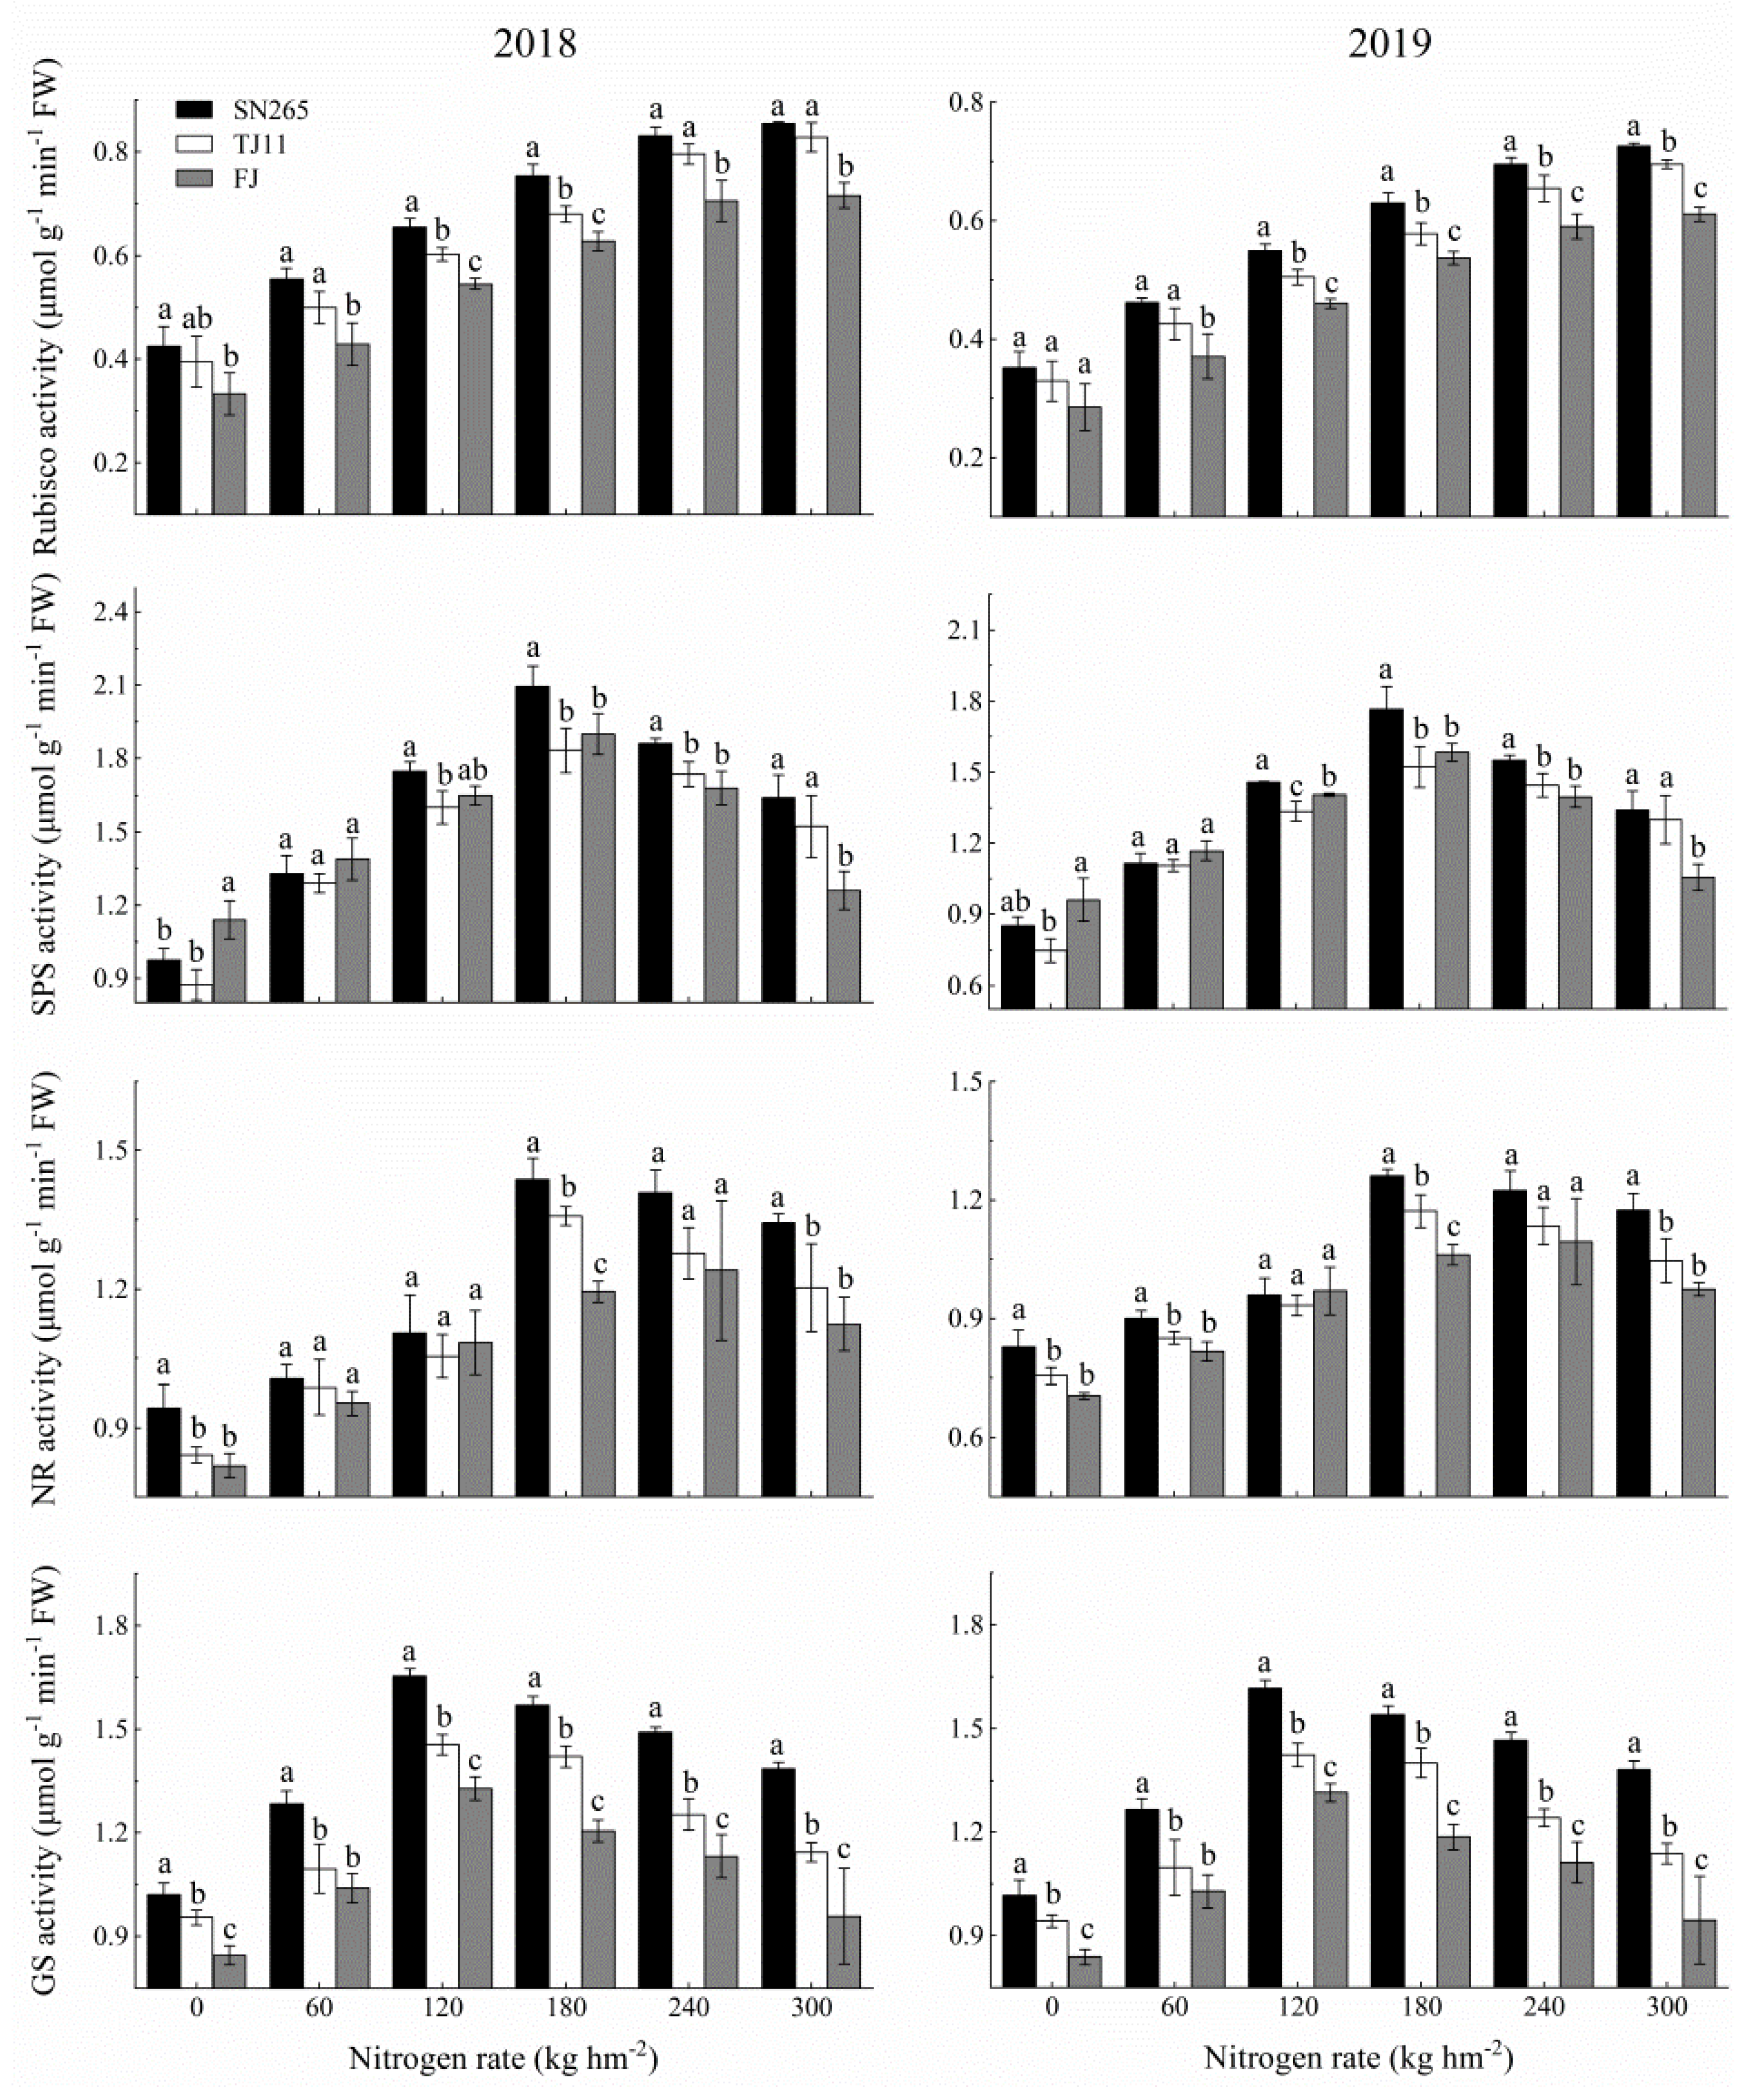
The soluble sugar and sucrose contents first decreased and then increased with increasing N rate (Figure 4). In SN265 and TJ11, the contents were lowest at 240 kg ha−1, whereas in FJ, the contents were lowest at 180 kg ha−1. The leaf Rubisco content (Figure 4) and activity (Figure 5) increased with increasing N rate in all cultivars (Figure 4). Leaf SPS, NR, and GS activities first increased and then decreased with increasing N rate in all cultivars (Figure 5).
In a comparison of the cultivars, at each N rate, the leaf N and Rubisco contents in FJ were higher than those in SN265, whereas the PNUE and Rubisco, NR, and GS activities of SN265 were higher than those in FJ. The Pn and SPS activity in FJ were higher than those in SN265 at 0 and 60 kg ha−1, whereas the Pn and SPS activity in SN265 were significantly higher than those in FJ at 180, 240, and 300 kg ha−1. The soluble sugar and sucrose contents in SN265 were significantly higher than those in FJ at 0, 60, 120, and 180 kg ha−1, whereas the soluble sugar and sucrose contents in FJ, were significantly higher than those in SN265 at 240 and 300 kg ha−1.

3.4. Root Morphological and Physiological Characteristics

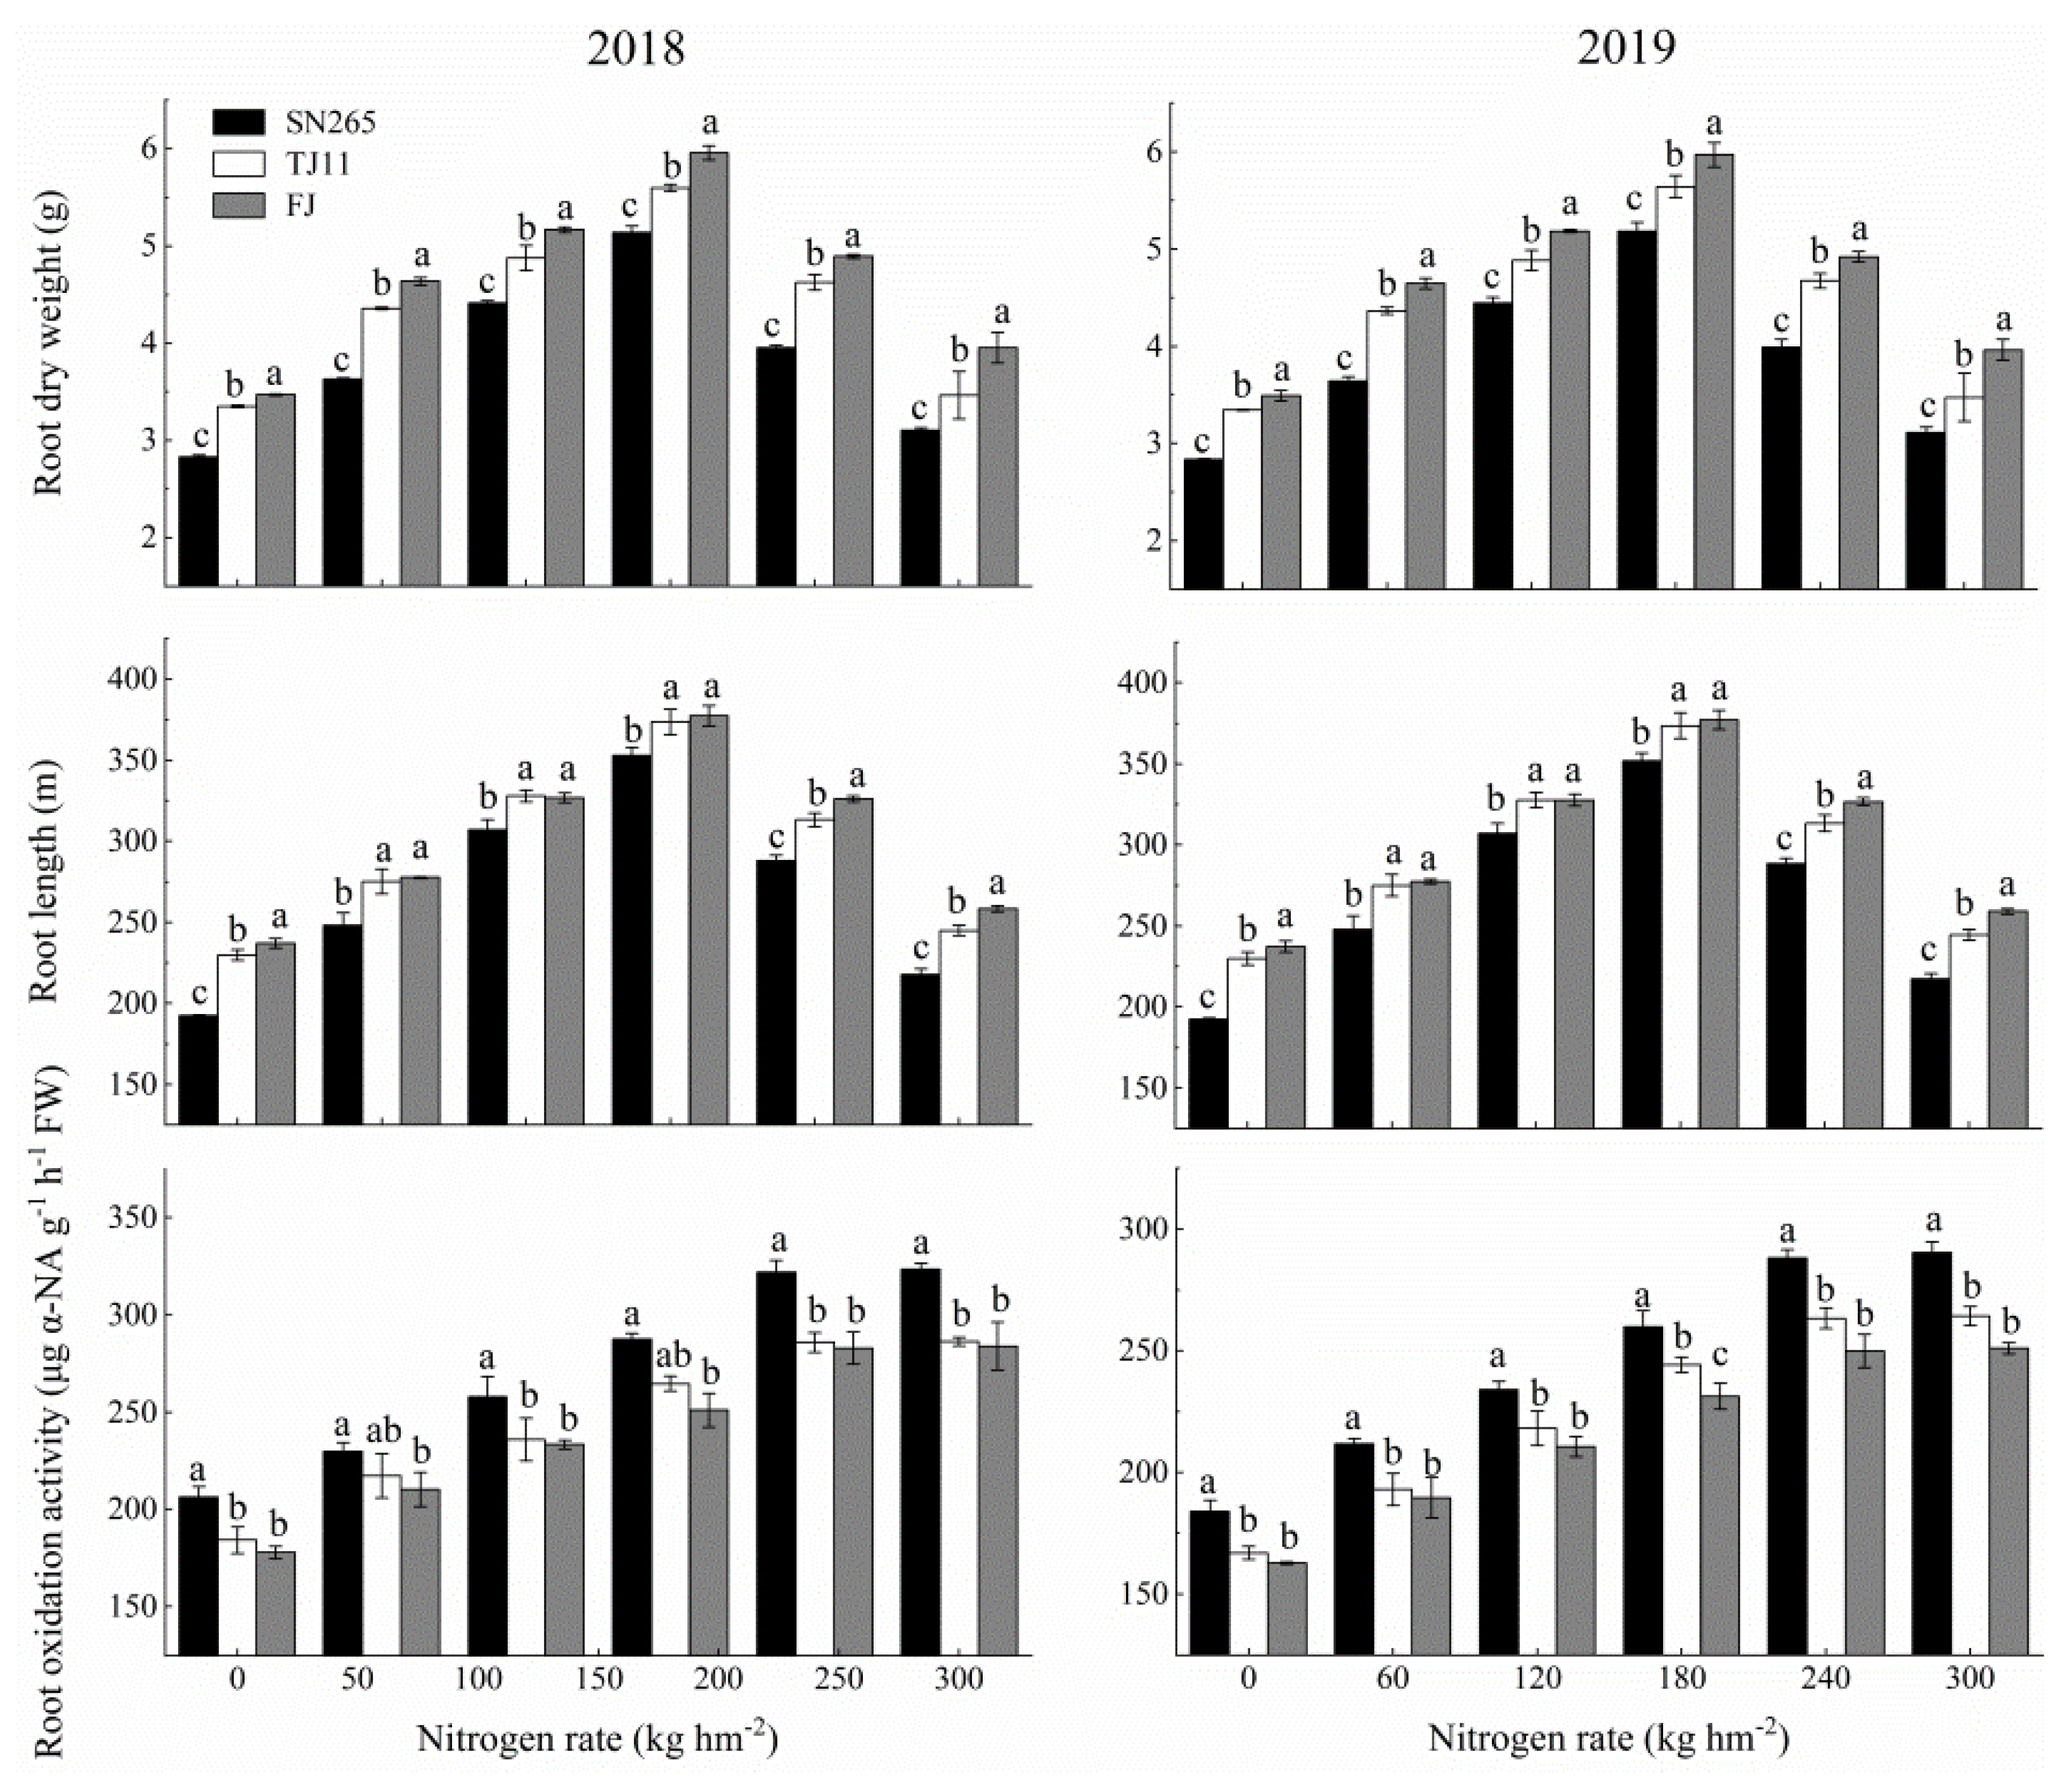
At heading, the RL and RDW first increased and then decreased with increasing N rate, with the highest values at 180 kg ha−1 in all cultivars (Figure 6). The ROA at heading first increased and then remained stable with the increase in N rate (Figure 6).
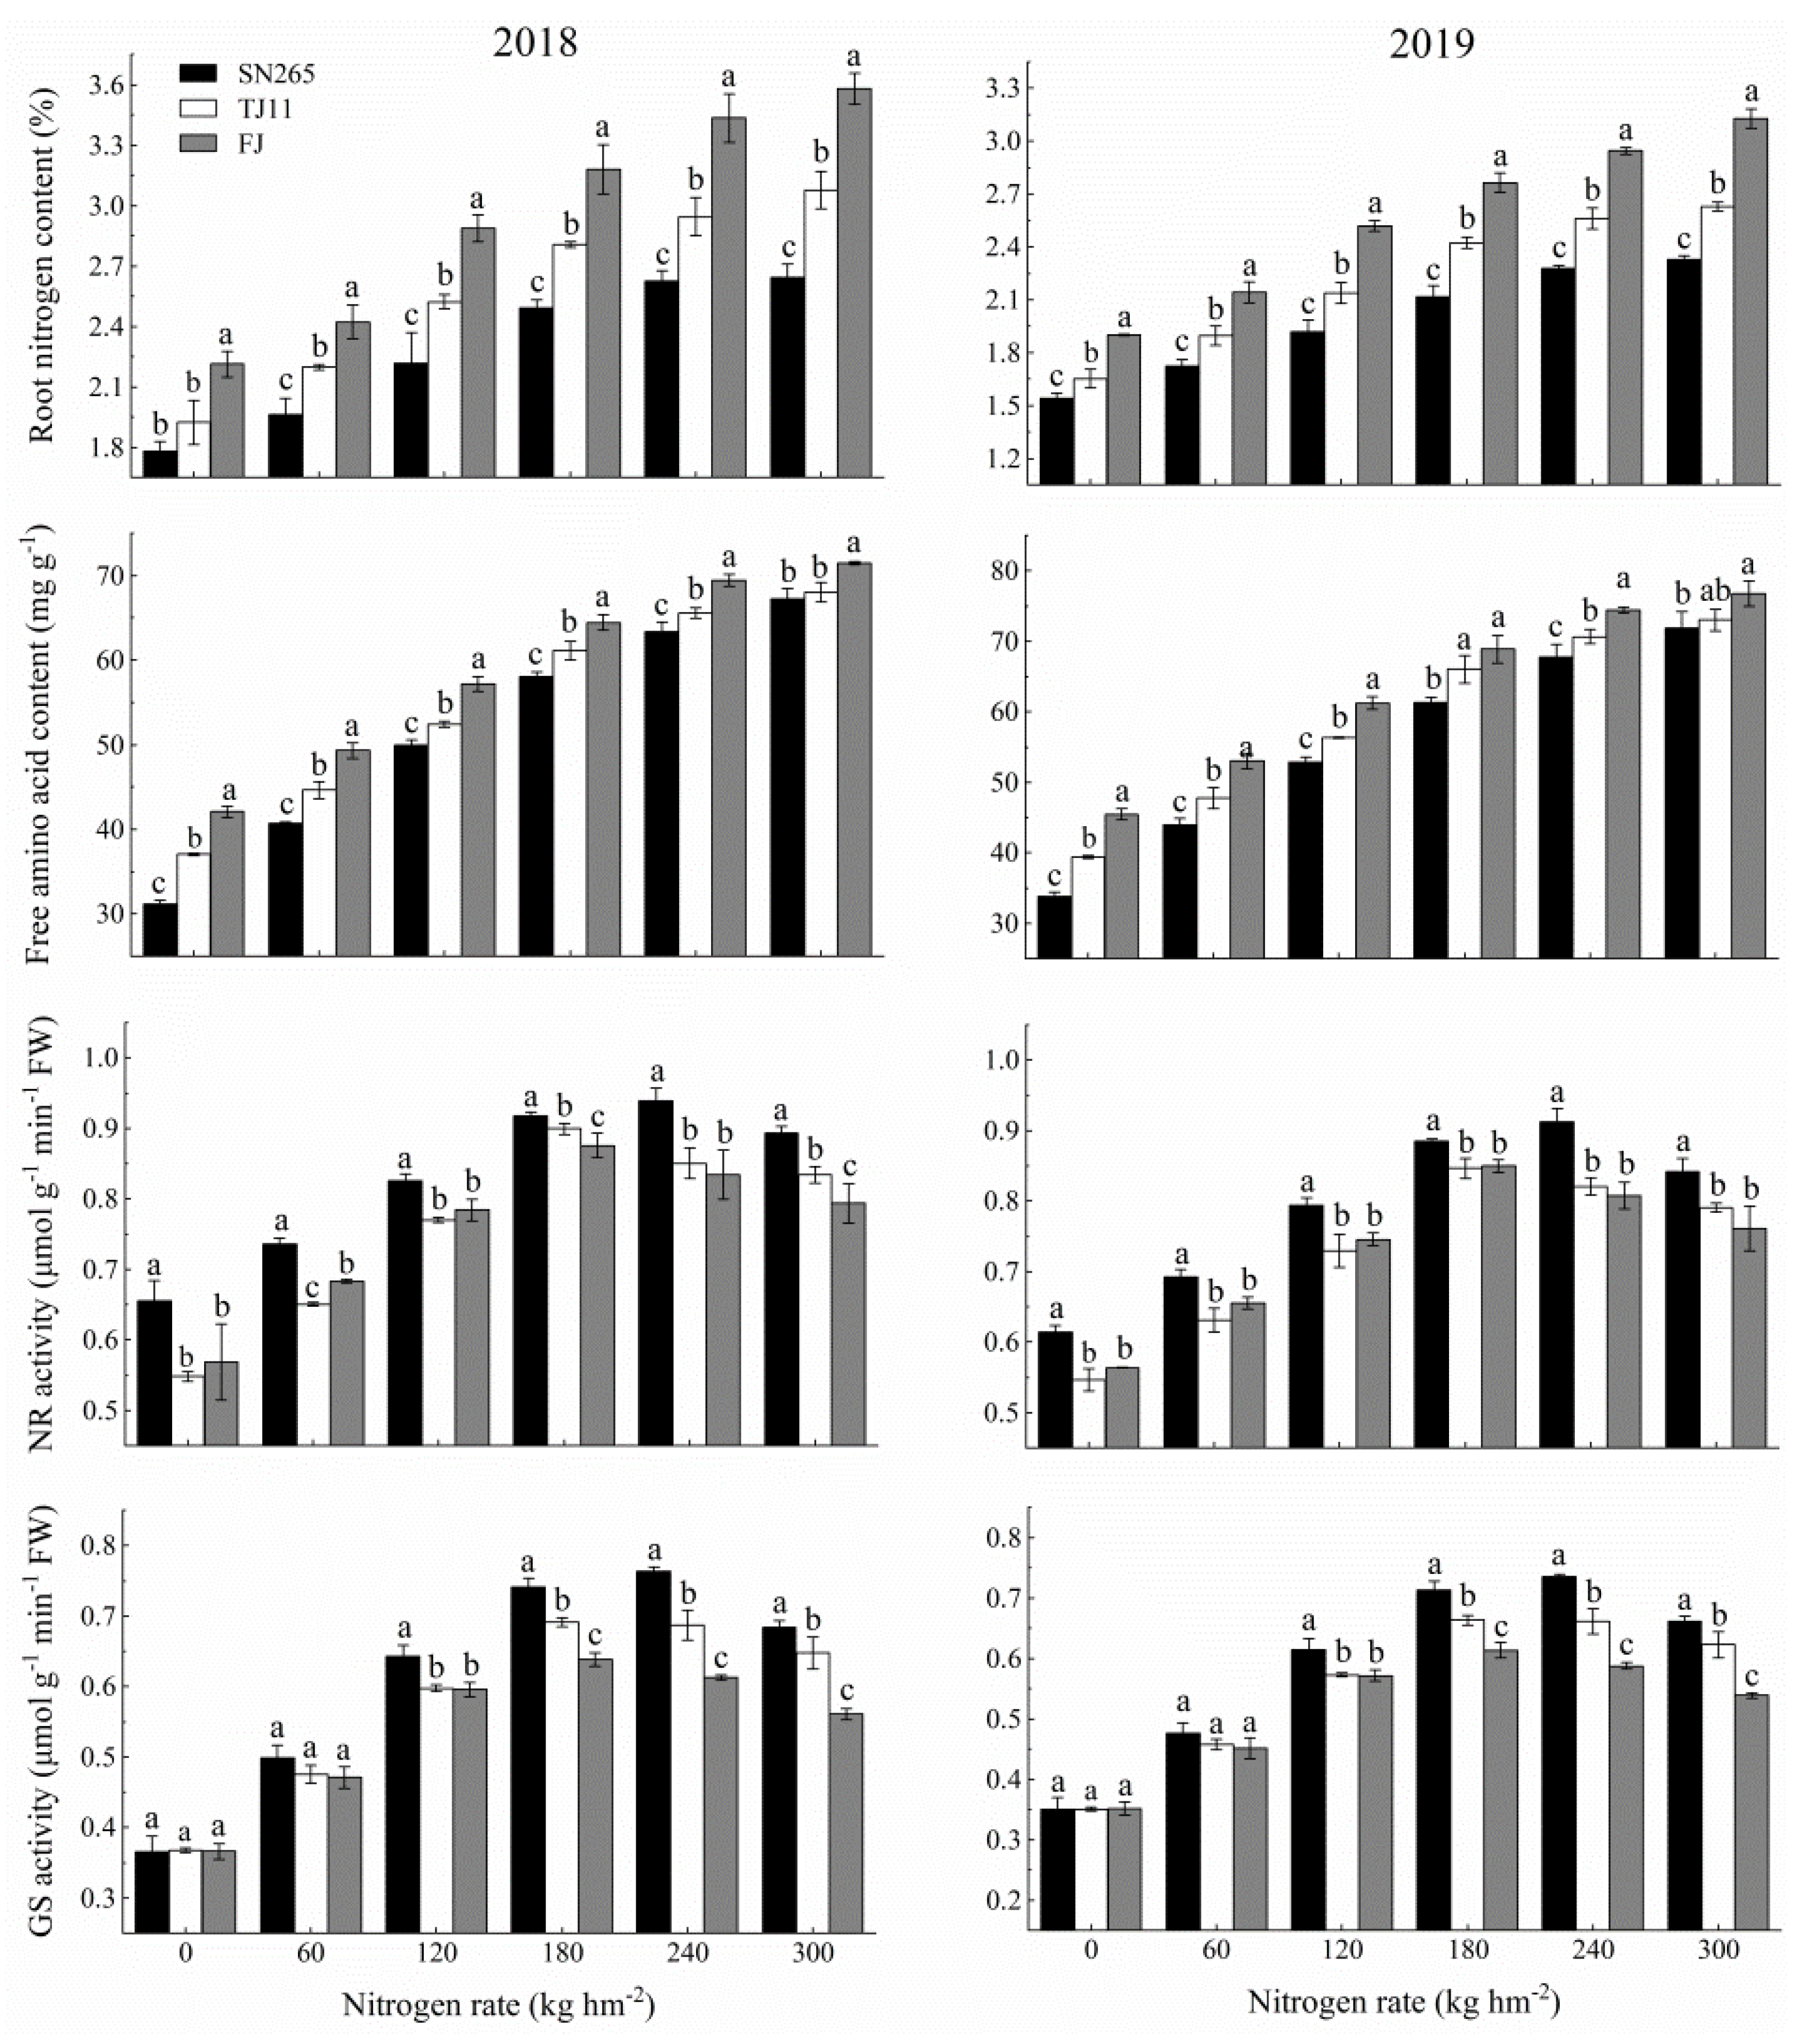
The root N and free amino acid contents increased with increasing N rate in all cultivars (Figure 7). Root NR and GS activities first increased and then decreased with increasing N rate, with the highest values at 180 kg ha−1 in TJ11 and FJ and at 240 kg ha−1 in SN265. In a comparison of the cultivars, at each N rate, the root N content, free amino acid content, RL, and RDW in FJ were significantly higher than those in SN265, whereas the ROA and NR and GS activities in SN265 were higher than those in FJ.

4. Discussion

Nitrogen is one of the three major chemical fertilizers applied in rice production, and its application level, timing, and management mode significantly affect rice yield and NUE [9,29,30,31,32]. In the current study, the responses of the three cultivars to different N rates were significantly different. With the increase in N application rate, the grain yield of SN265 and TJ11 increased, whereas, in FJ, yield first increased and then decreased. The NUEs decreased with the increase in N rates, which is consistent with the results of previous studies [9,20,33]. NUE is a measure of the relation in plants between N absorption from soil and N utilization [7,8]. Soil nutrient status and N fertilizer availability affect rice yield and NUE [34,35]; therefore, this study mainly focused on the response of morphological and physiological characteristics of rice varieties with different N efficiencies to nitrogen fertilizer supply, analyzed the biological basis of N uptake and utilization in rice, and provided a theoretical basis for improving rice yield and NUE. In the current study, at lower N rates, rice yield was primarily limited by the ability of rice to obtain N, but with the increase in N rates, that limitation on yield gradually weakened. At higher N rates, rice yield was limited by the ability of rice to utilize N. These results indicate that rice cultivars with higher N utilization can achieve higher yields than those with higher N absorption, in a background of high N fertilizer inputs in agricultural production.
Carbon and nitrogen metabolism are two of the most important basic metabolic pathways in plants [14], and both are essential for rice growth and yield [9,10,11,12,36,37,38]. Photosynthesis reflects C metabolism in plants, which is closely related to the formation of rice yield [29,39,40]. In the current study, when N rates increased within an appropriate range, the Pn increased significantly, but at higher N rates, the Pn did not continue to increase and even decreased. The higher Pn in FJ at lower N rates was primarily attributed to either greater leaf N or Rubisco content, indicating that rice cultivars with higher N absorption capacity can better adapt to low-N stress. The key enzymes of photosynthesis and chlorophyll are the main forms of nitrogen in leaves. The content of the Rubisco enzyme is significantly positively correlated with nitrogen content in leaves, and the activity of the Rubisco enzyme is closely related to the photosynthetic productivity of rice. Studies by Li et al. [20] have shown that the main factor limiting the growth of photosynthetic rate under high nitrogen is the reduction in Rubisco enzyme activity. Notably, with the increase in N rate, the degree of Rubisco activation continued to decrease, indicating that at higher N rates, the inactivated Rubisco was an N pool and did not perform the corresponding biological function. Therefore, improving the activation of leaf Rubisco may improve NUE and achieve higher yields under higher nitrogen inputs.
To realize the high yield and economic value of rice, high photosynthetic capacity is required, and the photosynthetic products need to be transported and distributed to meet growth needs. Sucrose phosphate synthase is a key regulator of sucrose metabolism, which is closely related to dry matter accumulation and yield formation in rice. In this study, at the lower N rates (except at 0 N in 2018), the SPS activity in FJ was significantly higher than that in SN265, while at the higher N rates, the activity in SN265 was significantly higher than that in FJ. In addition, the soluble sugar and sucrose contents in leaves decreased from the 0 N rate to 180 or 240 kg ha−1 and then increased. The primary role of these sugars is to balance the osmotic pressure in rice leaves. This indicates that neither too low nor too high nitrogen input is suitable for rice growth, and rice needs to coordinate a part of carbon assimilation to maintain the physiological state of leaves, implying that there is an obvious relationship between plant growth and resistance. The N assimilation-related enzymes NR and GS are key enzymes that limit N metabolism in rice [32,41]. The NR and GS activity in leaves of nitrogen-efficient rice varieties was significantly higher than that of nitrogen-inefficient rice varieties, high N rates can increase the activities of NR and GS in rice leaves [42]. In this study, the activities of NR and GS first increased and then decreased with the increase in N rates in both leaves and roots of all cultivars. However, there were differences among genotypes, and the N-efficient utilization cultivar (SN265) had the highest NR and GS activities in leaves and roots, suggesting that the activities of these enzymes are important indices to evaluate high-NUE rice cultivars.
The root system is an important organ for plants to absorb nutrients and water and is also an important site for the synthesis of some hormones, amino acids, and organic acids [43,44]. Changes in N nutrition (level, form, application) in the rice environment significantly affect the morphological and physiological characteristics of rice roots [9,14,45]. Mild nitrogen deficiency will promote root growth and facilitate deep root penetration, while proper nitrogen supply will increase root number, biomass, and density; nevertheless, excessive nitrogen supply will inhibit root growth [46,47]. In the current study, the RL and RDW of all cultivars reached the highest values at 180 kg ha−1. Root oxidation activity is an important indicator of root physiological activity, and a relatively high ROA is necessary to maintain nutrient absorption and aboveground growth [9]. In this study, the ROA was significantly higher in SN265 than in FJ at each N rate, suggesting that a high ROA is an important index to evaluate rice cultivars with higher NUE. The morphological and physiological characteristics of roots are closely associated with nutrient absorption and utilization and, therefore, plant growth and development [15,16]. According to Ju et al. [9], N-efficient cultivars have larger root biomass, deeper distribution of roots, longer root length, and greater root length density. Moreover, the energy consumed by material production in roots can be much higher than the energy consumed by aboveground dry matter production [48]. With a larger root system, the need by roots for aboveground photosynthetic products and nutrients increases, and redundant root growth produces substances and consumes energy unnecessarily, which are not conducive to improving NUE. Notably, although the N accumulation in aboveground parts of SN265 and TJ11 was similar, the root morphological and physiological characteristics of the two were significantly different. In TJ11, the RL and RDW were higher, while in SN265, the ROA and N-metabolism enzyme activity were higher. These results indicate that the N absorption capacity of the root system is determined by morphological and physiological characteristics, with a larger root system and more active physiology both conducive to improving N absorption. However, to achieve coordinated improvement in N absorption and utilization in rice, the root physiological characteristics should be improved as much as possible while maintaining the optimum size of the root system.

5. Conclusions

The three cultivars with similar growth periods had different yield and N absorption and utilization characteristics under different levels of N supply. At lower N rates, rice yield was primarily limited by N absorption capacity, whereas at higher N rates, the yield was primarily limited by N utilization ability. Therefore, to achieve high yields at different N rates, the absorption and utilization capacity of rice should be improved simultaneously. In addition, rice yield was closely associated with C metabolism, which was limited by N metabolism. Morphological and physiological characteristics determined the N absorption capacity of roots, with a large root system and active root physiology improving N absorption. Therefore, to simultaneously improve N absorption and utilization, the physiological characteristics of the root should be improved as much as possible while maintaining the optimum size of the root system.

Author Contributions

W.Z. and J.G. designed the study and provided experimental materials. X.Z. and J.Y. performed leaf physiological characteristics. M.D., L.C. and Y.Z. performed the measurement of root architecture and physiological characteristics. W.X. and L.Z. analyzed the results and prepared the figures and tables. W.X. and L.Z. wrote the paper. All authors discussed the results and commented on the manuscript. All authors have read and agreed to the published version of the manuscript.

Funding

This study was supported by grants from the Project of Promoting Talents in Liaoning Province, China (No. XLYC2002073,2007169); the Project of Scientific Research in the Education Department of Liaoning Province, China (No. LSNJC20202).

Conflicts of Interest

The authors declare no conflict of interest.

References

  1. Sweetlove, L.; Beard, K.; Nunesnesi, A.; Fernie, A.; Ratcliffe, R. Not just a circle: Flux modes in the plant TCA cycle. Trends Plant Sci. 2010, 15, 462–470. [Google Scholar] [CrossRef] [PubMed]
  2. Li, H.; Hu, B.; Chu, C. Nitrogen use efficiency in crops: Lessons from Arabidopsis and rice. J. Exp. Bot. 2017, 68, 2477–2488. [Google Scholar] [CrossRef] [PubMed]
  3. Godfray, H.C.; Beddington, J.R.; Crute, I.R.; Haddad, L.; Lawrence, D.; Muir, J.F.; Pretty, J.; Robinson, S.; Thomas, S.M.; Toulmin, C. Food security: The challenge of feeding 9 billion people. Science 2010, 327, 812–818. [Google Scholar] [CrossRef] [PubMed] [Green Version]
  4. Liu, X.; Zhang, Y.; Han, W.; Tang, A.; Shen, J.; Cui, Z.; Vitousek, P.; Erisman, J.W.; Coulding, K.; Christie, P.; et al. Enhanced nitrogen deposition over China. Nature 2013, 494, 459–462. [Google Scholar] [CrossRef]
  5. Hakeem, K.R.; Ahmad, A.; Iqbal, M.; Gucel, S.; Ozturk, M. Nitrogen-efficient rice cultivars can reduce nitrate pollution. Environ. Sci. Pollut. Res. 2011, 18, 1184–1193. [Google Scholar] [CrossRef]
  6. Gutiérrez, R.A. Systems biology for enhanced plant nitrogen nutrition. Science 2012, 336, 1673–1675. [Google Scholar] [CrossRef]
  7. Garnett, T.; Conn, V.; Kaiser, B.N. Root based approaches to improving nitrogen use efficiency in plants. Plant Cell Environ. 2009, 32, 1272–1283. [Google Scholar] [CrossRef]
  8. Nunes-Nesi, A.; Fernie, A.R.; Stitt, M. Metabolic and signaling aspects underpinning the regulation of plant carbon nitrogen interactions. Mol. Plant 2010, 3, 973–996. [Google Scholar] [CrossRef]
  9. Ju, C.; Buresh, R.J.; Wang, Z.; Zhang, H.; Liu, L.; Yang, J.; Zhang, J. Root and shoot traits for rice varieties with higher grain yield and higher nitrogen use efficiency at lower nitrogen rates application. Field Crops Res. 2015, 175, 47–55. [Google Scholar] [CrossRef]
  10. Zheng, Z.J. Carbon and nitrogen nutrient balance signaling in plants. Plant Signal. Behav. 2009, 4, 584–591. [Google Scholar] [CrossRef] [Green Version]
  11. Bao, A.; Zhao, Z.; Ding, G.; Shi, L.; Xu, F.; Cai, H. Accumulated expression level of Cytosolic Glutamine Synthetase 1 Gene (OsGS1;1 or OsGS1;2) alter plant development and the carbon-nitrogen metabolic status in rice. PLoS ONE 2014, 9, e95581. [Google Scholar] [CrossRef] [PubMed] [Green Version]
  12. Bao, A.; Zhao, Z.; Ding, G.; Shi, L.; Xu, F.; Cai, H. The stable level of glutamine synthetase 2 plays an important role in rice growth and in carbon-nitrogen metabolic balance. Int. J. Mol. Sci. 2015, 16, 12713–12736. [Google Scholar] [CrossRef] [PubMed] [Green Version]
  13. Yang, X.; Nian, J.; Xie, Q.; Feng, J.; Zhang, F.; Jing, H.; Zhang, J.; Dong, G.; Liang, Y.; Peng, J. Rice ferredoxin-dependent glutamate synthase regulates nitrogen-carbon metabolomes and is genetically differentiated between japonica and indica subspecies. Mol. Plant 2016, 9, 1520–1534. [Google Scholar] [CrossRef] [PubMed] [Green Version]
  14. Xin, W.; Zhang, L.; Zhang, W.; Gao, J.; Yi, J.; Zhen, X.; Li, Z.; Zhao, Y.; Peng, C.; Zhao, C. An integrated analysis of the rice transcriptome and metabolome reveals differential regulation of carbon and nitrogen metabolism in response to nitrogen availability. Int. J. Mol. Sci. 2019, 20, 2349. [Google Scholar] [CrossRef] [PubMed] [Green Version]
  15. Zhang, H.; Xue, Y.; Wang, Z.; Yang, J.; Zhang, J. An alternate wetting and moderate soil drying regime improves root and shoot growth in rice. Crop Sci. 2009, 49, 2246–2260. [Google Scholar] [CrossRef]
  16. Lynch, J.P. Steep, cheap and deep: An ideotype to optimize water and N acquisition by maize root systems. Ann. Bot. 2013, 112, 347–357. [Google Scholar] [CrossRef] [PubMed] [Green Version]
  17. Xin, W.; Zhang, L.; Zhang, W.; Gao, J.; Yi, J.; Zhen, X.; Du, M.; Zhao, Y.; Chen, L. An integrated analysis of the rice transcriptome and metabolome reveals root growth regulation mechanisms in response to nitrogen availability. Int. J. Mol. Sci. 2019, 20, 5893. [Google Scholar] [CrossRef] [PubMed] [Green Version]
  18. Mi, H.; Chen, J.; Wu, P.; Lai, W.; Yuan, X.; Zhang, S. Ideotype root architecture for efficient nitrogen acquisition by maize in intensive cropping systems. Sci. China Life Sci. 2010, 53, 1369–1373. [Google Scholar] [CrossRef]
  19. Sun, H.; Qian, Q.; Wu, K.; Luo, J.; Wang, S.; Zhang, C.; Ma, Y.; Liu, Q.; Huang, X.; Yuan, Q.; et al. Heterotrimeric G proteins regulate nitrogen-use efficiency in rice. Nat. Genet. 2014, 46, 652–656. [Google Scholar] [CrossRef]
  20. Li, Y.; Ren, B.; Yang, X.; Xu, G.; Shen, Q.; Guo, S. Chloroplast downsizing under nitrate nutrition restrained mesophyll conductance and photosynthesis in rice (Oryza sativa L.) under drought conditions. Plant Cell Physiol. 2012, 53, 892–900. [Google Scholar] [CrossRef] [Green Version]
  21. Maness, N. Extraction and analysis of soluble carbohydrates. Methods Mol. Biol. 2010, 639, 341–370. [Google Scholar] [PubMed]
  22. Zhang, Z.L.; Qu, W.J. Experimental Guidance in Plant Physiology, 3rd ed.; Higher Education Press: Beijing, China, 2003; pp. 128–129. (In Chinese) [Google Scholar]
  23. Gibon, Y.; Blaesing, O.E.; Hannemann, J.; Carillo, P.; Höhne, M.; Hendriks, J.H.M.; Palacios, N.; Cross, J.; Selbig, J.; Stitt, M. A robot-based platform to measure multiple enzyme activities in Arabidopsis using a set of cycling assays: Comparison of changes of enzyme activities and transcript levels during diurnal cycles and in prolonged darkness. Plant Cell 2004, 16, 3304–3325. [Google Scholar] [CrossRef] [PubMed] [Green Version]
  24. Wang, H.; Lee, P.; Chen, W.; Huang, D.; Su, J. Osmotic stress induced changes of sucrose metabolism in cultured sweet potato cells. J. Exp. Bot. 2000, 51, 1991–1999. [Google Scholar] [CrossRef] [PubMed] [Green Version]
  25. Nakamura, Y.; Yuki, K.; Park, S.Y.; Toshihide, O. Carbohydrate metabolism in the developing endosperm of rice grains. Plant Cell Physiol. 1989, 30, 833–839. [Google Scholar] [CrossRef]
  26. Cao, H.H.; Zhang, M.; Zhao, H.; Zhang, Y.; Wang, X.X.; Guo, S.S.; Zhang, Z.F.; Liu, T.X. Deciphering the mechanism of β-aminobutyric acid-induced resistance in wheat to the grain aphid, Sitobion avenae. PLoS ONE 2014, 9, e91768. [Google Scholar] [CrossRef]
  27. Ramasamy, S.; Berge, H.; Purushothaman, S. Yield formation in rice in response to drainage and nitrogen application. Field Crops Res. 1997, 51, 65–82. [Google Scholar] [CrossRef]
  28. Li, M.; Zhang, H.; Yang, X.; Ge, M.; Ma, Q.; Wei, H.; Dai, Q.; Huo, Z.; Xu, K.; Luo, D. Accumulation and utilization of nitrogen, phosphorus and potassium of irrigated rice cultivars with high productivities and high N use efficiencies. Field Crops Res. 2014, 161, 55–63. [Google Scholar] [CrossRef]
  29. Peng, S.B.; Buresh, R.J.; Huang, J.L.; Yang, J.C.; Zou, Y.B.; Zhong, X.H.; Wang, G.H.; Zhang, F.S. Strategies for overcoming low agronomic nitrogen use efficiency in irrigated rice systems in China. Field Crops Res. 2006, 96, 37–47. [Google Scholar] [CrossRef]
  30. Fan, M.; Shen, J.; Yuan, L.; Jiang, R.; Chen, X.; Davies, W.J.; Zhang, F. Improving crop productivity and resource use efficiency to ensure food security and environmental quality in China. J. Exp. Bot. 2012, 63, 13. [Google Scholar] [CrossRef]
  31. Gao, J.; Zhao, Y.; Zhang, W.; Sui, Y.; Jin, D.; Xin, W.; Yi, J.; He, D. Biochar prepared at different pyrolysis temperatures affects urea-nitrogen immobilization and N2O emissions in paddy fields. PeerJ 2019, 7, e7027. [Google Scholar] [CrossRef] [Green Version]
  32. Yi, J.; Gao, J.; Zhang, W.; Zhao, Y.; Zhao, C.; Zhao, Y.; Ziang Li, Z.; Xin, W. Delayed timing of tillering fertilizer improved grain yield and nitrogen use efficiency in japonica rice. Crop Sci. 2020, 60, 1021–1033. [Google Scholar] [CrossRef]
  33. Wang, X.B.; Cai, D.X.; Grant, C.; Hoogmoed, W.B.; Oenema, O. Changes in regional grain yield responses to chemical fertilizer use in China over the last 20 years. J. Soil Sci. Plant Nutr. 2018, 18, 312–328. [Google Scholar] [CrossRef] [Green Version]
  34. Raun, W.R.; Dhillon, J.; Aula, L.; Eickhoff, E.; Weymeyer, G.; Figueirdeo, B.; Lynch, T.; Omara, P.; Nambi, E.; Oyebiyi, F.; et al. Unpredictable nature of the environment on nitrogen supply and demand. Agron. J. 2019, 111, 2786–2791. [Google Scholar] [CrossRef] [Green Version]
  35. Dhakal, C.; Lange, K.; Parajulee, M.N.; Segarra, E. Dynamic optimization of nitrogen in plateau cotton yield functions with nitrogen carryover considerations. J. Agric. Appl. Econ. 2019, 51, 385–401. [Google Scholar] [CrossRef] [Green Version]
  36. Coruzzi, G.M.; Zhou, L. Carbon and nitrogen sensing and signaling in plants: Emerging ‘matrix effects’. Curr. Opin. Plant Biol. 2001, 4, 247–253. [Google Scholar] [CrossRef]
  37. Martin, T.; Oswald, O.; Graham, I.A. Arabidopsis seedling growth, storage lipid mobilization, and photosynthetic gene expression are regulated by carbon: Nitrogen availability. Plant Physiol. 2002, 128, 472–481. [Google Scholar] [CrossRef]
  38. Krapp, A.; Traong, H.N. Regulation of C/N interaction in model plant species. J. Crop Improv. 2005, 15, 127–173. [Google Scholar] [CrossRef]
  39. Kusano, M.; Fukushima, A.; Redestig, H.; Saito, K. Metabolomic approaches toward understanding nitrogen metabolism in plants. J. Exp. Bot. 2011, 62, 1439–1453. [Google Scholar] [CrossRef]
  40. Li, Y.; Yang, X.; Ren, B.; Shen, Q.; Guo, S. Why nitrogen use efficiency decreases under high nitrogen supply in rice (Oryza sativa L.) seedlings. J. Plant Growth Regul. 2012, 31, 47–52. [Google Scholar] [CrossRef]
  41. Cao, Y.; Fan, X.R.; Sun, S.B.; Xu, G.H.; Hu, J.; Shen, Q.R. Effect of nitrate on activities and transcript levels of nitrate reductase and glutamine synthetase in rice. Pedosphere 2008, 18, 664–673. [Google Scholar] [CrossRef]
  42. Wang, J.L.; Fu, Z.S.; Chen, G.F.; Zou, G.Y.; Song, X.F.; Liu, F.X. Runoff nitrogen (N) losses and related metabolism enzyme activities in paddy field under different nitrogen fertilizer levels. Environ. Sci. Pollut. Res. 2018, 25, 27583–27593. [Google Scholar] [CrossRef] [PubMed]
  43. Wu, W.M.; Cheng, S.H. Root genetic research, an opportunity and challenge to rice improvement. Field Crops Res. 2014, 165, 111–124. [Google Scholar] [CrossRef] [Green Version]
  44. Meng, F.; Xiang, D.; Zhu, J.; Li, Y.; Mao, C. Molecular mechanisms of root development in rice. Rice 2019, 12, 1. [Google Scholar] [CrossRef] [PubMed] [Green Version]
  45. Xu, G.; Fan, X.; Miller, A.J. Plant nitrogen assimilation and use efficiency. Ann. Rev. Plant Biol. 2012, 63, 153–182. [Google Scholar] [CrossRef] [PubMed] [Green Version]
  46. Walch-Liu, P. Nitrogen regulation of root branching. Ann. Bot. 2006, 97, 875–881. [Google Scholar] [CrossRef] [PubMed]
  47. Francisco, R.H.; Shane, M.W.; López-Bucio, J. Nutritional regulation of root development. Wiley interdisciplinary reviews. Dev. Biol. 2015, 4, 431–443. [Google Scholar]
  48. Passioura, J.B. Roots and drought resistance. Agric. Water Manag. 1983, 7, 265–280. [Google Scholar] [CrossRef]
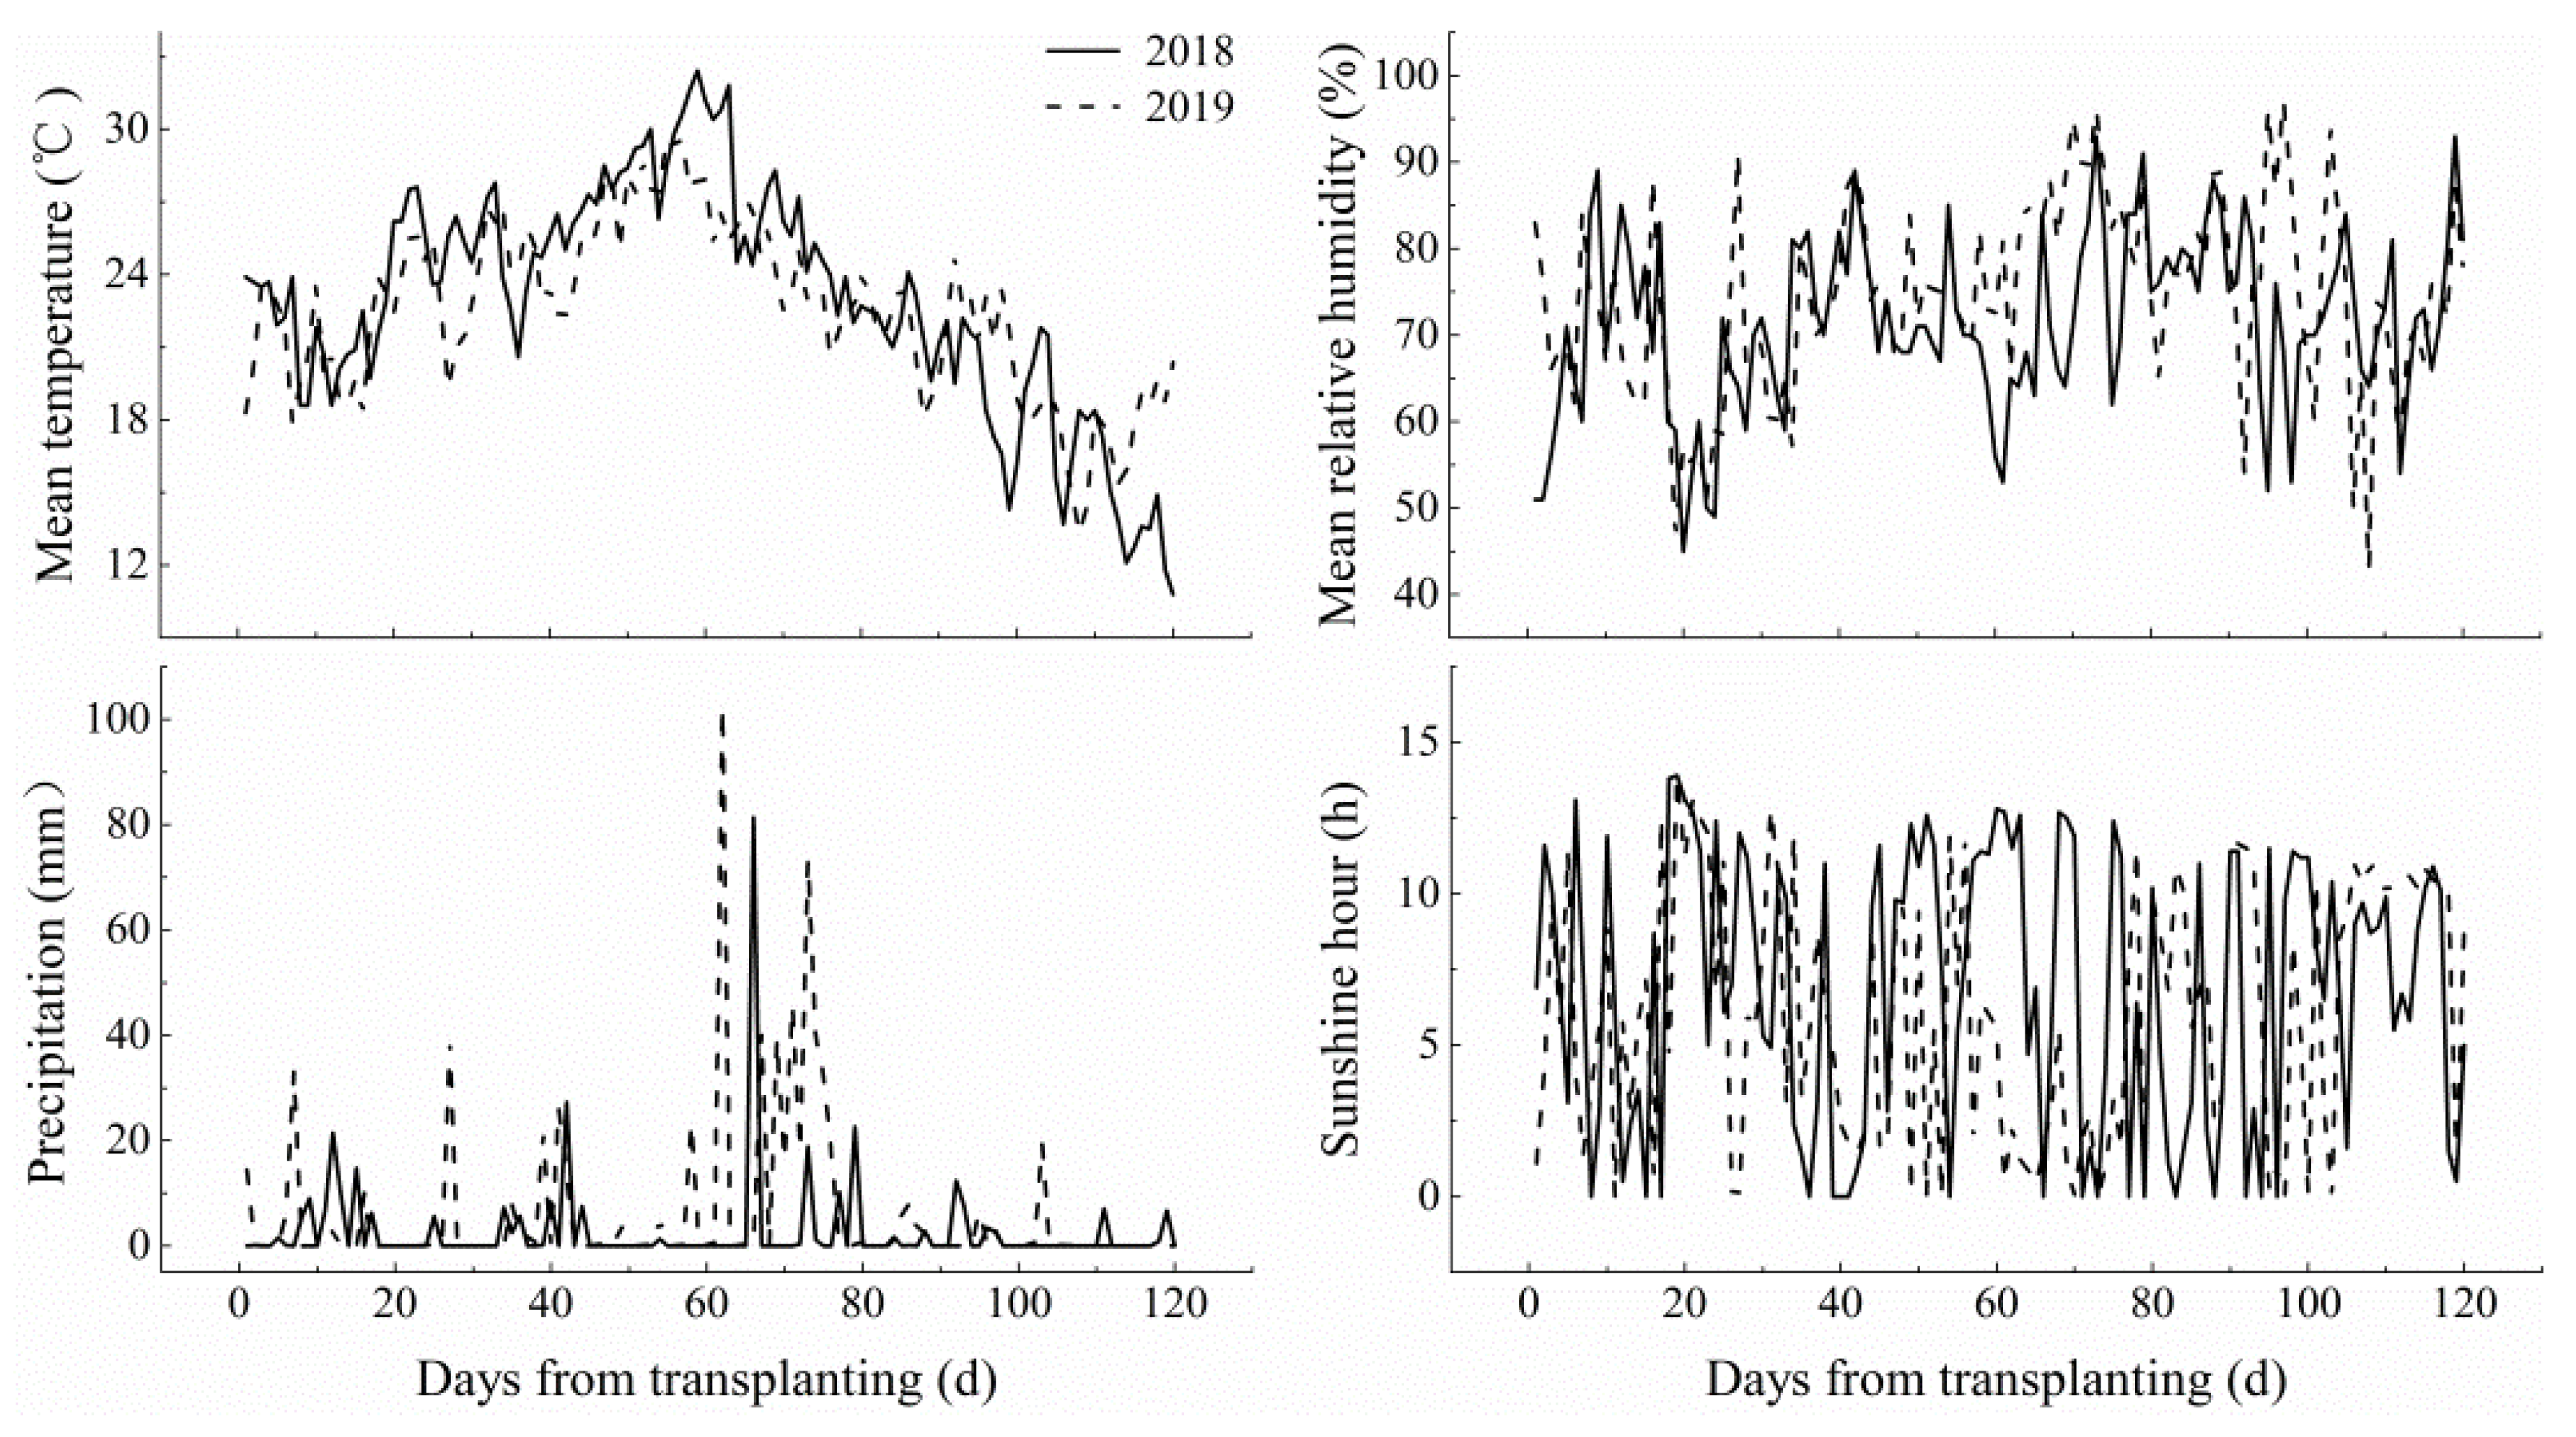
Figure 1. Mean temperature (°C), sunshine hours (h), precipitation (mm), and relative humidity (%) from transplantation during the rice-growing season in 2018 and 2019.
Agronomy 12 00358 g001
Figure 2. Effects of different nitrogen application rates (kg ha−1) on the grain yield (t ha−1) of three japonica rice cultivars in 2018 and 2019. Different lowercase letters above the columns indicate significant differences among cultivars at p < 0.05.
Agronomy 12 00358 g002
Figure 3. Effects of different nitrogen application rates (kg ha−1) on the leaf nitrogen content (mg cm2), photosynthetic rate (μmol m−2 s−1), and photosynthetic nitrogen use efficiency (NUE, μmol g−1 s−1) of three japonica rice cultivars in 2018 and 2019. Different lowercase letters above the columns indicate significant differences among cultivars at p < 0.05.
Agronomy 12 00358 g003
Figure 4. Effects of different nitrogen application rates (kg ha−1) on leaf Rubisco content (μg g−1), soluble sugar content (mg g−1), and sucrose content (mg g−1) of three japonica rice cultivars in 2018 and 2019. Different lowercase letters above the columns indicate significant differences among cultivars at p < 0.05.
Agronomy 12 00358 g004
Figure 5. Effects of different nitrogen application rates (kg ha−1) on leaf Rubisco activity (μmol g−1 min−1 fresh weight (FW)), sucrose phosphate synthase activity (SPS, μmol g−1 min−1 FW), nitrate reductase activity (NR, μmol g−1 min−1 FW), and glutamine synthetase activity (GS, μmol g−1 min−1 FW) of three japonica rice cultivars in 2018 and 2019. Different lowercase letters above the columns indicate significant differences among cultivars at p < 0.05.
Agronomy 12 00358 g005
Figure 6. Effects of different nitrogen application rates (kg ha−1) on the root dry weight (RDW, g), root length (RL, m), and root oxidation activity (ROA, μg α–NA g−1 h−1 fresh weight (FW)) of three japonica rice cultivars in 2018 and 2019. Different lowercase letters above the columns indicate significant differences among cultivars at p < 0.05.
Agronomy 12 00358 g006
Figure 7. Effects of different nitrogen application rates (kg ha−1) on the root nitrogen content (%), free amino acid content (mg g−1), nitrate reductase activity (NR, μmol g−1 min−1 fresh weight (FW)), and glutamine synthetase activity (GS, μmol g−1 min−1 FW) of three japonica rice cultivars in 2018 and 2019. Different lowercase letters above the columns indicate significant differences among cultivars at p < 0.05.
Agronomy 12 00358 g007
Table 1. Effects of different nitrogen application rates (kg ha−1) on the yield components of three japonica rice cultivars in 2018 and 2019, with the results of the three-way ANOVA.
YearTreatmentEffective Panicles (Per m−2)Grain Per PancileSeed Setting Rate (%)1000-Grain Weight (g)
SN265TJ11FJSN265TJ11FJSN265TJ11FJSN265TJ11FJ
20180188.6 fC210.2 fB305.4 fA120.80 eA113.99 dB83.27 fC93.6 aA90.8 aB92.8 aA24.50 aA23.58 aB23.90 aB
60253.0 eC289.2 eB405.0 eA127.25 dA118.55 cB90.53 dC89.6 bA87.6 bA89.4 bA23.96 bA22.12 bC22.64 bB
120321.0 dC369.2 dB487.0 dA133.17 cA125.95 bB102.34 bC88.4 bA84.0 cB84.6 cA23.32 cA22.10 bB21.84 cB
180375.0 cC425.6 cB533.6 cA142.13 aA129.55 aB106.35 aC84.6 cA84.8 bcA82.0 dA22.88 dA21.16 cB21.22 dB
240428.0 bC500.0 bB617.0 bA144.49 aA124.91 bB98.17 cC80.8 dA81.0 dA79.4 eA22.32 eA21.08 cB21.32 dB
300470.8 aC549.6 aB692.4 aA138.23 bA120.24 cB87.38 eC79.4 dA76.8 eA71.4 fB22.10 eA21.30 cB20.78 eC
20190185.0 fC208.6 fB281.8 fA125.00 cA116.27 dB87.68 dC94.8 aA92.8 aB94.8 aA24.36 aA23.66 aB24.08 aAB
60244.2 eC277.2 eB375.0 eA131.05 bA121.87 cB92.62 cC91.6 bAB90.6 bB92.2 bA23.52 bA22.18 bC22.96 bB
120313.2 dC344.4 dB448.0 dA130.36 bA126.58 bB103.36 aC89.4 cA89.4 bA89.2 cA23.30 bA21.88 bB21.76 cB
180356.6 cC404.4 cB512.4 cA139.77 aA130.20 aB103.02 aC88.2 cA87.4 cA85.4 dB22.66 cA21.08 cB21.34 dB
240420.4 bC474.0 bB591.0 bA138.49 aA125.52 bB100.01 dC83.8 dA83.4 dA80.8 eB22.22 dA20.88 cB20.84 eB
300478.6 aC530.8 aB677.0 aA130.51 bA114.98 dB92.38 cC80.8 eA79.4 eA74.8 fB21.60 eA21.02 cB20.84 eB
F-valueN7857.13 **427.83 **426.93 **450.75 **
C6640.93 **7851.97 **34.8 **378.66 **
Y207.66 **0.27 ns131.46 **7.25 **
N × C52.88 **32.28 **10.225 **10.36 **
N × Y4.72 **17.6 **1.47 ns1.51 ns
C × Y24.06 **17.5 **1.81 ns3.43 *
N × C × Y2.32 *2.89 **1.00 ns1.49 ns
Note: Different lowercase and uppercase letters represent significant differences among treatments and cultivars, respectively. * p < 0.05; ** p < 0.01; ns, not significant. N, nitrogen rate; C, cultivar; Y, year.
Table 2. Effects of different nitrogen application rates (kg ha−1) on the nitrogen recovery efficiency (NRE, %), nitrogen physiological efficiency (NPE, kg kg−1), and nitrogen agronomic use efficiency (kg kg−1) in three japonica rice cultivars in 2018 and 2019, with the results of the three-way ANOVA.
YearTreatmentNRE (%)NPE (kg kg−1)NAE (kg kg−1)
SN265TJ11FJSN265TJ11FJSN265TJ11FJ
20180
6062.15 aB62.52 aB68.83 aA51.53 aA49.48 aB48.98 aC32.02 aB30.94 aC33.71 aA
12059.15 bB59.09 bB63.62 bA49.68 bA48.62 aA47.37 bB29.39 bAB28.73 bB30.13 bA
18058.97 bB59.23 bB60.74 cA46.81 cA43.83 bB39.87 cC27.60 cA25.96 cB24.22 cC
24054.98 cB55.27 cB56.58 dA42.38 dA39.59 cB32.68 dC23.30 dA21.88 dB18.49 dC
30050.21 dC51.20 dB54.35 eA40.10 eA35.07 dB24.40 eC20.13 eA17.96 eB13.26 eC
20190
6064.73 aB64.68 aB70.74 aA49.47 aA47.70 aB45.42 aC32.02 aA30.85 aB32.13 aA
12059.18 bB58.85 bB64.65 bA47.74 bA46.47 aB43.27 bC28.25 bA27.34 bB27.96 bAB
18059.61 bB59.25 bB60.63 cA44.87 cA43.22 bB39.14 cC26.75 cA25.60 cB23.73 cC
24054.91 cB54.86 cB57.23 dA40.07 dA38.03 cA31.94 dB22.00 dA20.86 dA18.28 dB
30050.44 dC52.27 dB56.27 eA37.22 eA33.35 dB24.07 eC18.77 eA17.43 eB13.55 eC
F-valueN2566.32 **1021.73 **2235.77 **
C811.3 **499.53 **156.94 **
Y73.46 **98.25 **50.67 **
N × C51.9 **42.57 **54.72 **
N × Y20.86 **2.55 *2.92 *
C × Y3.53 *1.00 ns0.42 ns
N × C × Y2.78 *2.08 ns2.63 *
Note: Different lowercase and uppercase letters represent significant differences among treatments and cultivars, respectively. * p < 0.05; ** p < 0.01; ns, not significant. N, nitrogen rate; C, cultivar; Y, year.
Publisher’s Note: MDPI stays neutral with regard to jurisdictional claims in published maps and institutional affiliations.