
Conception and Development of Recycled Raw Materials (Coconut Fiber and Bagasse)-Based Substrates Enriched with Soil Microorganisms (Arbuscular Mycorrhizal Fungi, Trichoderma spp. and Pseudomonas spp.) for the Soilless Cultivation of Tomato (S. lycopersicum)

Abstract
1. Introduction
2. Materials and Methods
2.1. Inoculum Production
2.2. Experimental Design
2.3. Physical and Chemical Analyses
2.4. Nutrient Diet
2.5. Assessment of Plant Development
2.6. Statistical Analyses
3. Results and Discussion
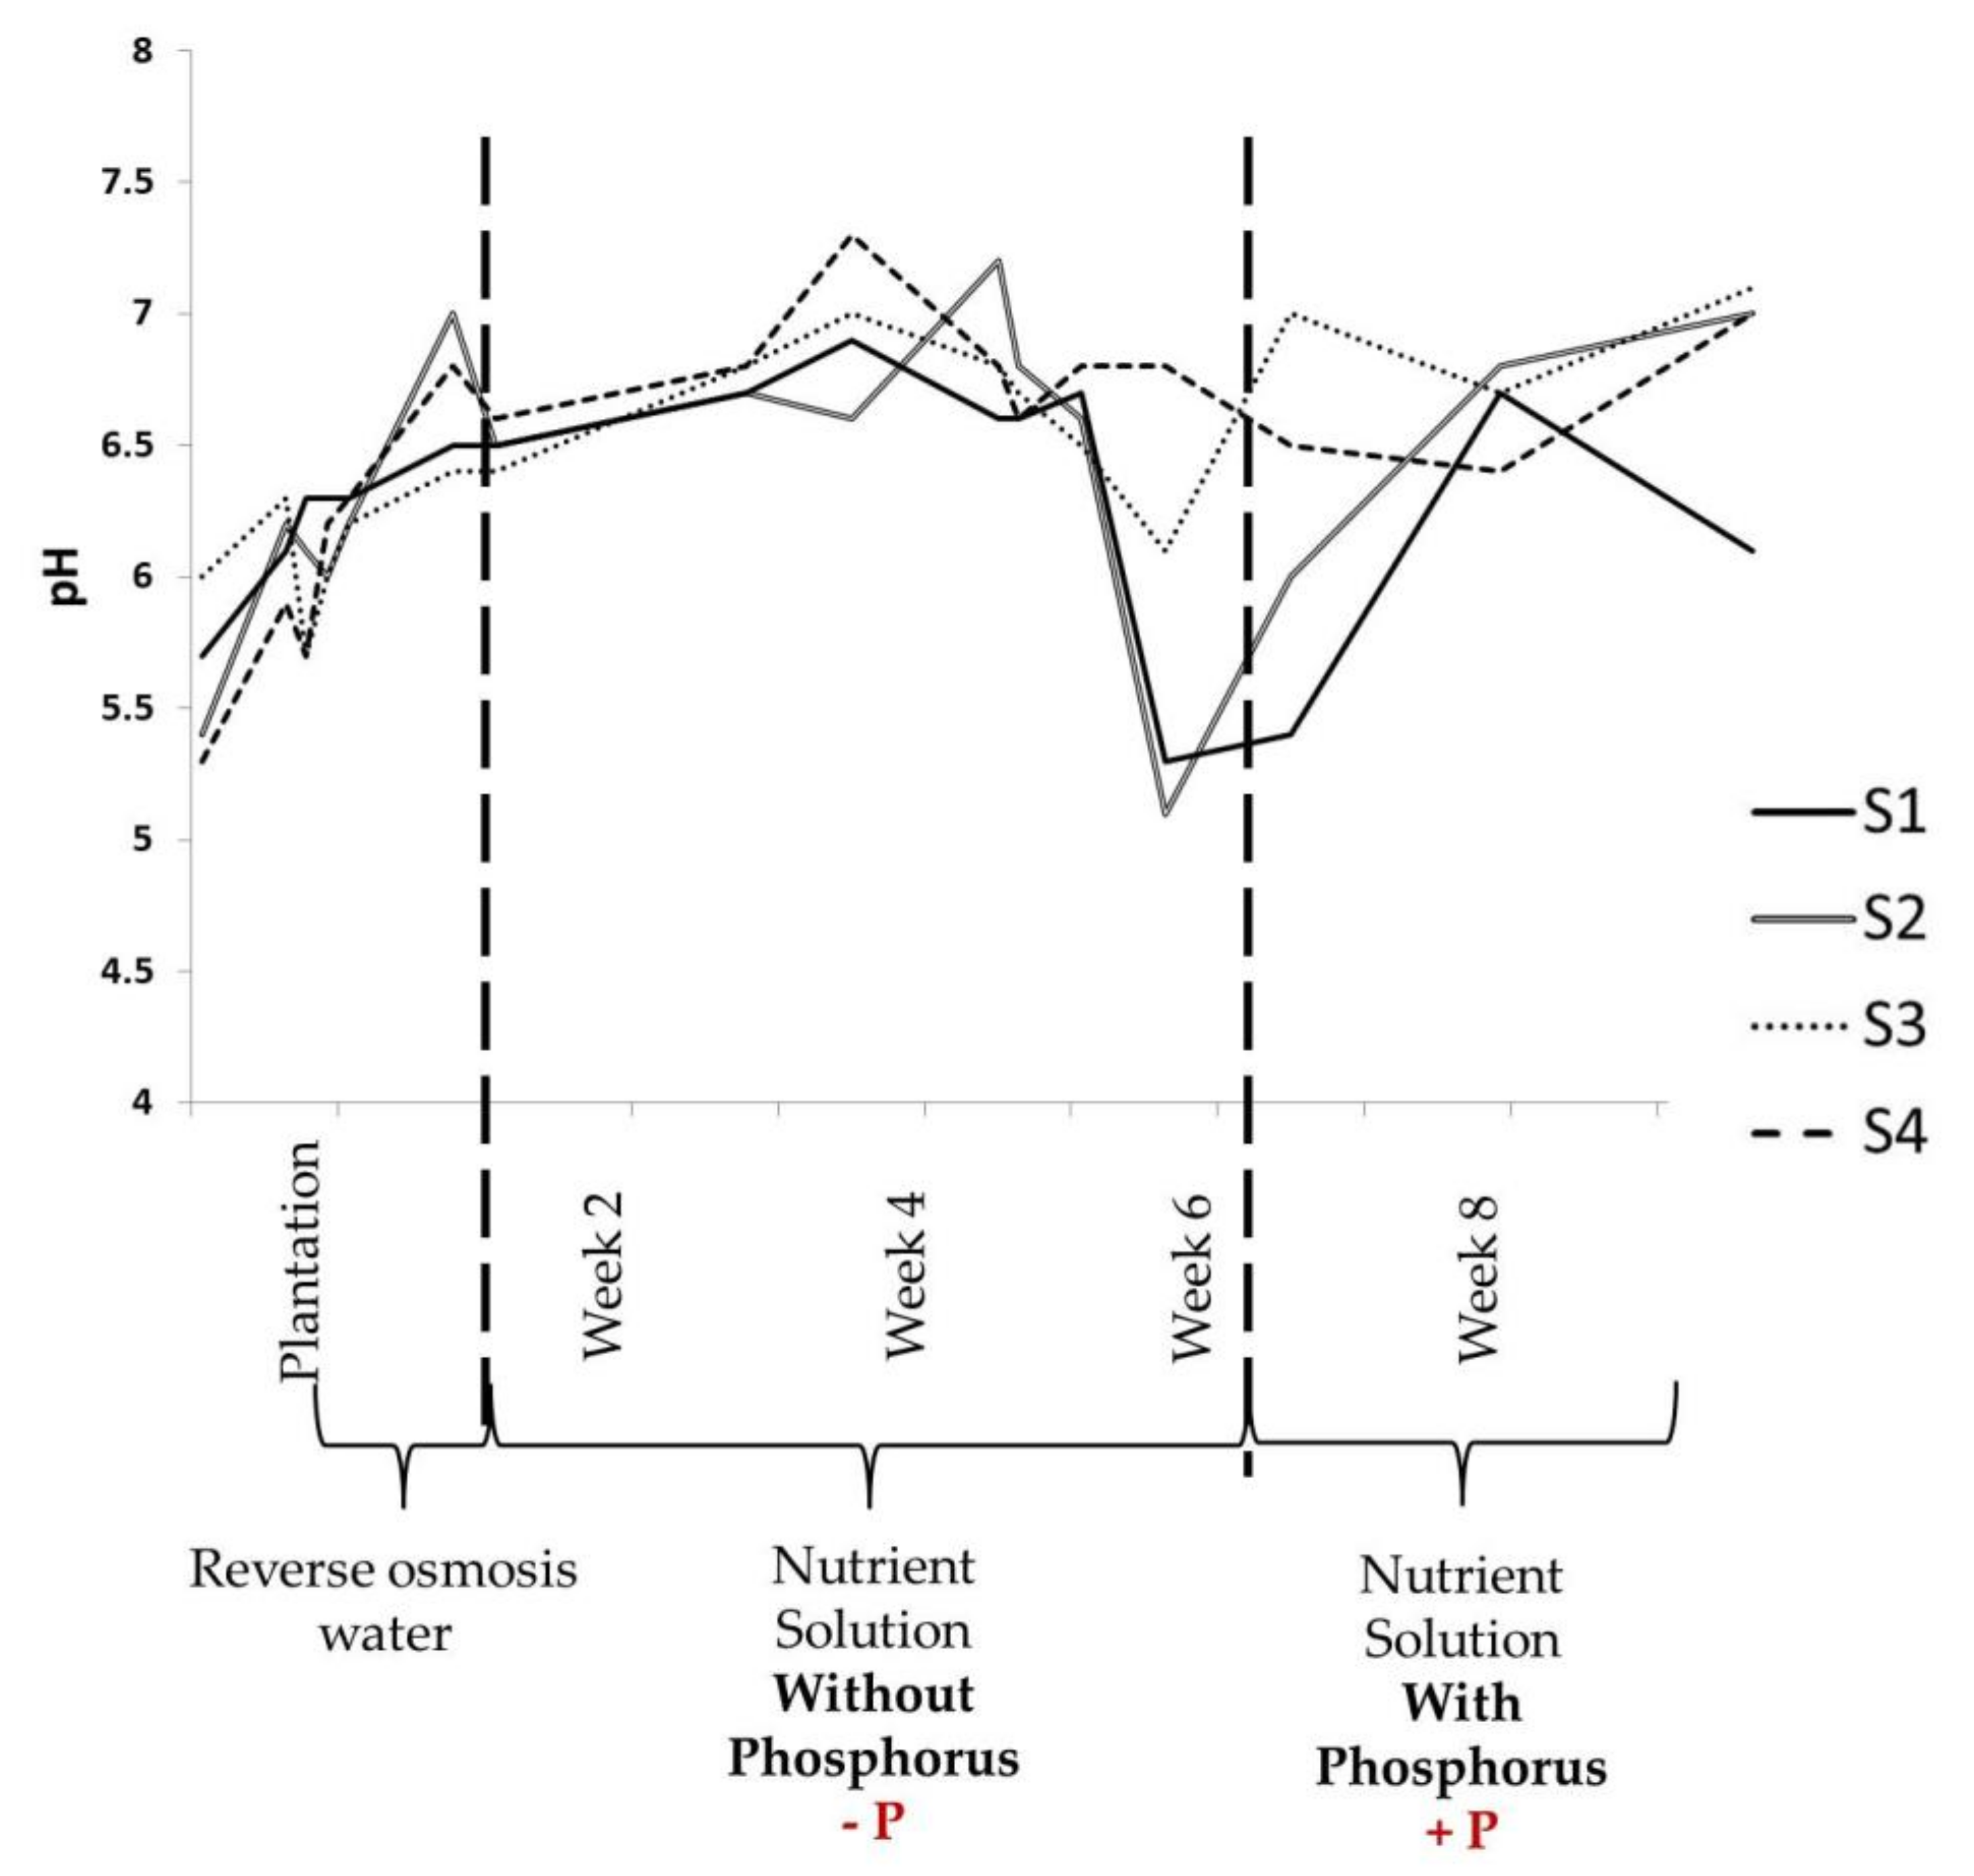
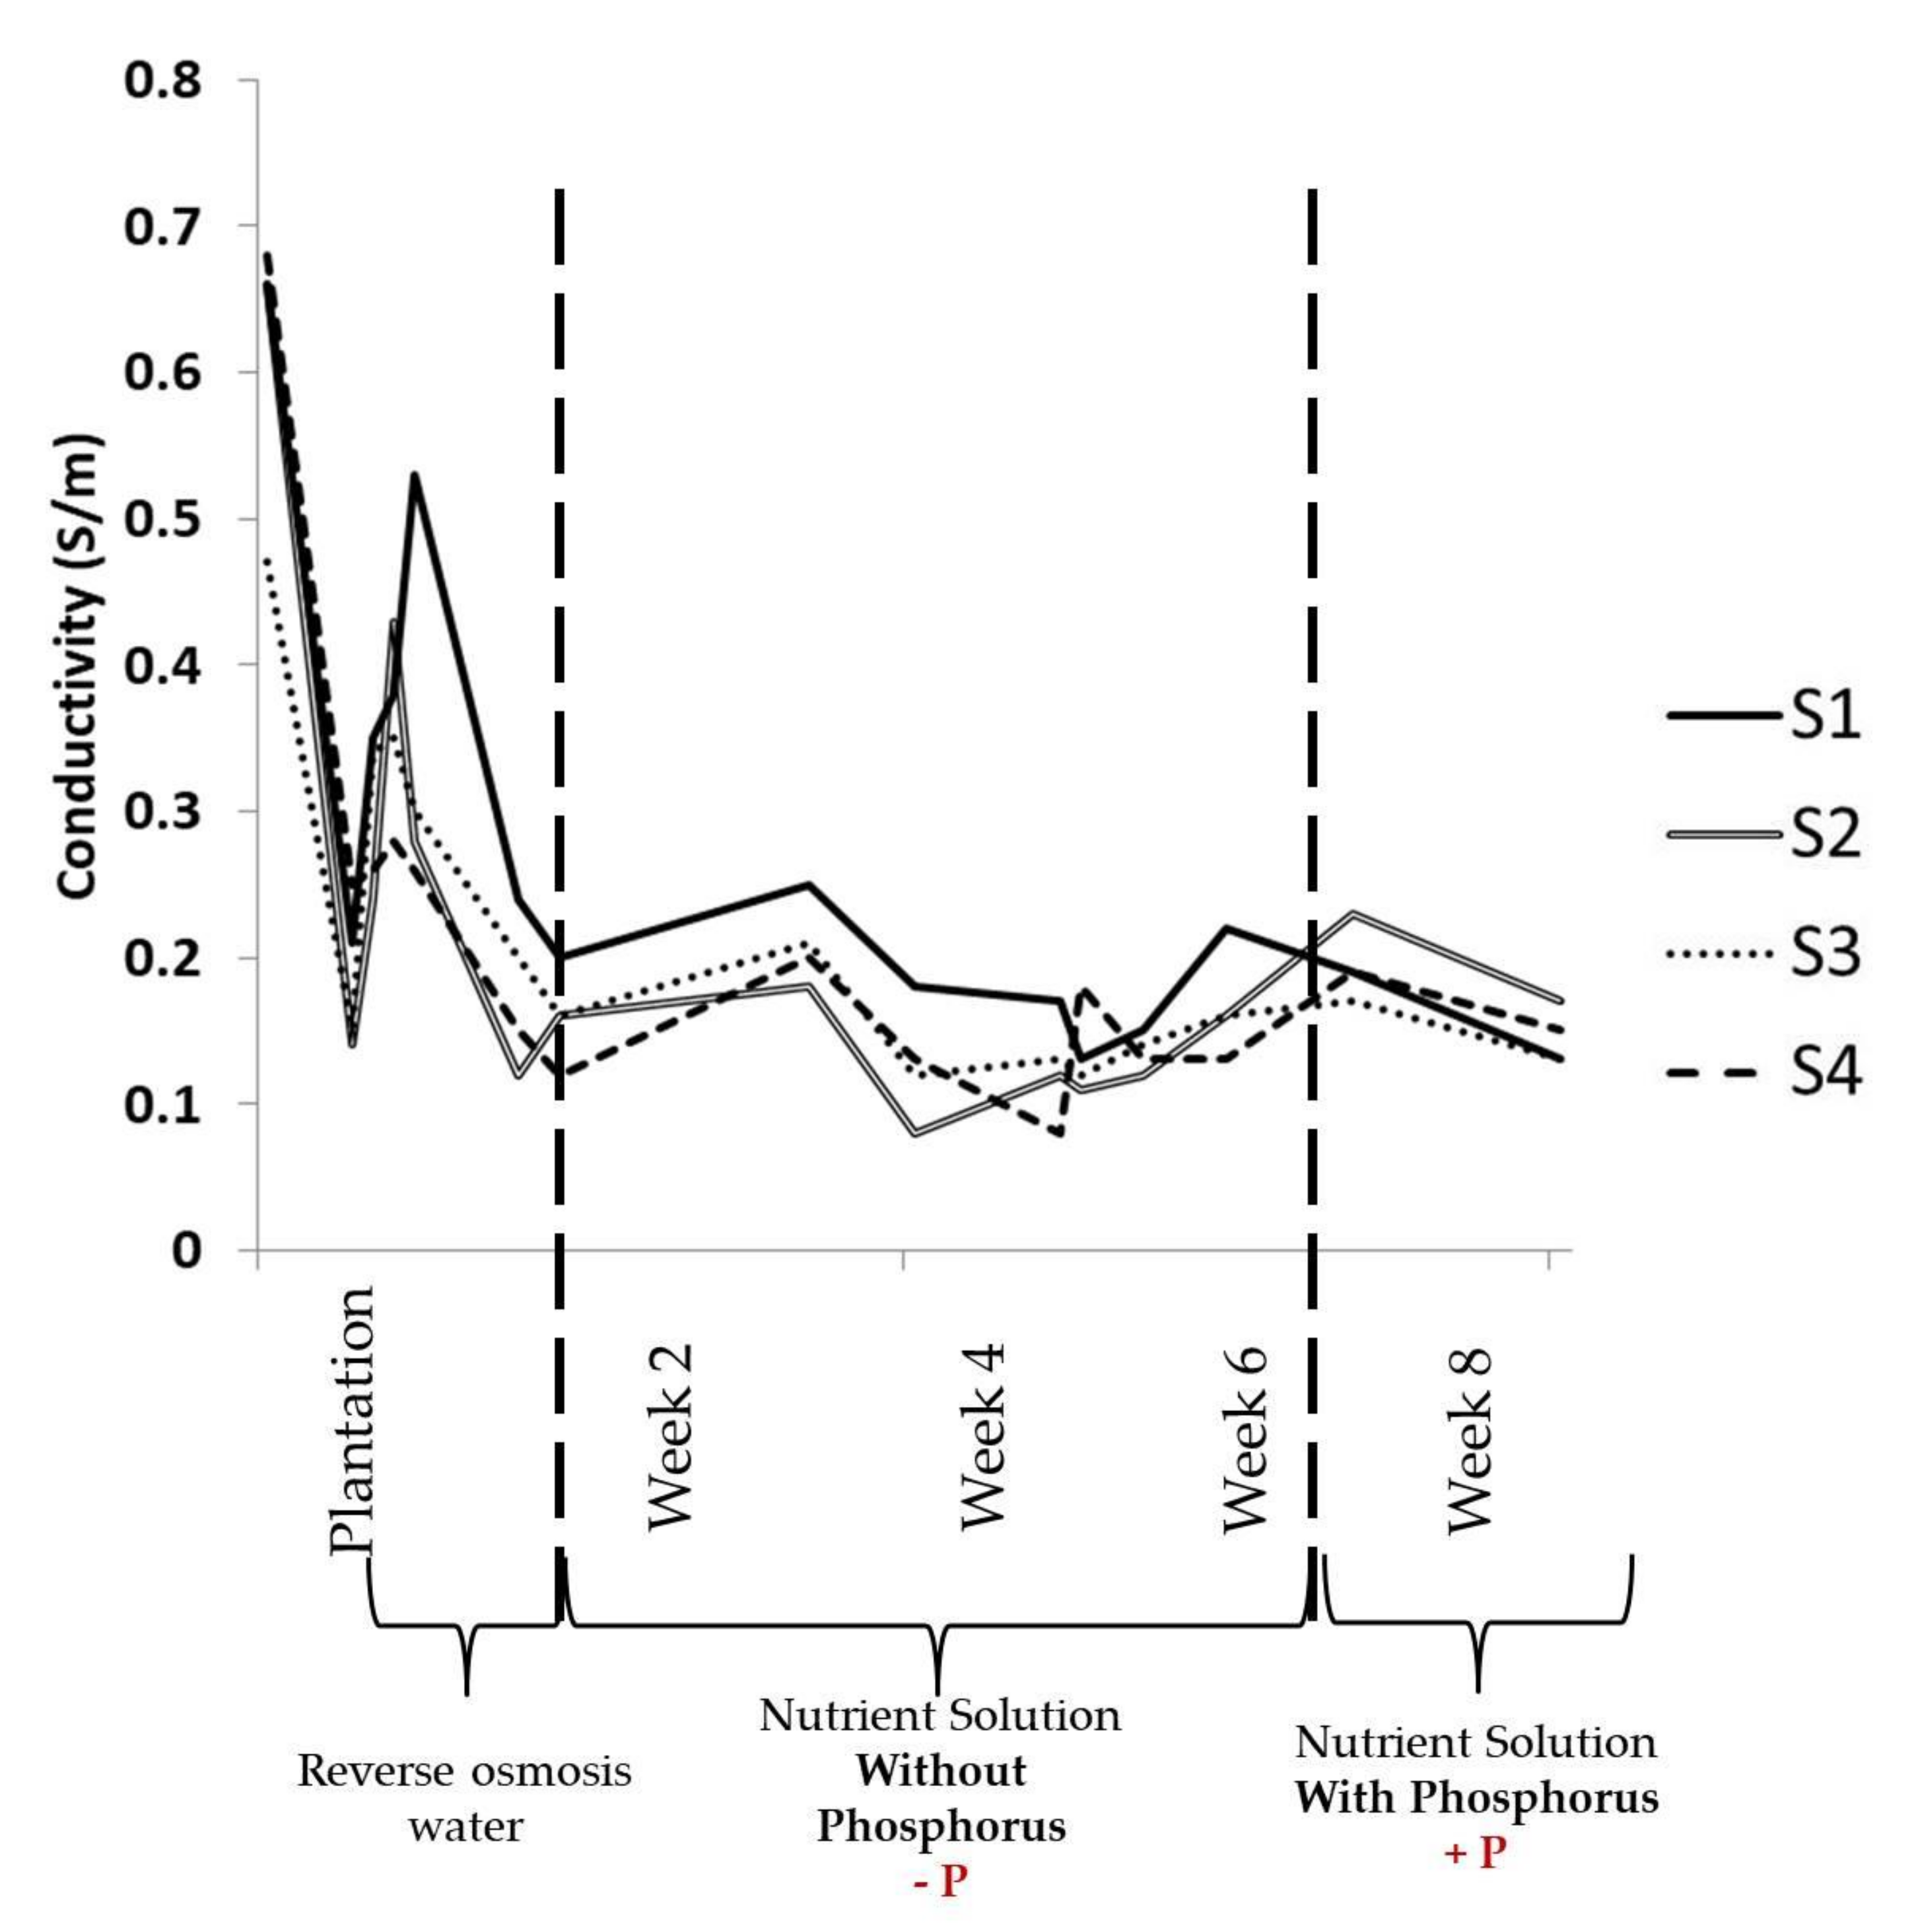
3.1. Physical Parameters Evolution
3.2. Plant Growth Effects
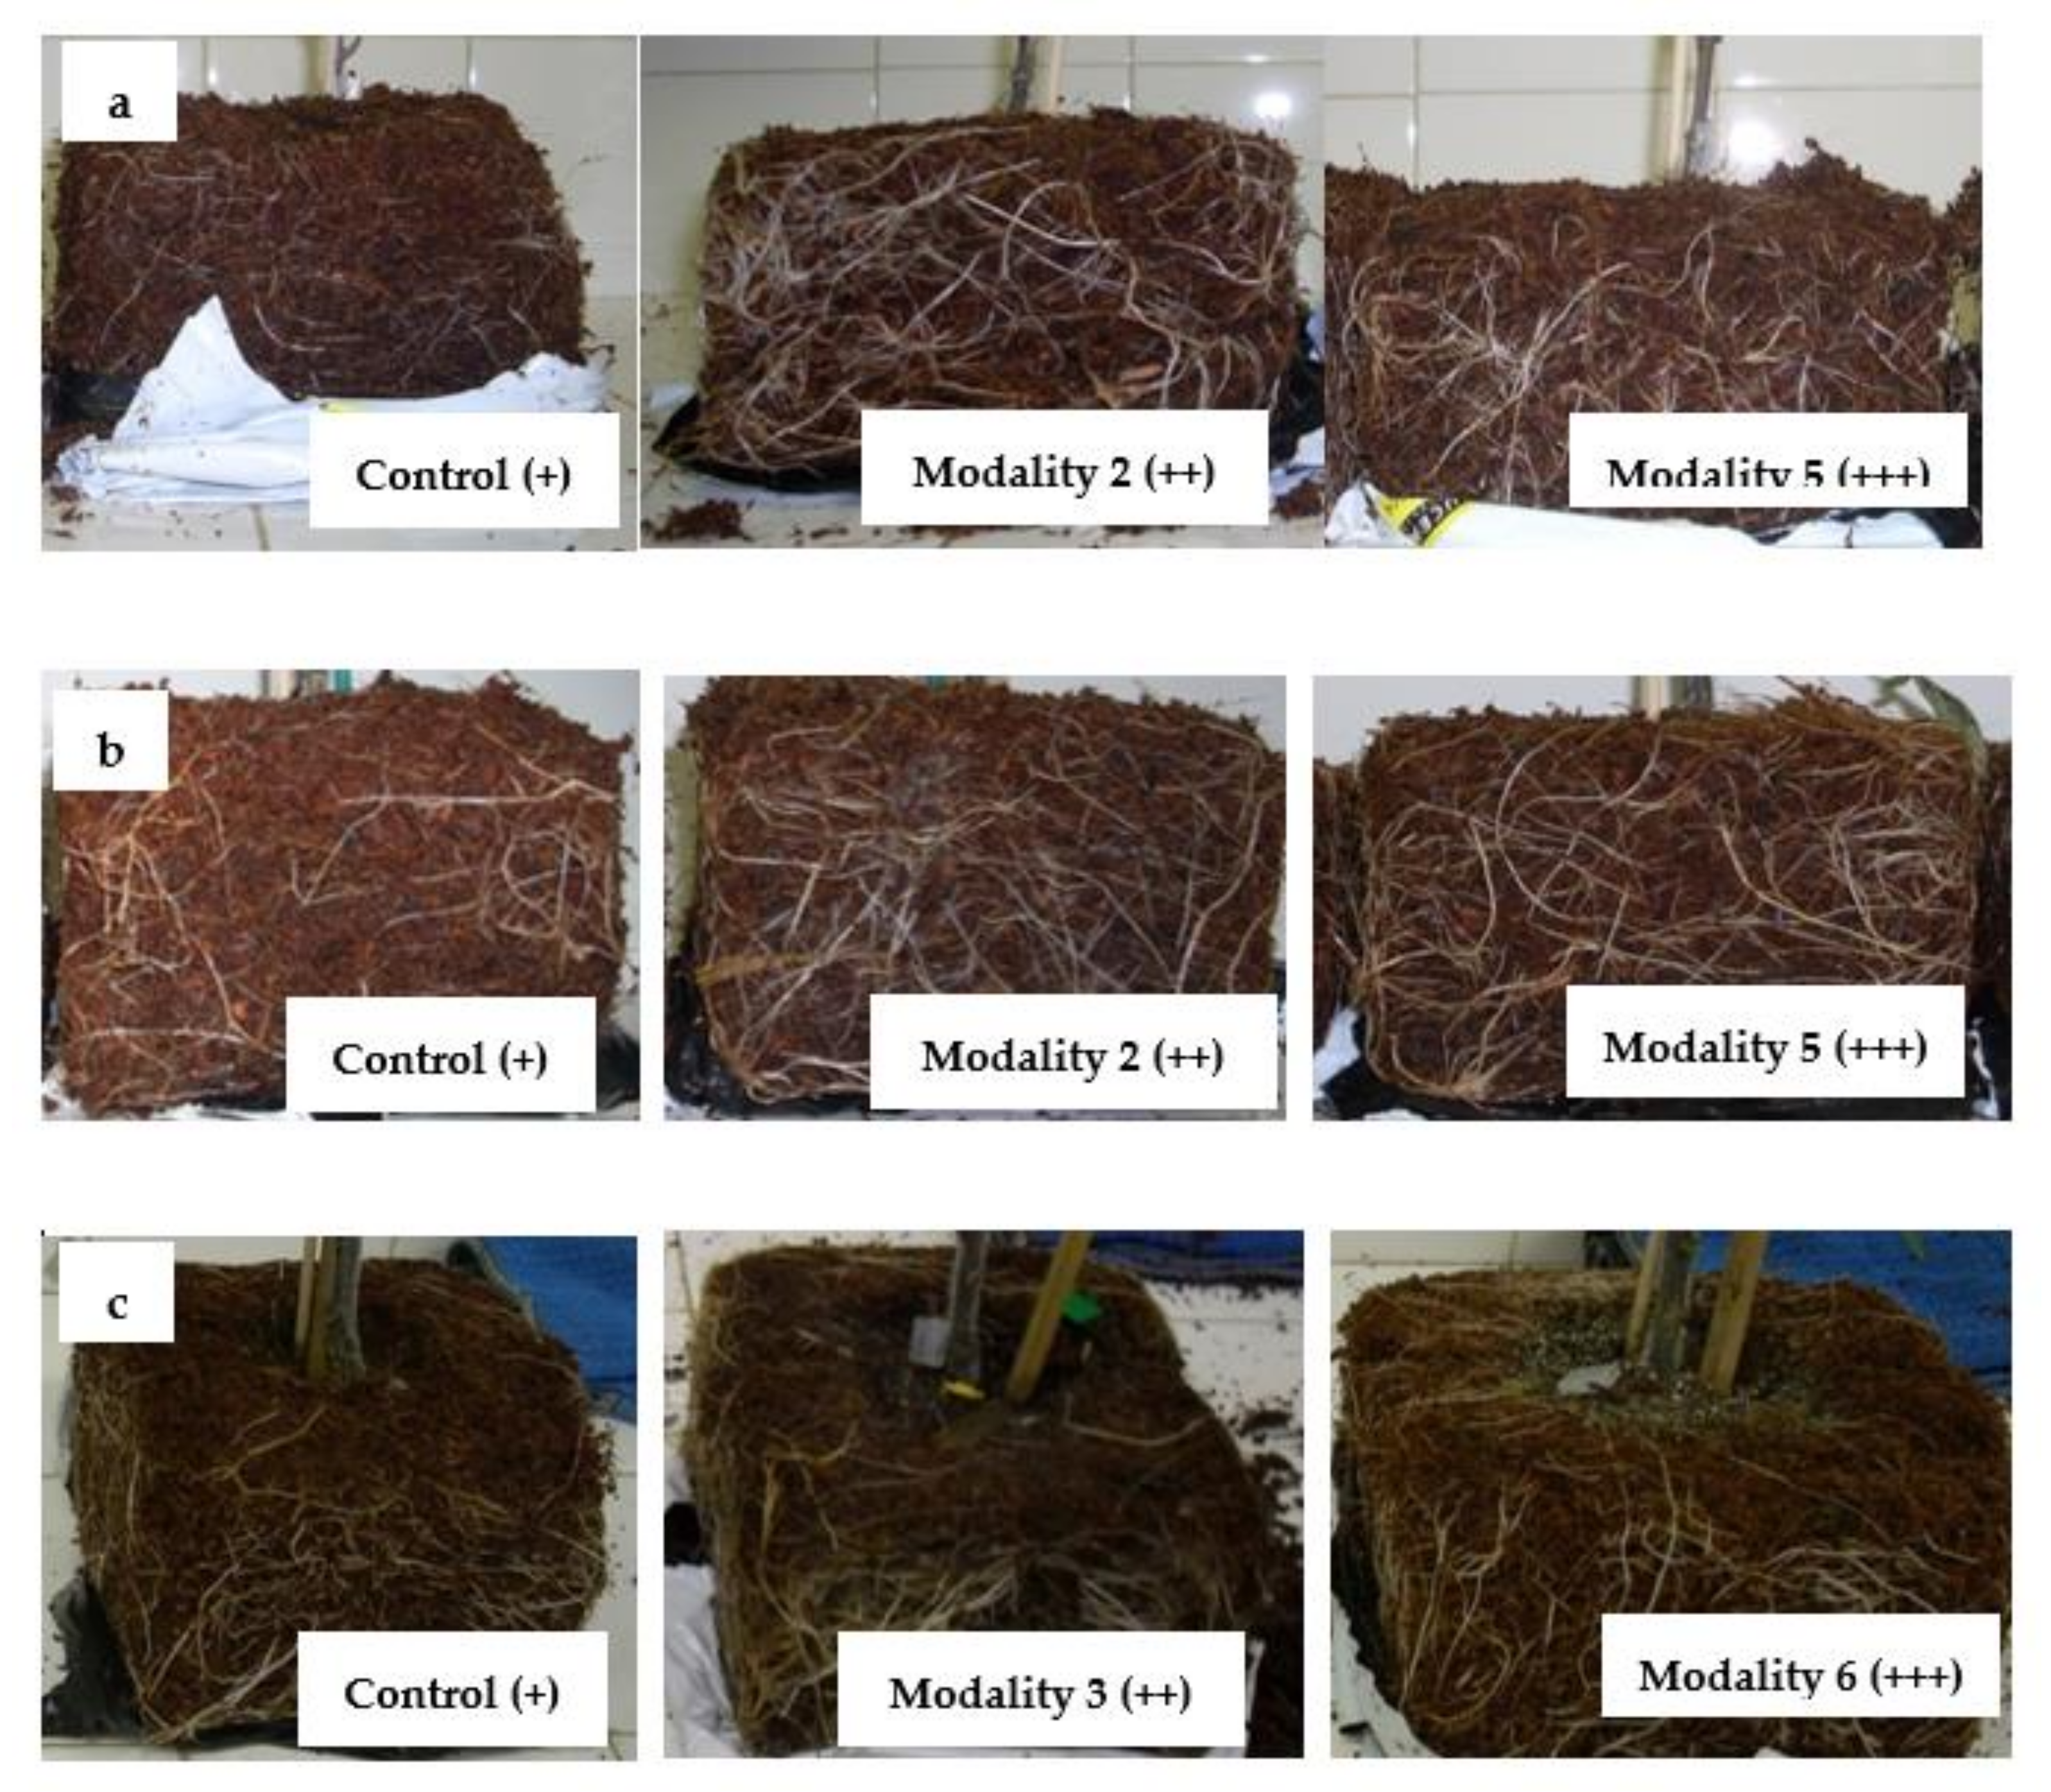
3.2.1. Root Development
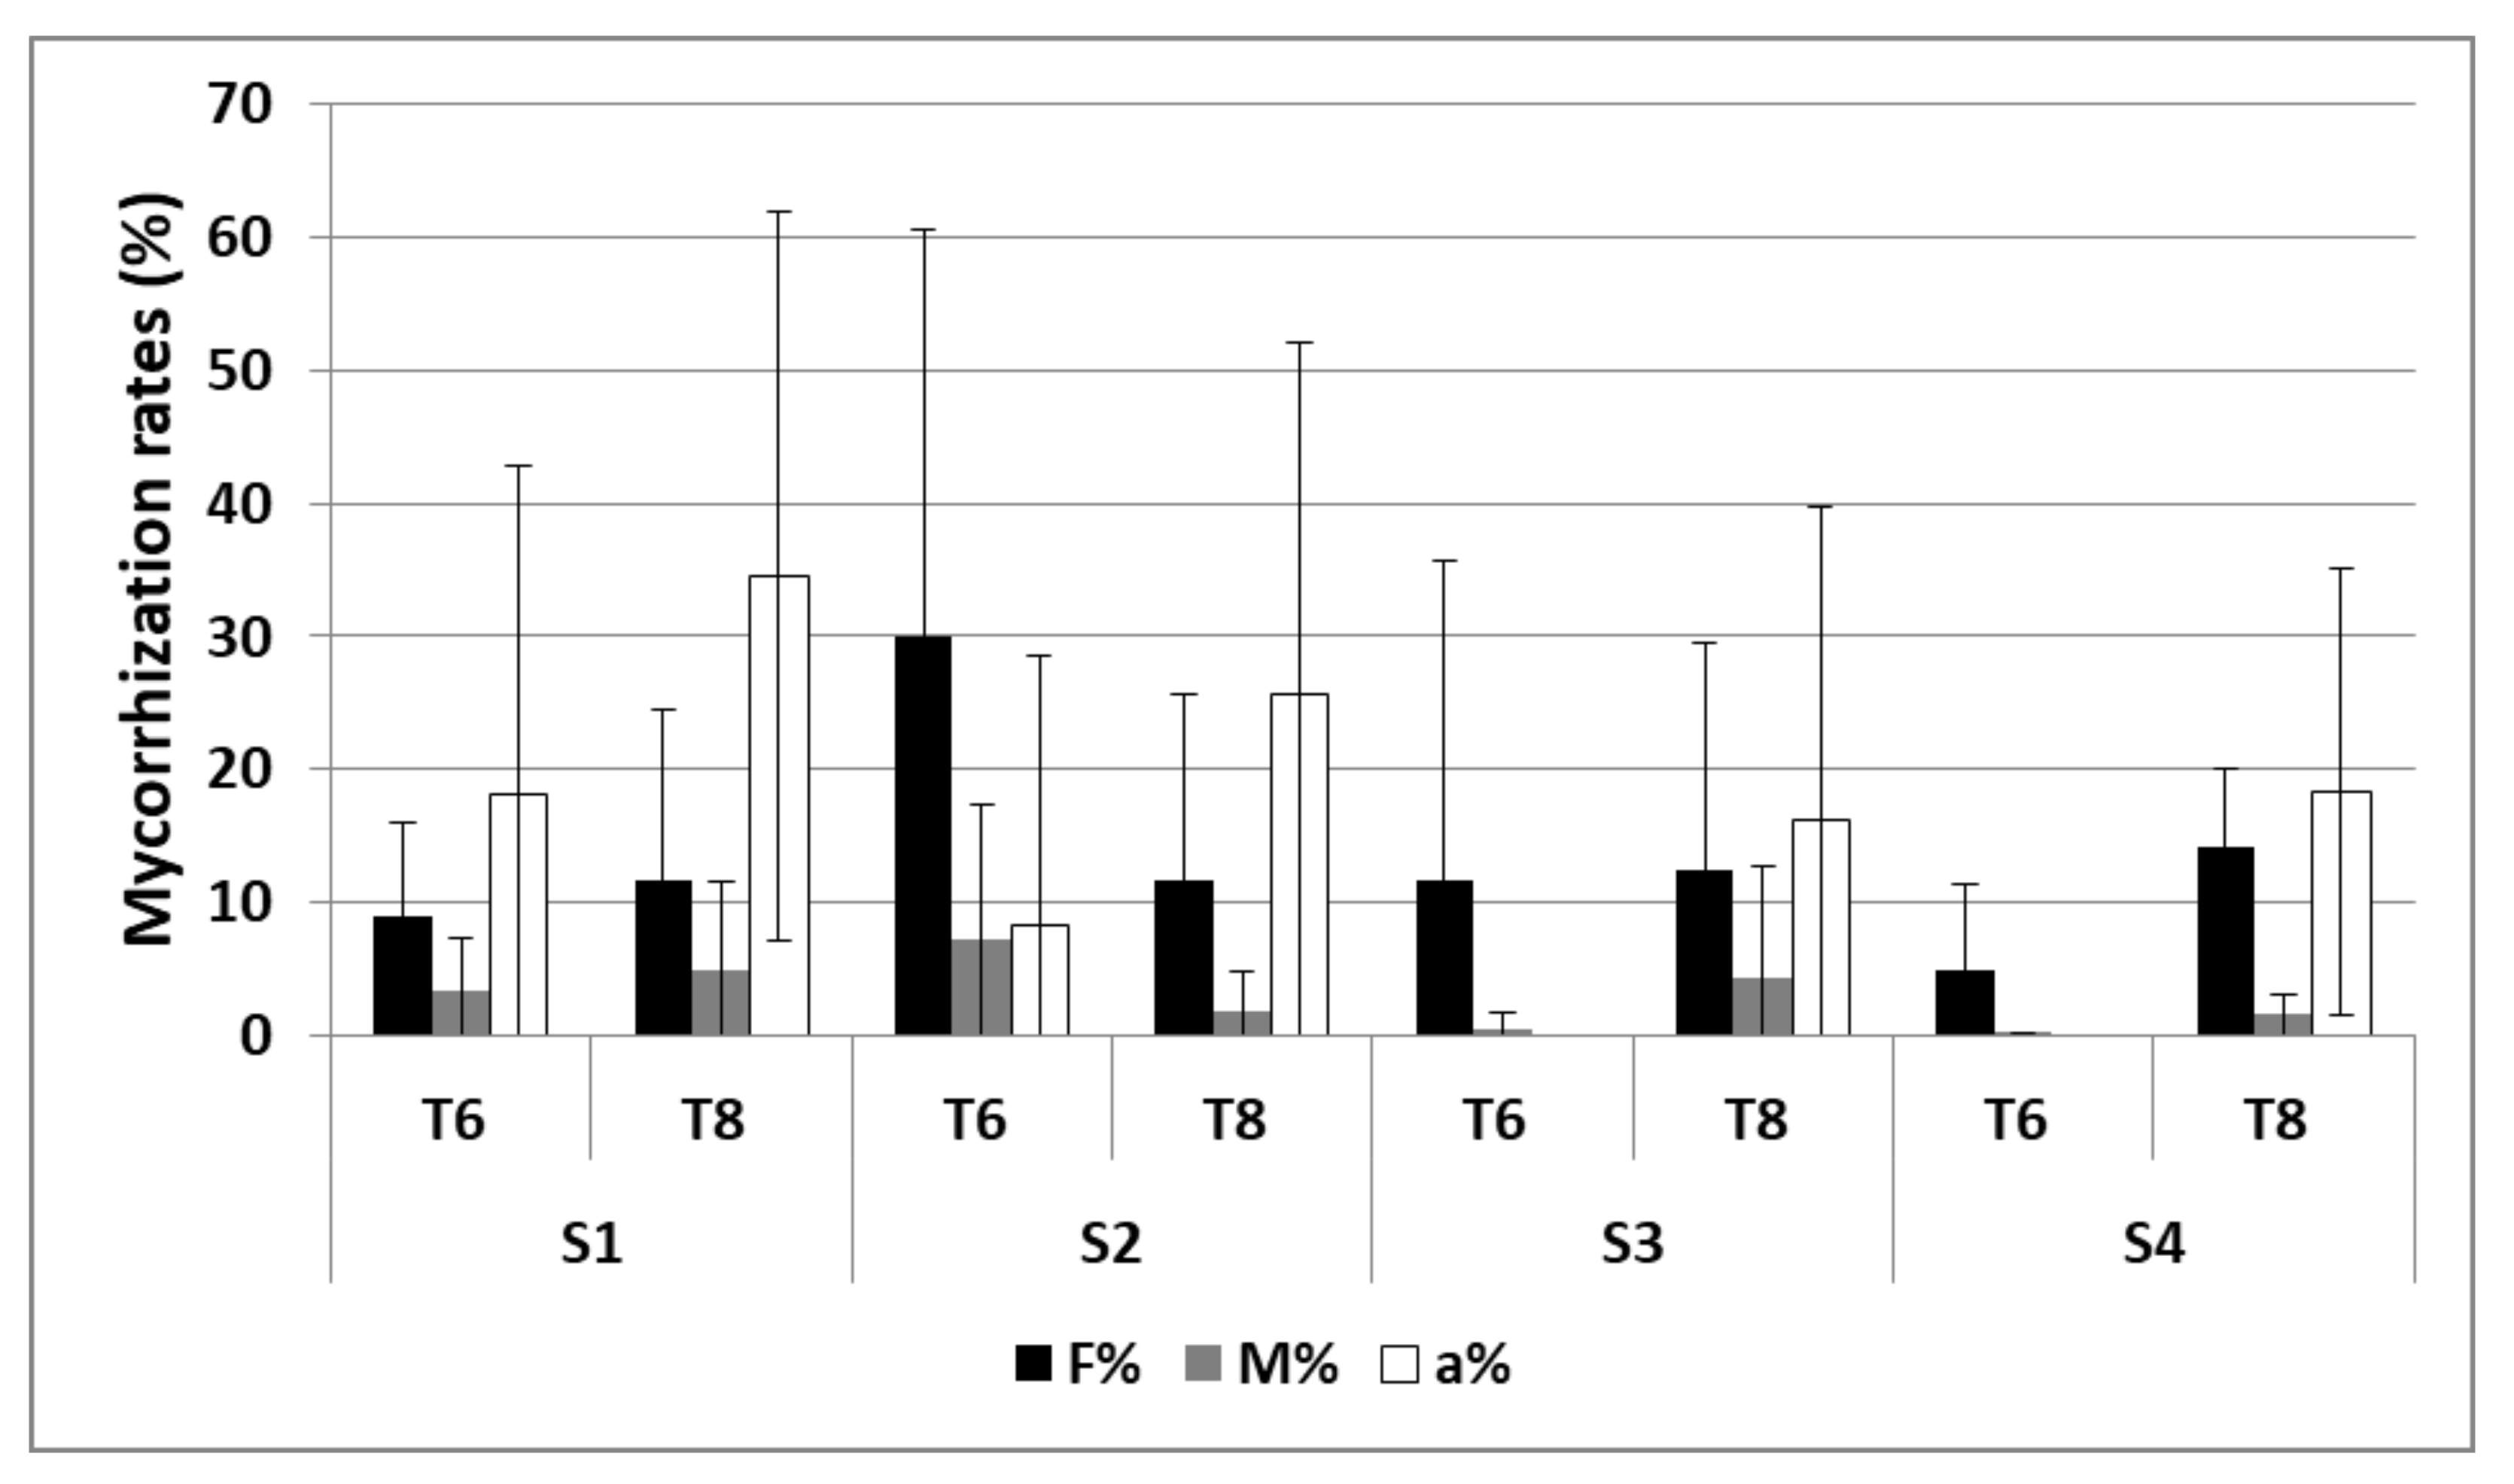
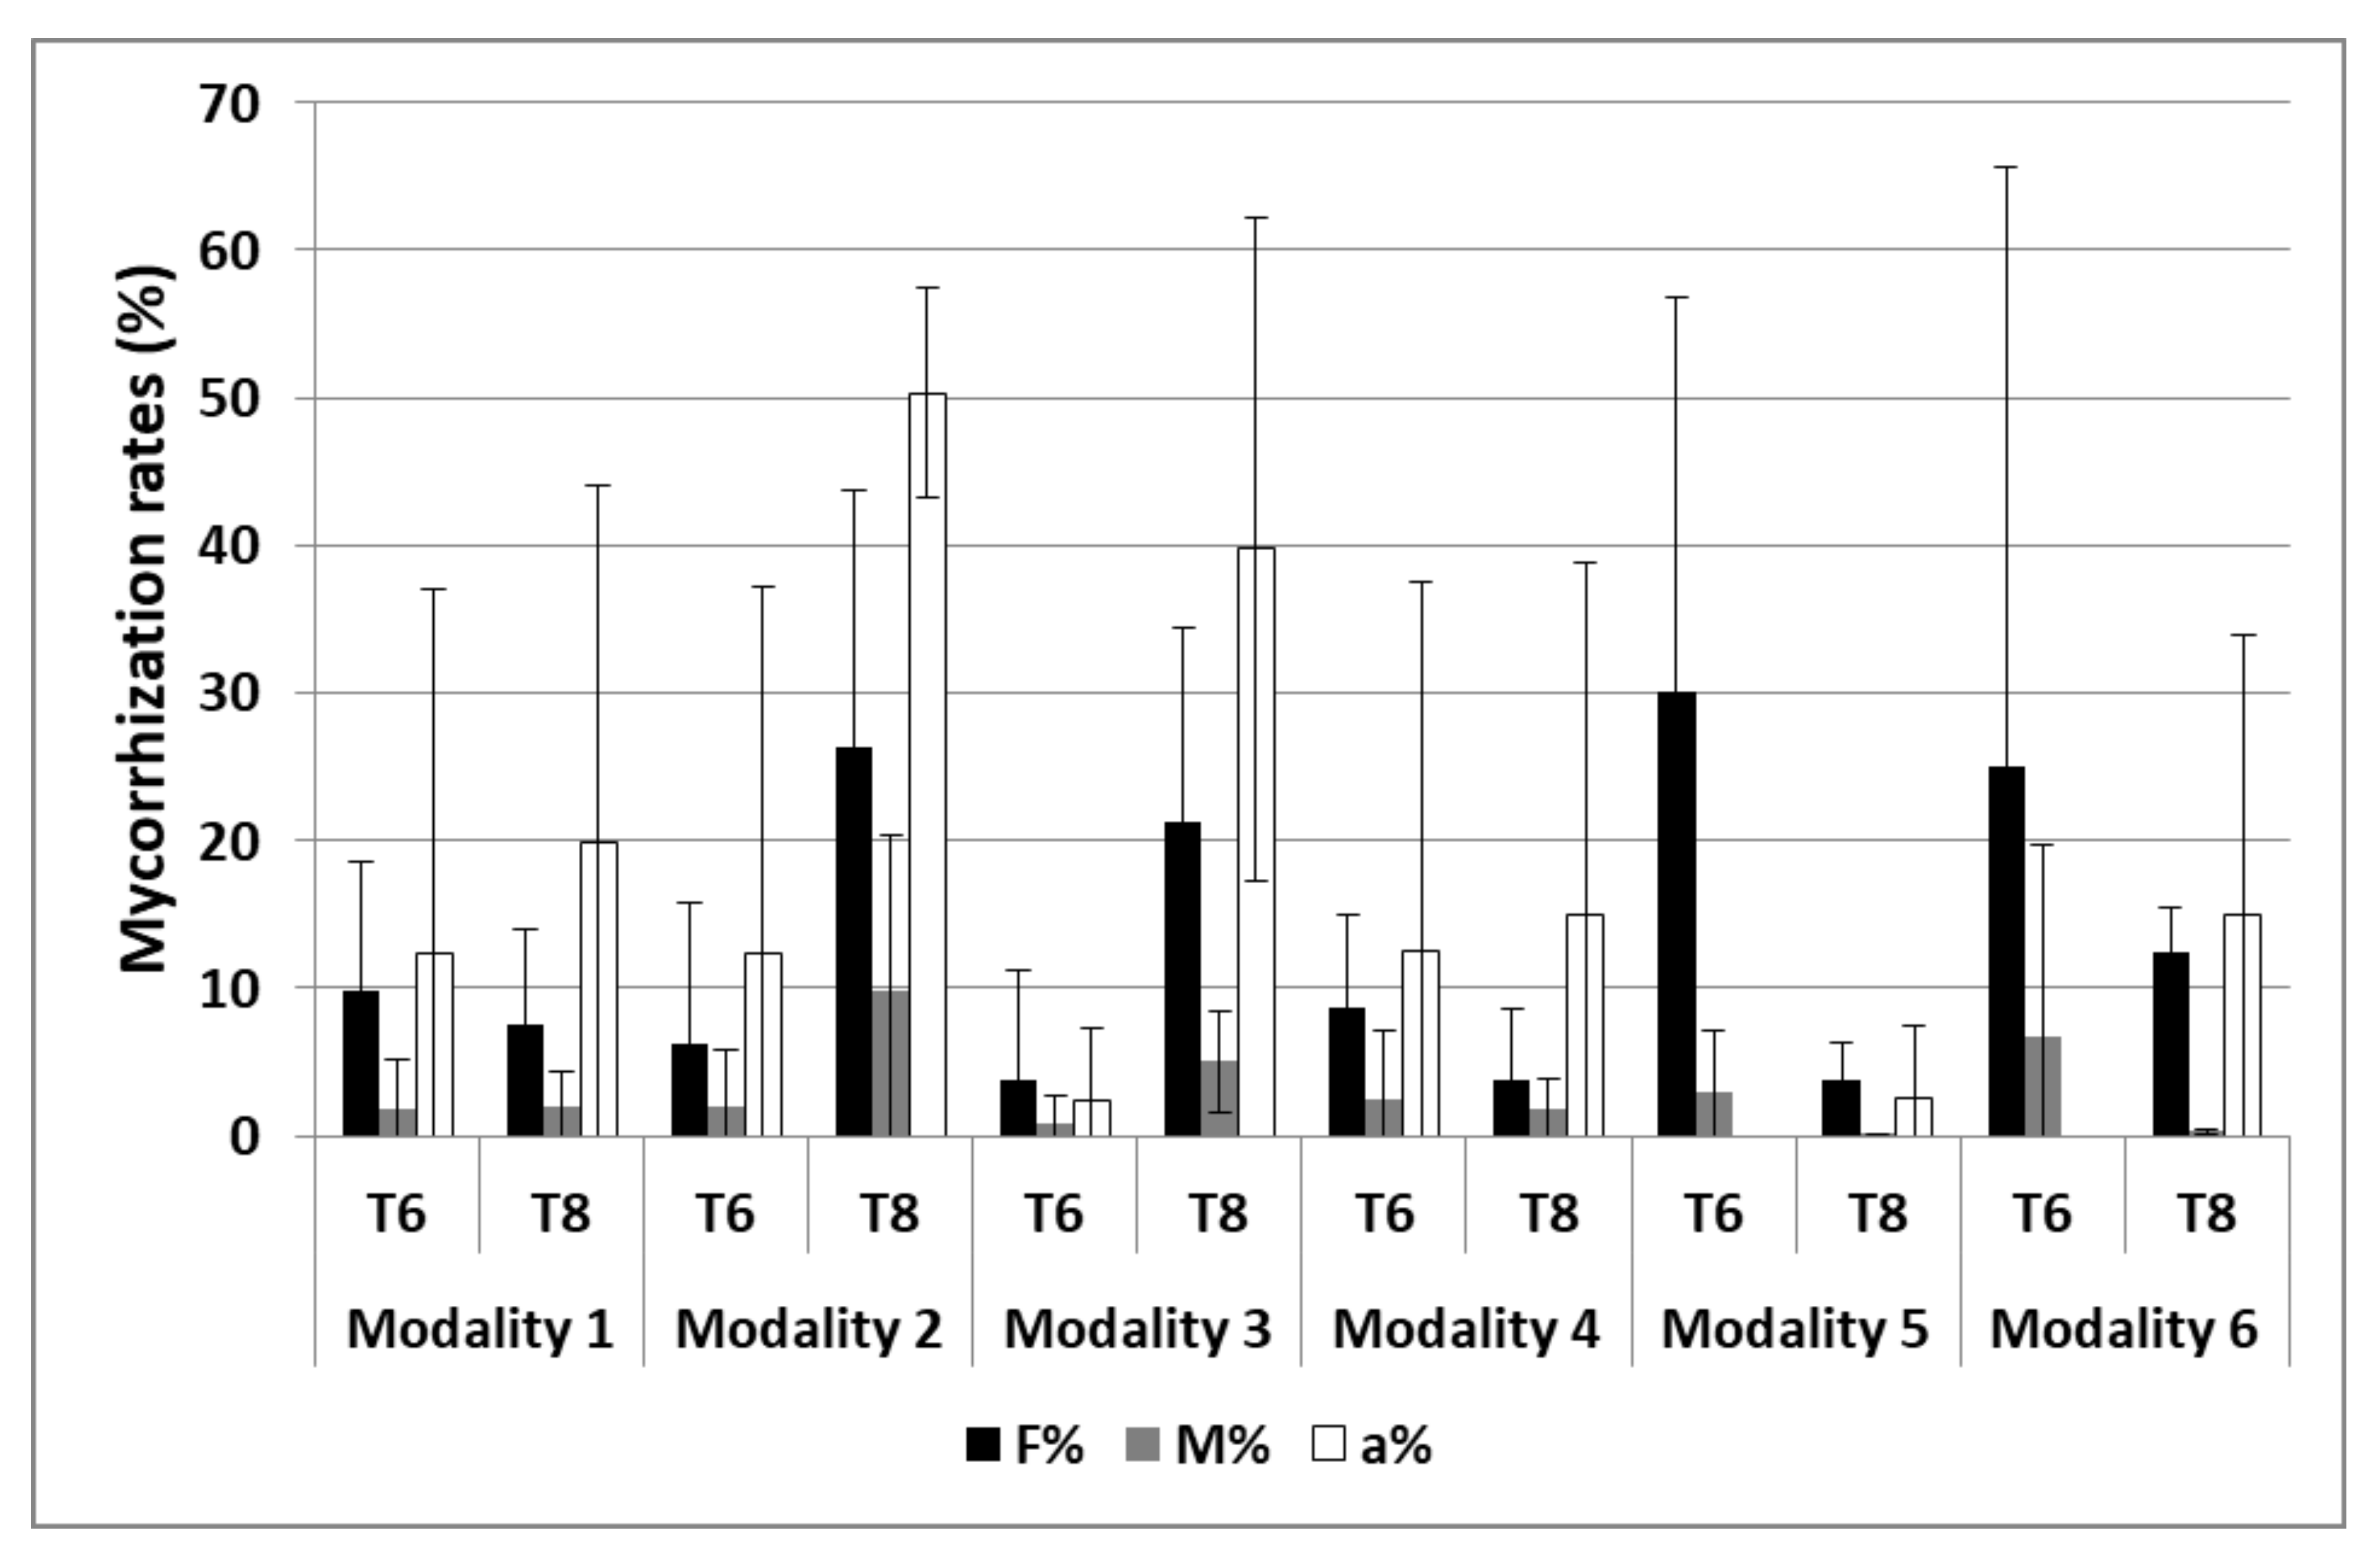
3.2.2. Mycorrhization
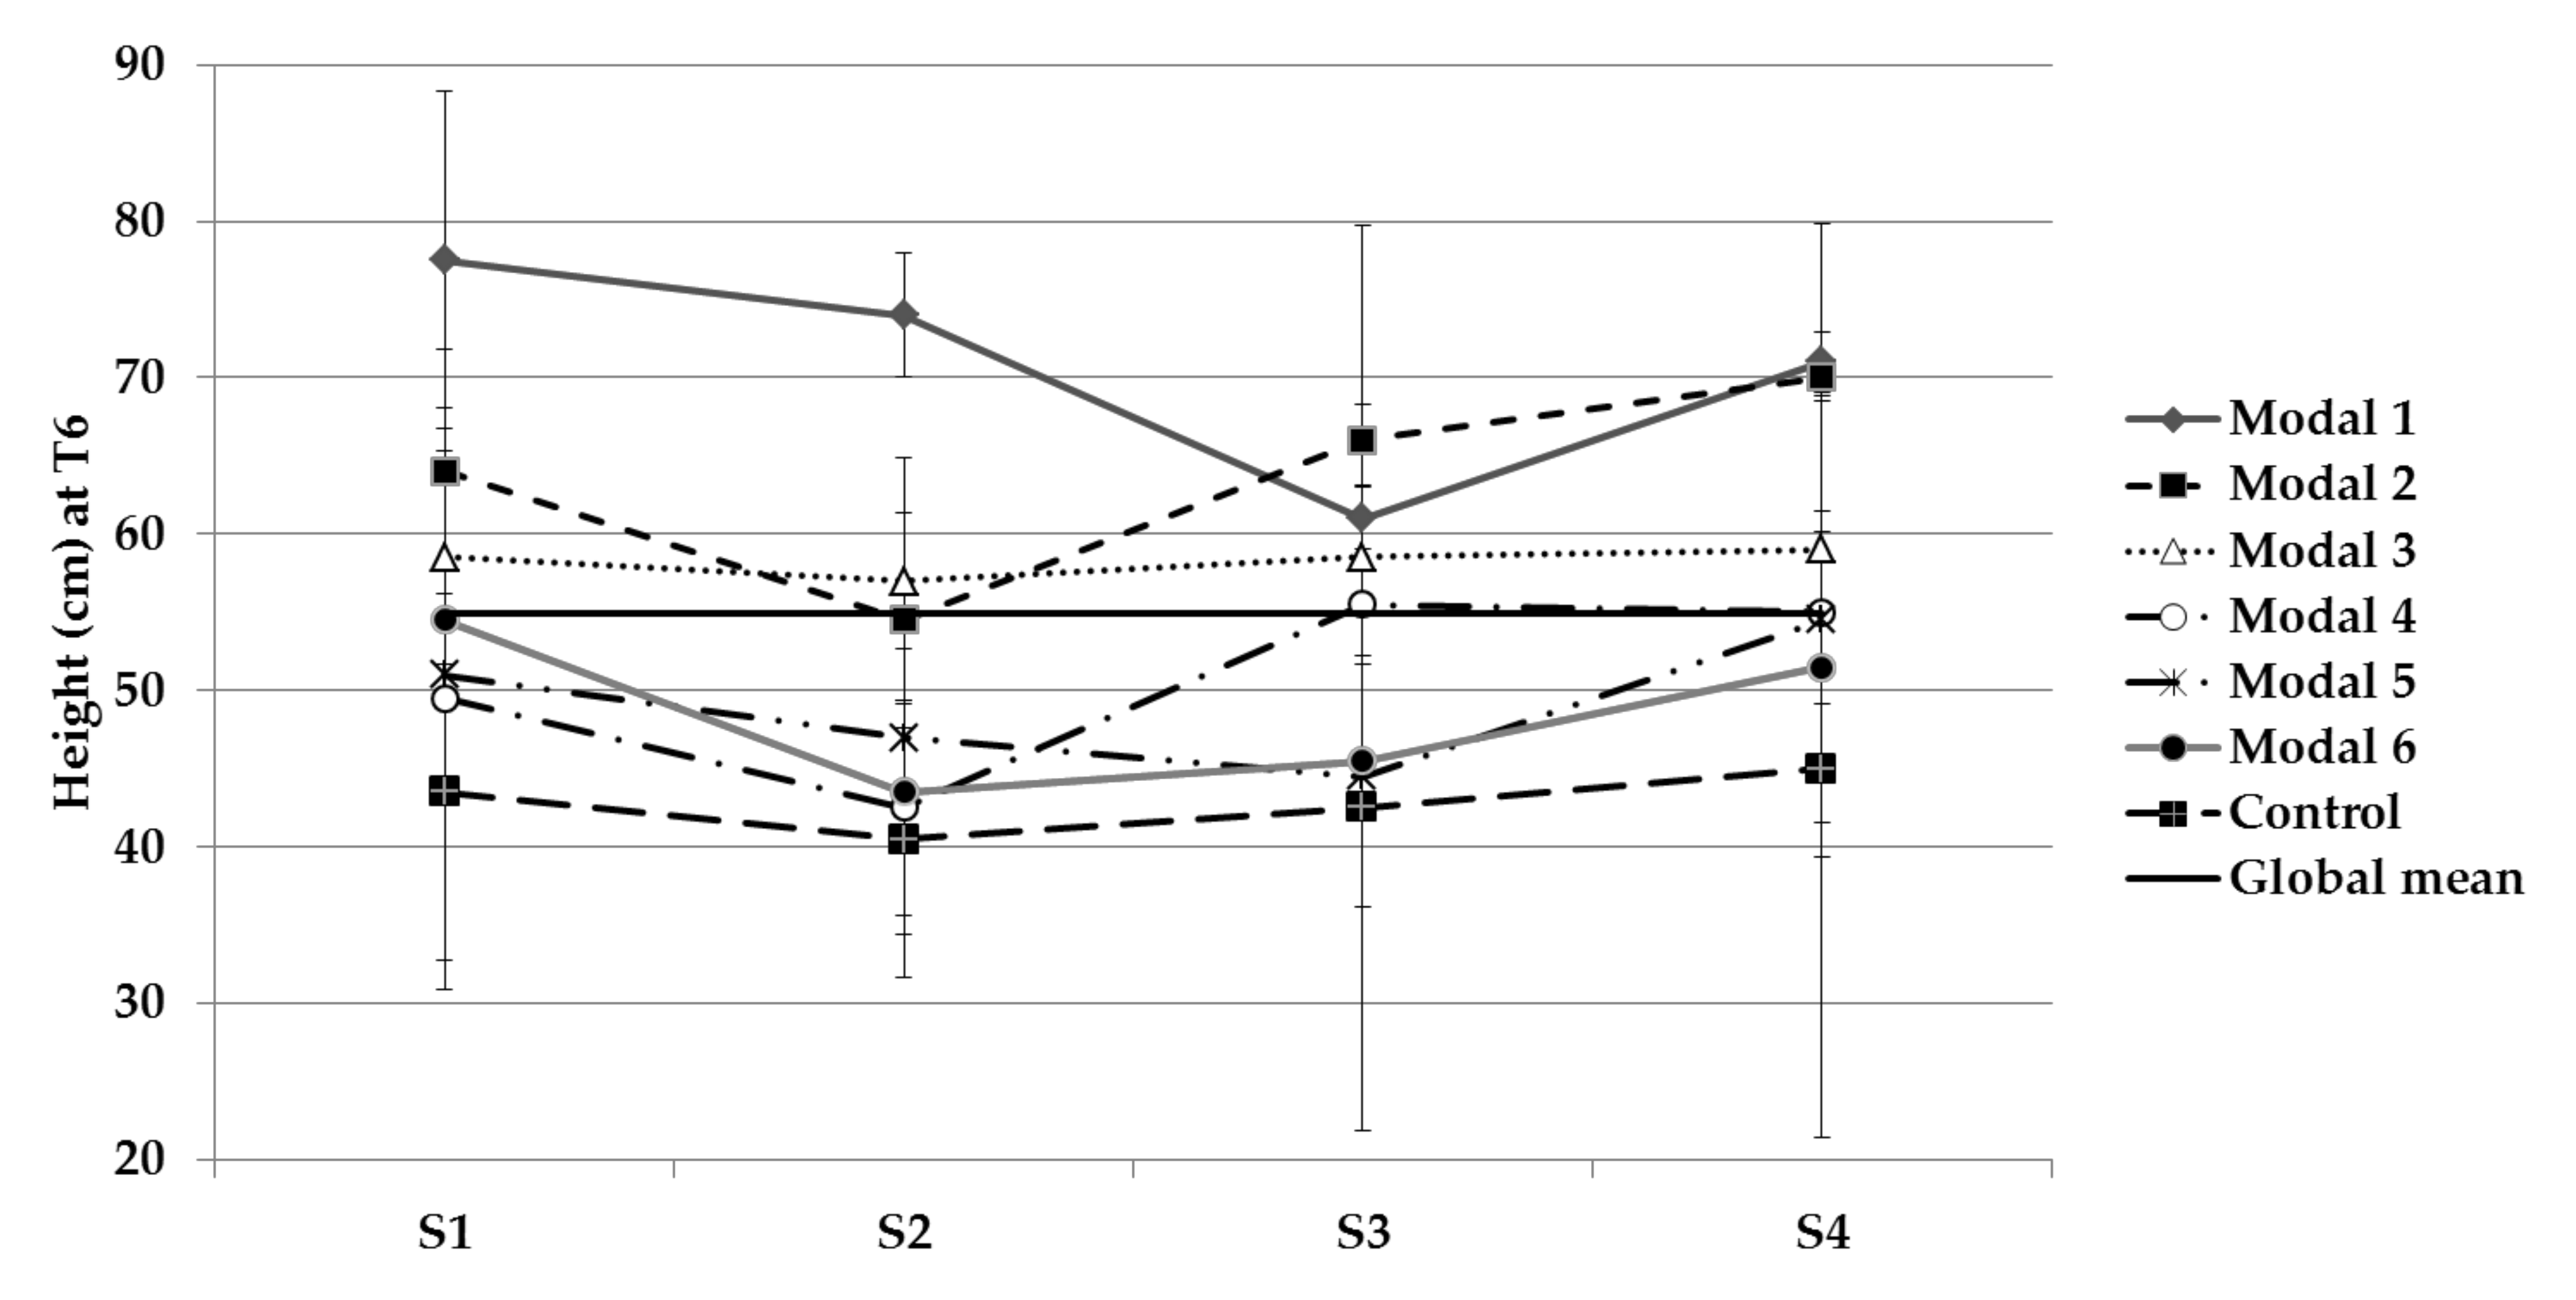
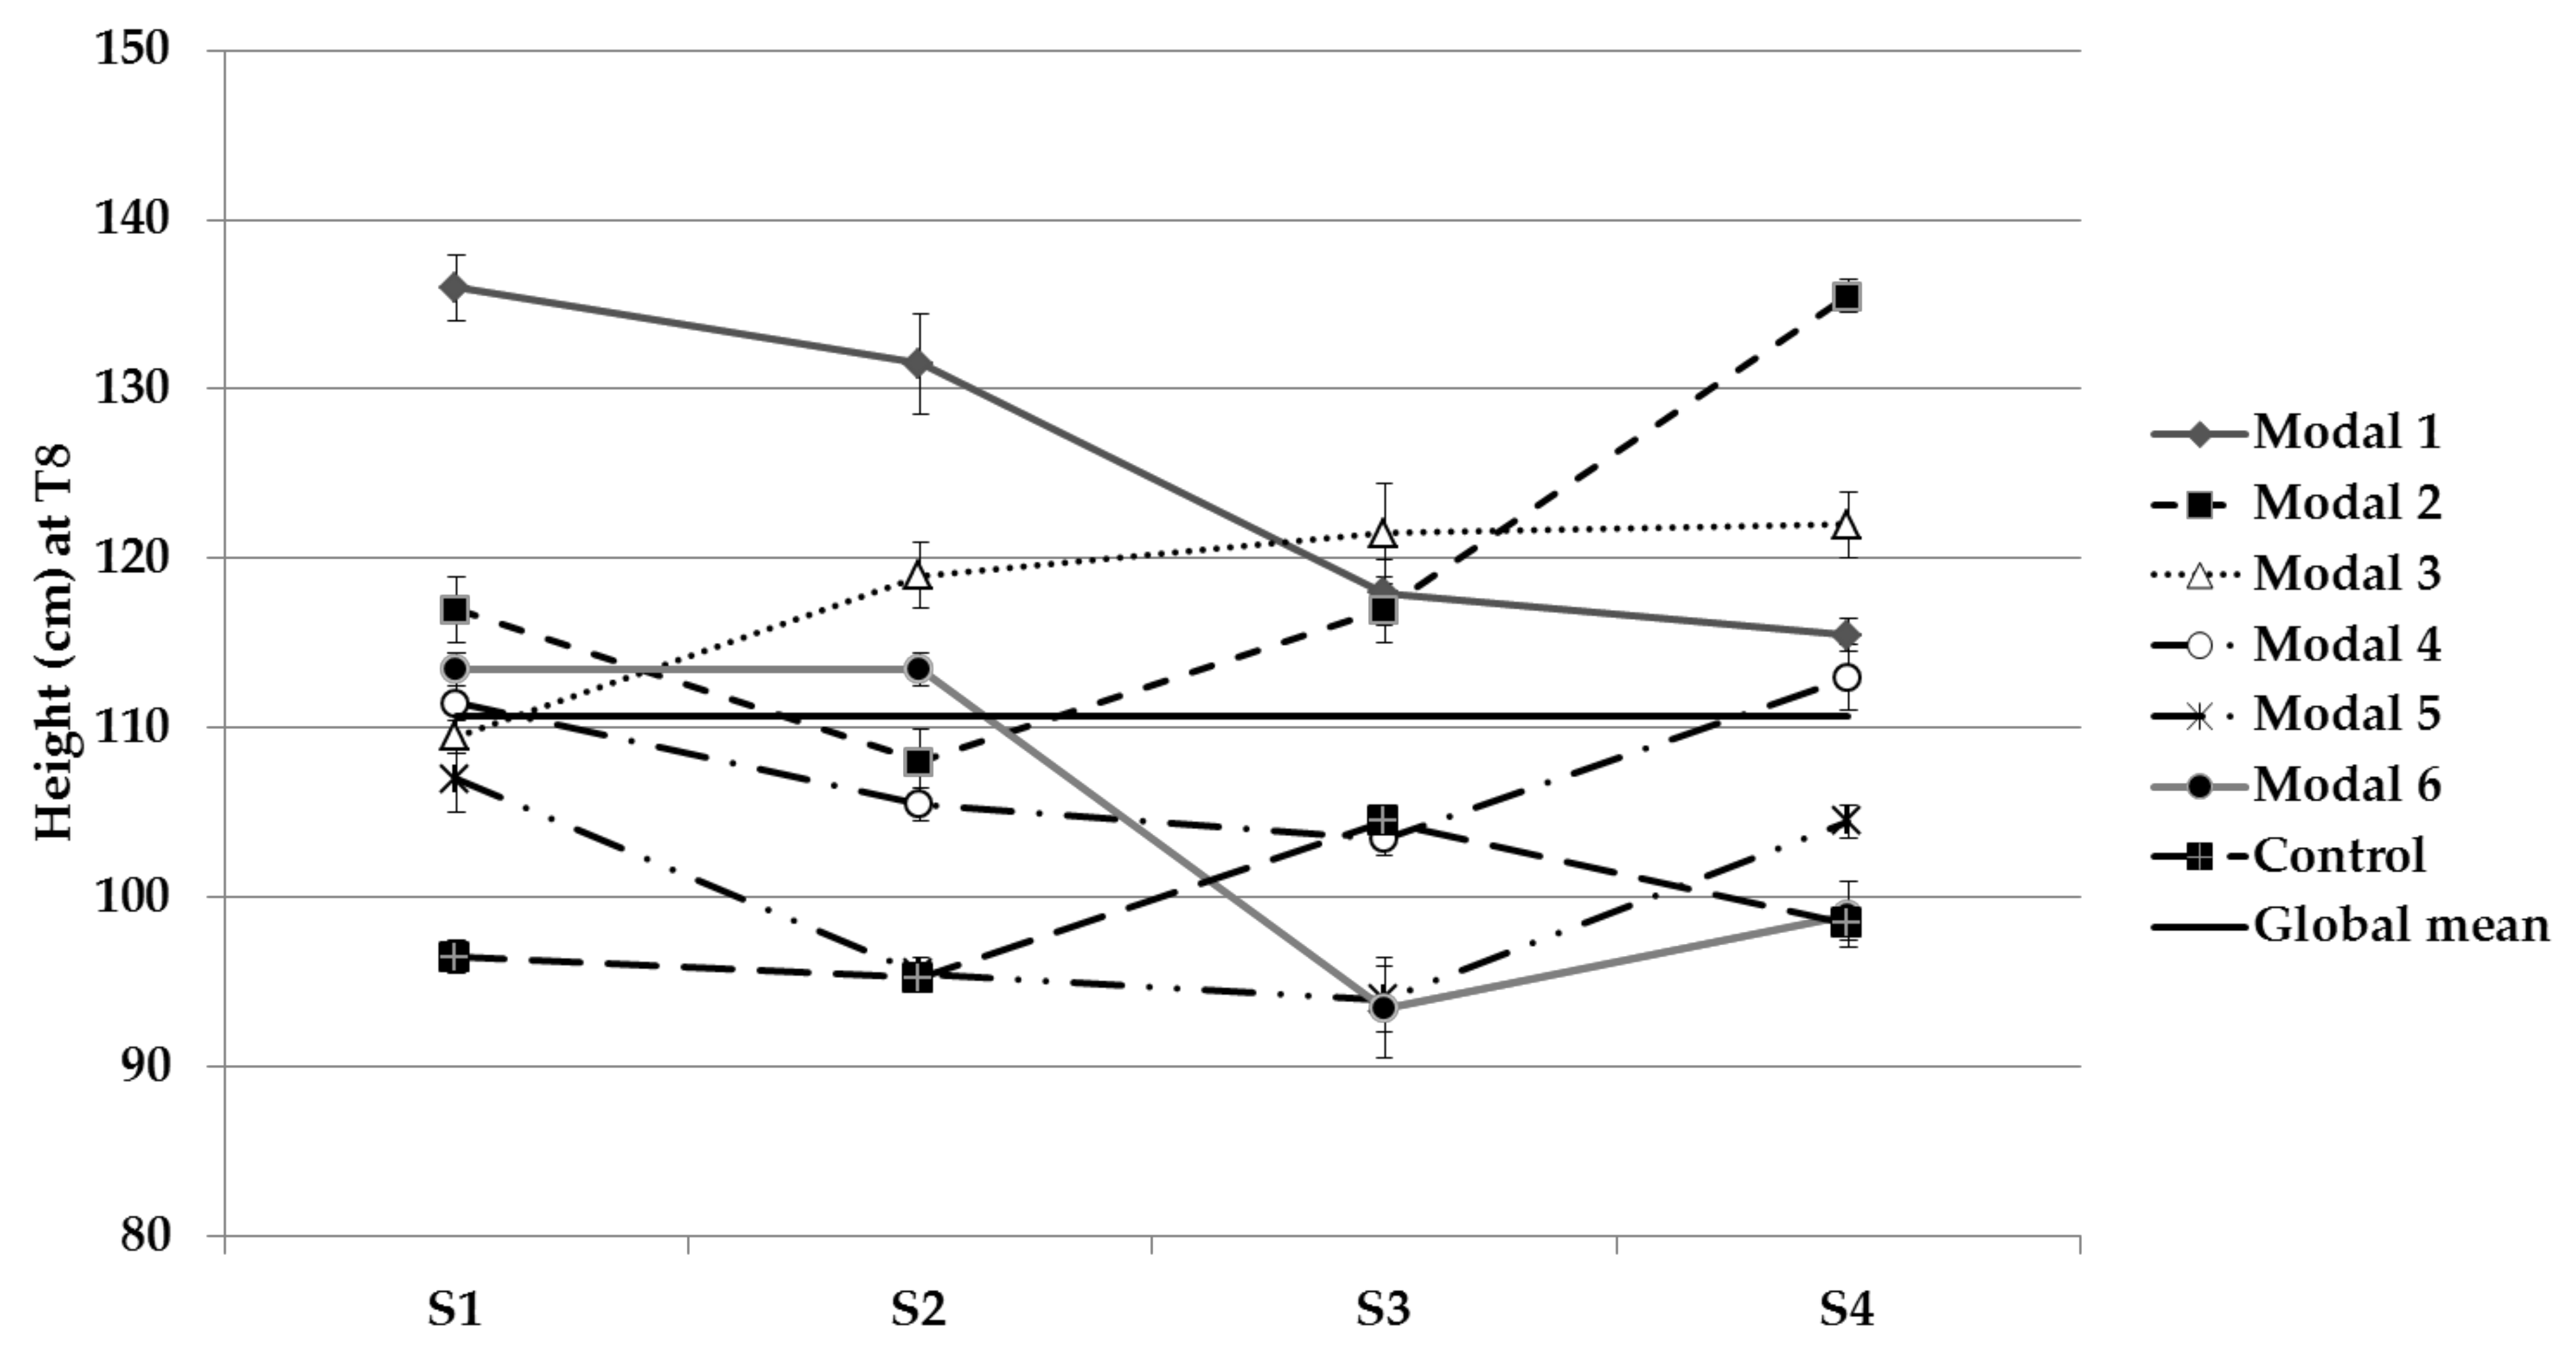
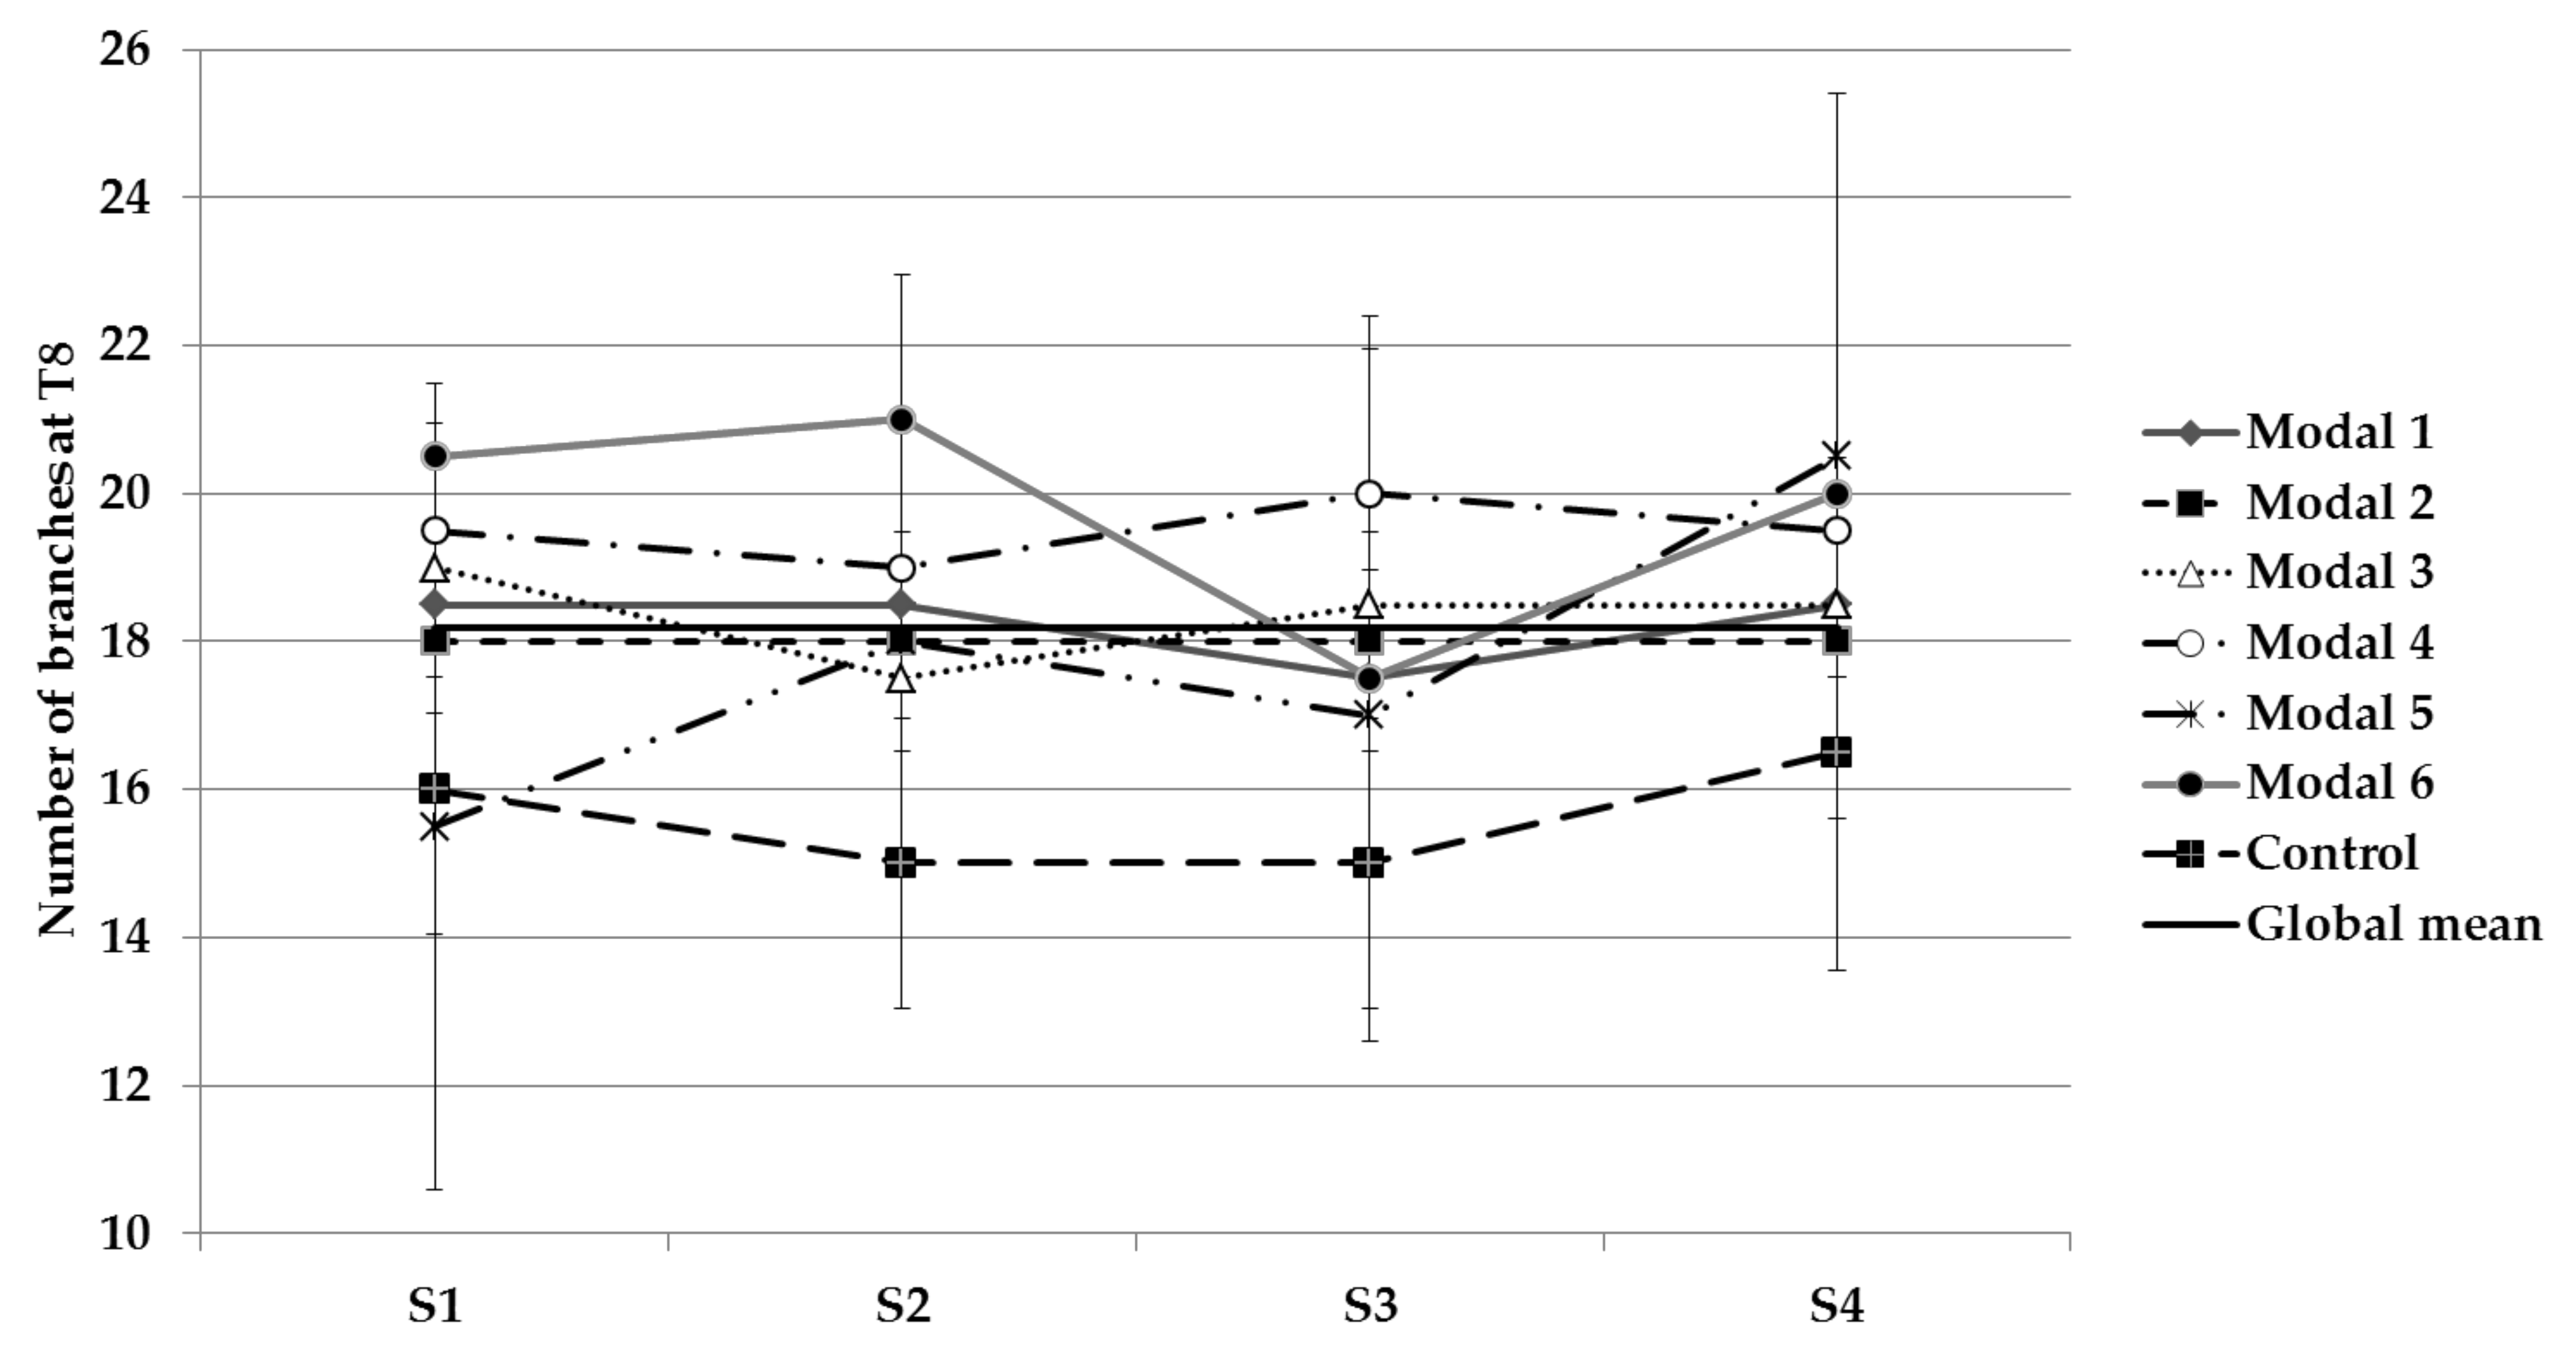
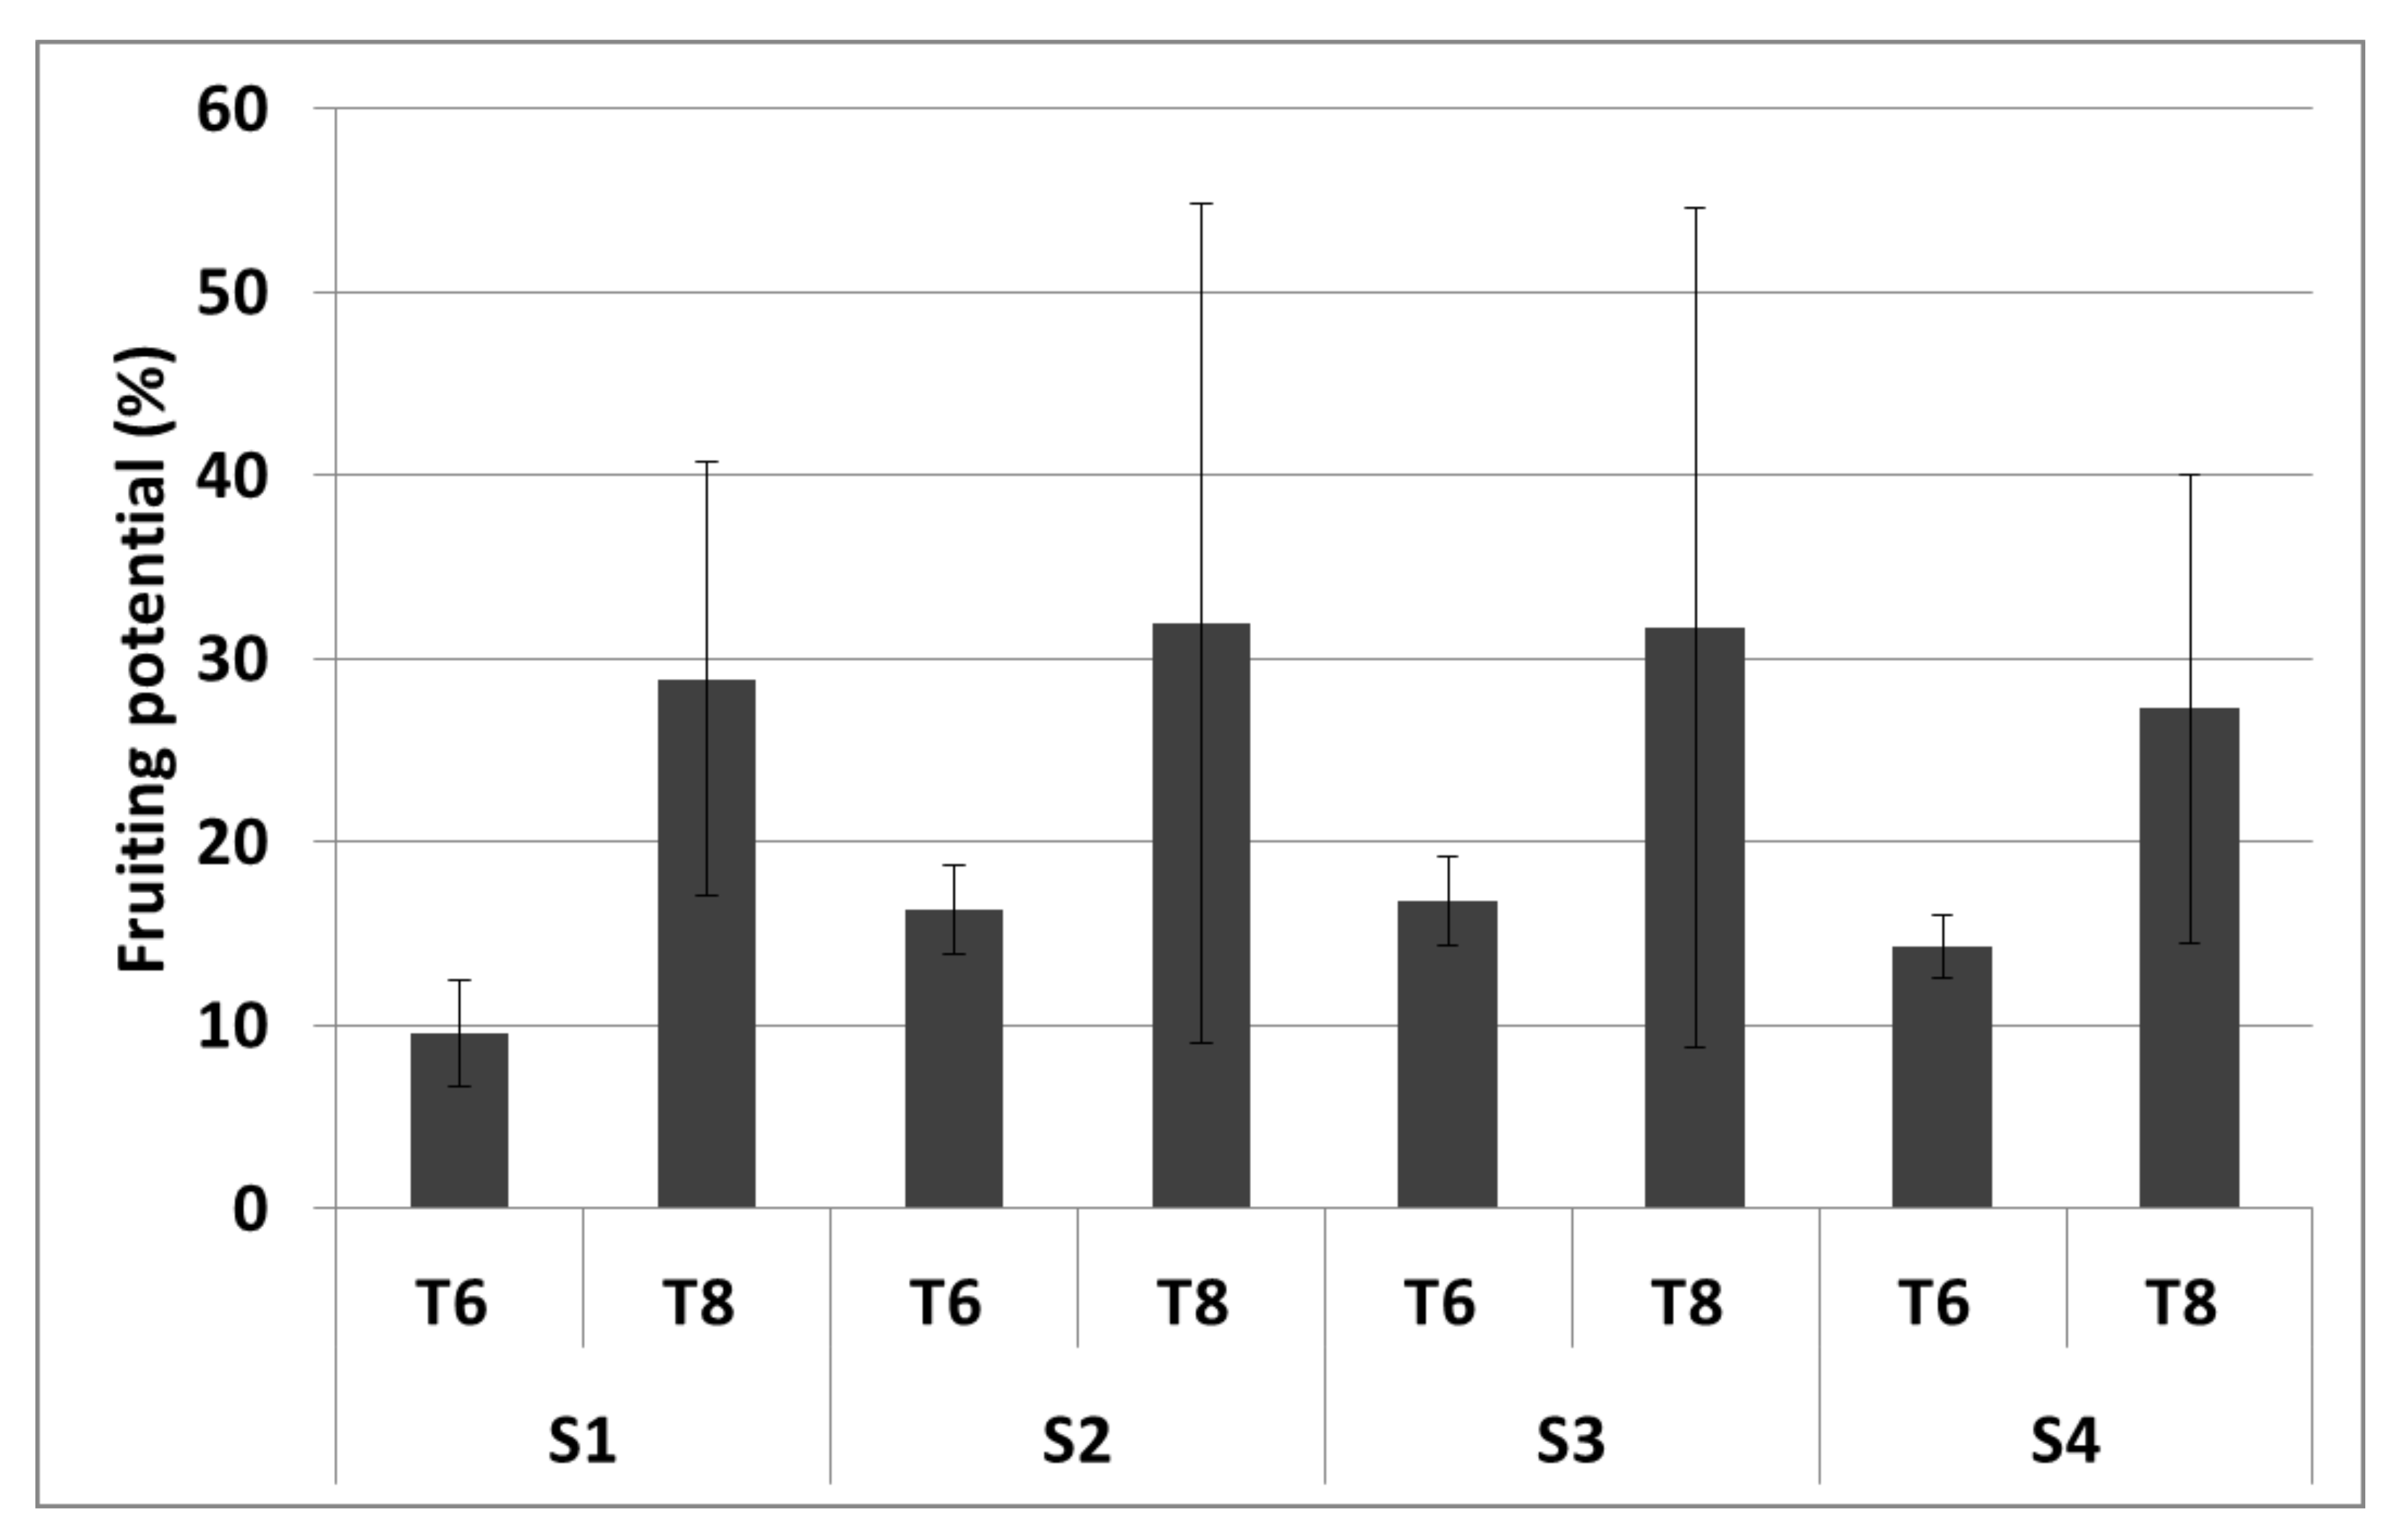
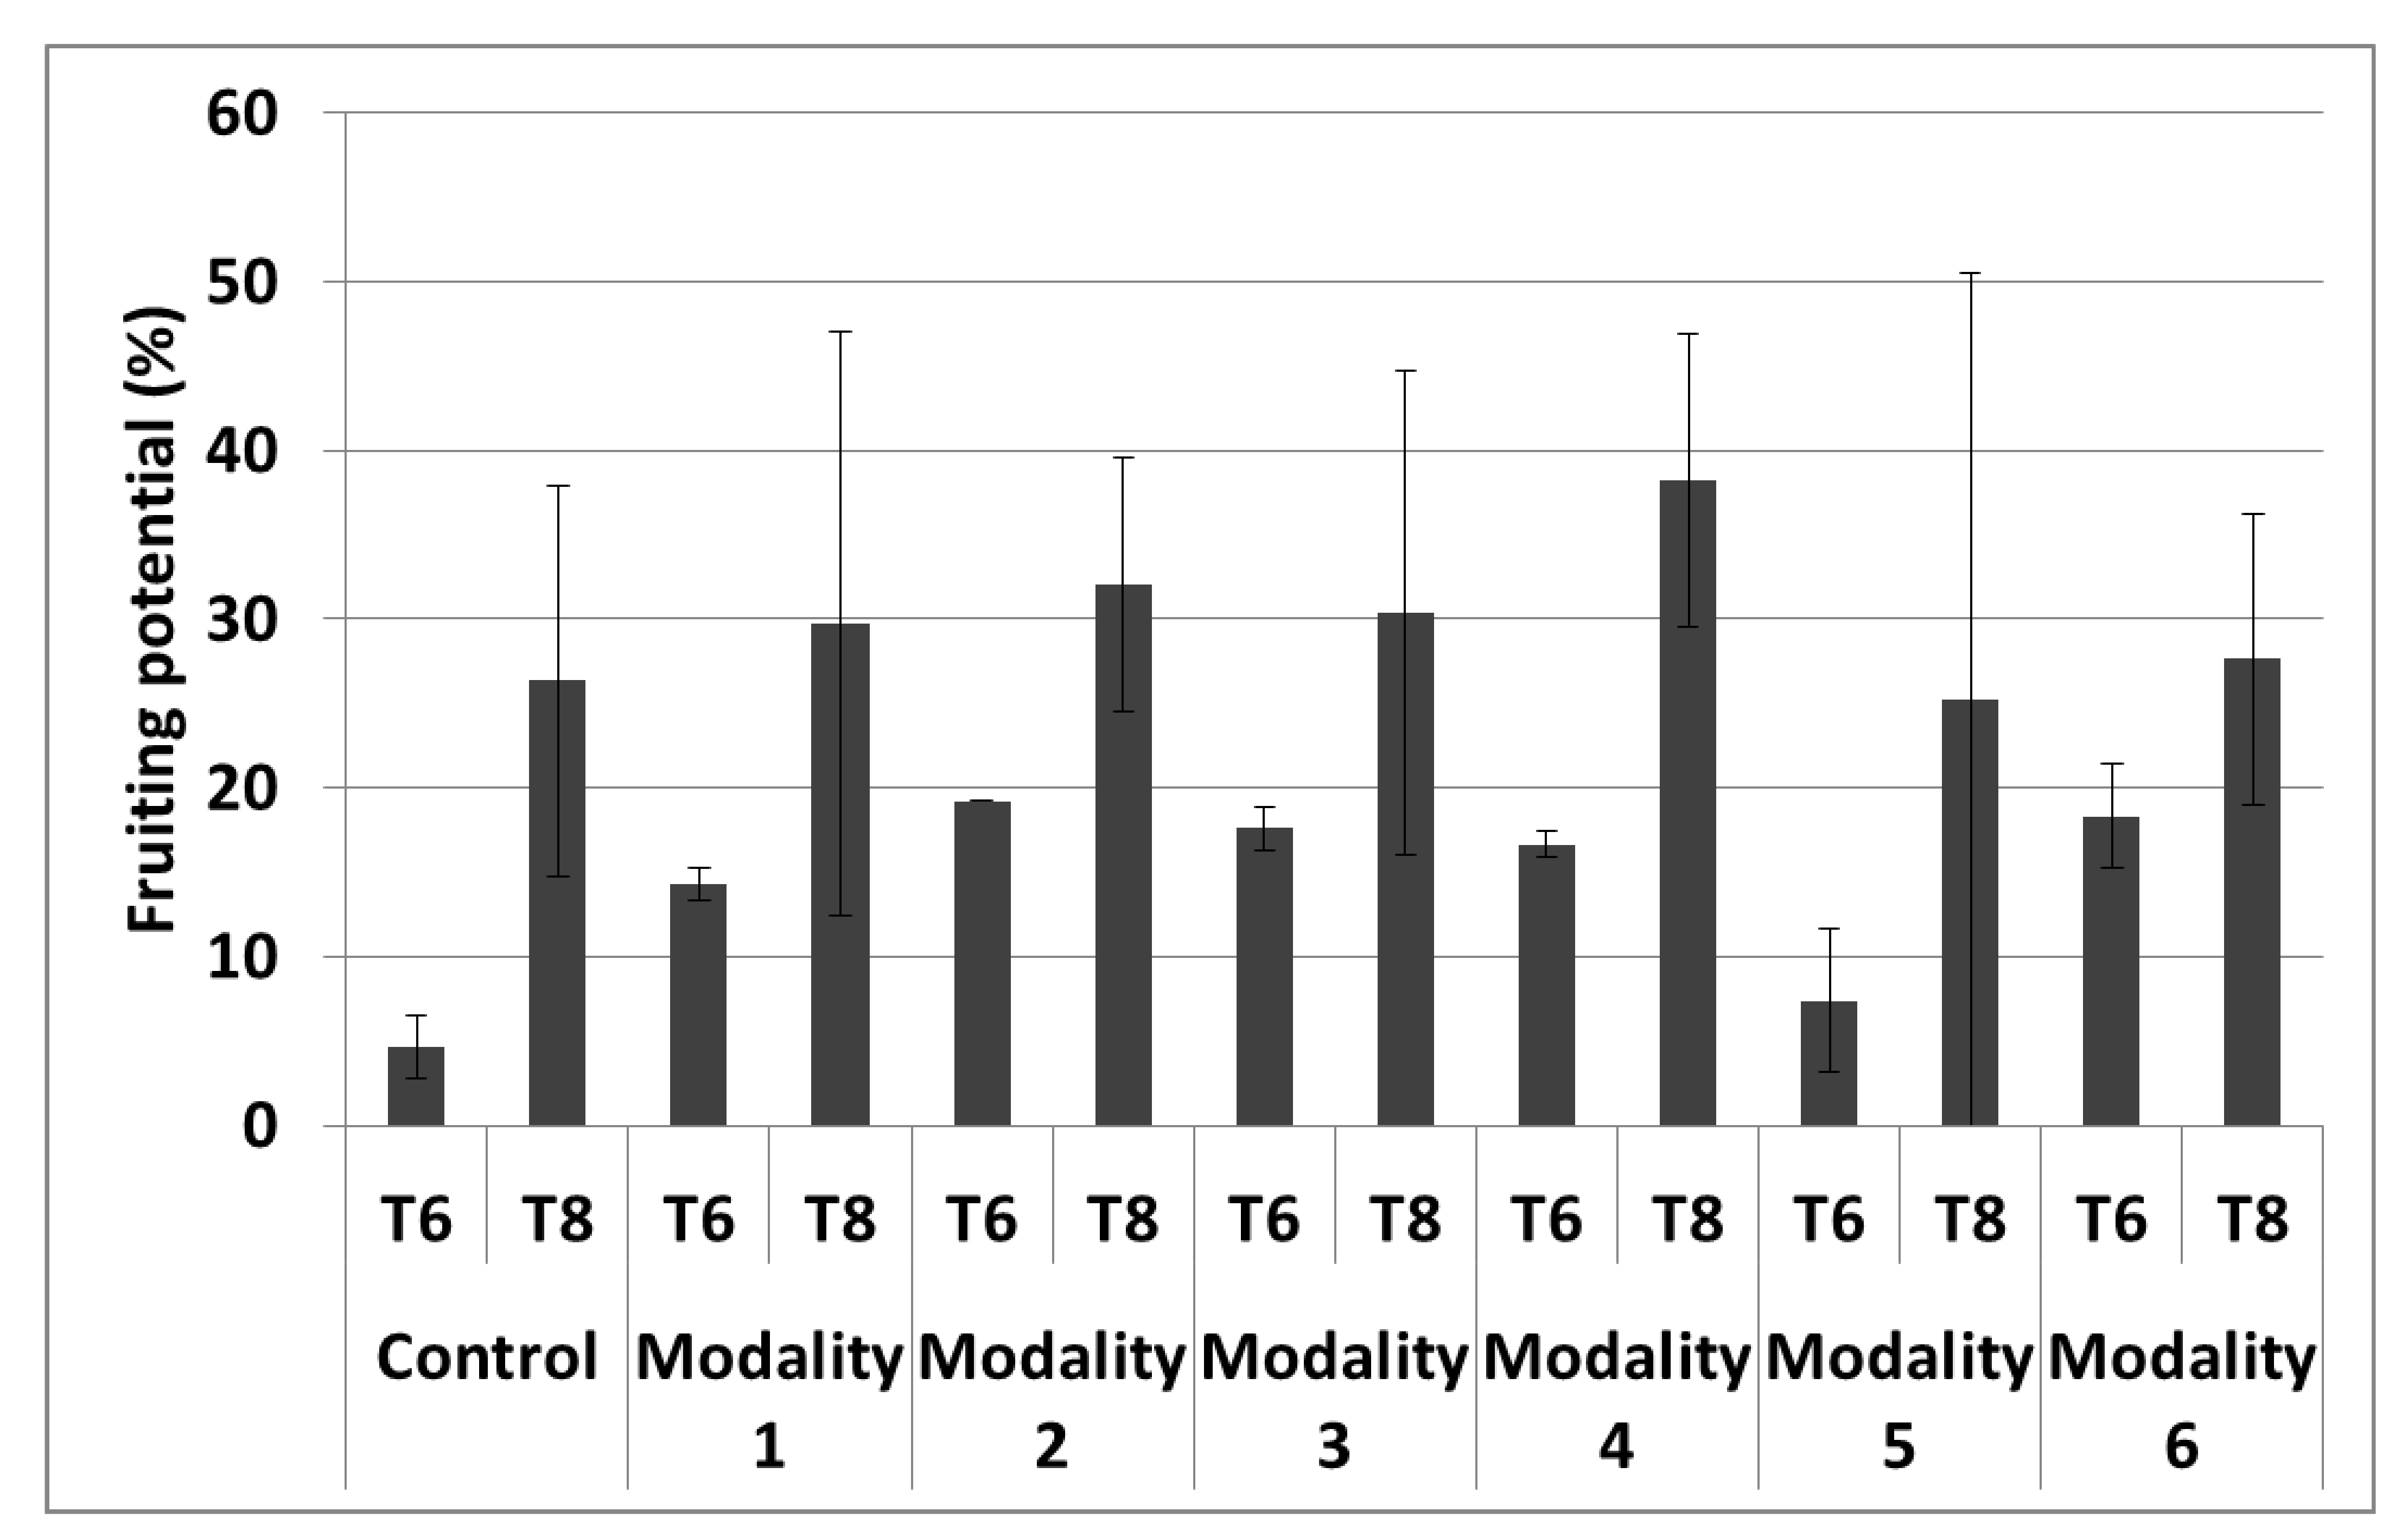
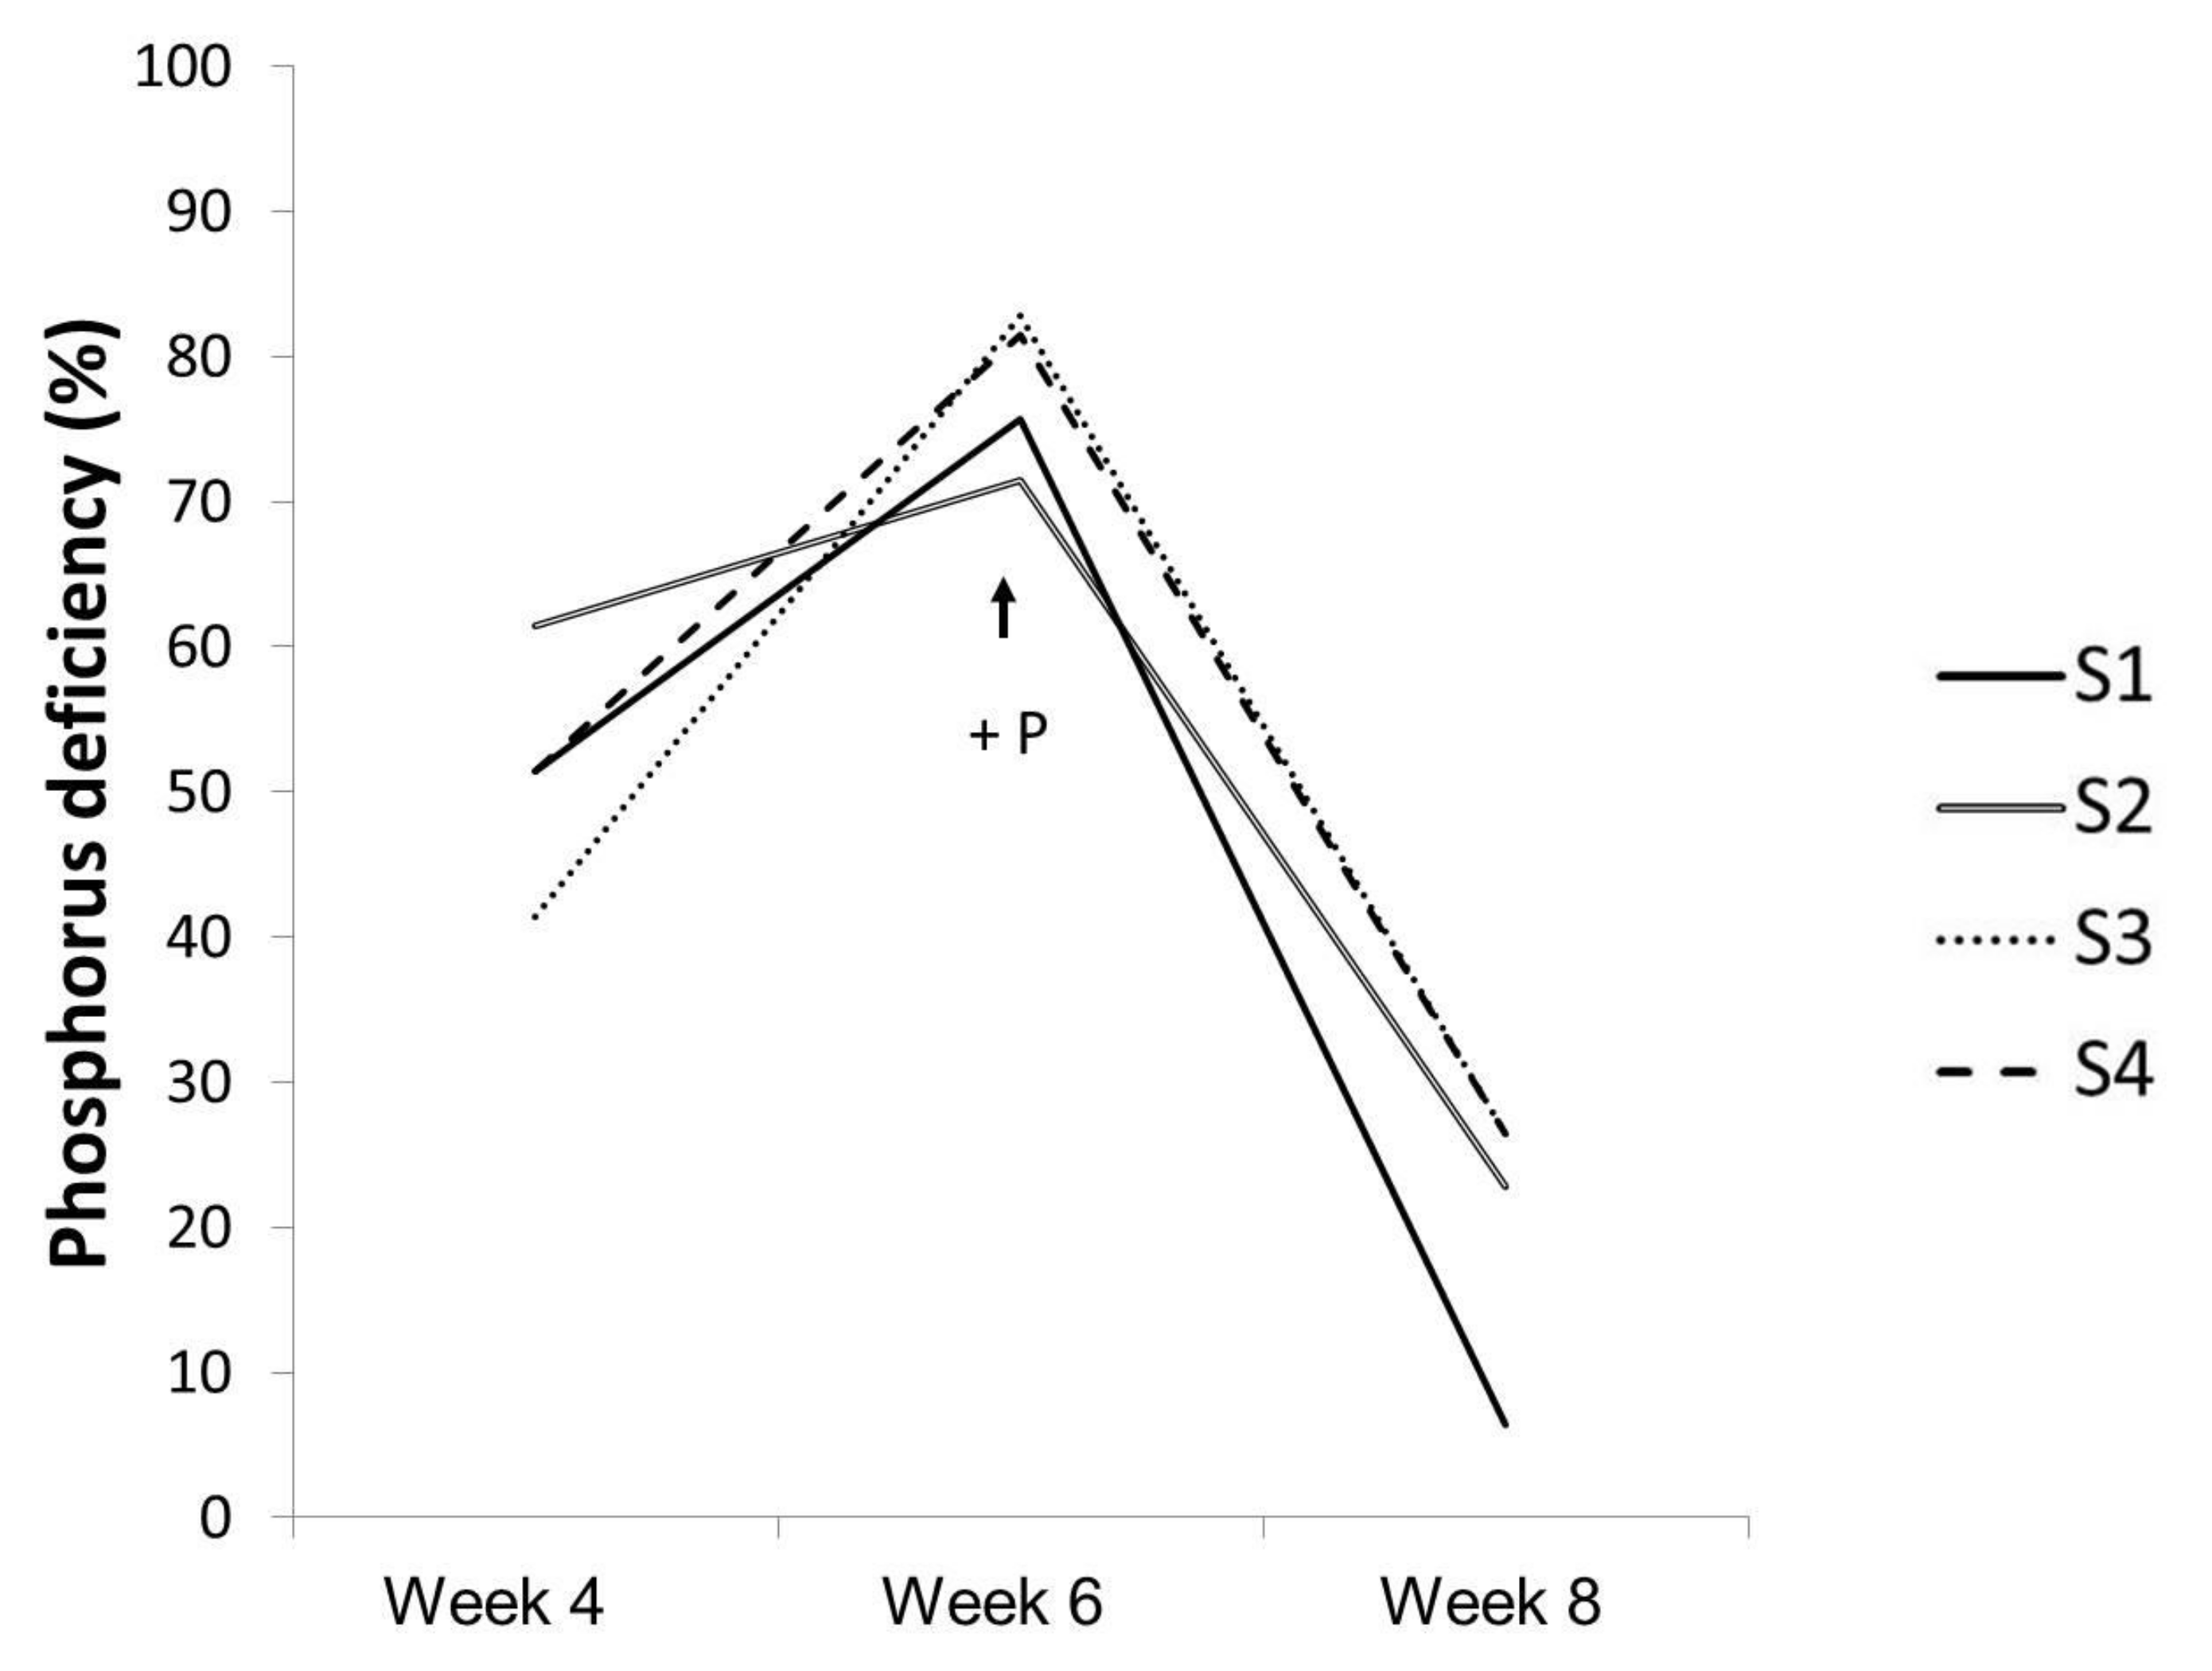
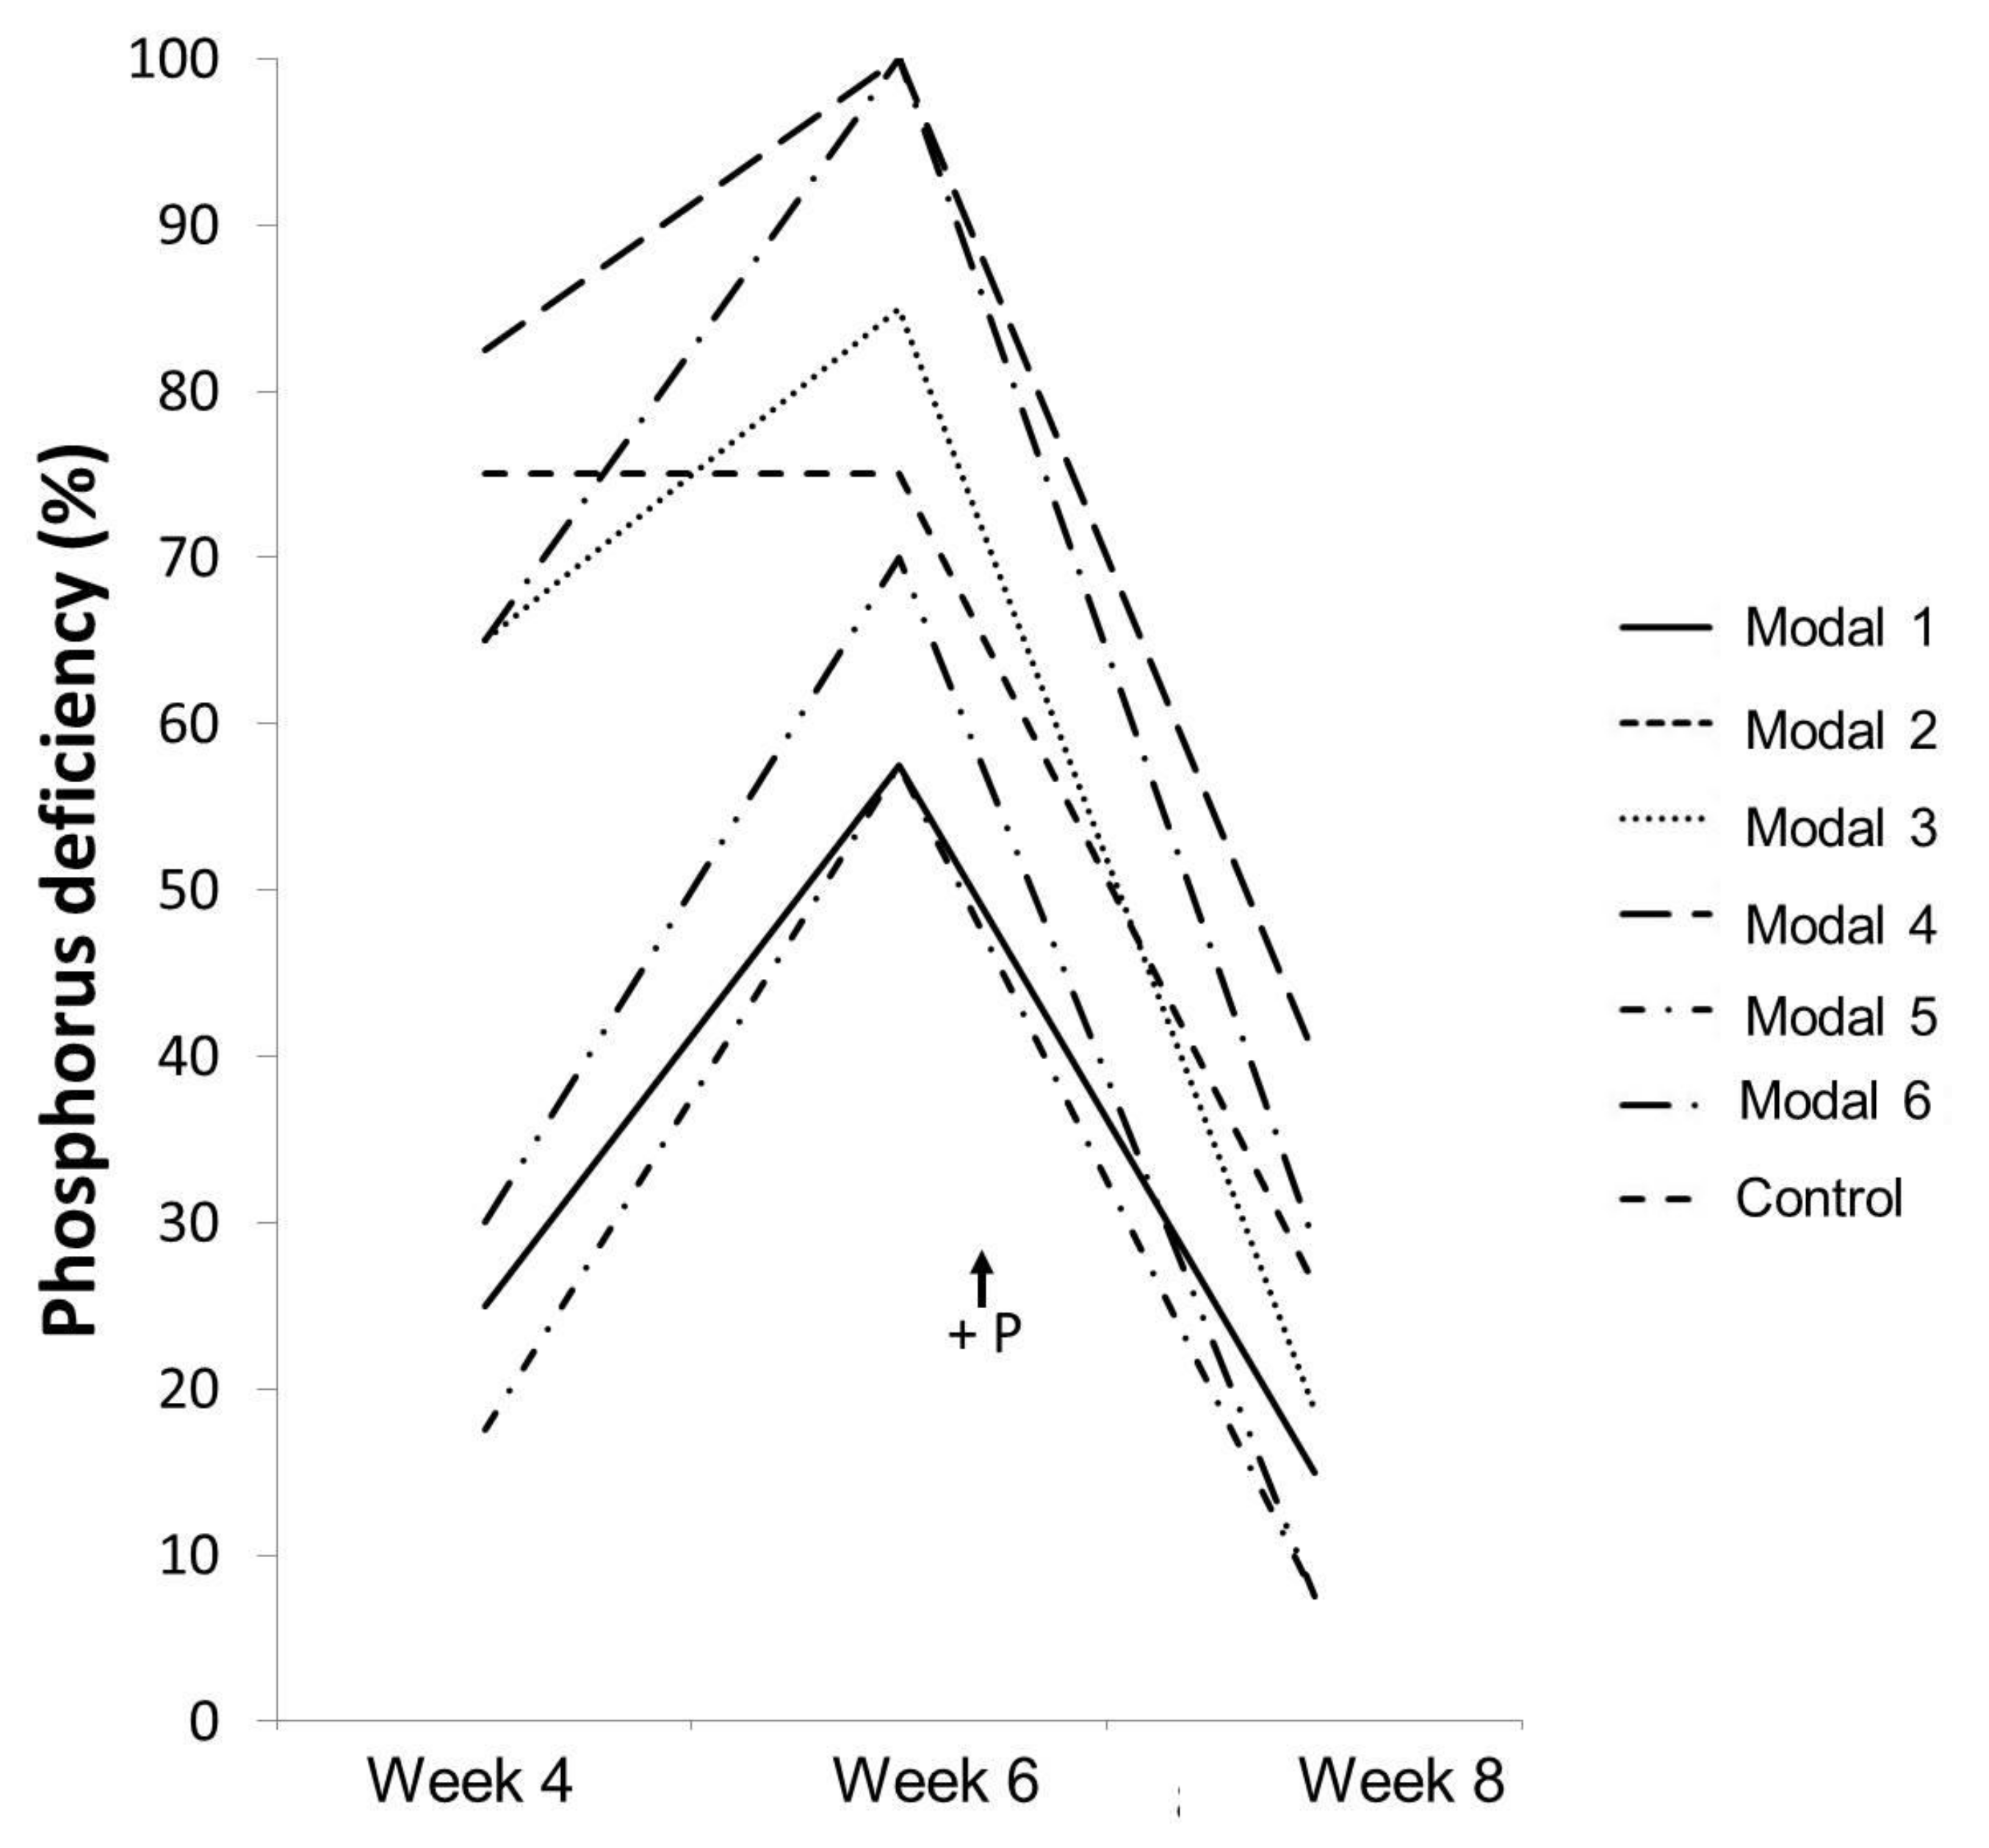
3.2.3. Ground-Up Development
4. Conclusions
5. Patents
Author Contributions
Funding
Data Availability Statement
Acknowledgments
Conflicts of Interest
References
- FAOSTAT. Available online: www.fao.org (accessed on 20 January 2022).
- Heuvelink, E. Tomatoes. In Crop Production Science in Horticulture 13; Heuvelink, E., Ed.; Bunko broche; Wageningen University: Wageningen, The Netherlands, 2005; pp. 4–6. [Google Scholar]
- INTERFEL. Available online: www.lesfruitsetlegumesfrais.com/fruits-legumes/legumes-fruits/tomate (accessed on 20 January 2022).
- Ministère de l’Agriculture et de l’Alimentation. Available online: https://agriculture.gouv.fr/la-tomate-star-de-lete (accessed on 20 January 2022).
- Bilderback, T.E.; Warren, S.L.; Owen, J.S., Jr.; Albano, J.P. Healthy substrates need physicals. Hort. Technol. 2005, 15, 747–751. [Google Scholar] [CrossRef]
- Mastouri, F.; Hassandokht, M.R.; Padasht Dehkaei, M.N. The effect of application of agricultural waste compost on growing media and greenhouse lettuce yield. Acta Horti. 2005, 697, 153–158. [Google Scholar] [CrossRef]
- Olle, M.; Nagouajio, M.; Simos, A. Vegetable quality and productivity as influenced by growing medium: A Review. Zemdirb. Agric. 2012, 99, 399–408. [Google Scholar]
- Dorais, M.; Menard, C.; Begin, E. Risk of phytotoxicity of sawdust substrate for greenhouse vegetables. Acta Hort. 2007, 761, 589–594. [Google Scholar] [CrossRef]
- Ehret, D.L.; Helmer, T. A new wood fibre substrate for hydroponic tomato and pepper crops. Can. J. Plant Sci. 2009, 89, 1127–1132. [Google Scholar] [CrossRef][Green Version]
- Mahamud, S.; Manisah, M.D. Preliminary studies on sago waste as growing medium for tomato. Acta Hort. 2007, 742, 163–168. [Google Scholar] [CrossRef]
- Nurznski, J. The yield of greenhouse tomato grown in straw and rockwool. Folia Hort. 2006, 18, 17–23. [Google Scholar]
- Ma, F.; Fan, H. Use of Substrates for the Production of Quality Horticultural Crops. In Key Irrigation Technologies and Substrate Choice for Soilless Potted Flowers in Greenhouses, Soilless Culture; Asaduzzaman, M., Ed.; IntechOpen: London, UK, 2015; pp. 1–32. [Google Scholar]
- Handan, E. Growth of tomato plantlets in soilless culture enriched with shells egg waste and algae. Int. J. Sci. Res. Arch. 2021, 3, 161–167. [Google Scholar] [CrossRef]
- Erabadupitiya, H.R.U.T.; Weerakkody, W.A.P.; Nandasena, K.A. Potassium Application Rates for Tomato Grown in Soilless Culture under Hot and Humid Greenhouse Conditions. Trop. Agric. Res. 2021, 32, 462–470. [Google Scholar] [CrossRef]
- Mitsanis, C.; Aktsoglou, D.C.; Koukounaras, A.; Tsouvaltzis, P.; Koufakis, T.; Gerasopoulos, D.; Siomos, A.S. Functional, Flavor and Visual Traits of Hydroponically Produced Tomato Fruit in Relation to Substrate, Plant Training System and Harvesting Time. Horticulturae 2021, 7, 311. [Google Scholar] [CrossRef]
- Nguyen, M.N.; Inaba, K.; Toda, S.; Suzuki, K.; Iwasaki, Y.; Takayama, K. Effect of reducing phosphorus dosage in nutrient solution on soilless culture of grafted tomato crops. Acta Hortic. 2021, 1317, 99–106. [Google Scholar] [CrossRef]
- Moelants, J.; Similon, L.; Bosmans, L. Sustainable organic growing media in a commercial tomato growing system. Acta Hortic. 2021, 1317, 303–312. [Google Scholar] [CrossRef]
- Asaduzzaman, M.; Mondal, F.M.; Ban, T.; Asao, T. Selection of ideal succeeding crops after asparagus, taro, and beans replanting field in seedling growth bioassay. Allelopath. J. 2013, 32, 1–22. [Google Scholar]
- Alifar, N.; Ghehsareh, A.M.; Honarjoo, N. The effect of growth media on cucumber yield and its uptake of some nutrient elements in soilless culture. J. Sci. Technol. Greenh. Cult. 2010, 1, 19–25. [Google Scholar]
- Gutiérrez, G.A.M.; Altamirano, G.Z.; Urrestarzu, M. Maguey bagasse waste as sustainable substrate in soilless culture by melon and tomato crop. J. Plant Nut. 2012, 35, 2135–2144. [Google Scholar] [CrossRef]
- Yu, P.; Li, Q.; Huang, L.; Niu, G.; Gu, M. Mixed Hardwood and Sugarcane Bagasse Biochar as Potting Mix Components for Container Tomato and Basil Seedling Production. Appl. Sci. 2019, 9, 4713. [Google Scholar] [CrossRef]
- Orta-Guzmán, V.N.; Lois-Correa, J.A.; Domínguez-Crespo, M.A.; Pineda-Pineda, J.; Torres-Huerta, A.M.; Rodríguez-Salazar, A.E.; Licona-Aguilar, Á.I. Evaluation of Sugarcane Agroindustrial Wastes as Substrate in Soilless Cultivation ofTomato (S. lycopersicum Linnaeus):Effect of Substrate Composition on Yield Production. Agronomy 2021, 11, 206. [Google Scholar] [CrossRef]
- Baum, C.; El-Tohamy, W.; Gruda, N. Increasing the productivity and product quality of vegetable crops using arbuscular mycorrhizal fungi: A review. Sci. Hort. 2015, 187, 131–141. [Google Scholar] [CrossRef]
- Dhawi, F.; Datta, R.; Ramakrishna, W. Mycorrhiza and PGPB modulate maize biomass, nutrient uptake and metabolic pathways in maize grown in mining-impacted soil. Plant Physiol. Biochem. 2015, 97, 390–399. [Google Scholar] [CrossRef]
- Kumar, A.; Verma, J.P. Does plant—Microbe interaction confer stress tolerance in plants: A review? Microbiol. Res. 2018, 207, 41–52. [Google Scholar] [CrossRef]
- Al-Karaki, G.N. Nursery inoculation of tomato with arbuscular mycorrhizal fungi and subsequent performance under irrigation with saline water. Sci. Hortic. 2006, 109, 1–7. [Google Scholar] [CrossRef]
- Ortas, I.; Kaya, Z.; Cakmak, I. Influence of VA-Mycorrhiza Inoculation on Growth of Maize and Green Pepper Plants in Phosphorus and Zinc Deficient Soils. In Plant Nutrition- Food Security and Sustainability of Agro-Ecosystems; Horst, W.J., Schenk, M.K., Bürkert, A., Claassen, N., Flessa, H., Frommer, W.B., Goldbach, H.E., Olfs, H.W., Römheld, V., Sattelmacher, B., et al., Eds.; Kluwer Akedmic Publishers: Dordrecht, The Netherlands, 2001; pp. 632–633. [Google Scholar]
- Charron, G.; Furlan, V.; Bernier-Cordou, M.; Doyon, G. Response of onion plants to arbuscular mycorrhizae. 1. Effects of inoculation method and phosphorus fertilization on biomass and bulb firmness. Mycorrhiza 2001, 11, 187–197. [Google Scholar] [CrossRef] [PubMed]
- Cigsar, S.; Sari, N.; Ortas, I. The effects of arbuscular mycorrhizal fungus on plant growth and yield of cucumber. Turk J. Agric. 2000, 24, 571–578. [Google Scholar]
- Sari, N.; Ortas, I.; Yetisir, H. Effect of mycorrhiza inoculation on plant growth, yield and phosphorus uptake in garlic under field conditions. Commun. Soil Sci. Plant Anal. 2002, 33, 2189–2201. [Google Scholar] [CrossRef]
- Karagiannidis, N.; Fotios, B.; Nikolaos, S. Effects of Verticillium witl (Verticillium dahliae Kleb.) and mycorrhiza (Glomus mosseae) on root colonization, growth and nutrient uptake in tomato and eggplant seedlings. Sci. Hortic. 2002, 94, 145–156. [Google Scholar] [CrossRef]
- Sanchez-Bel, P.; Troncho, P.; Gamir, J.; Pozo, M.J.; Camañes, G.; Cerezo, M.; Flors, V. The nitrogen availability interferes with mycorrhizainduced resistance against Botrytis cinerea in tomato. Front. Microbiol. 2016, 7, 1598–1610. [Google Scholar] [CrossRef]
- Bitterlich, M.; Sandmann, M.; Graefe, J. Arbuscular mycorrhiza alleviates restrictions to substrate water flow and delays transpiration limitation to stronger drought in tomato. Front. Plant Sci. 2018, 9, 154–169. [Google Scholar] [CrossRef]
- Chitarra, W.; Pagliarani, C.; Maserti, B.; Lumini, E.; Siciliano, I.; Cascone, P.; Schubert, A.; Gambino, G.; Balestrini, R.; Guerrieri, E. Insights on the impact of arbuscular mycorrhizal symbiosis on tomato tolerance to water stress. Plant Physiol. 2016, 171, 1009–1023. [Google Scholar] [CrossRef]
- Kour, D.; Rana, K.L.; Kaur, T.; Yadav, N.; Yadav, A.N.; Kumar, M.; Kumar, V.; Dhaliwal, H.S.; Saxena, A.K. Biodiversity, current developments and potential biotechnological applications of phosphorus-solubilizing and -mobilizing microbes: A review. Pedosphere 2021, 31, 43–75. [Google Scholar] [CrossRef]
- Bona, E.; Cantamessa, S.; Massa, N.; Manassero, P.; Marsano, F.; Copetta, A.; Lingua, G.; D’Agostino, G.; Gamalero, E.; Berta, G. Arbuscular mycorrhizal fungi and plant growth-promoting pseudomonads improve yield, quality and nutritional value of tomato: A field study. Mycorrhiza 2017, 27, 1–11. [Google Scholar] [CrossRef]
- Bona, E.; Todeschini, V.; Cantamessa, S.; Cesaro, P.; Copetta, A.; Lingua, G.; Gamalero, E.; Berta, B.; Massa, N. Combined bacterial and mycorrhizal inocula improve tomato quality at reduced fertilization. Sci. Hortic. 2018, 234, 160–165. [Google Scholar] [CrossRef]
- Woo, S.L.; Ruocco, M.; Vinale, F.; Nigro, M.; Marra, R.; Lombardi, N.; Pascale, A.; Lanzuise, S.; Manganiello, G.; Lorito, M. Trichoderma-based Products and their Widespread Use in Agriculture. Open Mycol. J. 2014, 8, 71–126. [Google Scholar] [CrossRef]
- Zin, N.A.; Badaluddin, N.A. Biological functions of Trichoderma spp. for agriculture applications. Ann. Agric. Sci. 2020, 65, 168–178. [Google Scholar] [CrossRef]
- Srivastava, R.; Khalid, A.; Singh, U.S.; Sharma, A.K. Evaluation of arbuscular mycorrhizal fungus, fluorescent Pseudomonas and Trichoderma harzianum formulation against Fusarium oxysporum f. sp. lycopersici for the management of tomato wilt. Biol. Control 2010, 53, 24–31. [Google Scholar] [CrossRef]
- Rouphael, Y.; Franken, P.; Schneider, C.; Schwarz, D.; Giovannetti, M.; Agnolucci, M.; De Pascale, S.; Bonini, P.; Colla, G. Arbuscular mycorrhizal fungi acta s biostimulants in horticultural crops. Sci. Hortic. 2015, 196, 91–108. [Google Scholar] [CrossRef]
- Caser, M.; Demasi, S.; Victorino, Í.M.M.; Donno, D.; Faccio, A.; Lumini, E.; Bianciotto, V.; Scariot, V. Arbuscular Mycorrhizal Fungi Modulate the Crop Performance and Metabolic Profile of Saffron in Soilless Cultivation. Agronomy 2019, 9, 232. [Google Scholar] [CrossRef]
- Menge, J.A.; Steirle, D.; Bagyaraj, D.J.; Johnson, E.L.V.; Leonard, R.T. Phosphorus concentrations in plants responsible for inhibition of mycorrhizal infection. New Phytol. 1978, 80, 575–578. [Google Scholar] [CrossRef]
- Ryan, M.H.; Small, D.R.; Ash, J.E. Phosphorus controls the level of colonisation by arbuscular mycorrhizal fungi in conventional and biodynamic irrigated dairy pastures. Aust. J. Exp. Agric. 2000, 40, 663–670. [Google Scholar] [CrossRef]
- Grant, C.; Bittman, S.; Montreal, M.; Plenchette, C.; Morel, C. Soil and fertilizer phosphorus: Effects on plant P supply and mycorrhizal development. Can. J. Plant Sci. 2005, 85, 3–14. [Google Scholar] [CrossRef]
- Besford, R.T. A Rapid Tissue Test for Diagnosing Phosphorus Deficiency in the Tomato Plant. Ann. Bot. 1980, 45, 225–227. [Google Scholar] [CrossRef]
- Philipps, J.-M.; Hayman, D.-S. Improved procedures for clearing roots and staining parasitic and vesicular-arbuscular mycorrhizal fungi for rapid assessment of infection. Trans. Br. Mycol. Soc. 1970, 55, 158–161. [Google Scholar] [CrossRef]
- Trouvelot, A.; Kough, J.L.; Gianinazzi-Pearson, V. Mesure du taux de mycorhization VA d’un système radiculaire. Recherche de méthodes d’estimation ayant une signification fonctionnelle. In Mycorrhizae: Physiology and Genetics; INRA: Paris, France, 1986; pp. 217–221. [Google Scholar]
- Bhadha, J.H.; Xu, N.; Khatiwada, R.; Swanson, S.; LaBorde, C. Bagasse: A Potential Organic Soil Amendment Used in Sugarcane Production: SL477/SS690, 8/2020. EDIS 2020, 1, 1–5. [Google Scholar]
- Xu, N.; Bhadha, J.H.; Rabbany, A.; Swanson, S.; McCray, J.M.; Li, Y.C.; Strauss, S.L.; Mylavarapu, R. Crop Nutrition and Yield Response of Bagasse Application on Sugarcane Grown on a Mineral Soil. Agronomy 2021, 11, 1526. [Google Scholar] [CrossRef]
- Azcón-Aguilar, C.; Barea, J.M. Applying mycorrhiza biotechnology to horticulture: Significance and potentials. Sci. Hortic. 1997, 68, 1–24. [Google Scholar] [CrossRef]
- Gamalero, E.; Trotta, A.; Massa, N.; Copetta, A.; Martinotti, M.G.; Berta, G. Impact of two fluorescent pseudomonads and an arbuscular mycorrhizal fungus on tomato plant growth, root architecture and P acquisition. Mycorrhiza 2004, 14, 185–192. [Google Scholar] [CrossRef] [PubMed]
- Mahapatra, D.M.; Satapathy, K.C.; Panda, B. Biofertilizers and nanofertilizers for sustainable agriculture: Phycoprospects and challenges. Sci. Total Environ. 2022, 803, 149990. [Google Scholar] [CrossRef]
- Gulia, U.; Shukla, J.; Nishanth, S.; Kokila, V.; Bharti, A.; Kumar Singh, A.; Singh Shivay, Y.; Prasanna, R. Fortifying nursery soil-less media with cyanobacteria for enhancing the growth of tomato. S. Afr. J. Bot. 2022, 146, 564–572. [Google Scholar] [CrossRef]


| Substrate | Coconut Fiber | Bagasse | Number of Modalities | Number of Replicates | Total Number of Plants |
|---|---|---|---|---|---|
| S1 | 100% | 0% | 6 modalities + 1 control | 6 | 42 |
| S2 | 66% | 33% | 6 modalities + 1 control | 6 | 42 |
| S3 | 50% | 50% | 6 modalities + 1 control | 6 | 42 |
| S4 | 33% | 66% | 6 modalities + 1 control | 6 | 42 |
| Whashed Coco Fiber | |
|---|---|
| pH | 7.02 |
| Organic material | 75% |
| Total content of Phosphorus | 563 ppm |
| Available Phosphorus | 329 ppm |
| Phosphorus content in solution | 355 ppm |
| Phosphorus content in solution | 100% |
| F% | M% | a% | |
|---|---|---|---|
| T6 | |||
| Substrate | 0.17 | 0.18 | 0.24 |
| Modality | 0.34 | 0.80 | 0.72 |
| T8 | |||
| Substrate | 0.97 | 0.53 | 0.34 |
| Modality | 0.04 | 0.09 | 0.02 |
| Stem Length | Branch Number | P Deficiency | |
|---|---|---|---|
| T4 | |||
| Substrate | 0.31 | 0.06 | variance 0 |
| Modality | 0.95 | 0.70 | variance 0 |
| Interaction | 1.00 | 0.66 | variance 0 |
| T6 | |||
| Substrate | 9.629460x10-07 | 0.61 | variance 0 |
| Modality | 0.11 | 0.39 | variance 0 |
| Interaction | 0.87 | 0.99 | variance 0 |
| T8 | |||
| Substrate | 2.805976x10⁻²⁷ | 0.000171038 | variance 0 |
| Modality | 4.091049x10⁻¹² | 0.26 | variance 0 |
| Interaction | 1.717594x10⁻¹⁹ | 0.47 | variance 0 |
| Fruiting Potential | |
|---|---|
| T6 | |
| Substrate | 0.23 |
| Modality | 0.10 |
| T8 | |
| Substrate | 0.0156 |
| Modality | 0.0098 |
| Substrate | Modality | |
|---|---|---|
| Root development | - | 5 and 6 |
| Mycorrhization | S1 and S2 | 2 and 3 |
| Stem length | S1, S2 and S3 | 1, 2 and 3 |
| Branch number | S1 and S2 | - |
| Fruiting potential | - | 4 |
| P deficiency | S1 and S2 | 1, 4 and 6 |
Publisher’s Note: MDPI stays neutral with regard to jurisdictional claims in published maps and institutional affiliations. |
© 2022 by the authors. Licensee MDPI, Basel, Switzerland. This article is an open access article distributed under the terms and conditions of the Creative Commons Attribution (CC BY) license (https://creativecommons.org/licenses/by/4.0/).
Share and Cite
Masquelier, S.; Sozzi, T.; Bouvet, J.C.; Bésiers, J.; Deogratias, J.-M. Conception and Development of Recycled Raw Materials (Coconut Fiber and Bagasse)-Based Substrates Enriched with Soil Microorganisms (Arbuscular Mycorrhizal Fungi, Trichoderma spp. and Pseudomonas spp.) for the Soilless Cultivation of Tomato (S. lycopersicum). Agronomy 2022, 12, 767. https://doi.org/10.3390/agronomy12040767
Masquelier S, Sozzi T, Bouvet JC, Bésiers J, Deogratias J-M. Conception and Development of Recycled Raw Materials (Coconut Fiber and Bagasse)-Based Substrates Enriched with Soil Microorganisms (Arbuscular Mycorrhizal Fungi, Trichoderma spp. and Pseudomonas spp.) for the Soilless Cultivation of Tomato (S. lycopersicum). Agronomy. 2022; 12(4):767. https://doi.org/10.3390/agronomy12040767
Chicago/Turabian StyleMasquelier, Sylvie, Tommaso Sozzi, Janie Camille Bouvet, Jérôme Bésiers, and Jean-Marc Deogratias. 2022. "Conception and Development of Recycled Raw Materials (Coconut Fiber and Bagasse)-Based Substrates Enriched with Soil Microorganisms (Arbuscular Mycorrhizal Fungi, Trichoderma spp. and Pseudomonas spp.) for the Soilless Cultivation of Tomato (S. lycopersicum)" Agronomy 12, no. 4: 767. https://doi.org/10.3390/agronomy12040767
APA StyleMasquelier, S., Sozzi, T., Bouvet, J. C., Bésiers, J., & Deogratias, J.-M. (2022). Conception and Development of Recycled Raw Materials (Coconut Fiber and Bagasse)-Based Substrates Enriched with Soil Microorganisms (Arbuscular Mycorrhizal Fungi, Trichoderma spp. and Pseudomonas spp.) for the Soilless Cultivation of Tomato (S. lycopersicum). Agronomy, 12(4), 767. https://doi.org/10.3390/agronomy12040767