Article

Effective Biocontrol of Rice Blast through Dipping Transplants and Foliar Applications

1
The Real IPM Co., (Kenya) Ltd., Madaraka, Thika P.O. Box 4001-01002, Kenya
2
Real IPM Tanzania Ltd., Plot No 34, Area F, Livingstone Riad, Arusha, Tanzania
3
NIAB EMR, East Malling, West Malling, Kent ME19 6BJ, UK
*
Author to whom correspondence should be addressed.
Agronomy 2022, 12(3), 592; https://doi.org/10.3390/agronomy12030592
Submission received: 30 December 2021 / Revised: 22 February 2022 / Accepted: 25 February 2022 / Published: 27 February 2022

Abstract

:
Rice (Oryza sativa) is an increasingly popular food in Africa. As much as 30% of yields are lost due to blast disease caused by Magnaporthe oryzae. Several commercial biopesticides of Bacillus subtilis, Trichoderma asperellum, and Serratia sp. strains were evaluated under field conditions for their effects against rice blast and yield at one site in Kenya and three sites in Tanzania in 2020 and 2021. Each biopesticide was applied as a dipping treatment at transplanting, post-transplanting foliar spraying, or both. Using biopesticides not only achieved blast control but also increased grain yield, particularly in low-production regions in Tanzania, with a yield increase of >100%. For higher-production sites with low disease pressure, the yield increase through biopesticides over the untreated control was limited, although significant disease suppression was achieved. Dipping alone was sufficient to suppress disease and improve yield unless disease pressure was high. The differences among the three biopesticides varied with site/year but generally were small. Improved yield using biopesticides is unlikely to result solely from reduced blast development, but also from improved plant development. The present study suggests that these commercial biopesticides should be applied in rice production, particularly in subsistence farming.

1. Introduction

Rice (Oryza sativa L.) is an increasingly popular food in Africa and is grown in 40 African countries, with substantial increased productivity in recent times [1]. However, the overall rice demand in Africa has outstripped local production, requiring 40% imported rice. Consumption rate is expected to increase by 130% in 2035 compared to 2010 [2]. Thus, African rice producers need to increase their production capacity drastically to meet the ever-increasing demand. For example, Kenya is only able to produce ca. 20% of the total rice consumption. The current rice yield (2.8 to 3.8 t/ha) achieved in Kenya is above average in Africa but still behind Asia (average ca. 4.5 t/ha). Tanzania is the most important rice-production zone in East Africa. Rice is the second most cultivated food and commercial crop in Tanzania after maize. However, rice production in Tanzania is still characterized by low productivity, with average yields of 1.5–2.8 t/ha. This low productivity is due in large part to the fact that small-scale low-technology (but high-labor) farmers account for ca. 70% of the total rice-production area. On these farms, fertilizers are also often not used because of the cost, thus limiting yields.
In rice, as much as 30% of yields are lost due to blast disease caused by fungal pathogen Magnaporthe oryzae (T.T. Hebert) M.E. Barr. [3,4,5]. Magnaporthe oryzae infects the aerial parts of the rice plant—including leaves, nodes, stems, and panicles—at all stages of development [6]. Good control of rice blast may be achieved with intensive fungicide programs, but this is both expensive, particularly for smallholdings, and undesirable [7]. The use of beneficial micro-organisms, including biocontrol microbes, is being promoted for their potential in sustainable agriculture. Commercial biopesticides are available to control specific diseases on key agricultural crops [8]. However, in contrast to pesticides, their efficacy is often inconsistent and much affected by environmental conditions due to their being living organisms [9].
There have been many studies reporting the potentials of candidate micro-organisms against rice blast, with the most studies focusing on initial screening and biocontrol mechanisms [10,11,12,13]. Promising organisms include strains from several common sources for biocontrol agents: Bacillus, Trichoderma, Streptomyces, and Pseudomonas. For instance, one specific pseudomonad strain (EA105) isolated from rice soil, when applied as root priming, effectively inhibited the growth and appressoria formation of M. oryzae [10]. This isolate may also trigger induced systemic resistance in rice plants through a mechanism that is dependent on JA and ET signaling. An endophytic strain of S. endus (Jensen 1931) Yüntsen et al. 1956 (OsiSh-2) from rice is capable of reducing rice blast severity when applied as foliar spray [11]. Several Trichoderma spp. isolates, when used as a seed treatment, reduced blast severity [14]. An endophytic strain of B. tequilensis Gatson et al. 2006 isolated from Angelica dahurica Fisch. ex Hoffm. has shown great potential for biocontrol of rice blast [12]. Several rhizobacteria from rice-field soil, including B. subtilis (Ehrenberg 1835) Cohn 1872, B. cereus Frankland & Frankland 1887, and P. fluorecens (Flügge 1886) Migula 1895, reduced blast development on seedlings when applied as foliar spray under greenhouse conditions [13]. Serratia is a group of enterobacteria with a notable secondary metabolism that is able to produce a wide range of natural bioactive products, including the β-lactam antibiotic carbapenem or the antifungal compound oocydin A [15]. A specific S. rubidaea Bizio 1823 isolate stimulated quinoa seeds germination and seedlings growth under salt stress conditions and survived salty and/or heavy-metal conditions [16].
The application timing of biopesticides is also important for achieving disease control, which is primarily determined by the nature of disease epidemiology and biocontrol organisms under consideration. For rice blast control with biopesticides, treatments are usually applied as a seed-priming treatment, dipping treatment at transplanting, and regular foliar spray treatment post-transplanting [10,11,17,18]. A formulated product of P. fluorescens strain Pf1 was equally effective in suppressing rice blast irrespective of whether it was applied as a seed treatment or foliar spray [17]. Many rhizobacteria showed a good efficacy against rice leaf blast when applied as soil drench or foliar spray, but the efficacy varied with application methods [19]. Soil drenching led to better disease control than foliar spray. In Cambodia, a formulated product of T. harzianum Rifai (1969) reduced the incidence of leaf and neck blast when applied as both seed treatment and foliar spray, but it did not significantly affect yield [18]. To overcome the often low and inconsistent efficacy achieved by single biopesticides, it is often recommended to combine biopesticides to achieve better performance, exploiting synergies between biopesticides. However, such a laudable objective of exploiting synergies has rarely been achieved [9]. Inoculation of both B. subtilis and Trichoderma sp. led to significant inhibition of M. grisea compared to single strains, with increased efficacies against rice blast when applied prior to transplantation than at the seed-setting stage [20].
In addition to their biocontrol effect against specific diseases, some biocontrol organisms also can improve plant growth in the absence of plant diseases. For instance, several rhizobacteria can enhance rice-plant growth, including stimulating plant height, root length, and total biomass, in addition to their efficacy against rice leaf blast [19]. Several Trichoderma spp. isolates, when used as a seed treatment, led to increased plant height, number of leaves, tillers, panicles, and panicle length, as well as reduced blast severity [14]. When plants’ roots are colonized by certain root endophytic fungi from Trichoderma, this induces upregulation of genes and pigments that improve the plants’ photosynthesis [21]. The primary direct effect of colonization of Theobroma cacao L. by an endophytic T. hamatum (Bonord.) Bainier 1906 isolate was promotion of root growth, regardless of water status, and an increase in water content, improving the drought plant response [22]. Inoculation of sugarcane with T. asperellum Samuels, Lieckf. & Nirenberg 1999 can alleviate the negative effects of drought stress [23], as for maize inoculated with a specific T. atroviride Karsten sensu Bissett strain [24]. One S. proteamaculans (Paine and Stansfield 1919) Grimont et al. 1978 isolate promotes soybean–bradyrhizobia nodulation and growth [25].
Much of the research on biocontrol of rice blast has been using pure microbial strains or non-commercial formulated products under controlled conditions, e.g., greenhouse conditions. Pilot studies in Kenya have shown that dipping roots of rice seedlings in solutions with commercial products of a formulated bacterial strain (B. subtilis) or a fungal isolate (T. asperellum) led to reduced blast development and increased yield. The present study aims to expand these pilot studies to assess the effects of several commercially available biopesticides on rice blast, as well as plant development and grain yield, under field conditions in Kenya and Tanzania. Each biopesticide was applied as dipping at transplanting, post-transplanting foliar spray, or both.

2. Materials and Methods

Experiments were conducted at one site in Kenya and three sites in Tanzania in 2020 and 2021.

2.1. Kenya

A single cultivar (cv. Basmati 370) was used for the Kenya site (National Irrigation Board, longitude-37°37′2.53″ E and latitude-0°49′24.23″ S). In this region, the main agricultural activity is monocropping of rice grown in paddies that are irrigated for six months. The soil at this site is of the black cotton soil type (vertisol). There were four products: Real IPM commercially formulated products of B. subtilis, T. asperellum, and S. nematodiphila Zhang et al. 2009; and Mazao Flourish (a mixture of B. subtilis and T. asperellum). The three individual products all contained 1.0 × 10¹⁰ CFUs per mL. For the Mazao Flourish, both B. subtilis and T. asperellum were at 0.5 × 10¹⁰ CFUs per mL; thus, the total CFUs remained the same as the individual products. Each was applied at three times, as a dipping treatment at transplanting, post-transplanting foliar spraying, and both dipping and foliar spraying. In addition, two control treatments were included: water or fungicide (“Absolute”, a mixture of Azoxystrobin (200 g per liter), Difenoconazole (125 g per litre), and Hexaconazole (50 g per litre)) was applied on all occasions (namely as “both” timings). In each year, a randomized block design was used with four blocks. Within each block, there were 14 plots (5 m × 5 m), each randomly assigned to one of the 14 treatments; planting space was 20 cm × 15 cm. There was a gap of 75 cm between neighboring plots.
For dipping treatment, seedlings were dipped in an appropriate product (5 mL of the product in 1 L water) for 30 min before transplanting. Weekly foliar sprays began two weeks after transplanting at the same concentration as used in dipping, with a knapsack sprayer; each plot received approximately 7 L each time. Seven and nine sprays were applied in 2020 and 2021, respectively. Transplanting was performed in late August 2020 and early March 2021. Fertilizers were applied via broadcasting to the trial plot on three occasions: muriate of potash at 25 kg per acre three days after transplanting, and sulfate of ammonia at 50 kg per acre 14 and 45 days after transplanting. Nurelle D (a.i. chlorpyrifos ethyl + cypermethrin) and Sumithion (a.i. fenitrothion + esfenvalerate) were applied with a knapsack for thrips control 28 and 49 days after transplanting.
Number of tillers was counted and the height of the highest tiller for each plant was measured weekly three (2020) or two (2021) weeks after transplanting; in total, nine and eight assessments were made in 2020 and 2021, respectively. In each plot, the same 10 plants (randomly selected) were assessed for tiller development over all the time points. For each plot, time to the first flowering was also recorded. Presence and severity of rice blast were assessed weekly on 10 leaves, one leaf from each of 10 plants randomly selected on each assessment occasion for each plot. In both years, blast assessment began five weeks after transplanting. As the blast severity was very low, so only incidence of rice blast is analysed and presented. For each plot, 10 panicles (heads) were selected, one from each of 10 randomly selected plants, to estimate number of grains per panicle and with blast symptoms. The 1000 seed weight, as well as grain moisture content (%), was also determined for each plot. Finally, both unshelled (raw) and shelled (net) grain yields were obtained for each plot.

2.2. Tanzania

Experiments were conducted at three sites (Babati (3.8541° S, 35.5235° E), Kikwe (3.3711° S, 36.8285° E) and Moshi (3.4197° S, 37.3676° E)) in Tanzania in 2020 and 2021. The soil at all three sites is of the black cotton soil type (vertisol). There are two rice crops per season at Moshi and Kilwe; the first crop season (from December) was used for the present study. Only one rice crop season (from February) is possible at Babati. There were nine treatments: three products—water (as control), and commercially formulated products of B. subtilis and T. asperellum; applied at three times—as a dipping treatment at transplanting, foliar spraying, and both dipping and foliar spraying. The same experimental design as in Kenya was used, except that only three blocks were used. A single cultivar (cv. SARO 5 (TXD 306)) was used in both years. No fungicide control treatment was included. Urea was applied through broadcasting as a top dressing six weeks after transplanting; lambda cyhalothrin or deltamethrin was applied to control stalk borers four weeks after transplanting.
In 2019, seeds were sowed on 3 November and transplanted on 12 December at the Babati site, sowed on 25 November and transplanted on 20 December at the Kikwe site, and sowed on 6 January 2020 and transplanted on 2 February 2020. In 2020, seeds were sowed on 15 December and transplanted on 11 January 2021 at the Babati site, sowed on 16 November and transplanted on 12 December at the Kikwe site, and sowed on 3 January 2021 and transplanted on 2 February 2021. Dipping and spraying treatments were applied as for the Kenya experiment. There were six spray applications in each year at each site.
Number of tillers and the height of the highest tiller for each of five plants (randomly selected from each plot) was measured three times: one month after transplanting and thereafter weekly, with the interval between two neighboring assessments ranging from 3 to 10 days, depending on year and site. Five plants were randomly assessed for tiller development at each time point. For each plot, time to the 30% flowering was also recorded. Presence and severity of rice blast in grain were assessed at harvest for each plot; five panicles were selected randomly (one form each of five plant) to estimate number of grains per panicle and with blast symptoms. Grain maturity was estimated empirically (usually used by local farmers); biting a grain to check if the seed is sufficiently hard. Finally, both unshelled (raw) and shelled (net) grain yields were obtained for each plot.

2.3. Data Analysis

Standard ANOVA was applied to the data over the two years, in which year was treated as a blocking factor. In addition to unshelled (gross) and shelled (net) grain yield, the ratio between the net and gross grain weight was also calculated and analyzed through ANOVA. For net yield, net gross ratio, number of seeds per panicle, seed moisture, and days to flowering or maturity, log transformation was applied to ensure that residual errors follow (or closely) normal distributions. A logit transformation was applied to the incidence of grain with blast symptoms before ANOVA. No transformation was needed for the thousand seed weight, tiller number, and height. For tiller number and height, repeated measurement ANOVA was used with individual plot as a unique subject; thus, for each assessment date, average tiller number and height for each plot were obtained from individual plant values. For the Kenya site, because the number of assessments differed between the two years, repeated measurement ANOVA was applied to individual years separately.
For the Kenya experiment, an overall ANOVA was applied to the dataset, including all 14 treatments. When there were significant treatment effects, the Tukey HSD (honestly significant difference) test was applied to conduct pairwise comparisons with the p-value adjusted for multiple comparisons [26]. Then the 12 treatments involving microbial products were further analyzed together via a two-factorial design ANOVA to assess the effect of products and their application timing. Similarly, if a treatment effect was significant, HSD was applied to compare treatments.
For Tanzania experiments, both year (two years) and site (three sites) were treated as blocking factors. For the product and application timing factors, the main effect (two degrees of freedom (DF)) was decomposed into two single DF orthogonal comparisons. For the product factor, the two comparisons represented the comparisons (1) between water (control) and two biocontrol products, and (2) between the two biocontrol products. For the application time, they represented the comparisons between single type treatment (dipping or spraying) and both types, and between dipping and spraying treatments.
All analyses were conducted in R [27].

3. Results

3.1. Kenya Experiments

The growing season (from transplanting to harvest) was about 2–3 weeks shorter in 2021 than 2020. Overall treatment means and their standard errors are given in Table 1.

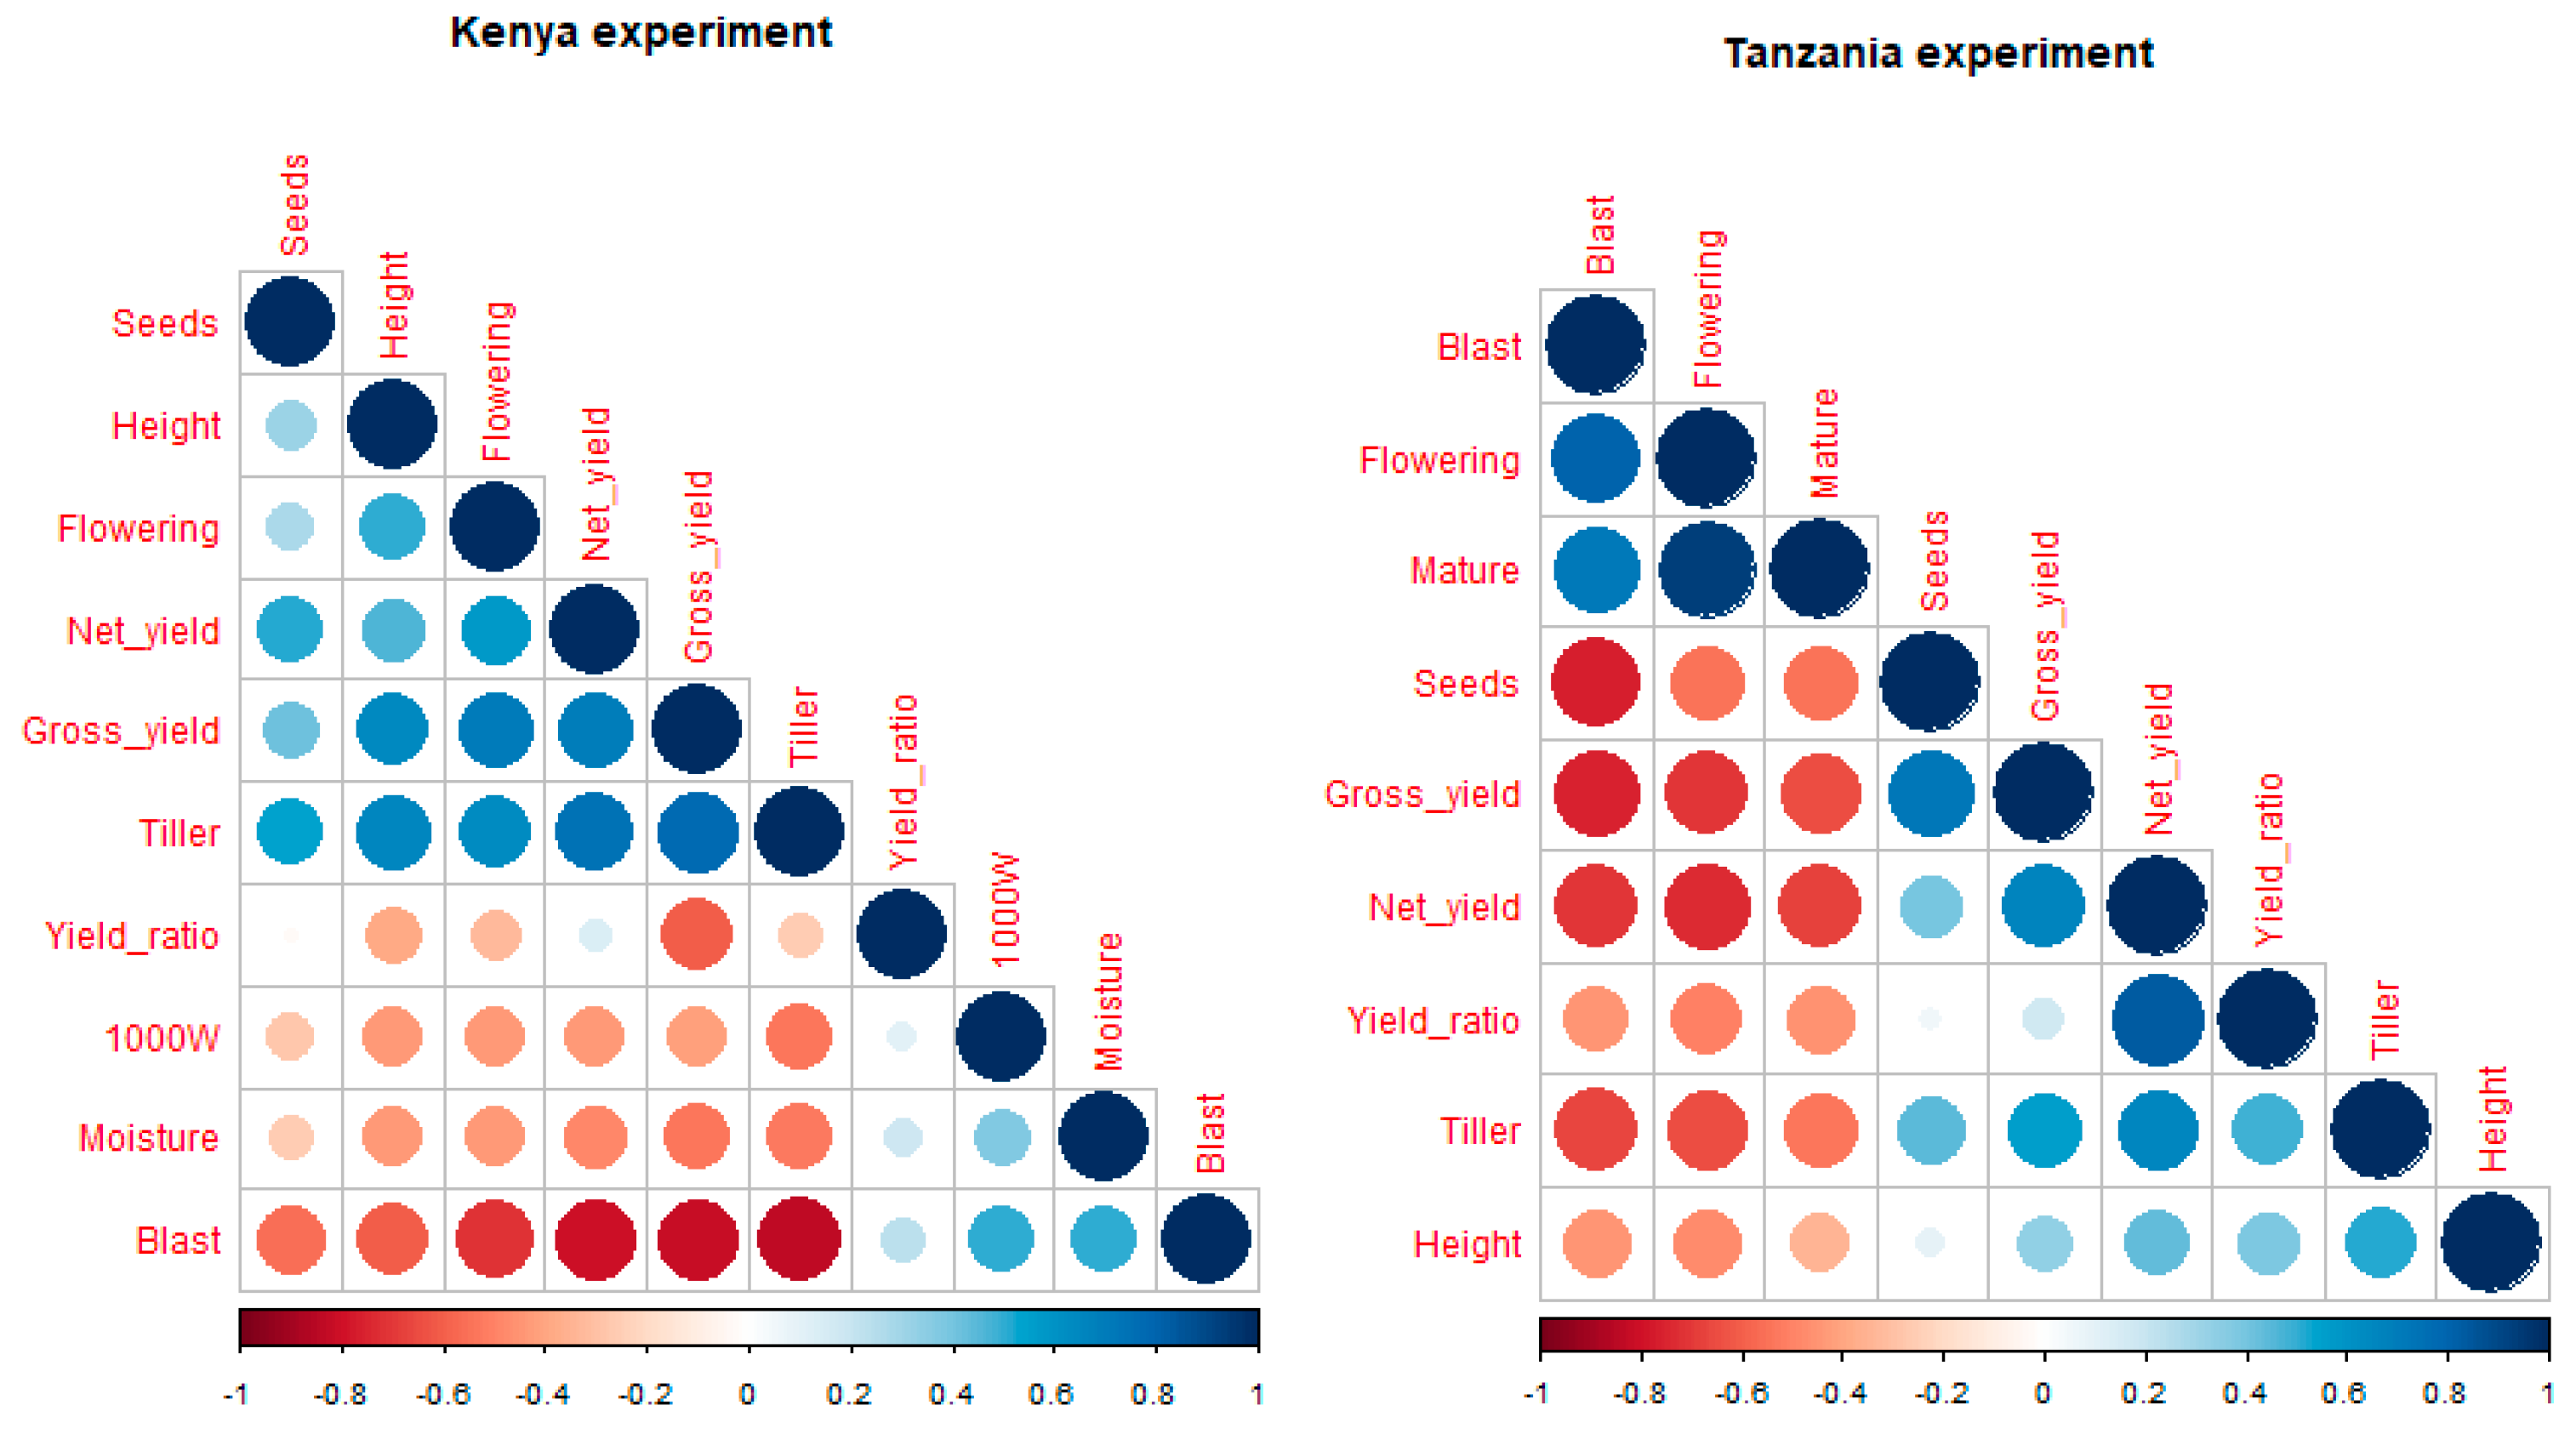
3.1.1. Overall Correlation among Variables

Correlation among variables: For correlation analysis, only the tiller number and height from the last assessment date within each year were included. All the assessed variables can be divided into two groups: (1) incidence of grain with blast symptoms, seed moisture level, 1000 seed weight, and net/raw yield ratio; and (2) number of seeds per panicle, tiller height, number of tillers per plant, days to first flowering, and raw and net grain yield. Overall, there were strong positive correlations among variables within each group and negative correlations among variables between the two groups (Figure 1). Overall, the net gross yield ratio was least correlated with other variables (Figure 1).

3.1.2. Tiller Number and Height

As expected, the tiller height increased nearly linearly with time (Figure 2). On average, plants in 2020 were higher than in 2021, with more tillers, probably because of the longer growing season (from transplanting to harvest) in 2020, about 3 weeks longer. On the last assessment date, the average plant height was 128 and 120 cm for 2020 and 2021, respectively; the corresponding values for tiller number were 38 and 30. For both years, treatments affect significantly neither the overall height nor the rate of height increase over time.
The tiller number increased and then gradually reached a plateau a few weeks before harvest (Figure 2). In 2020, treatments did not significantly affect the overall tiller number and its temporal increase pattern. However, in 2021, treatments affected (p < 0.001) both the overall tiller number and its temporal pattern. The difference between treatments at the plot level accounted for nearly 62% of the observed variability; but the interaction between treatments and time (i.e., temporal pattern) only accounted for < 0.6% of the observed variability within the plot level. Five of the seven significant pairwise treatment differences involve the water control: the water control had 3–5 fewer tillers. When the final tiller number was analyzed across both years, 14 treatments differed (p < 0.01) but only accounted for 7.6% of the total variability. Pairwise comparisons showed that four comparisons were significant, all involving the water control (Table 2). When the application timing was ignored, the water control had 3 or 4 tillers fewer (p < 0.05) than the four biopesticides and the fungicide control. Neither the four biopesticides nor the three application timings differed significantly.

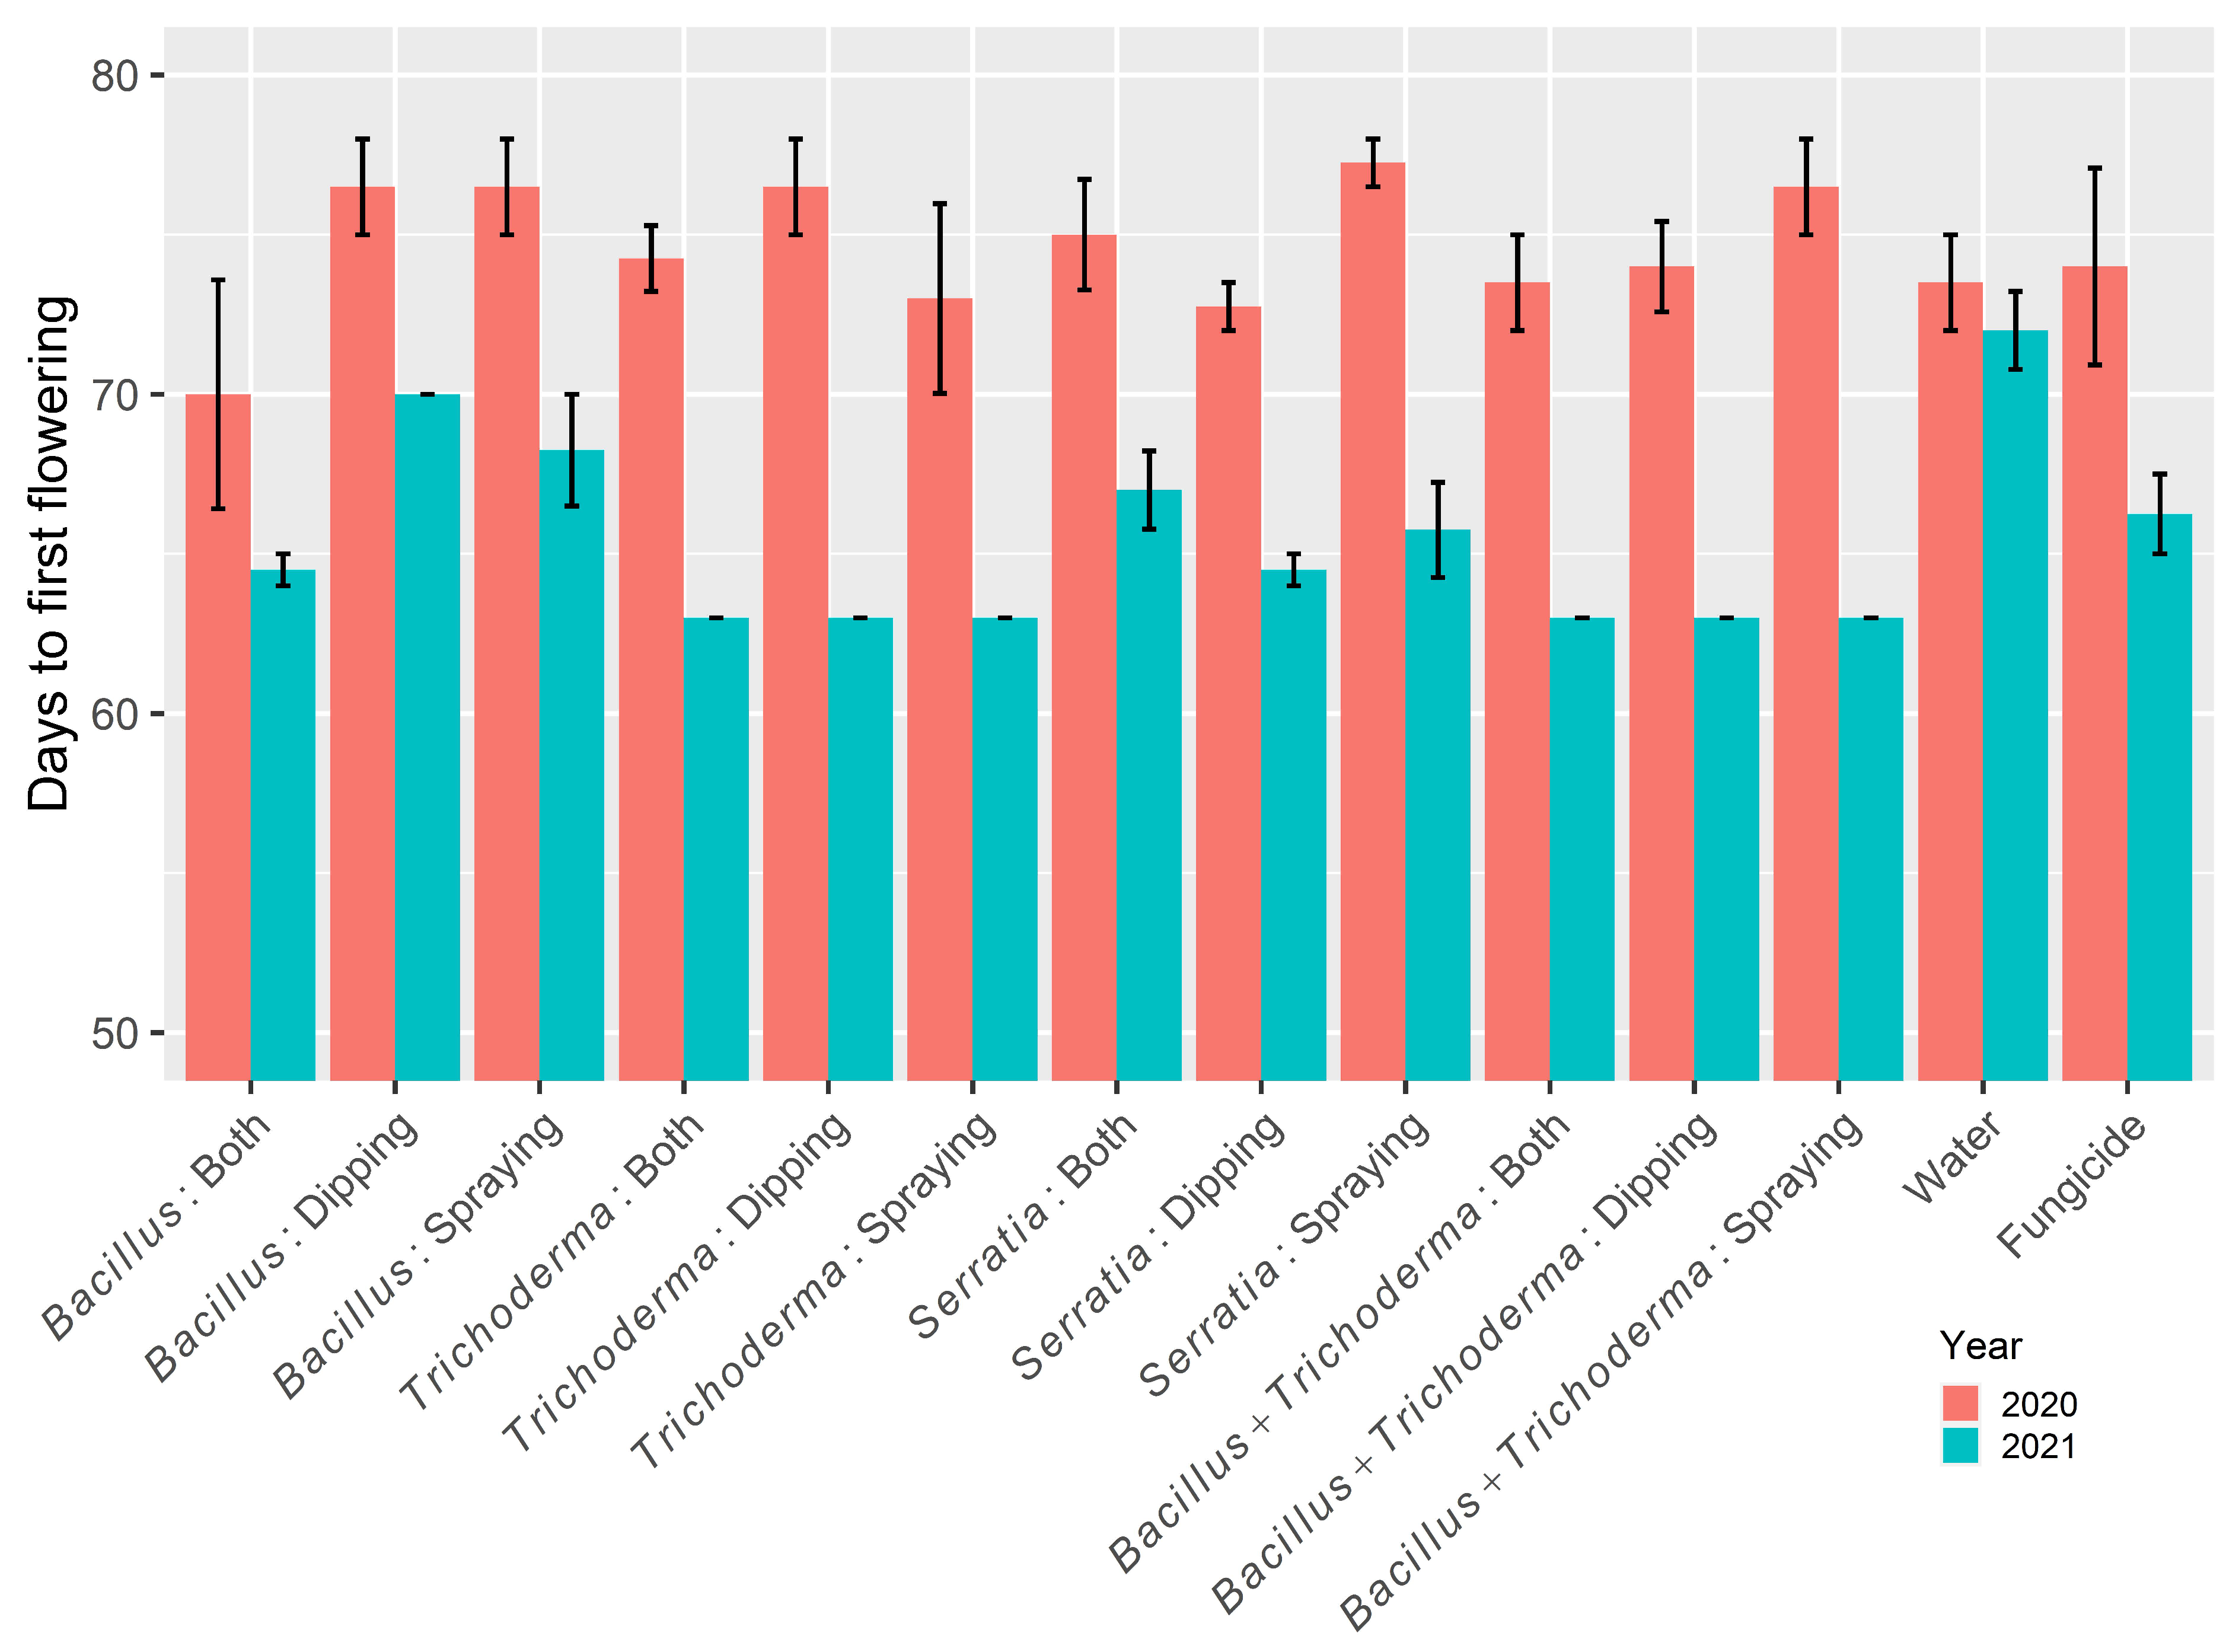
3.1.3. Days to First Flowering

Overall, plants took longer to flower and flowering time was more variable in in 2020 than in 2021 (Figure 3). The 14 treatments affected (p < 0.01) flowering time; of the 91 comparisons, two were significant (Table 2). Overall, the six products differed (p < 0.05) in their effects on the flowering time: the flowering time was greater for the water control (72.8 days) than for the Trichoderma-treated (68.8 days) plants. The ANOVA of the 12 treatments involving biopesticides showed that the four biopesticides differed (p < 0.05) in flowering times: Trichoderma led to a shorter flowering time (68.8 days) than Bacillus (71.0 days). Moreover, the effects of application time were close to significance (p = 0.086): foliar spraying appears to result in longer flowering times than both dipping and spraying (p = 0.09). There was also significant interaction between products and application timing (p < 0.01): for Bacillus, both dipping and spraying led to a much reduced flowering time than either dipping or spraying alone, whereas for the other three products, differences between the application timings were much smaller.

3.1.4. Yield Data

There were more seeds per panicle in 2020 (106.0) than in 2021 (98.1). There were significant (p < 0.001) differences among the 14 treatments in the number of seeds per panicle. The water control had fewer seeds per panicle than all the other treatments, except Bacillus and Trichoderma applied as dipping only (Table 2). Ignoring application timings, we see that the water control had fewer (p < 0.001) seeds than four biopesticides and the fungicide). Analysis of the 12 biopesticide treatments indicated that dipping only led to fewer (p < 0.05) seeds (98.6) than foliar spraying (103.0) and both dipping and spraying (104.0). There were no significant effects of treatments (including products and their timing) on the 1000 seed weight and seed moisture. Overall, 1000 seed weight was greater in 2021 (21.8 g) than in 2020 (20.6 g), and this was due to the higher moisture level in 2021 (14.1%) than in 2020 (12.9%).
The net yield was higher in 2020 than in 2021, and the plot-to-plot variability was much less in 2020 than in 2021 (Figure 4). Treatments differed significantly (p < 0.001), but only accounting for 13.8% of the total variability. Of the 91 pairwise comparisons, seven were significant (p < 0.05) (Table 2). The water and fungicide treatments led to a net yield of 8.1 and 9.6 kg, respectively. Overall, the water control led to a lower net yield than Bacillus, Serratia, and fungicide treatments. The ANOVA of the 12 treatments involving biopesticides showed that the biopesticides differed (p < 0.001): Serratia led to a greater yield (9.6 kg) than Bacillus (9.1), Trichoderma (8.8 kg), and mixed Bacillus/Trichoderma (8.8 kg). The application timing did not significantly affect net yield.
The ratio of net and gross yield was generally higher but also more variable in 2021 than in 2020. The differences among 14 treatments were close to statistical significance (p = 0.07). The Tukey HSD test showed that only one pairwise comparison was close to significance (p = 0.08): the ratio is lower for the water control than the Serratia dipping treatment. Ignoring the application methods, the six products (four biopesticides, water, and fungicide) differed (p = 0.01) in the net gross yield ratio. Both Trichoderma (23.8%) and water (22.8%) led to a lower ratio than Serratia (27.8%). The ANOVA of the 12 treatments involving biopesticides showed that the four biopesticides differed (p < 0.01) in the net gross yield ratio: Serratia led to a greater ratio than Trichoderma. The application timing did not significantly affect the net gross yield ratio.

3.1.5. Blast Development

The incidence of grains with blast symptoms was higher in 2021 (5.8%) than in 2020 (1.3%); the water control had incidences of 3.8% and 8.2% in 2020 and 2021, respectively (Figure 5). There were significant (p < 0.001) differences among the 14 treatments in the incidence of grain with blast symptoms. Of the 91 pairwise comparisons, 23 were significant; 13 of these 23 comparisons involved the water control with a higher incidence than all the others (Table 2), and nine of the 23 cases involved the fungicide control (with lower incidence). ANOVA of 12 treatments with biopesticides showed that the four products differed significantly (p < 0.05), but there were no differences among the three application timings. Trichoderma-treated plants had a higher incidence of blast (3.8%) than Serratia and Bacillus (3.3%).

3.2. Tanzania Experiments

Overall treatment means and their standard errors are given in Table 3.

3.2.1. Overall Correlation among Variables

Only the tiller number and height from the last assessment were included in correlation analysis. The correlation pattern was similar to that observed in the Kenya experiment. All the assessed variables can be divided into two groups: (1) incidence of grain and plants with blast symptoms, and days to flowering and grain mature; and (2) tiller number and height, number of grains per head, net gross yield ratio, and gross or net yield. Overall, there were strong positive correlations among variables within groups and negative correlations between variables from the two groups (Figure 1).

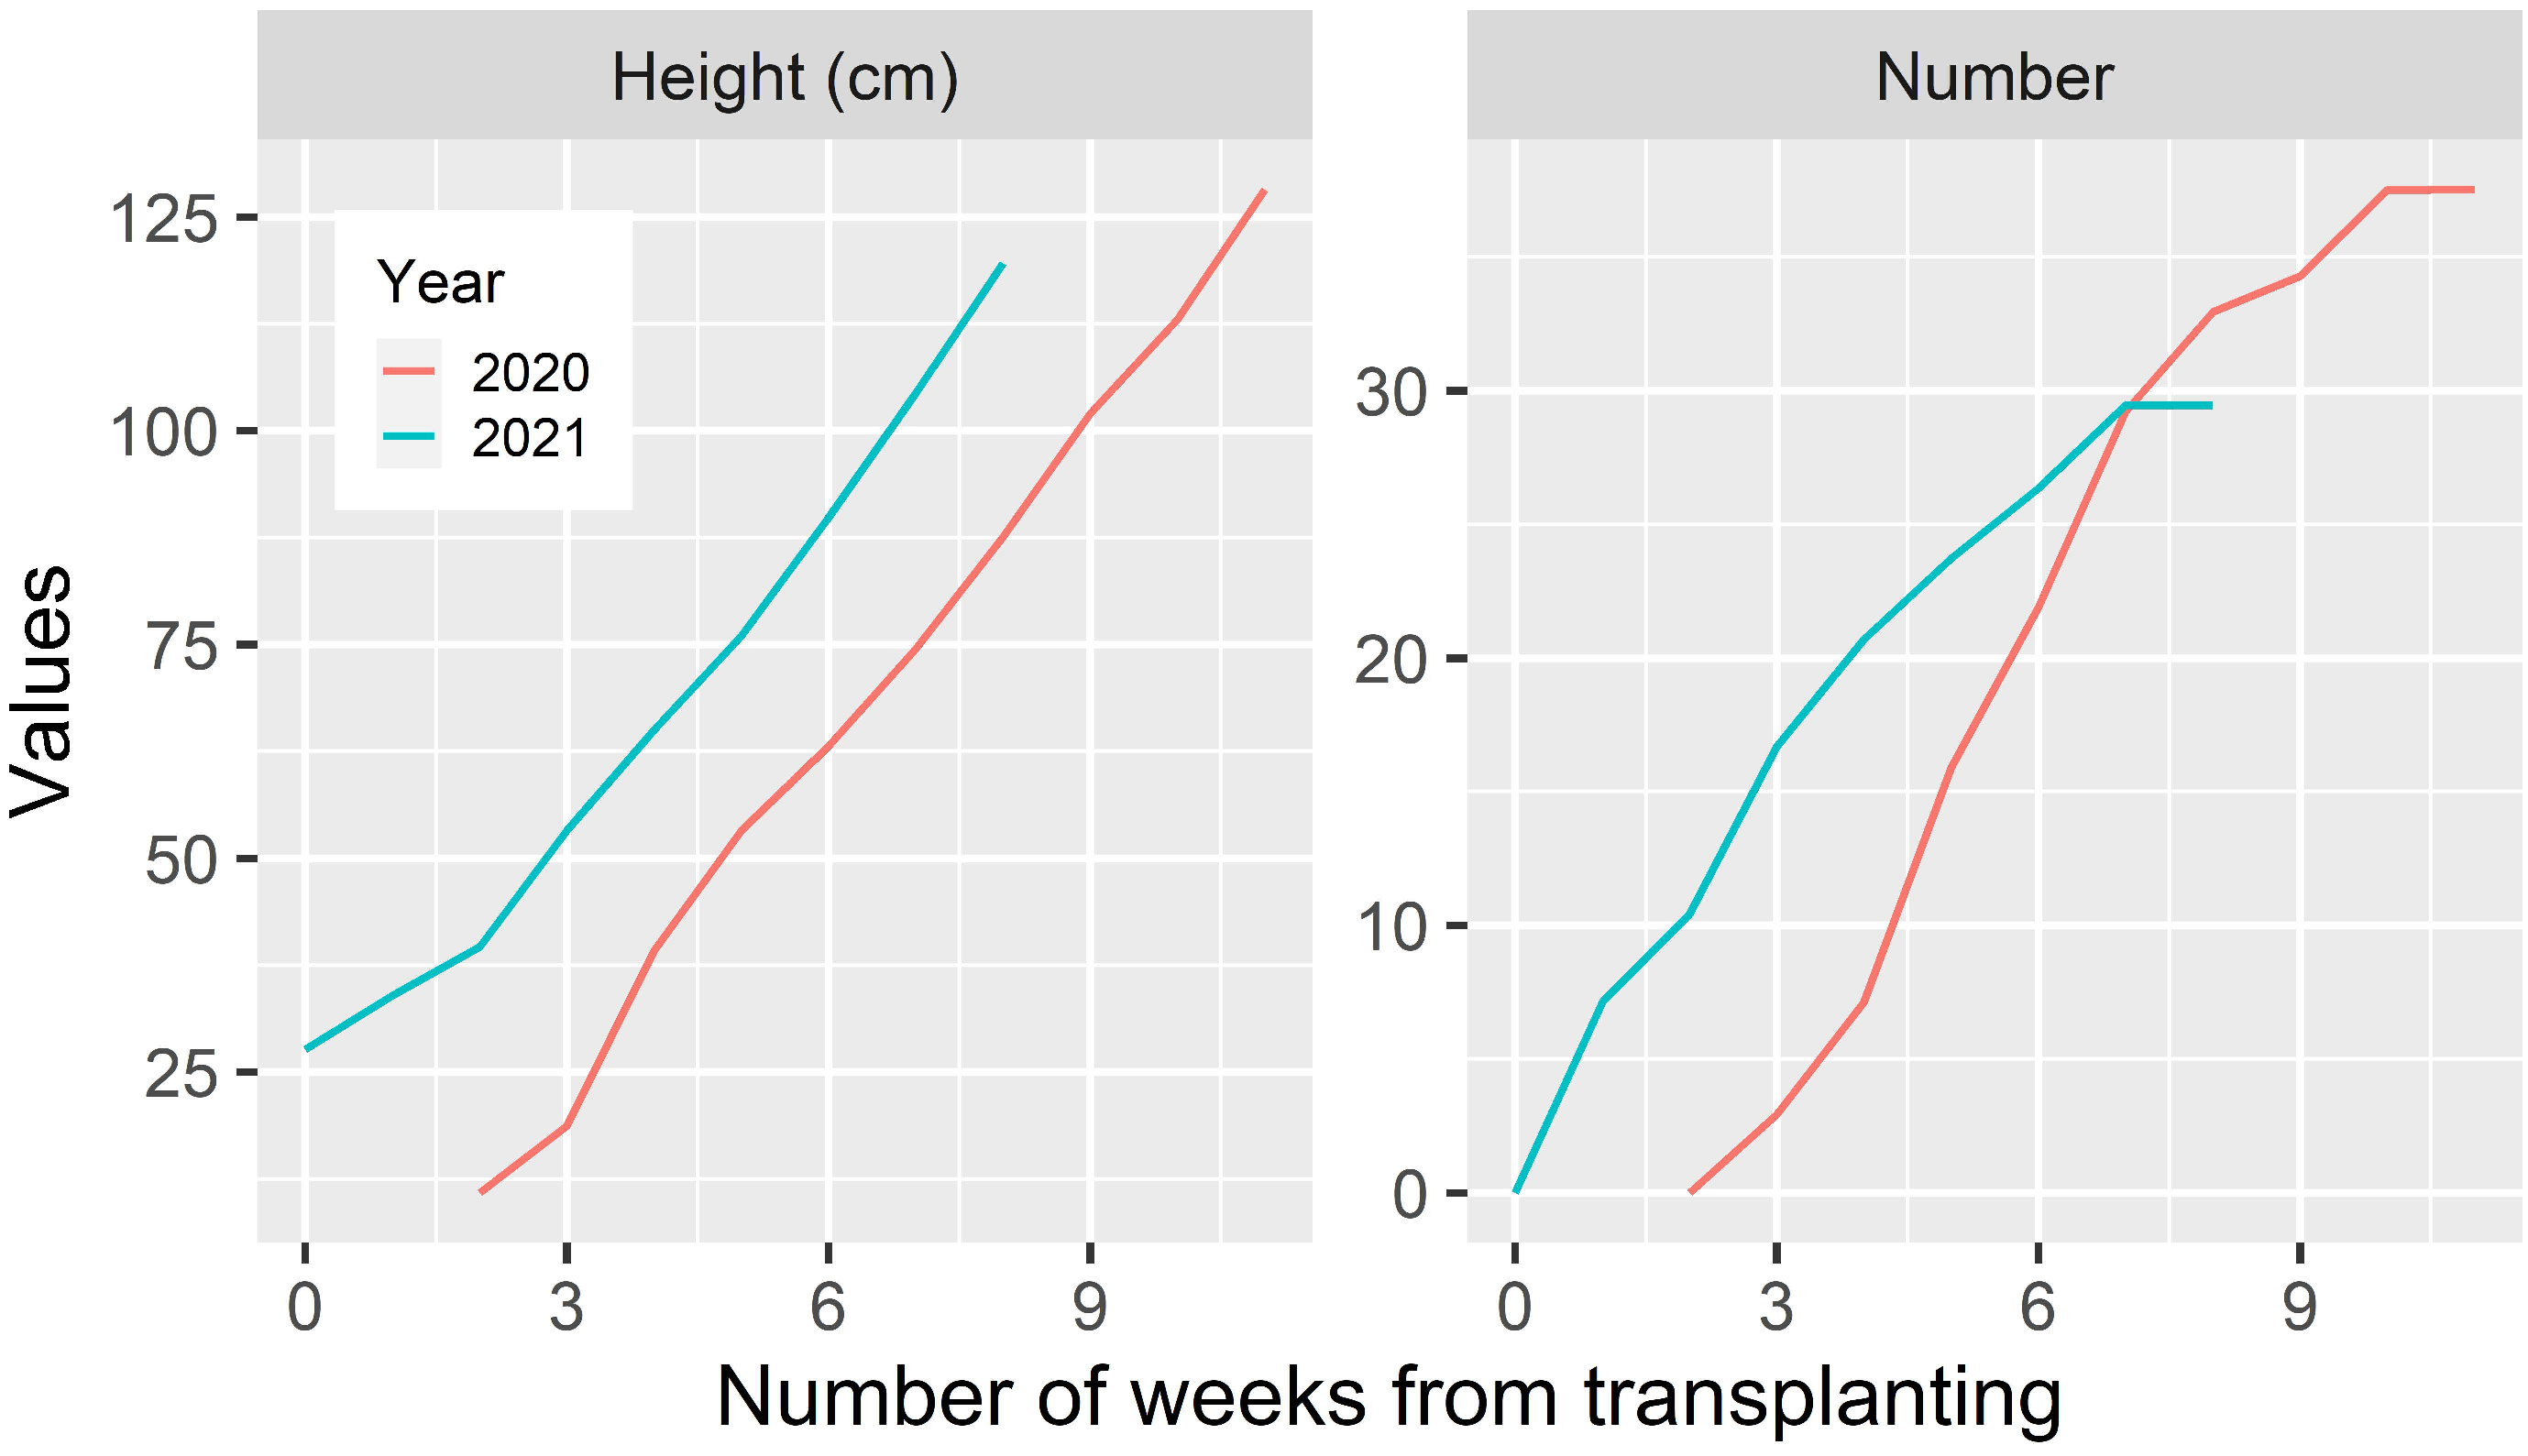
3.2.2. Tiller Number and Height

At the plot level over all three assessments, there were significant (p < 0.001) differences in the number of tillers between three products and between the three application methods, as well as their interaction (p < 0.001). For all three application methods, Trichoderma led to more tillers than Bacillus, and this, in turn, led to more tillers than the water (Table 3 and Figure 6). Both dipping and spraying led to more tillers than dipping or spraying alone (Table 3 and Figure 6). All interactions with time were significant (p < 0.001). The temporal rate of increase in tiller number is greater for plots treated at the transplanting stage, as well as foliar spraying, than either dipping or spraying only; Trichoderma-treated plants had the greatest rate of increases in tiller numbers, whereas the water treatment had the lowest rate (Figure 6). The overall effect of treatments on tiller height was similar to that of tiller number, except for one noticeable difference (Figure 6): there were virtually no differences between Trichoderma and Bacillus for the dipping and both dipping/spraying treatments.

3.2.3. Time to 30% Flowering
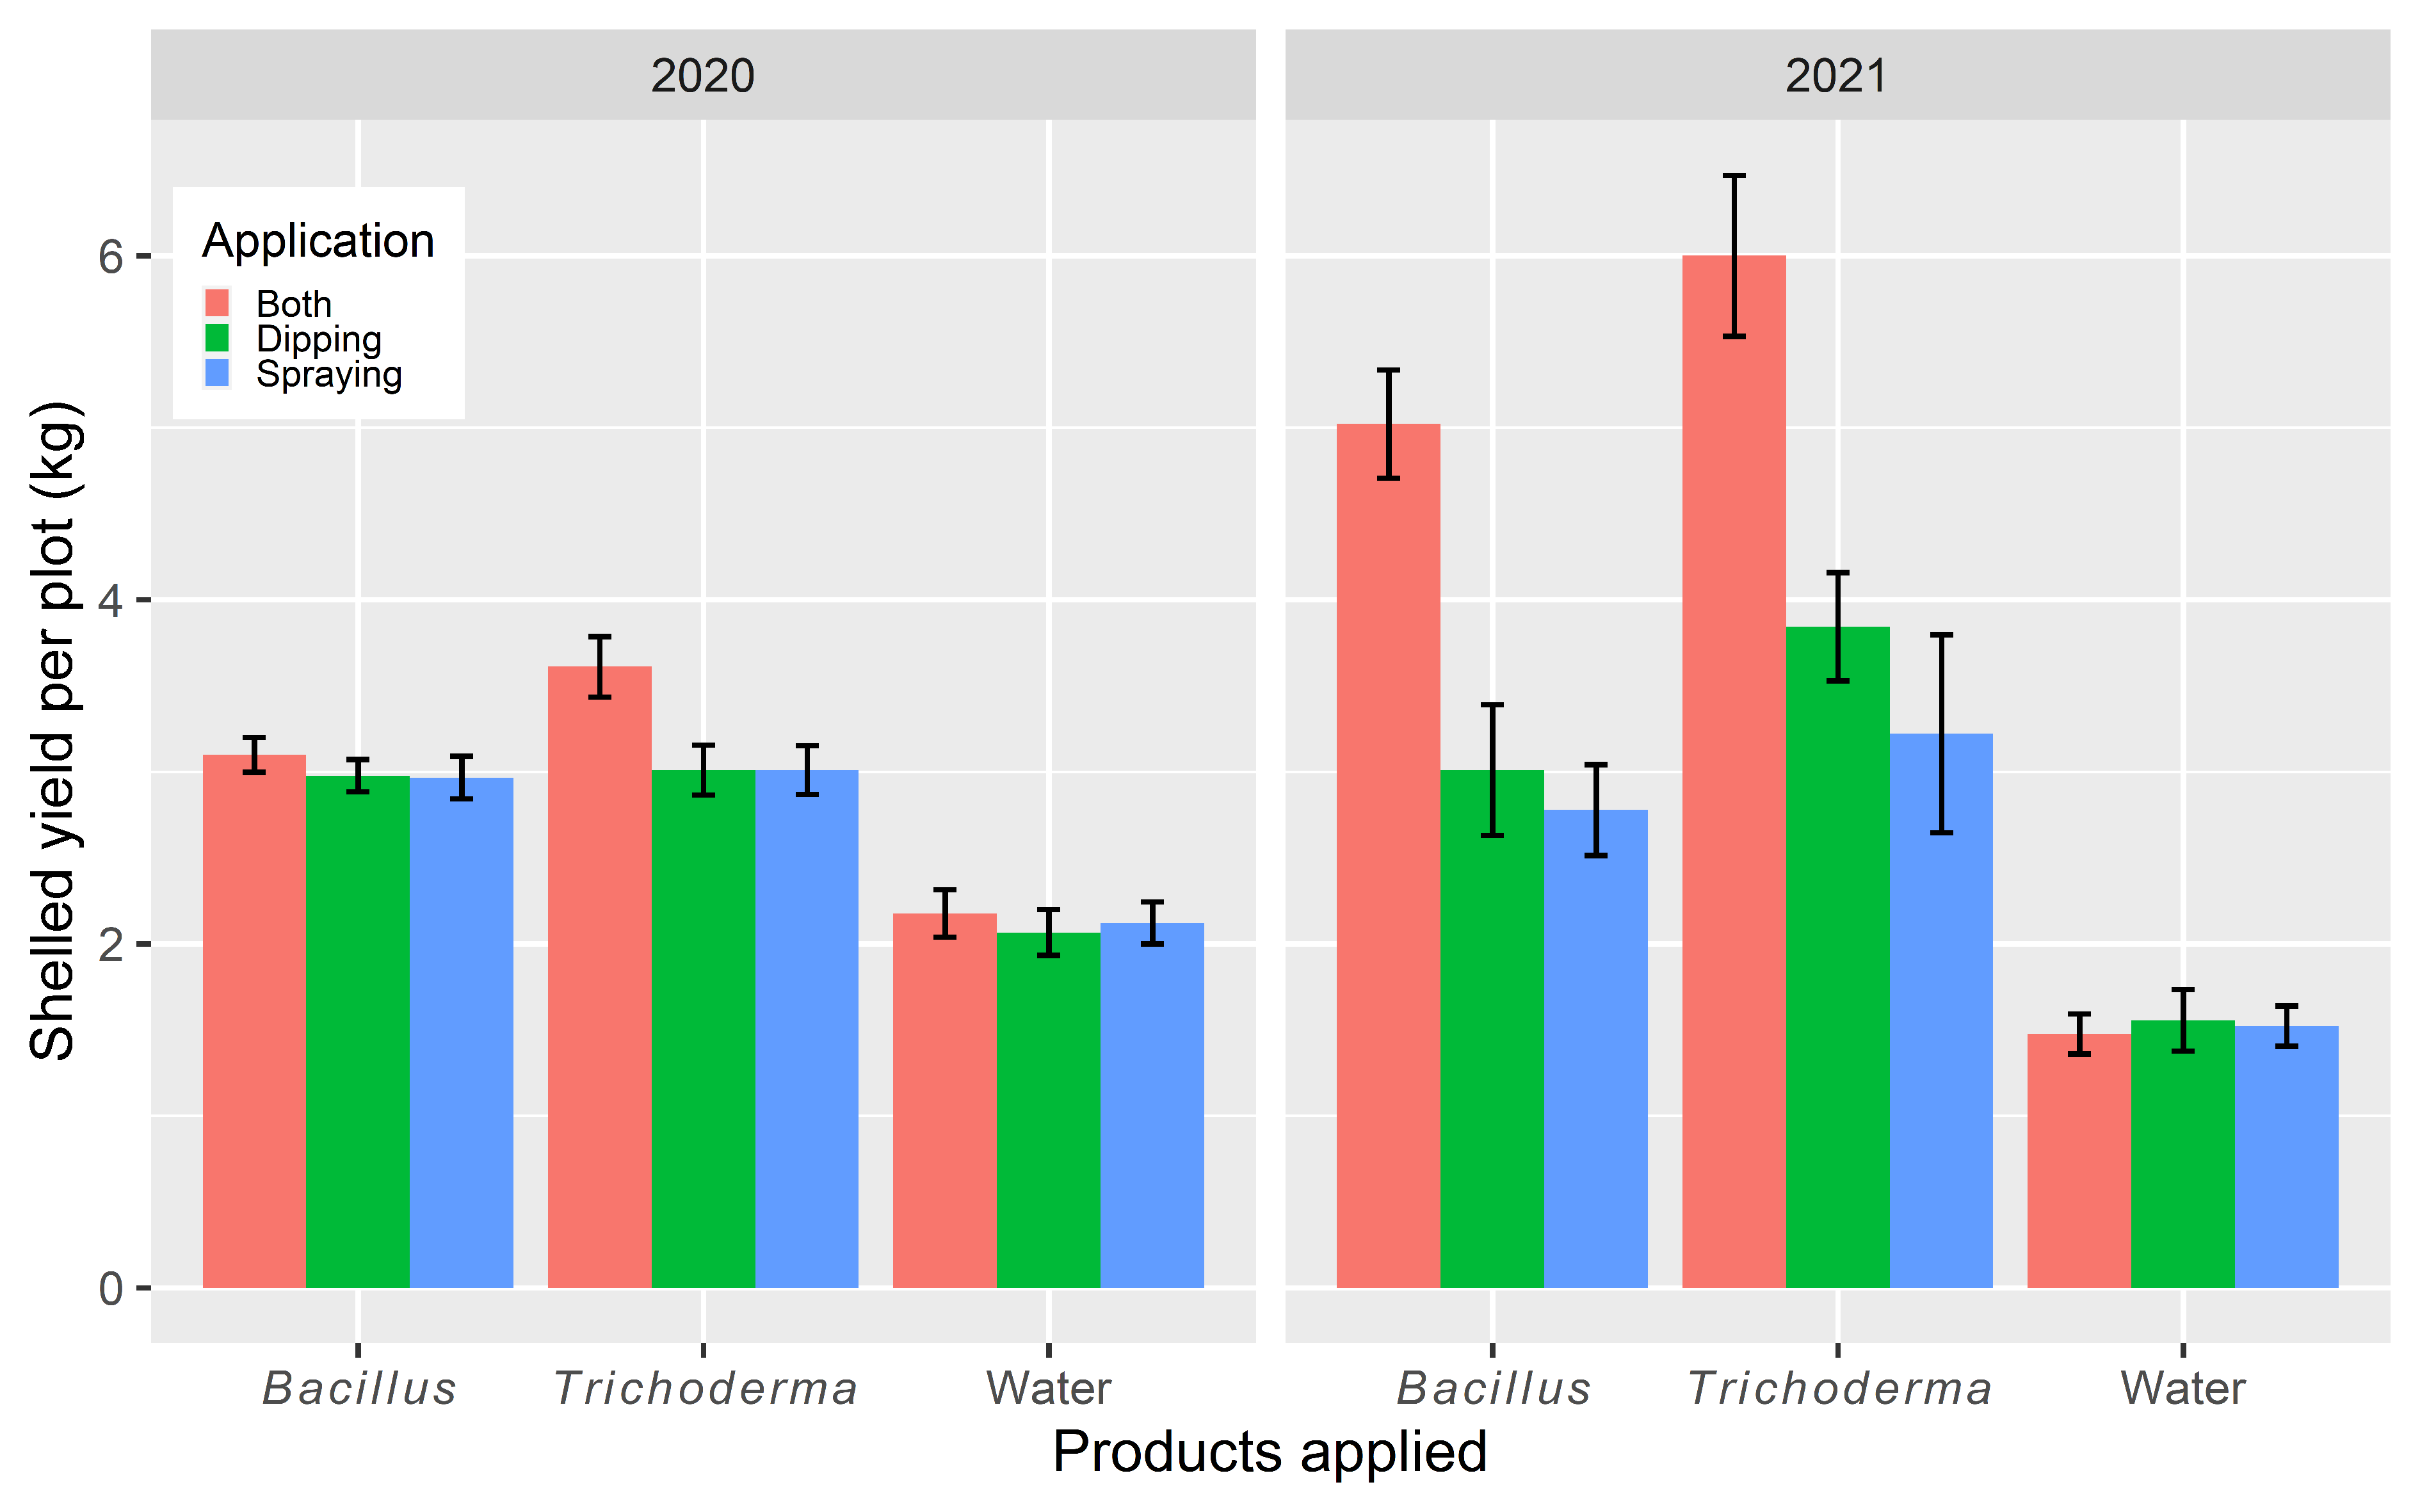
Growing season was much shorter at the Kikwe site than the other two sites: time (days) to 30% flowering was 59.6 ± 1.10, 65.8 ± 1.20, and 70.8 ± 1.49 at the Kikwe, Babati, and Moshi sites, respectively. Three products differed (p < 0.001) in their effects on the times to 30% flowering, accounted for 27.0% of the total variability, most of which resulted from the differences between water (74.4 ± 1.09) and the two biopesticides (Bacillus: 59.5 ± 1.19; Trichoderma: 58.4 ± 1.33). This difference was consistent over the two years (Figure 7). Application methods differed (p < 0.01), accounting for 4.3% of the total variability. Applying biopesticides as both dipping and foliar spray treatments reduced (p < 0.001) the time to flowering: 60.6 ± 1.72 versus 65.0 ± 1.40 (dipping) and 66.6 ± 1.36 (spraying). There were significant (p < 0.001) interactions between application methods and products: reduction in flowering time associated with both dipping and post-transplanting foliar sprays was not present for water (Figure 7). The overall pattern of application and product effects on the time to grain maturity was similar to that observed for flowering time, except that Trichoderma treatments led to a shorter (p < 0.05) time than Bacillus treatments: 90.2 ± 1.24 versus 92.6 ± 1.23 days.

3.2.4. Yield

Most of variability in the total number of grains per head was due to year-to-year and site-to-site differences, accounting for 30% and 38% of the total variability, respectively. The differences between the three products accounted for about 10% of the total variability. Trichoderma-treated plants had more (p < 0.01) grains (127 ± 2.03) than Bacillus-treated (121 ± 2.51), which, in turn, was greater (p < 0.001) than the water control (113 ± 2.78). However, the application methods differed significantly but only accounted for 1.7% of the total variation: applying both dipping/spraying led to more grains (123 ± 2.31) than either dipping (120 ± 2.61) or spraying (118 ± 2.73).
Treatment differences in net yield were much greater in 2021 than in 2020 (Figure 8): the best treatments had more than three times of net yield of the water control in 2021. Net yield at the Kikwe site was consistently greater (3.6 ± 0.21) than at the Babati (2.8 ± 0.16) and Moshi (2.5 ± 0.14) sites. Differences between the three products accounted for about 30.3% of the total observed variability, most (nearly 98%) of which resulted from the differences (p < 0.001) between water (1.8 ± 0.07) and the two biopesticides (Bacillus, 3.3 ± 0.14; Trichoderma, 3.8 ± 0.20). The net yield for Trichoderma-treated plots was also greater (p < 0.05) than that achieved in the plots treated with Bacillus.
Application methods also differed (p < 0.01), accounting for 4.1% of the total variability. Applying products as dipping and foliar-spray treatment led to greater (p < 0.001) yield: 3.6 ± 0.24 versus 2.7 ± 0.14 (dipping) and 2.6 ± 0.14 (spraying). Such a difference was particularly pronounced in 2021 (Figure 7). There were significant (p < 0.01) interactions between application methods and products: benefits associated with both dipping and spraying were only present for the two biopesticides (Figure 8). The overall pattern of application and product effects on the gross yield was similar to that observed for the net yield.
The ratio of net and gross yield differed (p < 0.001) among the three products: water (33.6% ± 0.86) and the two biopesticides (Bacillus: 45.9% ± 1.62; Trichoderma: 48.8% ± 1.90), accounting for about 22.2% of the total variability. Application methods also differed (p < 0.05), but they only accounted for 2.1% of the total variability. Applying biopesticides as dipping, as well as foliar spray treatment, led to a greater (p < 0.01) net gross yield ratio: 46.6% ± 2.26 versus 41.3% ± 1.54 (dipping) and 40.4% ± 1.23 (spraying). The interactions between the two single DF comparisons, (biopesticide vs. water) and (both vs. dipping/spraying), just reached the significance level at p = 0.05: benefits associated with both dipping and spraying were only for the two biopesticides.

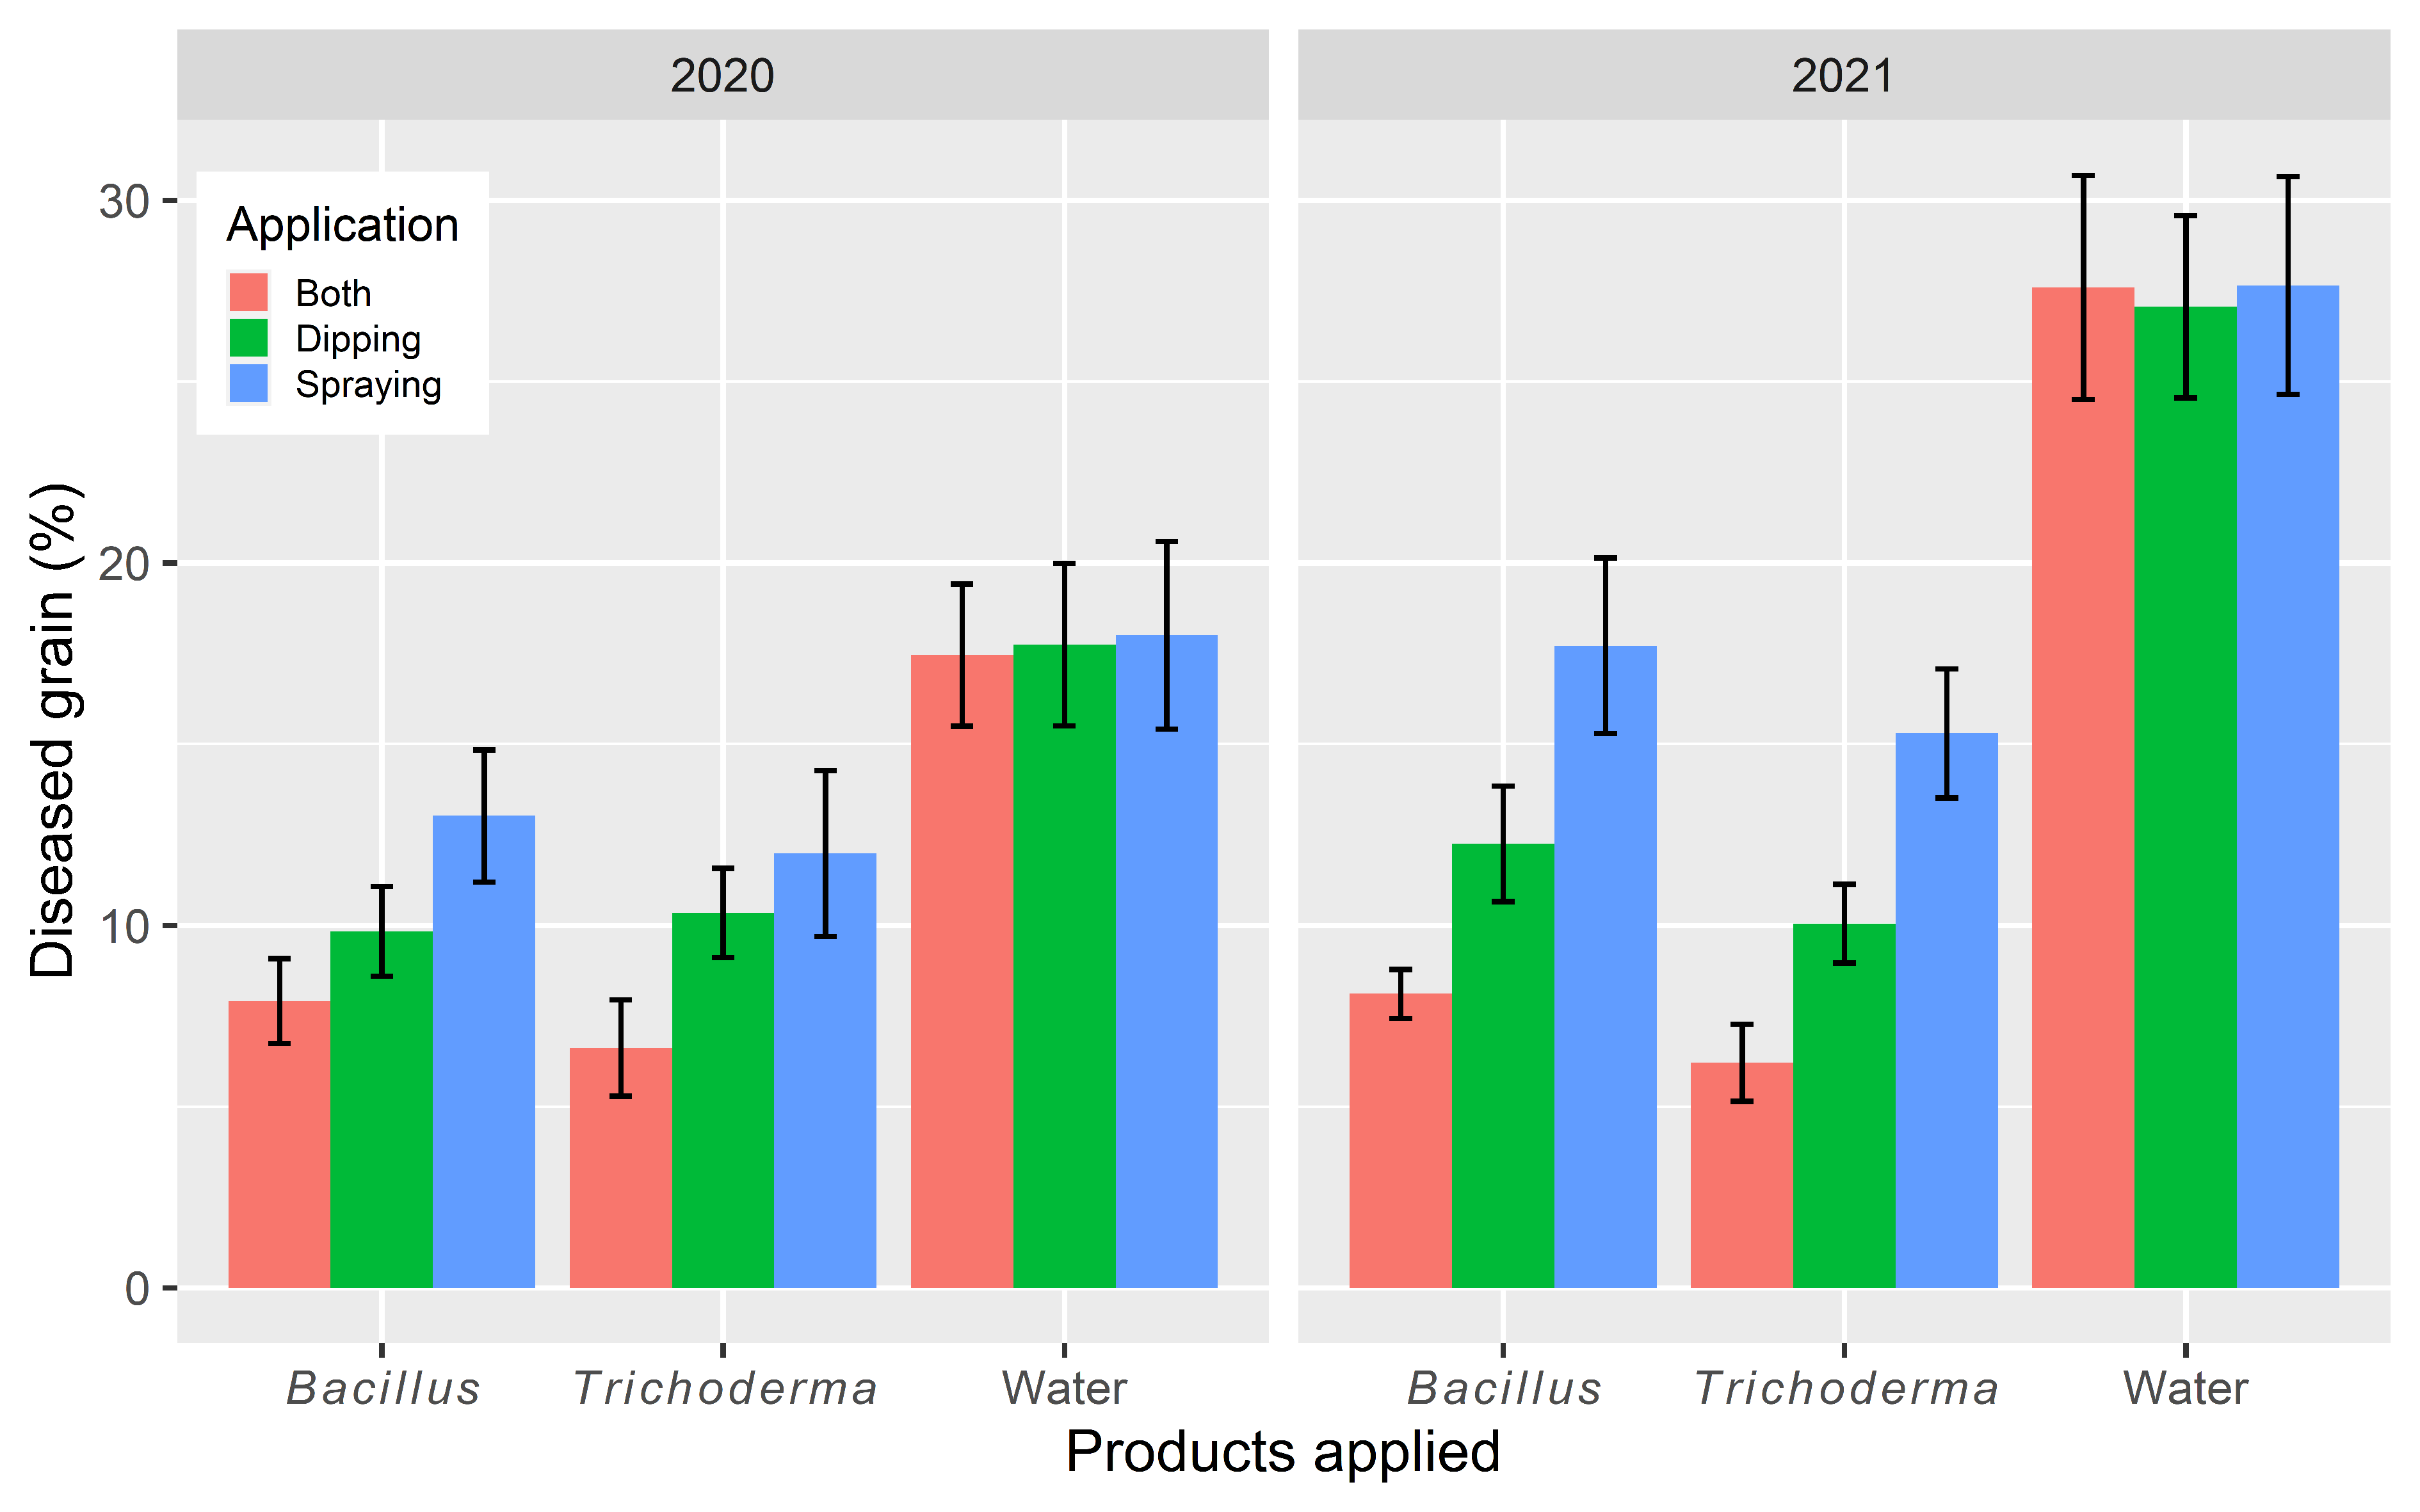
3.2.5. Blast Development

The disease level varies greatly among the three sites, as well as between years: in both years, the Kikwe site had much less blast incidence (8.4% ± 0.65) than at the Babati (17.9% ± 1.20) and Moshi (17.9% ± 1.16) sites. Disease incidence was higher in 2021 (16.9% ± 1.12) than in 2020 (12.5% ± 0.74). The three products differed (p < 0.001) in the incidence of grains with blast symptoms, accounting for 23.5% of the total variability, most of which resulted from the differences between water (22.6% ± 1.21) and the two biopesticides (Bacillus, 11.5% ± 0.77; Trichoderma, 10.1% ± 0.73). This difference was consistent over the two years (Figure 9). Trichoderma treatments had fewer (p < 0.01) grains with blast symptoms than the Bacillus treatments.
Disease incidence also differed (p < 0.001) among the three application methods, accounting for 5.2% of the total variability. Applying biopesticides as both dipping and foliar spray treatments reduced blast: 12.3% ± 1.27 versus 14.6% ± 1.09 (dipping) and 17.3% ± 1.16 (spraying). The difference between dipping and spraying treatments was also significant (p < 0.01). As expected, there were significant (p < 0.001) interactions between application methods and product, because differences in application methods existed only for the two biopesticides.

4. Discussion

Several commercial biopesticides were evaluated for their effects against rice blast and yield in Kenya and Tanzania. Commercial biopesticides were used instead of experimental microbial strains, since the central objective of this research was for local farmers to be able to use the results immediately. The present study demonstrated the benefits of applying biopesticides in rice production in terms of blast control and grain yield. Furthermore, it also indicated that the magnitude of benefits associated with use of biopesticides critically depended on the rice productivity and blast disease severity in the region. The benefit is greatest in subsistence farming and when the blast disease pressure is greater.
The average yield of the water control was only 0.42 t/ha at three Tanzania sites, compared to 3.24 t/ha at the Kenya site. Several factors may account for such differences. Firstly, the two cultivars may intrinsically differ in their crop-yield potentials. For instance, for the water control, the tiller number at the Kenya site was about twice of that at the Tanzania sites. Secondly, rice blast was more severe at the Tanzania sites than at the Kenya site: 6% versus 23% for the water control. Finally, differences in the local climatic conditions, soil fertility, and management are expected to have contributed to the observed differences in the grain yield. In addition, possible dependencies of plant responses to microbial treatments on these local variables may also have contributed to the observed differences between sites.
Biopesticides achieved greater benefits for three sites in Tanzania, resulting in an average increase of ca 100%, compared to the water control. Every biopesticide treatment, irrespective of its application timing, led to significant increases in grain yield, particularly for 2021, due to more severe blast development. In both countries, all biopesticide treatments led to reduced blast incidence in grain, confirming previous studies on controlling blast with other B. subtilis and Trichoderma strains [12,13,18,20]. However, at the Kenya site where a fungicide control was included, the efficacy in blast control achieved by most biopesticide treatments was still lower than that achieved by the fungicide. In contrast, only several biopesticide treatments at the Kenya site led to increased yield over the water control, and all biopesticide treatments did not differ significantly in grain yield from the fungicide control. Thus, the disease control achieved was not necessarily translated to yield gains for the Kenya site, due probably to the fact that the absolute blast level was much lower.
The effects of application timing on blast development and grain yield are dependent on rice blast severity. Applying both dipping at transplanting and post-transplanting foliar spray led to a much better yield only in 2021 at the three Tanzania sites where the disease pressure was greatest. Thus, dipping at the transplanting stage may be sufficient to control rice blast when disease pressure is low to moderate. Efficacy of seed priming or dipping seedlings with beneficial microbes has been demonstrated in controlled conditions to suppress rice blast development, including B. subtilis and Trichoderma strains [12,13,18,20]. The control achieved by dipping at transplanting may primarily be from induced resistance and direct effect on the pathogen. Strains from B. subtilis, Trichoderma spp., and Serratia spp. have been demonstrated to induce systemic defense response, which may be longer lasting and contribute to disease suppression. These microbes may also improve plant development and tolerance to other stress factors, as demonstrated by the increased number tillers and height associated with biopesticides, particularly in Tanzania. This may also partially explain the reduced benefit associated with their use for the high productive site in Kenya: these beneficial microbes usually benefit their plant hosts the most under stressful conditions. Furthermore, biopesticides also led to an increased net-and-gross-yield ratio, as is consistent with a previous finding that colonization of plant roots by specific Trichoderma strains can lead to the upregulation of genes and pigments that improve the plants’ photosynthesis [21]. The blast fungus can behave as a typical root-infecting pathogen: root colonization can lead to systemic invasion and the development of classical disease symptoms on the aerial parts of the plant [28]. Thus, root dipping may also have a direct effect against the fungus. However, such host response and/or direct effects on the pathogen may be insufficient or long-lasting to control disease under high disease pressure; under such conditions, infection and subsequent development may have happened late in the growing season, further away from the dipping treatment. This also suggests the importance of being able to forecast blast development in short (days) and medium (weeks/months) terms. Further research is needed to evaluate blast forecasting models [4,29,30] for their effectiveness in assisting farmers timing biopesticide application during the growing season to manage rice blast.
For the first time, we demonstrated that a formulated Serratia product is very effective against rice blast, along with B. subtilis and Trichoderma. Although disease control with Serratia was not as good as the fungicide treatment, the grain yield was comparable to the fungicide. This may thus suggest that this specific isolate may have general beneficial effects in improving plant development in addition to its biocontrol ability, agreeing with previous studies of Serratia spp. on other plant hosts and pathogens [15,16,25]. The relative performance of individual biopesticides is likely to be context dependent. Thus, in comparison with B. subtilis, Trichoderma appears to perform better in low productive regions with high disease pressure (Tanzania) than in Kenya. This raises further questions about whether it is feasible and, indeed, advisable to produce general recommendations on using biopesticides without context-specific information. This is not surprising, since, in contrast to pesticides, biocontrol organisms are living organisms and can be affected by other biotic and abiotic factors.
The combined use of multiple biopesticides has been proposed to improve biocontrol efficacies and performance consistencies to exploit possible synergies among biopesticides. However, such a promise in synergistic interactions among biopesticides has rarely been achieved; indeed, the opposite is often observed, as agonistic interactions between component microbes are observed [9]. In this study, the mixed product of B. subtilis and Trichoderma did not improve either disease control or grain yield over the single component biopesticides. In contrast, a previous study [20] showed inoculation of both B. subtilis and Trichoderma sp. led to increased inhibition of blast than single biocontrol agent treatment; however, this does not necessarily mean the lack of competitive interactions among the two strains. These synergies need to be formally statistically tested to fully understand their unique interactions [9].

5. Conclusions

The present research suggested that the use of formulated B. subtilis and T. asperellum biopesticides for blast management is beneficial in terms of not only blast control but also in increased grain yield, particularly in low-production regions with high disease pressure. In highly productive regions, a formulated S. nematodiphila biopesticide appears to perform better than both B. subtilis and T. asperellum. Using a product with both B. subtilis and T. asperellum, however, did not improve its performance over either B. subtilis or T. asperellum used alone. Moreover, a single treatment applied as dipping at the transplanting stage is sufficient; further post-transplanting foliar spray is only necessary when the blast pressure is high.

Author Contributions

Conceptualization, X.X.; methodology, R.M., G.R. and X.X.; formal analysis, X.X.; investigation, R.M. and G.R.; resources, R.M. and G.R.; data curation, R.M. and G.R.; writing—original draft preparation, X.X.; writing—review and editing, L.R.-B., R.M., G.R. and X.X.; visualization, X.X.; supervision, X.X.; project administration, R.M., G.R. and L.R.-B.; funding acquisition, X.X. All authors have read and agreed to the published version of the manuscript.

Funding

This research is funded by Innovate UK (project number 105665).

Data Availability Statement

Data are available directly from the corresponding author upon request.

Conflicts of Interest

X.X. and L.R-B. declare no conflict of interest; R.M. and G.R. are employed by Real IPM who produced the three commercial biopesticides evaluated in the present study. The funders had no role in the design of the study; in the collection, analyses, or interpretation of data; in the writing of the manuscript; or in the decision to publish the results.

References

  1. Zenna, N.; Senthilkumar, K.; Sie, M. Rice Production in Africa. In Rice Production Worldwide; Chauhan, B.S., Jabran, K., Mahajan, G., Eds.; Springer International Publishing: Cham, Switzerland, 2017; pp. 117–135. ISBN 978-3-319-47516-5. [Google Scholar]
  2. Seck, P.A.; Touré, A.A.; Coulibaly, J.Y.; Diagne, A.; Wopereis, M.C.S. Africa’s rice economy before and after the 2008 rice crisis. In Realizing Africa’s Rice Promise; Wompereis, M.C.S., Johnson, D.E., Ahmadi, N., Tollens, E., Jalloh, A., Eds.; CABI: Wallingford, UK, 2013; pp. 24–34. [Google Scholar] [CrossRef] [Green Version]
  3. International Rice Research Institute. Rice Blast Disease; Zeigler, R.S., Leong, S.A., Teng, P.S., Eds.; C.A.B. International: Wallingford, UK, 1994; p. 626. [Google Scholar]
  4. Asibi, A.E.; Chai, Q.; Coulter, J.A. Rice Blast: A disease with implications for global food security. Agronomy 2019, 9, 451. [Google Scholar] [CrossRef] [Green Version]
  5. Besi, M.I.; Tucker, S.L.; Sesma, A. Magnaporthe and its relatives. In Encyclopedia of Life Sciences (ELS); John Wiley & Sons, Ltd.: Chichester, UK, 2009; pp. 1–9. [Google Scholar]
  6. Wilson, R.A.; Talbot, N.J. Under pressure: Investigating the biology of plant infection by Magnaporthe oryzae. Nat. Rev. Microbiol. 2009, 7, 185–195. [Google Scholar] [CrossRef] [PubMed]
  7. Aktar, M.W.; Sengupta, D.; Chowdhury, A. Impact of pesticides use in agriculture: Their benefits and hazards. Interdiscip. Toxicol. 2009, 2, 1–12. [Google Scholar] [CrossRef] [PubMed] [Green Version]
  8. Woo, S.L.; Ruocco, M.; Vinale, F.; Nigro, M.; Marra, R.; Lombardi, N.; Pascale, A.; Lanzuise, S.; Manganiello, G.; Lorito, M. Trichoderma-based products and their widespread use in agriculture. Open Mycol. J. 2014, 8, 71–126. [Google Scholar] [CrossRef] [Green Version]
  9. Xu, X.-M.; Jeffries, P.; Pautasso, M.; Jeger, M.J.J. Combined use of biocontrol agents to manage plant diseases in theory and practice. Phytopathology 2011, 101, 1024–1031. [Google Scholar] [CrossRef] [Green Version]
  10. Spence, C.; Alff, E.; Johnson, C.; Ramos, C.; Donofrio, N.; Sundaresan, V.; Bais, H. Natural rice rhizospheric microbes suppress rice blast infections. BMC Plant Biol. 2014, 14, 130. [Google Scholar] [CrossRef] [Green Version]
  11. Xu, T.; Li, Y.; Zeng, X.; Yang, X.; Yang, Y.; Yuan, S.; Hu, X.; Zeng, J.; Wang, Z.; Liu, Q.; et al. Isolation and evaluation of endophytic Streptomyces endus OsiSh-2 with potential application for biocontrol of rice blast disease. J. Sci. Food Agric. 2017, 97, 1149–1157. [Google Scholar] [CrossRef]
  12. Li, H.; Guan, Y.; Dong, Y.; Zhao, L.; Rong, S.; Chen, W.; Lv, M.; Xu, H.; Gao, X.; Chen, R.; et al. Isolation and evaluation of endophytic Bacillus tequilensis GYLH001 with potential application for biological control of Magnaporthe oryzae. PLoS ONE 2018, 13, e0203505. [Google Scholar] [CrossRef] [Green Version]
  13. Chen, W.-C.; Chiou, T.-Y.; Delgado, A.L.; Liao, C.-S. The control of rice blast disease by the novel biofungicide formulations. Sustainability 2019, 11, 3449. [Google Scholar] [CrossRef] [Green Version]
  14. Yadav, M.K.; Sharma, P. Biological control of rice blast disease with Trichoderma spp. under upland rice system. Oryza 2016, 53, 167–173. [Google Scholar]
  15. Soenens, A.; Imperial, J. Biocontrol capabilities of the genus Serratia. Phytochem. Rev. 2019, 19, 577–587. [Google Scholar] [CrossRef]
  16. Mahdi, I.; Hafidi, M.; Allaoui, A.; Biskri, L. Halotolerant endophytic bacterium Serratia rubidaea ED1 enhances phosphate solubilization and promotes seed germination. Agriculture 2021, 11, 224. [Google Scholar] [CrossRef]
  17. Vidhyasekaran, P.; Rabindran, R.; Muthamilan, M.; Nayar, K.; Rajappan, K.; Subramanian, N.; Vasumathi, K. Development of a powder formulation of Pseudomonas fluorescens for control of rice blast. Plant Pathol. 1997, 46, 291–297. [Google Scholar] [CrossRef]
  18. Chou, C.; Castilla, N.; Hadi, B.; Tanaka, T.; Chiba, S.; Sato, I. Rice blast management in Cambodian rice fields using Trichoderma harzianum and a resistant variety. Crop. Prot. 2020, 135, 104864. [Google Scholar] [CrossRef]
  19. Filippi, M.C.C.; da Silva, G.B.; Silva-Lobo, V.L.; Côrtes, M.V.C.B.; Moraes, A.J.G.; Prabhu, A.S. Leaf blast (Magnaporthe oryzae) suppression and growth promotion by rhizobacteria on aerobic rice in Brazil. Biol. Control 2011, 58, 160–166. [Google Scholar] [CrossRef] [Green Version]
  20. Ali, H.; Nadarajah, K. Evaluating the efficacy of Trichoderma spp and Bacillus substilis as biocontrol agents against Magnaporthe grisea in rice. AJCS 2014, 8, 1324–1335. [Google Scholar]
  21. Harman, G.E.; Doni, F.; Khadka, R.B.; Uphoff, N. Endophytic strains of Trichoderma increase plants’ photosynthetic capability. J. Appl. Microbiol. 2021, 130, 529–546. [Google Scholar] [CrossRef]
  22. Bae, H.; Sicher, R.C.; Kim, M.S.; Kim, S.-H.; Strem, M.D.; Melnick, R.L.; Bailey, B.A. The beneficial endophyte Trichoderma hamatum isolate DIS 219b promotes growth and delays the onset of the drought response in Theobroma cacao. J. Exp. Bot. 2009, 60, 3279–3295. [Google Scholar] [CrossRef]
  23. Scudeletti, D.; Crusciol, C.A.C.; Bossolani, J.W.; Moretti, L.G.; Momesso, L.; Servaz Tubaña, B.; de Castro, S.G.Q.; De Oliveira, E.F.; Hungria, M. Trichoderma asperellum inoculation as a tool for attenuating drought stress in sugarcane. Front. Plant. Sci. 2021, 12, 645542. [Google Scholar] [CrossRef]
  24. Guler, N.S.; Pehlivan, N.; Karaoglu, S.A.; Guzel, S.; Bozdeveci, A. Trichoderma atroviride ID20G inoculation ameliorates drought stress-induced damages by improving antioxidant defence in maize seedlings. Acta Physiol. Plant. 2016, 38. [Google Scholar] [CrossRef]
  25. Bai, Y.; Souleimanov, A.; Smith, D.L. An inducible activator produced by a Serratia proteamaculans strain and its soybean growth-promoting activity under greenhouse conditions. J. Exp. Bot. 2002, 53, 1495–1502. [Google Scholar] [CrossRef] [PubMed]
  26. Benjamini, Y.; Hochberg, Y. Controlling the false discovery rate: A practical and powerful approach to multiple testing. J. Roy. Stat. Soc. B 1995, 57, 289–300. [Google Scholar] [CrossRef]
  27. R Core Development Team. R: A Language and Environment for Statistical Computing; R Foundation for Statistical Computing: Vienna, Austria, 2019; Available online: https://www.R-project.org/ (accessed on 15 November 2021).
  28. Sesma, A.; Osbourn, A. The rice leaf blast pathogen undergoes developmental processes typical of root-infecting fungi. Nature 2004, 431, 582–586. [Google Scholar] [CrossRef] [PubMed]
  29. Koizumi, S.; Kato, H. Dynamic simulation of blast epidemics using a multiple canopy spore dispersal model. In Proceedings of the International Rice Research Conference on the Rice Blast Modeling and Forecasting, Suweon, Korea, 27–31 August 1990; International Rice Research Institute: Manila, Philippines, 1991; pp. 75–88. [Google Scholar]
  30. Rijal, S.; Devkota, Y. A review on various management method of rice blast disease. Malays. J. Sustain. Agric. 2020, 4, 29–33. [Google Scholar] [CrossRef]
Figure 1. Plot of correlation among measured rice plant and yield characters in the experiments conducted in 2020 and 2021 at one site in Kenya and three sites in Tanzania to evaluate the effects of applying several biopesticides as dipping at transplanting and/or post-transplanting foliar spraying to control rice blast.
Agronomy 12 00592 g001
Figure 2. Increase of tiller height and number over time following transplanting summarized across all 14 treatments in 2020 and 2021; 12 of the 14 treatments are four biopesticides applied as a dipping treatment at transplanting, weekly post-transplanting foliar sprays, and both at one site in Kenya. Two controls (water as negative, and fungicide as positive) were included for comparison.
Agronomy 12 00592 g002
Figure 3. Time (days) from transplanting to first flowering of rice plants that received one of the four biopesticides applied at different times (dipping at transplanting, foliar spraying post-transplanting, or at both times) at one site in 2020 and 2021 in Kenya. Two controls (water as negative, and fungicide as positive) were included for comparison. The bar represents one standard error.
Agronomy 12 00592 g003
Figure 4. Net grain yield (kg) per plot (size 5 × 5 m) where one of the four biopesticides was applied at different times (dipping at transplanting, foliar spraying post-transplanting, or at both times) at one site in 2020 and 2021 in Kenya. Two controls (water as negative, and fungicide as positive) were included for comparison. The bar represents one standard error.
Agronomy 12 00592 g004
Figure 5. Percent grain with blast symptoms of rice plants, receiving one of the four biopesticides applied at different times (dipping at transplanting, foliar spraying post-transplanting, or at both times) at one site in 2020 and 2021 in Kenya. Two controls (water as negative, and fungicide as positive) were included for comparison. The bar represents one standard error.
Agronomy 12 00592 g005
Figure 6. Average tiller number and height (cm) of rice plants that received one of the three products was applied at different times (dipping at transplanting, foliar spraying post-transplanting, or at both times) at three sites in 2020 and 2021 in Tanzania.
Agronomy 12 00592 g006
Figure 7. Time (days) to 30% flowering in each plot of rice plants that had received water or one of the two biopesticides at different times (dipping at transplanting, foliar spraying post-transplanting, or at both times) at three sites in 2020 and 2021 in Tanzania. The bar represents one standard error.
Agronomy 12 00592 g007
Figure 8. Net grain yield (kg) per plot (size 5 × 5 m) of rice plants that had received water or one of the two biopesticides at different times (dipping at transplanting, foliar spraying post-transplanting, or at both times) at three sites in 2020 and 2021 in Tanzania. The bar represents one standard error.
Agronomy 12 00592 g008
Figure 9. Percent grain with blast symptom in each plot of rice plants that received water or one of the two biopesticides at different times (dipping at transplanting, foliar spraying post-transplanting, or at both times) at three sites in 2020 and 2021 in Tanzania. The bar represents one standard error.
Agronomy 12 00592 g009
Table 1. Treatment means and standard errors; rice plants were treated with four biopesticide products in three different ways to manage rice blast. The experiment was carried out at one site in Kenya in 2020 and 2021; each mean is an average of eight independent replicates (plots).
TreatmentDays to First FloweringTiller on the Final Assessment DateYield (kg)Seeds per Panicle1000 Seed Weight (g)Seed Moisture (%)Seeds with Blast (%)
NumberHeight (cm)GrossNetRatio (%)
Bacillus: Both67.3 ± 1.9734.8 ± 1.53123.5 ± 1.9737.1 ± 2.429.5 ± 0.3826.0 ± 1.33106.5 ± 2.3121.5 ± 0.5313.7 ± 0.543.0 ± 0.72
Bacillus: Dipping73.3 ± 1.4132.2 ± 1.46120.8 ± 2.8235.9 ± 2.258.7 ± 0.5124.4 ± 0.8795.5 ± 3.4521.4 ± 0.3213.7 ± 0.383.7 ± 0.88
Bacillus: Spraying72.4 ± 1.8934.3 ± 0.85127.2 ± 2.1235.8 ± 2.669.0 ± 0.4725.7 ± 1.32104.0 ± 1.4021.3 ± 0.5113.9 ± 0.433.1 ± 0.63
Trichoderma: Both68.6 ± 2.1832.0 ± 2.11123.1 ± 2.2936.9 ± 2.288.9 ± 0.5124.1 ± 0.62100.6 ± 2.9121.1 ± 0.4413.3 ± 0.363.9 ± 1.07
Trichoderma: Dipping69.8 ± 2.6433.9 ± 2.01125.1 ± 2.4338.0 ± 1.949.0 ± 0.4723.8 ± 0.8097.7 ± 2.9020.9 ± 0.3813.7 ± 0.353.9 ± 1.10
Trichoderma: Spraying68.0 ± 2.3434.7 ± 2.01124.9 ± 2.6736.4 ± 2.568.4 ± 0.3223.7 ± 1.42102.2 ± 2.0421.4 ± 0.3213.0 ± 0.303.7 ± 1.04
Serratia: Both71.0 ± 1.835.1 ± 1.17123.8 ± 1.9635.9 ± 2.559.8 ± 0.2428.1 ± 1.56107.0 ± 3.1321.3 ± 0.4714.1 ± 0.263.2 ± 0.74
Serratia: Dipping68.6 ± 1.6132.8 ± 1.46123.0 ± 2.8635.1 ± 3.029.7 ± 0.3428.9 ± 2.59101.2 ± 2.0720.7 ± 0.5213.0 ± 0.313.4 ± 0.89
Serratia: Spraying71.5 ± 2.3134.2 ± 1.37125.3 ± 1.6637.6 ± 2.669.3 ± 0.4225.4 ± 1.70104.0 ± 2.3021.7 ± 0.2713.5 ± 0.353.4 ± 0.90
Bacillus + Trichoderma: Both68.3 ± 2.134.4 ± 2.35123.4 ± 2.3535.8 ± 2.438.9 ± 0.4725.2 ± 0.80101.7 ± 3.3821.1 ± 0.3813.6 ± 0.443.6 ± 0.88
Bacillus + Trichoderma: Dipping68.5 ± 2.1833.0 ± 1.81125.4 ± 2.6936.4 ± 2.398.4 ± 0.4223.7 ± 1.6999.9 ± 4.1521.2 ± 0.3713.0 ± 0.353.9 ± 1.09
Bacillus + Trichoderma: Spraying69.8 ± 2.6433.9 ± 2.22122.8 ± 2.4936.1 ± 2.719.1 ± 0.4525.9 ± 1.71101.6 ± 4.4520.8 ± 0.6913.6 ± 0.213.5 ± 0.86
Water72.8 ± 0.9430.0 ± 1.56123.8 ± 2.2535.8 ± 2.518.1 ± 0.6022.8 ± 1.2686.9 ± 5.4521.7 ± 0.2113.9 ± 0.356.0 ± 0.88
Fungicide70.1 ± 2.1333.6 ± 2.05122.3 ± 2.9738.4 ± 3.309.6 ± 0.7125.4 ± 1.47101.4 ± 2.9821.2 ± 0.5114.0 ± 0.652.2 ± 0.56
Table 2. Significant pairwise comparisons for all 14 treatments applied to rice plants at one trial site in Kenya across 2020 and 2021, based on the Tukey HSD test, with the p-value adjusted for multiple comparisons [26]. The 14 treatments included four biopesticides, each applied as dipping at transplanting, post-transplanting foliar spraying, or both, and two controls (water and fungicide).
Treatment 1Treatment 2DifferencesAdjust p-Value
Tiller number on the final assessment date
WaterBacillus: Both−4.80.017
WaterBacillus + Trichoderma: Both−4.40.045
WaterTrichoderma: Spraying−4.70.022
WaterSerratia: Both−5.10.008
Number of seeds per panicle (on the natural logarithm scale)
WaterBacillus: Both−0.218<0.001
WaterBacillus: Spraying−0.1940.001
WaterTrichoderma: Both−0.1580.022
WaterTrichoderma: Spraying−0.1760.006
WaterSerratia: Both−0.220<0.001
WaterSerratia: Dipping−0.1660.013
WaterSerratia: Spraying−0.1930.001
WaterBacillus + Trichoderma: Both−0.1690.010
WaterBacillus + Trichoderma: Dipping−0.1490.044
WaterBacillus + Trichoderma: Spraying−0.1640.014
WaterFungicide−0.1660.012
Net yield (kg, on the natural logarithm scale)
Serratia: BothTrichoderma: Spraying0.1600.026
Bacillus + Trichoderma: DippingSerratia: Both−0.1590.028
WaterBacillus: Both−0.1720.011
WaterSerratia: Both−0.212<0.001
WaterSerratia: Dipping−0.1920.002
WaterSerratia: Spraying−0.1540.039
WaterFungicide−0.1700.012
Flowering time (days, on the natural logarithm scale)
Bacillus: DippingBacillus: Both0.0870.023
WaterBacillus: Both0.0810.049
Incidence of grain with blast symptoms (on the logit scale)
WaterBacillus: Both1.176<0.001
WaterBacillus: Dipping0.916<0.001
WaterBacillus: Spraying1.131<0.001
WaterTrichoderma: Both0.874<0.001
WaterTrichoderma: Dipping0.895<0.001
WaterTrichoderma: Spraying0.932<0.001
WaterSerratia: Both1.112<0.001
WaterSerratia: Dipping1.051<0.001
WaterSerratia: Spraying1.071<0.001
WaterBacillus + Trichoderma: Both0.951<0.001
WaterBacillus + Trichoderma: Dipping0.895<0.001
WaterBacillus + Trichoderma: Spraying0.989<0.001
WaterFungicide1.525<0.001
FungicideBacillus: Dipping−0.608<0.001
FungicideTrichoderma: Both−0.651<0.001
FungicideTrichoderma: Dipping−0.629<0.001
FungicideTrichoderma: Spraying−0.593<0.001
FungicideSerratia: Both−0.4130.040
FungicideSerratia: Dipping−0.4740.008
FungicideSerratia: Spraying−0.4540.013
FungicideBacillus + Trichoderma: Both−0.574<0.001
FungicideBacillus + Trichoderma: Dipping−0.630<0.001
FungicideBacillus + Trichoderma: Spraying−0.5350.001
Table 3. Treatment means and standard errors; rice plants were treated with formulated B. subtilis and T. asperellum strains in addition to water (as a control) in three different ways to manage rice blast. The experiment was carried out at three sites in Tanzania in 2020 and 2021; each mean is an average of 18 independent replicates.
ApplicationProductTillerDays toGrain with BlastYield (kg)
NumberHeight (cm)30% FloweringMaturityPercentSeeds/HeadGrossNet
BothBacillus24.3 ± 0.5246.8 ± 1.1755.6 ± 2.0089.4 ± 2.018.0 ± 0.66126.3 ± 2.868.3 ± 0.414.1 ± 0.28
BothTrichoderma26.7 ± 0.5148.9 ± 1.1152.2 ± 1.7485.0 ± 1.756.4 ± 0.83130.3 ± 3.328.6 ± 0.284.8 ± 0.38
BothWater14.7 ± 0.3733.3 ± 1.4573.9 ± 2.14101.6 ± 2.1322.5 ± 2.16113.0 ± 4.595.5 ± 0.331.8 ± 0.12
DippingBacillus19.2 ± 0.7242.1 ± 0.8059.4 ± 1.8893.0 ± 2.1611.0 ± 1.02118.9 ± 4.616.8 ± 0.353.0 ± 0.19
DippingTrichoderma24.2 ± 0.7244.0 ± 0.9661.1 ± 1.9493.3 ± 2.2710.2 ± 0.80127.3 ± 2.777.6 ± 0.323.4 ± 0.20
DippingWater15.4 ± 0.6632.4 ± 1.2474.4 ± 1.76100.9 ± 1.8922.4 ± 1.99113.4 ± 5.375.6 ± 0.431.8 ± 0.12
SprayingBacillus18.2 ± 0.7239.3 ± 1.2663.4 ± 1.4095.5 ± 2.0915.4 ± 1.58118.3 ± 5.196.9 ± 0.422.9 ± 0.14
SprayingTrichoderma20.0 ± 0.6344.7 ± 1.3461.9 ± 2.4992.4 ± 1.9213.6 ± 1.46121.9 ± 4.216.9 ± 0.413.1 ± 0.29
SprayingWater15.4 ± 0.5233.8 ± 1.3974.7 ± 1.86101.6 ± 2.0022.8 ± 2.25112.6 ± 4.725.4 ± 0.341.8 ± 0.11
Publisher’s Note: MDPI stays neutral with regard to jurisdictional claims in published maps and institutional affiliations.

