
An Air Convection Wall with a Hollow Structure in Chinese Solar Greenhouses: Thermal Performance and Effects on Microclimate

 ,
,  ,
,
Abstract
:1. Introduction
2. Materials and Methods
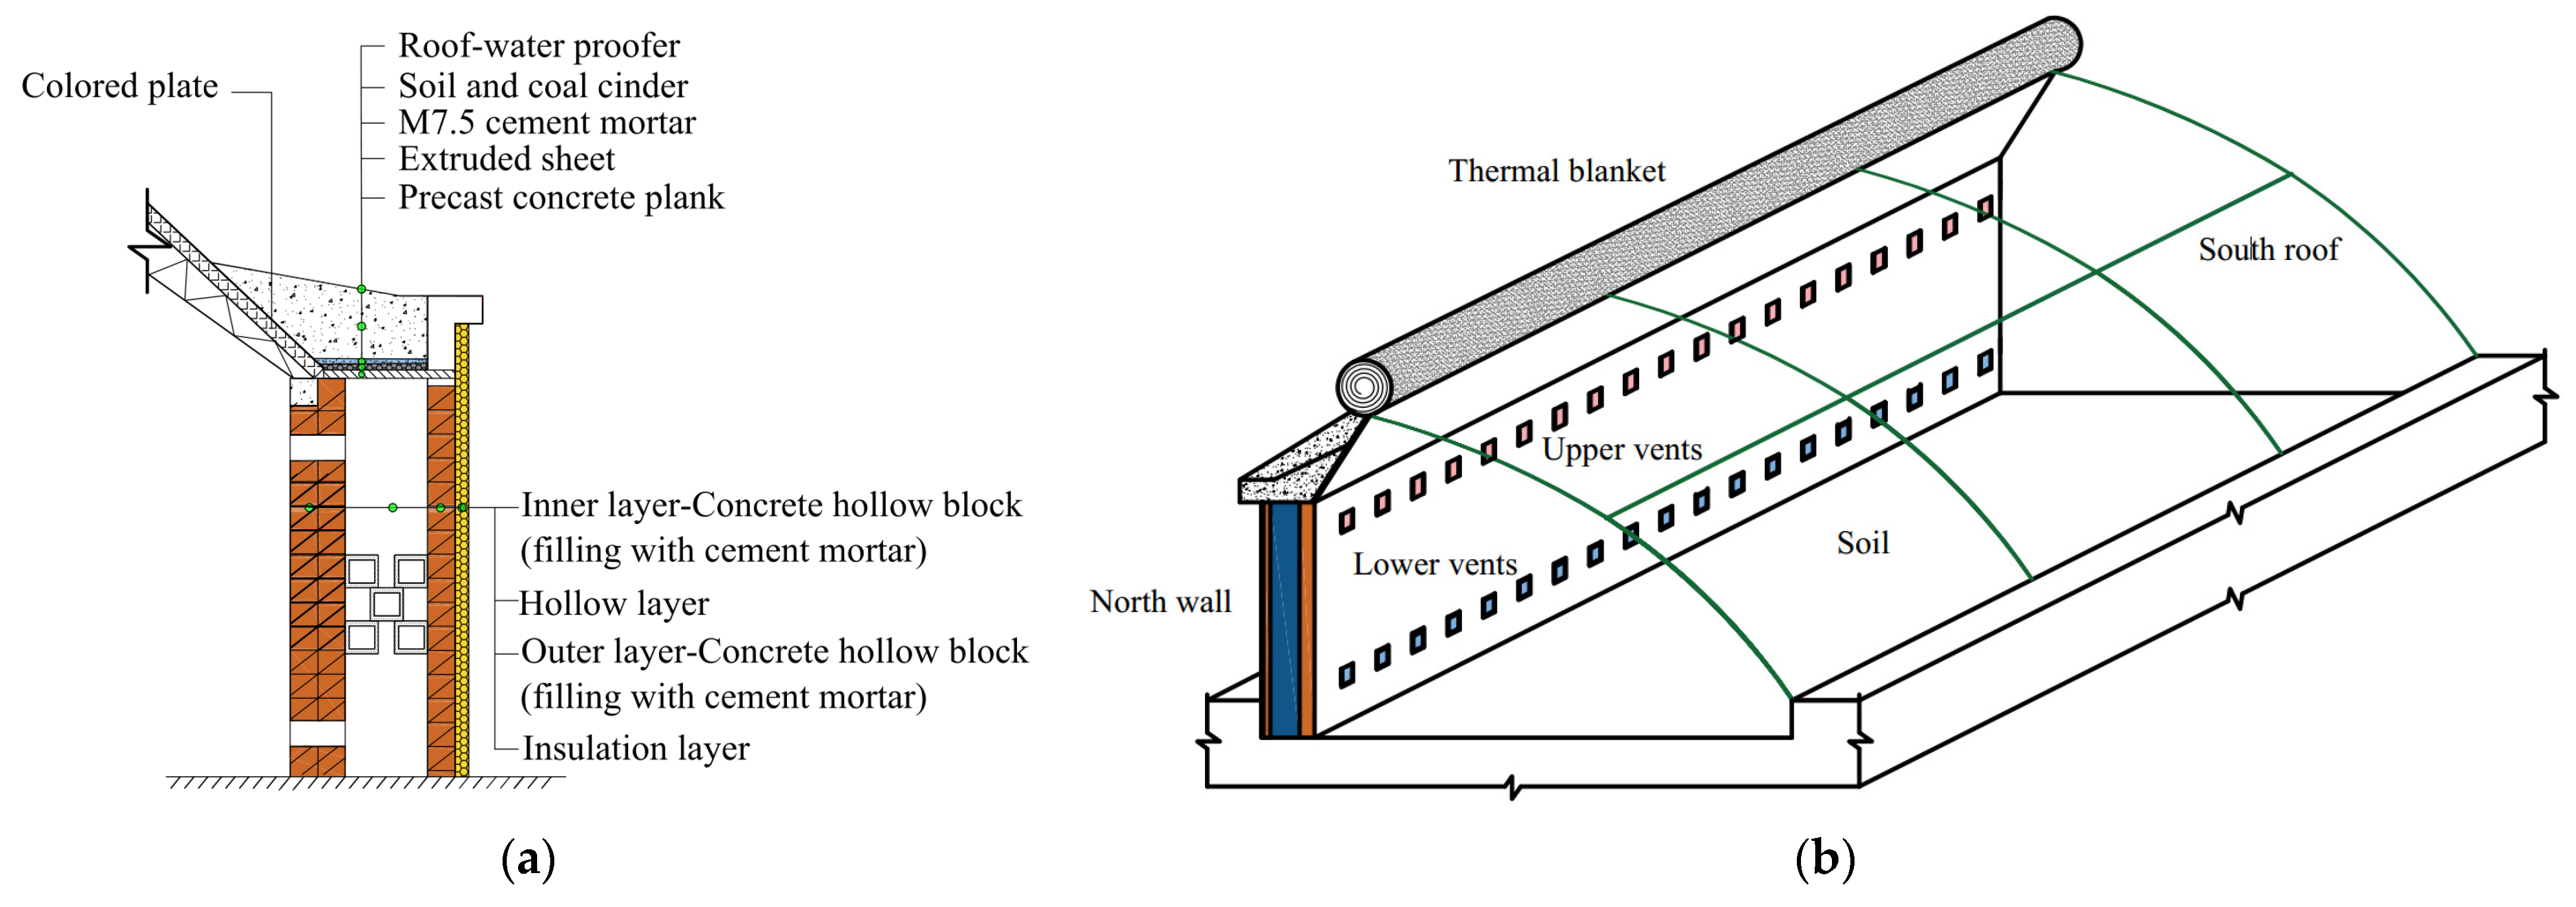
2.1. Air Convection Heat Storage North Wall Design Criteria and Air Convection Mechanism
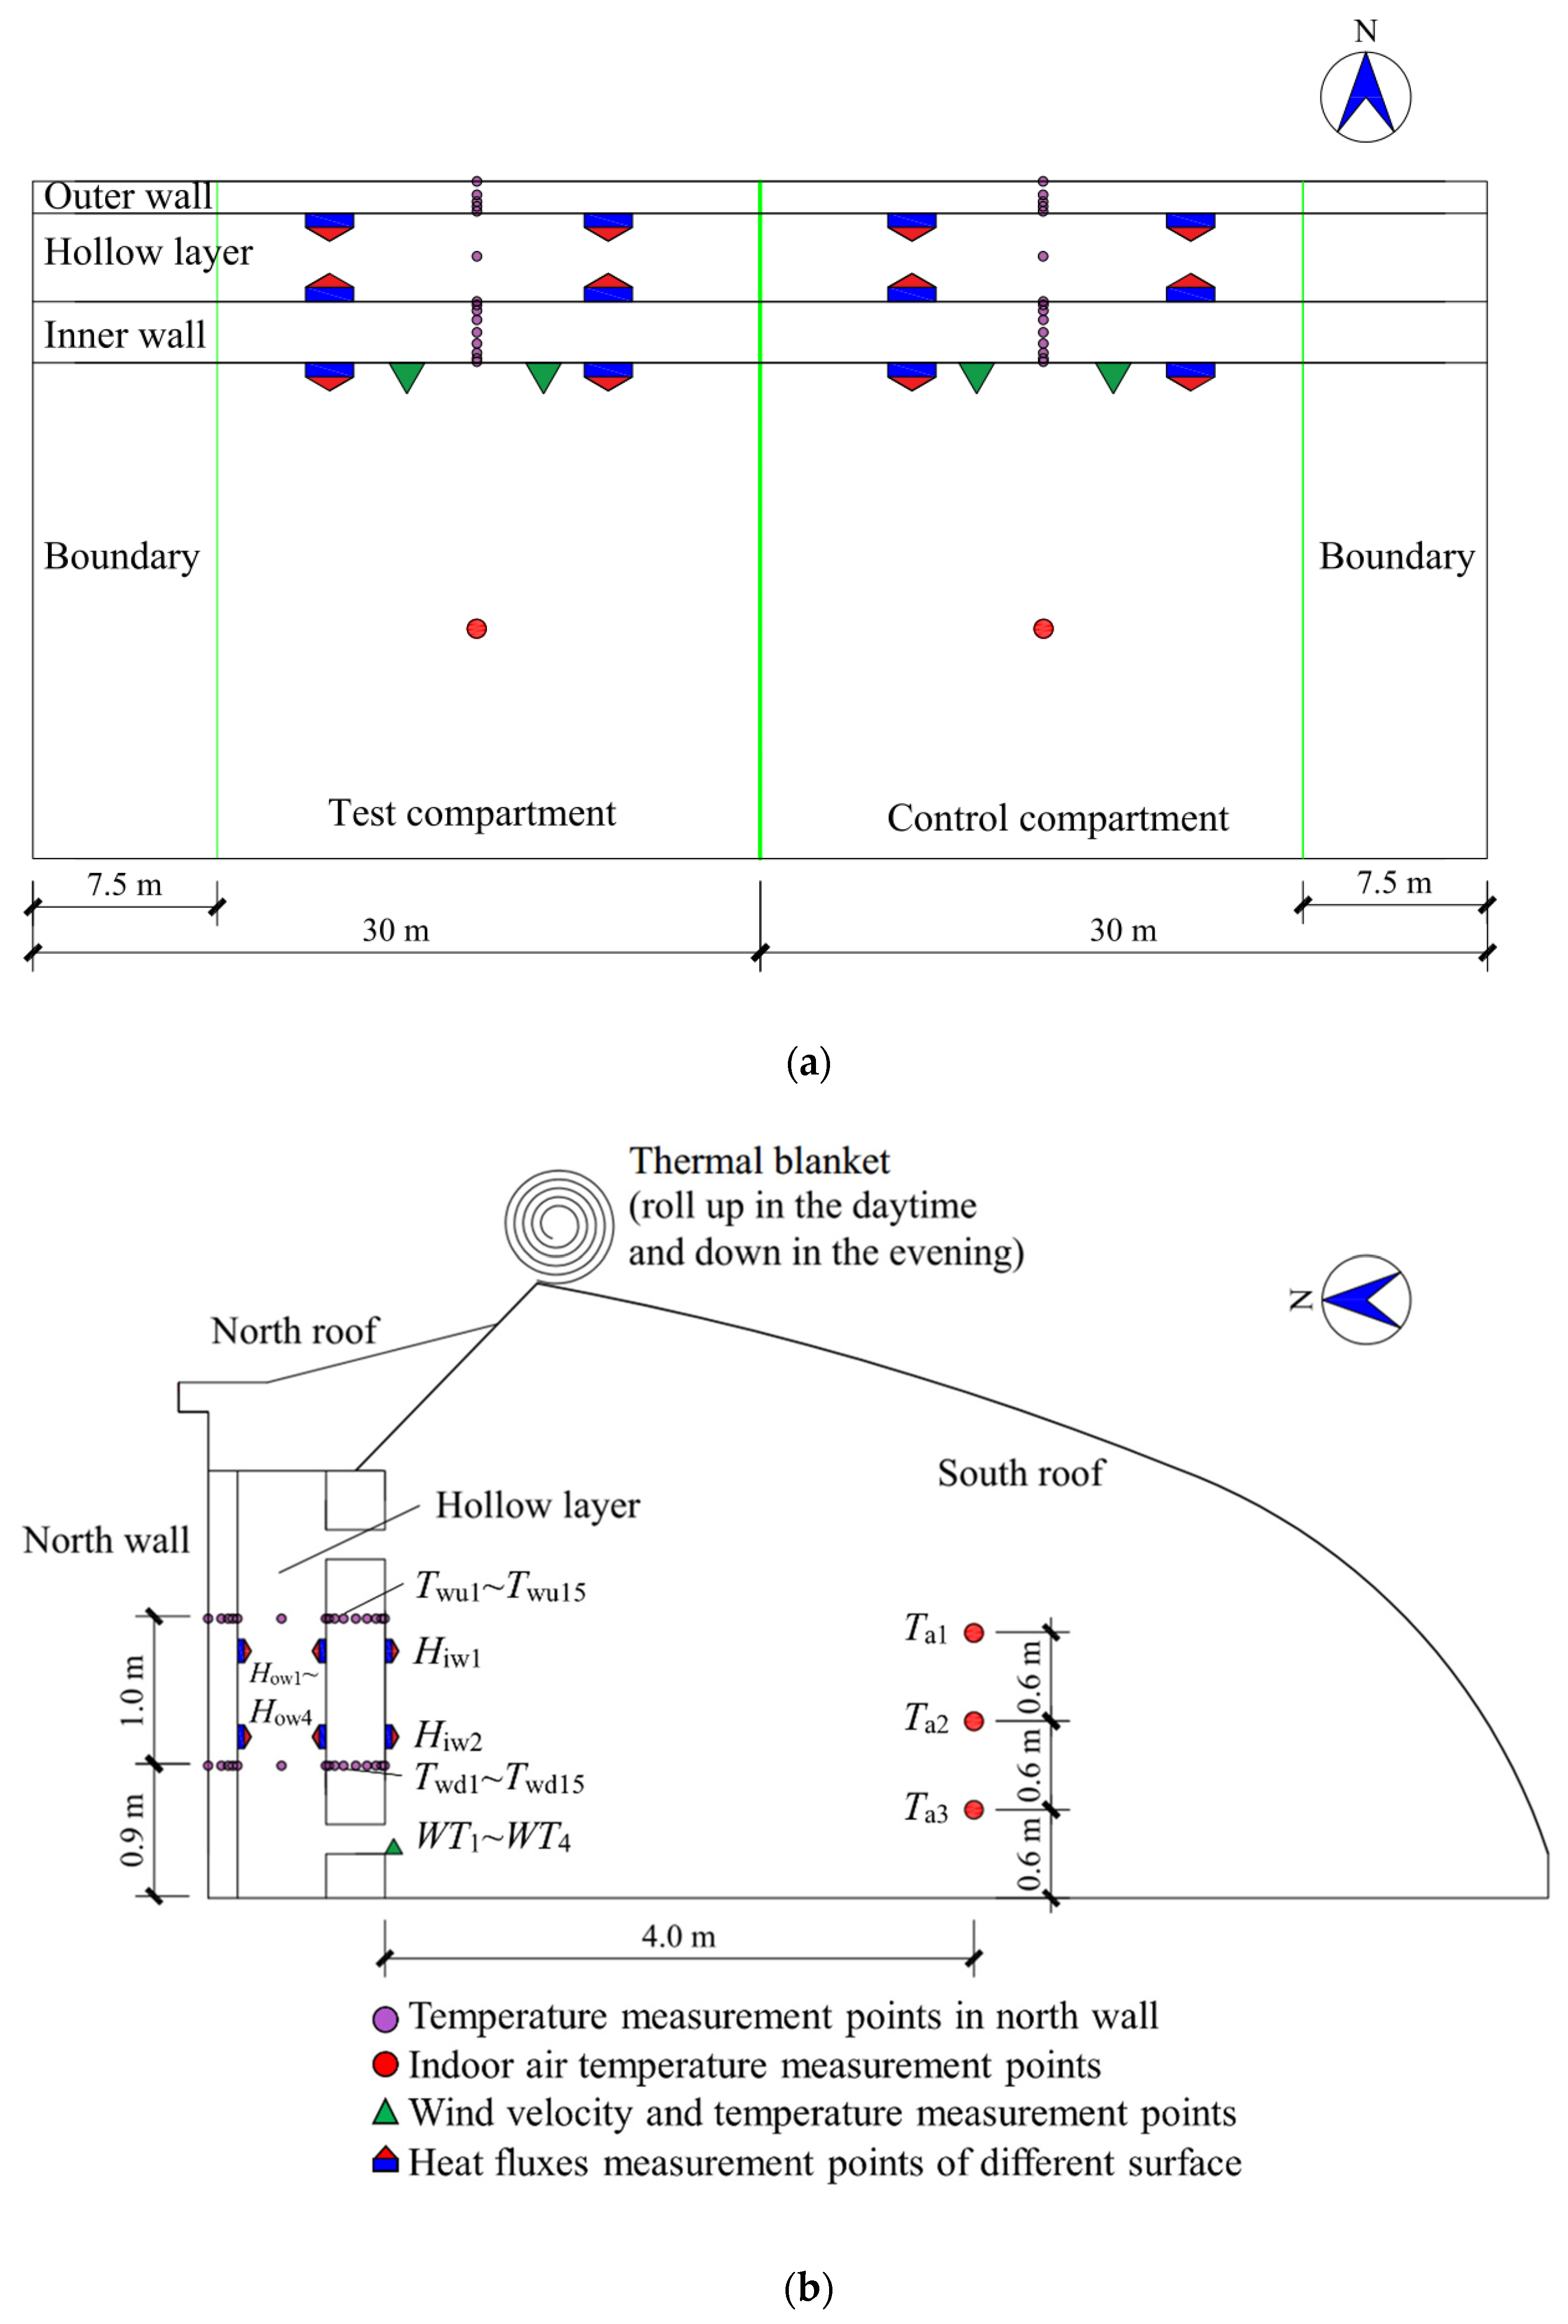
2.2. Experiment Setup
2.3. Experiment Design
2.4. Data Collection
2.5. Heating Performance Analysis
2.5.1. Temperature Enhancement of Wall Interior and Air
2.5.2. Theoretical Calculation of Air Convection
2.5.3. Heat Transfer Efficiency and Accumulation
2.5.4. Dehumidification Potential
2.5.5. Coefficient of Performances (COP) for Air Convection Wall with Forced Convection
3. Results and Discussion
3.1. Indoor Temperature Changes under Different Conditions
3.2. Temperature Distribution along the Depth of the Wall
3.3. Heat Flux on Different Surfaces of the North Wall
3.4. Air Convection under Different Strategies
3.5. Heat Transfer Capacity of the Air Convection in the Hollow Layer
3.6. Dehumidification Potential of Hollow Layer
3.7. Accumulated Heat and COP
4. Conclusions
- (1)
- The design of air convection north wall with a hollow layer improves the indoor thermal environment at night. The differences between indoor and outdoor air temperatures of NCW and NW at night were 17.3 °C and 16.0 °C, respectively, and the differences of the NCW and FCW at night were 17.2 °C and 18.2 °C, respectively. The north wall keeps the CSG well above 5 °C despite outdoor temperatures of −16.3 °C during the night.
- (2)
- The circulating air flow significantly improves the internal temperature distribution in the north wall, indicating more wall materials participate in the heat storage and heat release process.
- (3)
- Air circulated through the hollow wall contributes significantly to the heat exchange between north wall and CSG. When generated by natural convection heat storage and release accounted for 16–23% and 25–28%, while the heat storage and release generated via forced convection accounted for 34–38% and 28–34%.
- (4)
- Given the additional heating power provided by the hollow layer of the north wall during the night (on average 1.2 kW by natural convection and 5.3 kW by forced convection), the north wall plays an important role in maintaining a favorable temperature inside a CSG.
- (5)
- The COP of the active solar heating system (a hollow layer with the fans) ranged from 1.9 to 3.4. Although the COP is relatively efficient, the circulating airflow only provides no more than 20 °C of hot air at night, far less than other heat pump systems, while the benefit is the low energy consumption.
- (6)
- Compared with natural convection, forced convection has advantages in airflow controllability, heat exchange efficiency and heat accumulation. However, natural convection has a strong heat transfer capacity at noon. Therefore, the combination of the two convection strategies can get a good effect.
- (7)
- This study was performed in a crop-less CSG, and the thermal and water-vapor transfers were different from a CSG with crops inside. Therefore, it is necessary to carry out the next experiment to explore the moisture and heat balance in the CSG under the influence of crops and fully evaluate the impacts of the north wall on the comfort of the indoor environment.
Author Contributions
Funding
Institutional Review Board Statement
Informed Consent Statement
Data Availability Statement
Conflicts of Interest
References
- Cao, K.; Xu, H.; Zhang, R.; Xu, D.; Yan, L.; Sun, Y.; Xia, L.; Zhao, J.; Zou, Z.; Bao, E. Renewable and sustainable strategies for improving the thermal environment of Chinese solar greenhouses. Energy Build. 2019, 202, 109414. [Google Scholar] [CrossRef]
- Kendirli, B. Structural analysis of greenhouses: A case study in Turkey. Build. Environ. 2006, 41, 864–871. [Google Scholar] [CrossRef]
- Panwar, N.L.; Kaushik, S.C.; Kothari, S. Solar greenhouse an option for renewable and sustainable farming. Renew. Sustain. Energy Rev. 2011, 15, 3934–3945. [Google Scholar] [CrossRef]
- Gao, L.H.; Qu, M.; Ren, H.Z.; Sui, X.L.; Chen, Q.Y.; Zhang, Z.X. Structure, function, application, and ecological benefit of a single-slope, energy-efficient solar greenhouse in China. Horttechnology 2010, 20, 626–631. [Google Scholar] [CrossRef] [Green Version]
- Li, A.; Huang, L.; Zhang, T. Field test and analysis of microclimate in naturally ventilated single-sloped greenhouses. Energy Build. 2017, 138, 479–489. [Google Scholar] [CrossRef]
- Tong, G.; Christopher, D.M.; Li, T.; Wang, T. Passive solar energy utilization: A review of cross-section building parameter selection for Chinese solar greenhouses. Renew. Sustain. Energy Rev. 2013, 26, 540–548. [Google Scholar] [CrossRef]
- Ghasemi Mobtaker, H.; Ajabshirchi, Y.; Ranjbar, S.F.; Matloobi, M. Solar energy conservation in greenhouse: Thermal analysis and experimental validation. Renew. Energy 2016, 96, 509–519. [Google Scholar] [CrossRef]
- Beshada, E.; Zhang, Q.; Boris, R. Winter performance of a solar energy greenhouse in southern Manitoba. Can. Biosyst. Eng./Le Genie Des. Biosyst. Can. 2006, 48, 1–8. [Google Scholar]
- Liu, X.; Wu, X.; Xia, T.; Fan, Z.; Shi, W.; Li, Y.; Li, T. New insights of designing thermal insulation and heat storage of Chinese solar greenhouse in high latitudes and cold regions. Energy 2022, 242, 122953. [Google Scholar] [CrossRef]
- Liu, H.; Yin, C.; Hu, X.; Tanny, J.; Tang, X. Microclimate characteristics and evapotranspiration estimates of cucumber plants in a newly developed sunken solar greenhouse. Water 2020, 12, 2275. [Google Scholar] [CrossRef]
- Hou, Y.; Li, A.; Li, Y.; Jin, D.; Tian, Y.; Zhang, D.; Wu, D.; Zhang, L.; Lei, W. Analysis of microclimate characteristics in solar greenhouses under natural ventilation. Build. Simul. 2021, 14, 1811–1821. [Google Scholar] [CrossRef]
- Akrami, M.; Salah, A.H.; Javadi, A.A.; Fath, H.E.S.; Hassanein, M.J.; Farmani, R.; Dibaj, M.; Negm, A. Towards a sustainable greenhouse: Review of trends and emerging practices in analysing greenhouse ventilation requirements to sustain maximum agricultural yield. Sustainability 2020, 12, 2794. [Google Scholar] [CrossRef] [Green Version]
- Iddio, E.; Wang, L.; Thomas, Y.; McMorrow, G.; Denzer, A. Energy efficient operation and modeling for greenhouses: A literature review. Renew. Sustain. Energy Rev. 2020, 117, 109480. [Google Scholar] [CrossRef]
- Chen, W.; Liu, W. Numerical and experimental analysis of convection heat transfer in passive solar heating room with greenhouse and heat storage. Sol. Energy 2004, 76, 623–633. [Google Scholar] [CrossRef]
- Zhang, L.; Xu, P.; Mao, J.; Tang, X.; Li, Z.; Shi, J. A low cost seasonal solar soil heat storage system for greenhouse heating: Design and pilot study. Appl. Energy 2015, 156, 213–222. [Google Scholar] [CrossRef]
- Sethi, V.P.; Sumathy, K.; Lee, C.; Pal, D.S. Thermal modeling aspects of solar greenhouse microclimate control: A review on heating technologies. Sol. Energy 2013, 96, 56–82. [Google Scholar] [CrossRef]
- Qing-yun, C. Progress of practice and theory in sunlight greenhouse. J. Shanghai Jiaotong Univ. (Agric. Sci.) 2008, 5, 343–350. [Google Scholar]
- Bastien, D.; Athienitis, A.K. Passive thermal energy storage, part 1: Design concepts and metrics. Renew. Energy 2018, 115, 1319–1327. [Google Scholar] [CrossRef]
- Wang, J.; Li, S.; Guo, S.; Ma, C.; Wang, J.; Sun, J. Analysis of heat transfer properties of hollow block wall filled by different materials in solar greenhouse. Eng. Agric. Environ. Food 2017, 10, 31–38. [Google Scholar] [CrossRef]
- Zhang, G.; Shi, Y.; Liu, H.; Fei, Z.; Liu, X.; Wei, M.; Liu, F.; Wang, S. Heat transfer performance of an assembled multilayer wall in a Chinese solar greenhouse considering humidity. J. Energy Storage 2021, 33, 102046. [Google Scholar] [CrossRef]
- Ren, J.; Zhao, Z.; Zhang, J.; Wang, J.; Guo, S.; Sun, J. Study on the hygrothermal properties of a Chinese solar greenhouse with a straw block north wall. Energy Build. 2019, 193, 127–138. [Google Scholar] [CrossRef]
- Zhang, X.; Lv, J.; Dawuda, M.M.; Xie, J.; Yu, J.; Gan, Y.; Zhang, J.; Tang, Z.; Li, J. Innovative passive heat-storage walls improve thermal performance and energy efficiency in Chinese solar greenhouses for non-arable lands. Sol. Energy 2019, 190, 561–575. [Google Scholar] [CrossRef]
- Berroug, F.; Lakhal, E.K.; El Omari, M.; Faraji, M.; El Qarnia, H. Thermal performance of a greenhouse with a phase change material north wall. Energy Build. 2011, 43, 3027–3035. [Google Scholar] [CrossRef]
- Boulard, T.; Razafinjohany, E.; Baille, A.; Jaffrin, A.; Fabre, B. Performance of a greenhouse heating system with a phase change material. Agric. For. Meteorol. 1990, 52, 303–318. [Google Scholar] [CrossRef]
- Wang, H.; Li, X.; Zou, Z. Application of brick wall with phase change rice husk in solar greenhouse. Trans. Chin. Soc. Agric. Eng. 2011, 27, 253–257. [Google Scholar]
- Guan, Y.; Chen, C.; Li, Z.; Han, Y.; Ling, H. Improving thermal environment in solar greenhouse with phase-change thermal storage wall. Trans. Chin. Soc. Agric. Eng. 2012, 28, 194–201. [Google Scholar]
- Guan, Y.; Chen, C.; Ling, H.; Han, Y.; Yan, Q. Analysis of heat transfer properties of three-layer wall with phase-change heat storage in solar greenhouse. Trans. Chin. Soc. Agric. Eng. 2013, 29, 166–173. [Google Scholar]
- Li, Y.; Yue, X.; Zhao, L.; Xu, H.; Liu, X.; Li, T. Effect of north wall internal surface structure on heat storage-release performance and thermal environment of Chinese solar greenhouse. J. Build. Phys. 2021, 45, 507–527. [Google Scholar] [CrossRef]
- Yang, J.; Zou, Z.; Zhang, Z.; Wang, Y.; Zhang, Z.; Yan, F. Optimization of earth wall thickness and thermal insulation property of solar greenhouse in Northwest China. Trans. Chin. Soc. Agric. Eng. 2009, 25, 180–185. [Google Scholar]
- Peng, D.; Zhang, Y.; Fang, H.; Yang, Q.; Wei, L. MATLAB simulation of one-dimensional heat transfer and heat flux analysis of north wall in Chinese solar greenhouse. J. China Agric. Univ. 2014, 19, 174–179. [Google Scholar]
- Zhao, S.; Zhuang, Y.; Zheng, K.; Ma, C.; Cheng, J.; Ma, C.; Chen, X.; Zhang, T. Thermal performance experiment on air convection heat storage wall with cavity in Chinese solar greenhouse. Trans. Chin. Soc. Agric. Eng. 2018, 34, 223–231. [Google Scholar]
- Xu, W.; Song, W.; Ma, C. Performance of a water-circulating solar heat collection and release system for greenhouse heating using an indoor collector constructed of hollow polycarbonate sheets. J. Clean. Prod. 2020, 253, 119918. [Google Scholar] [CrossRef]
- Sun, Y. Concise Ventilation Design Manual; China Architecture Building Press: Beijing, China, 1997. [Google Scholar]
- Ma, C. Agricultural Bioenvironmental Engineering; China Architecture Building Press: Beijing, China, 2006. [Google Scholar]
- Yang, S.; Tao, W. Heat Transfer, 4th ed.; China Higher Education Press: Beijing, China, 2006. [Google Scholar]
- Lu, W.; Zhang, Y.; Fang, H.; Ke, X.; Yang, Q. Modelling and experimental verification of the thermal performance of an active solar heat storage-release system in a Chinese solar greenhouse. Biosyst. Eng. 2017, 160, 12–24. [Google Scholar] [CrossRef]
- Xiaodan, Z.; Jianming, X.; Jihua, Y.; Jian, L. Simulation analysis of thermal properties of air enclosure covered with aluminum foil in wall of solar greenhouse. Trans. Chin. Soc. Agric. Eng. 2017, 2, 227–233. [Google Scholar]
- Ming, L.; Han, L.; Weitang, S. Application of active heat system developed with capillary tube mates in Chinese solar greenhouse. Trans. Chin. Soc. Agric. Mach. 2019, 50, 341–349. [Google Scholar]
- Ke, X.; Yang, Q.; Zhang, Y.; Fang, H.; He, Y.; Zhang, C. Warming effect comparison between substrate warming system and air warming system by active heat storage-release in Chinese solar greenhouse. Trans. Chin. Soc. Agric. Eng. 2017, 33, 224–232. [Google Scholar]
- Fang, H.; Yang, Q.; Zhang, Y.; Sun, W.; Lu, W.; Liang, H. Performance of a solar heat collection and release system for improving night temperature in a Chinese solar greenhouse. Appl. Eng. Agric. 2015, 31, 283–289. [Google Scholar]
- Chai, L.; Ma, C.; Ni, J.-Q. Performance evaluation of ground source heat pump system for greenhouse heating in northern China. Biosyst. Eng. 2012, 111, 107–117. [Google Scholar] [CrossRef]
- Sun, W.; Guo, W.; Xu, F.; Wang, L.; Xue, X.; Li, Y.; Chen, Y. Application effect of surplus air heat pump heating system in Chinese solar greenhouse. Trans. Chin. Soc. Agric. Eng. 2015, 31, 235–243. [Google Scholar]


| Comparative Experiments | Experimental CSG | Period | ||
|---|---|---|---|---|
| Test Area (Western Half) | Control Area (Eastern Half) | Boundaries | ||
| S1 | Wall with natural internal convection (NCW) | Wall with blocked internal convection (NW) | 7.5 m from the eastern and western sidewalls | From 20 December 2017 to 23 January 2018 |
| S2 | Wall with forced internal convection (FCW) | Wall with natural internal convection (NCW) | From 26 January 2018 to 6 March 2018 | |
Publisher’s Note: MDPI stays neutral with regard to jurisdictional claims in published maps and institutional affiliations. |
© 2022 by the authors. Licensee MDPI, Basel, Switzerland. This article is an open access article distributed under the terms and conditions of the Creative Commons Attribution (CC BY) license (https://creativecommons.org/licenses/by/4.0/).
Share and Cite
Zhuang, Y.; Zhao, S.; Cheng, J.; Wang, P.; Lu, N.; Ma, C.; Xing, W.; Zheng, K. An Air Convection Wall with a Hollow Structure in Chinese Solar Greenhouses: Thermal Performance and Effects on Microclimate. Agronomy 2022, 12, 520. https://doi.org/10.3390/agronomy12020520
Zhuang Y, Zhao S, Cheng J, Wang P, Lu N, Ma C, Xing W, Zheng K. An Air Convection Wall with a Hollow Structure in Chinese Solar Greenhouses: Thermal Performance and Effects on Microclimate. Agronomy. 2022; 12(2):520. https://doi.org/10.3390/agronomy12020520
Chicago/Turabian StyleZhuang, Yunfei, Shumei Zhao, Jieyu Cheng, Pingzhi Wang, Na Lu, Chengwei Ma, Wenxin Xing, and Kexin Zheng. 2022. "An Air Convection Wall with a Hollow Structure in Chinese Solar Greenhouses: Thermal Performance and Effects on Microclimate" Agronomy 12, no. 2: 520. https://doi.org/10.3390/agronomy12020520
APA StyleZhuang, Y., Zhao, S., Cheng, J., Wang, P., Lu, N., Ma, C., Xing, W., & Zheng, K. (2022). An Air Convection Wall with a Hollow Structure in Chinese Solar Greenhouses: Thermal Performance and Effects on Microclimate. Agronomy, 12(2), 520. https://doi.org/10.3390/agronomy12020520