Abstract
Summer legume cover crops (CC) such as Crotalaria juncea, Crotalaria spectabilis, Crotalaria ochroleuca, and Cajanus cajan could offer diverse advantages for the environment and productive cropping systems. A low transpiration efficiency (TE) of CC can induce soil water content to levels that present a challenge for the subsequent crop. In a 75-day growth chamber experiment, using the natural abundance of 13C, 18O, and 15N we evaluated the TE and BNF under two soil water conditions. Our results showed that the four species tested are good candidates for their use as CC because they showed good results in terms of productivity parameters, TE, and BFN. Cajanus cajan had the highest TE, a high shoot dry matter production, and accumulated more N from BFN in the shoot than C. spectabilis, C. juncea, and C. ochroleuca. ∆18O increased under moderate water deficit and showed an inversely proportional relationship with the amount of transpired water, supporting the use of this isotopic indicator as a proxy for transpiration and stomatal conductance. For the isotopic parameters no interaction between the factors water regimen and species were found. We propose the mass ratio of nitrogen fixed by the volume of transpired water and the isotopic discrimination of 13C as useful indicators of drought fixing legumes tolerance.
1. Introduction
The annual summer legumes Crotalaria juncea, C. spectabilis, C. ochroleuca, and Cajanus cajan, are species that are characterized by their high biomass production and ability for biological nitrogen fixation (BNF) [1,2,3]. Due to these characteristics, they are commonly used as cover crops (CC) in cropping agriculture rotations in tropical and temperate zones [4,5]. Cover crops could protect the soil surface temporarily or permanently between two commercial crops [6], and their use is a strategy to improve soil quality and reduce nutrient losses, including water shortages. In the context of drought, a species’ ability to accumulate dry matter (DM) production and N must be balanced with its water consumption [7].
Transpiration efficiency (TE) also called water-use efficiency (WUE) is defined as the amount of DM produced by water transpired [8] and can be determined on different scales of time (instantaneous or time-integrated measurements) and space (at leaf, shoot or whole plant level). The selection of species based on TE is a key strategy of plants in the acclimation to drought [9]. The reference method to determine TE, at whole plant level and long term is through lysimeters with gravimetric determinations [10], which in practice present some limitations due to labour requirements. Instantaneous WUE or TE can be also determined by measuring the concentration of CO2 and H2O vapour, which can be applied at the leaf level and faster than gravimetric determination using lysimeters [11]; however, the robustness of this methodology is more limited than TE determination. In addition, the instantaneous WUE can be estimated by the relationship between the photosynthesis rate (A) and transpiration (T) and the intrinsic WUE by the relationship between A and stomatal conductance (gs) [12].
Another alternative to determine long-term TE, extrapolated to whole plant level that does not require measuring transpiration or DM production, is through isotopic discrimination of 13C (∆13C) [13,14]. This isotopic indicator is highly heritable in C3 plants and has a low genotype by environment interaction [15,16].
The plant ∆13C depends on its water status [17] and, therefore, on soil moisture [18]. ∆13C has a strong negative correlation with rainfall [19] and soil moisture [20]. Moreover, physiological factors such as stomatal conductance and photosynthetic rate also determine ∆13C [21,22].
Although ∆13C is widely used as an indicator or proxy for TE, it is not possible to distinguish if under water limiting conditions its variation is due to decreases in stomatal conductance or photosynthetic rate. To differentiate between them, the isotopic discrimination of 18O (∆18O) can be used, because it does not depend on the photosynthetic rate but on the stomatal conductivity [23]. Thus, the determination of ∆13C and ∆18O allows a quick and reliable measurement of TE and the stomatal conductance, respectively [23,24].
The natural abundance of 15N can be used to estimate the BNF. The different composition of nitrogen isotopes in plants grown in the same condition can be attributed to the fact that 15N abundance in the air is lower than in the soil [25]. Therefore, the determination of N isotopes in plants allows estimation of the amount of N obtained through BNF.
Moderated water restrictions have been shown to increase the natural abundance of 13C in plant tissues, including C. juncea and C. spectabilis, during their growth that allows determining their TE [26]. However, that study was limited to two species and the fixated nitrogen and its relation with the WUE was not evaluated. Therefore, the objective of our work is to evaluate the performance of four species of tropical legumes based on different desirable attributes in CC under water-limiting conditions and also to propose new index parameters related to TE and BNF under water-limiting conditions.
2. Materials and Methods
2.1. Plant Material and Growing Conditions
Seeds of Crotalaria juncea L. (Sunnhemp), C. spectabilis Roth (Showy rattlepod), C. ochroleuca (Slender leaf rattlebox), and Cajanus cajan (Pigeon pea) cv. IAPAR 43 were purchased from BRSEEDS Company (Araçatuba, SP, Brazil). Seeds were sown at the rate of one per pot with 4 kg of a typical soil from southern Uruguay (carbon = 11.6 g/kg; clay = 268 g/kg; silt = 487 g/kg; sand = 245 g/kg). The plants were grown in a growth chamber at 30 °C with a relative humidity of approximately 50% and a light intensity of 500 mmol m−2 s−1 with a 16/8 h light-dark cycle.
The experimental design used was a randomized complete block with two factors, legume species and water regime. Plants from each species, six replicates each, were firstly grown at 80% of field capacity (FC) for 30 days. From day 30, a moderate water deficit was imposed by subjecting the plants to 50% FC for 45 days whereas other plants were kept at 80% FC as control treatment. The daily water volumes of 50% and 80% FC were estimated by gravimetric determination and were calculated considering that the water content at FC (θf, on the basis of mass) was 28.5% (m/m). The amount of transpired water was determined according to Berriel et al. [14], and the TE was calculated at the end of the test as: TE = shoot DM produced/transpired water.
2.2. Isotopic Ratio Mass Spectrometry Determination
To determine the produced shoot biomass expressed as DM, leaves and stems were dried at 60 °C until a constant weight was reached. Plant samples were ground in a fixed and mobile knife mill (Marconi MA-580, Piracicaba, Brazil), achieving a particle size of less than 2 mm and then with a rotary mill (SampleTek 200 vial Rotator, Lawrenceburg, KY, US) until reaching the required granulometric size for isotopic analysis. One and a half mg of each sample was weighed into tin capsules. The natural abundance of 13C and 15N was determined in a Flash EA 1112 elemental analyser (Milan, Italy) coupled to a Thermo Finnigan DELTAplus mass spectrometer (Bremen, Germany) at the Centre of Nuclear Application in Sustainability Agricultural of School of Agronomy, Uruguay. The isotopic ratio was expressed in delta notation (δ) in parts per thousand or ‰ using the following equation [27]:
Carbon isotope discrimination (∆13C) was calculated using the following equation [28]:
The proportion of N fixed from the air (% Ndfa) used the formula of Shearer and Khol [29]:
with % Ndfa the proportion of plant N derived from BNF; Δ15Nref, the δ15N value of the reference plant (not fixing); δ15Nfix, the δ15N value of the fixing plant; and B, the δ15N value of a fixing plant growing in a medium without N.
As a reference plant, corn was used, with a value of +9.7‰ of δ15N, determined under the same conditions.
The 18O/16O isotopic ratio was determined on the DM of leaves, and the analytical determination was carried out in a Thermo Scientific Delta V mass spectrometer (Bremen GmbH, Germany) with a Conflo IV interface connected to a Costech 4010 elemental analyser (EA) (Milan, Italy) and a high-temperature conversion elemental analyser (CSI laboratory of the University of New Mexico).
2.3. Statistical Analysis
The experimental design consisted of completely randomized blocks with 6 repetitions each. Factors consisted of combinations of four plant species and two soil water regimes (80% FC and 50% FC). The main effects of species and soil water status, as well as their interaction, were analysed by ANOVA and the mean separations were performed with the Tukey’s HSD (honestly significant difference) at the 5% significance level using the statistic software InfoStat® version 2020 (Universidad Nacional de Córdoba, Córdoba, Argentina) [30]. The correlation between the variables studied was analysed using the Pearson correlation matrix also using the InfoStat® [30].
3. Results
The legume species C. juncea, C. spectabilis, C. ochroleuca, and Cajanus cajan were evaluated according to their shoot DM production, transpired water, TE, and isotopic parameters in two water regimes, moderate water deficit (50% FC) and well-watered (80% FC). For these variables, no interaction between the factors water regimen and species were found, therefore the response of each species to the water regime followed a similar pattern. The main effects of water regime and species were observed on shoot dry matter, transpired water, and TE (Figure 1 and Figure 2).
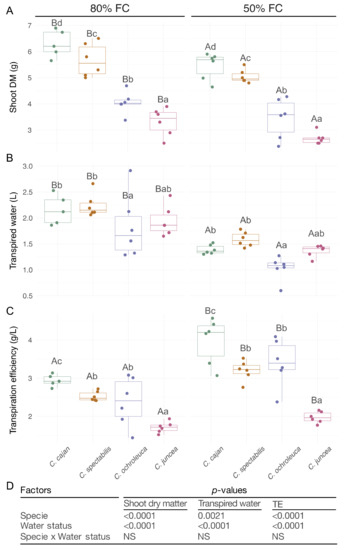
Figure 1.
Shoot dry matter (DM), transpired water and transpiration efficiency (TE) of legumes used as CC compared with no water deficit (80%) to moderate water deficit (50%). (A). DM production expressed in g per plant. (B). Transpired water as L of water per plant. (C). TE determined as DM produced per transpired water (g of DM/L of water). (D). p-values of the ANOVA for the species and water status effects and the species × water status interaction. The box plots represent the means, each dot represents independent replicates, and the vertical lines represent the standard deviation. Different letters indicate statistical significance between species (lowercase) and water regimes (capital letters) in a Tukey’s HSD (honestly significant difference) post hoc test at 0.05 p-value.
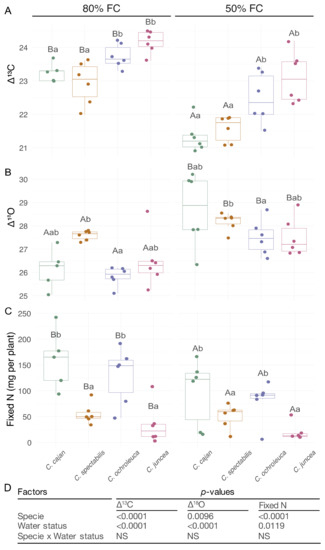
Figure 2.
∆13C, ∆18O, and fixed N in legumes used as CC during moderate water deficit (50% FC) and in the absence of water deficit (80% FC). (A). Carbon-13 isotope discrimination (∆13C) (B). Oxygen-18 isotope discrimination (∆18O). (C). Fixed nitrogen (mg per plant). (D). p-values of the ANOVA for the species and water status effects, and the species × water status interaction. The box plots represent the means, each dot represents independent replicates, and the vertical lines represent the standard deviation. Different letters indicate statistical significance between species (lowercase) and water regimes (capital letters) in a Tukey’s HDS post hoc test at 0.05 p-value.
However, the N fixation did not show differences between species (Figure 1 and Figure 2). In particular, the DM production and transpired water were lower during moderate water deficit (Figure 1). Cajanus cajan produced the highest DM and transpiration rate, followed by C. spectabilis, C. ochroleuca, and C. juncea (Figure 1 and Figure 2). In addition, the TE increased in all species under moderate water deficit, being Cajanus cajan the most efficient, C. juncea the least efficient, and C. ochroleuca and C. spectabilis showed an intermediate efficiency (Figure 1).
The two factors tested, water regime and species, influenced the isotopic parameters but not their interaction. In general, ∆13C was lower under moderate water deficit, whereas the ∆18O increased under moderate water deficit compared to the control condition (Figure 2). Among the species, Cajanus cajan and C. spectabilis showed a lower ∆13C than C. ochroleuca and C. juncea in both control and moderate water deficit (Figure 2). In terms of ∆18O under moderate water deficit, only C. ochroleuca and C. spectabilis exhibited differences, being higher for C. spectabilis (Figure 2). The correlation analysis, considering all species and water soil content, showed a negative correlation between the variables TE and ∆13C, ∆13C and ∆18O, and ∆18O and transpired water (Table 1).

Table 1.
Pearson correlation coefficients for the correlations between shoot dry matter (DM), transpired water (T), transpiration efficiency (TE),13C and 18O isotope discrimination (∆13C, ∆18O respectively) from the values obtained for C. cajan, C. spectabilis, C. ochroleuca, and C. juncea taken together.
The %Ndfa was lower under moderate water deficit relative to the control condition, and no differences between the species were found (Figure 3). However, the DM production was different between these species (Table 1) explaining the differences in the amount of N derived from BNF (p < 0.0001) in the shoot. The water regime did not affect the amount of total N; thus, when total N was considered irrespectively of the water condition, C. juncea and C. spectabilis had lower N content (43 and 72 mg, respectively) than C. ochroleuca and Cajanus cajan (132 and 177 mg, respectively).
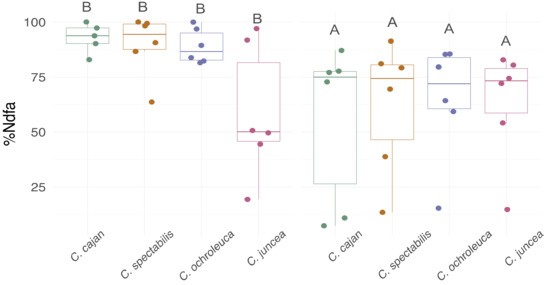
Figure 3.
Proportion of nitrogen derived from the air (%Ndfa). The box plots represent the means, each dot represents independent replicates, and the vertical lines represent the standard deviation. The statistical analysis revealed no species effect but a treatment effect. Different letters indicate statistical significance between treatments in a Tukey’s HDS post hoc test at 0.05 p-value.
Fixed N was affected by the water regime and also by different species, but no statistically interaction was found between water regime and species (Figure 2). In both water conditions, Cajanus cajan and C. ochroleuca fixed more N than C. spectabilis and C. juncea (Figure 2). Moreover, in both water regimes Cajanus cajan and C. ochroleuca had the highest ratio Nfix/T and Nfix/Δ18O, while C. juncea and C. spectabilis had the lowest (Table 2).
Table 2.
Performance indexes for legumes that were subjected to moderate water deficit (50% FC) and control (80% FC) conditions. The evaluated indexes related the amount of fixed N from air with the transpired water, ∆18O and ∆13C (Nfix/T, Nfix/∆18O, and Nfix/∆13C). Different letters indicate statistical significance between species (lowercase) and water regimes (capital letters) in a Tukey’s HDS post hoc test at 0.05 p-value.
In legumes in which ∆13C correlated more with transpired water than with photosynthetic rate, the Nfix/∆13C index can be used as an index informing about the nitrogen fixation in relation to water transpired. The moderate water deficit condition implicated a decrease in this index in all four species tested and followed the same trend as the amount of fixed N (Table 2). Finally, strong positive correlations were found between the Nfix/T, Nfix/∆18O, and Nfix/∆13C indexes and between them and the TE when the species and water conditions were grouped (Table 3).
Table 3.
Pearson correlation coefficients for the correlation between different indicators of performance, transpiration efficiency (TE), mg of fixed N per L of water (Nfix/T), mg of fixed N per 13C isotope discrimination (Nfix/∆13C), and mg of fixed N per 18O isotope discrimination (Nfix/∆18O) from the values obtained for C. cajan, C. spectabilis, C. ochroleuca, and C. juncea taken together.
4. Discussion
The legumes C. spectabilis, C. juncea, C. ochroleuca, and Cajanus cajan may be good candidates for cover cropping because of their high ability to fix N [31]. Besides these attributes, high WUE and TE are desirable characteristics for CC in water-limited environments. In this study, we determined these parameters in these four species under different water regimes.
In both water regimes, Cajanus cajan had the greatest DM production, TE, and amount of fixed N among the four species tested. Moreover, Cajanus cajan had the greatest DM production in relation to transpired water. This shows its potential as a CC in water-limited environments. Cajanus cajan can combine these desirable attributes, maximizing the DM produced in relation to water consumed or transpired. These findings show that Cajanus cajan has a potential to be used as CC in soils where water restrictions are common.
Most climate change scenarios foresee rainfalls to be decreased around the world and its pattern to be more erratic [32]. Therefore, the redesign of agricultural crop rotations seems to be imminent to mitigate the effect of climate change on natural resources [33,34,35]. High WUE and TE in drought conditions are desired features that crops, varieties, or genotypes must have to be considered in this redesign [36].
In moderate water deficit, C. spectabilis, C. juncea, C. ochroleuca, and Cajanus cajan were tolerant to a moderate water deficit, in agreement with previous reports that evaluated the performance of these species under field conditions [37,38]. The strong decrease in transpired water in response to a moderate water deficit, together with a slight decrease in DM production, resulted in an increased TE (Figure 1), which explains their tolerance to water restrictions. Berriel et al. [25] found that moderate drought also negatively impacted DM production and transpired water of C. spectabilis and C. juncea when plants were studied at whole plant level and in longer term. This suggests that our findings may be translatable for all four species when studied in longer periods of moderate water deficit and no matter the methodological approach used (i.e., whole plant or shoot only).
The decrease in DM production can be a consequence of the reduction in photosynthetic rate, which often relates to a decrease in stomatal conductance. One of the few studies quantifying the impact of water deficit on the variables determining the water–carbon balance in leaves, was carried out in C. cajan in which moderate water deficit caused a decrease in transpired water, stomatal conductance, and photosynthetic rate, leading to an increase in instantaneous WUE [39].
In all species, ∆13C decreased in water-limited condition relative to the control condition (Figure 2). Regardless of the water regime, the least discrimination was exhibited by Cajanus cajan, the greatest by C. juncea, and intermediate discrimination was found in C. ochroleuca and C. spectabilis. In turn, regardless of the water conditions position (Figure 2). Berriel et al. [25] observed the same pattern for C. spectabilis and C. juncea, in terms of ∆13C, during water deficit and after rehydration. In our study, when the water deficit prevailed, the decrease in ∆13C indicates that either the decrease in stomatal conductance or the transpiration rate led to a decrease in both transpired water and DM production (Figure 1).
∆13C was negatively related to TE in all four evaluated species (Figure 1; Table 1). The use of ∆13C as a proxy for TE has been confirmed in different C3 species [40,41,42] but not in many grain legumes [43]. The relationships we found between ∆13C and TE and those reported by Berriel et al. [14,25], supports the strength of 13C as an isotopic indicator of TE in Cajanus cajan, C. spectabilis, C. juncea, and C. ochroleuca.
The variation in ∆18O by the water regimes (Figure 2; Table 1) and the strong inversely proportional relationship between this and transpired water, support the use of this isotopic indicator as a proxy for transpiration and stomatal conductance [44,45]. Determining ∆18O is advantageous compared to determining transpiration and stomatal conductance because it evaluates the transpiration rate in a longer time scale [46].
The negative correlation between ∆18O and ∆13C helped to interpret the differences in TE estimated through the ∆13C proxy (Table 1), indicating that the increase in TE is mainly determined by the decrease in stomatal conductance than by the decrease in photosynthetic rate. This interpretation is consistent with the greater decrease in transpired water than in DM production (Figure 1).
In this study, we defined indexes relating the amount of fixed N (Nfix) and transpired water, determined directly, as ∆13C and ∆18O. Based on the relationships established between fixed N and transpired water, we propose three sustainability indexes focused on the amount of water used to fix N and applicable to legumes: Nfix/T, Nfix/∆13C, and Nfix/∆18O. All these indexes showed a strong positive correlation among them (Table 2). Methodologically, the Nfix/∆13C index is the preferred one, given its simplicity to be determined. According to these indexes, C. cajan and C. ochroleuca are the most promising species as CC in conditions of moderate water deficit. It is worth bearing in mind that the application of rhizobia inoculants would increase the BNF in any of the species, something not tested here, which can cause differences in the ranking produced here. Regardless of this, the information generated in this work, as well as the use of the indexes defined here, can contribute to the study and design of agricultural rotations that allow the generation of ecosystem services and mitigate the impact of climate change on farms. Since this study was completed in controlled conditions, more research is necessary to evaluate the significance of these indexes in field conditions.
Author Contributions
V.B. conceived the study; V.B. performed all the experiments and data analysis; S.S. prepared the figures; C.H.P. and J.M. supervised the study; all the authors contributed to the data interpretation and wrote the manuscript. All authors have read and agreed to the published version of the manuscript.
Funding
This research was funded by Agencia Nacional de Investigación e Innovación from Uruguay, Grant: ANII-FMV_3_2016_1_125492; Doctorado en Biotecnología (Facultad de Ciencias, Universidad de la República) and CAP (Comisión Académica de Postgrado, Universidad de la República).
Institutional Review Board Statement
Not applicable.
Informed Consent Statement
Not applicable.
Data Availability Statement
Not applicable.
Acknowledgments
The authors are active members of the National Research System (SNI).
Conflicts of Interest
The authors declare no conflict of interest.
References
- Soares, M.B.; Tavanti, R.F.; Rigotti, A.R.; de Lima, J.P.; da Silva Freddi, O.; Petter, F.A. Use of cover crops in the southern Amazon region: What is the impact on soil physical quality? Geoderma 2021, 384, 114796. [Google Scholar] [CrossRef]
- Da Silva, E.C.; Muraoka, T.; Bastos, A.V.S.; Franzin, V.I.; Buzetti, S.; Loureiro Soares, F.A.; Batista Teixeira, M.; Bendassolli, J.A. Biomass and Nutrient Accumulation by Cover Crops and Upland Rice Grown in Succession Under No-Tillage System as Affected by Nitrogen Fertilizer Rate. J. Crop Sci. Biotechnol. 2020, 23, 117–126. [Google Scholar] [CrossRef]
- Pereira Pacheco, L.; Dalla Côrt São Miguel, A.S.; da Silva, R.G.; de Souza, E.D.; André Petter, F.; Kappes, C. Biomass yield in production systems of soybean sown in succession to annual crops and cover crops. Pesquisa Agropecuária Brasileira 2017, 52, 582–591. [Google Scholar] [CrossRef]
- Reddy, P.P. Cover/Green Manure Crops. In Sustainable Intensification of Crop Production; Springer: Singapore, 2016; pp. 55–67. [Google Scholar] [CrossRef]
- Souza, A.V.S.S.; Souza, T.A.F.; Santos, D.; Rios, E.S.; Souza, G.J.L. Agronomic evaluation of legume cover crops for sustainable agriculture. Russ. Agric. Sci. 2018, 44, 31–38. [Google Scholar] [CrossRef]
- Pound, B.; Anderson, S.; Gundel, S. Species for niches: When and for whom are cover crops appropriate? Mt. Res. Dev. 1999, 19, 307–312. [Google Scholar]
- Sadras, V.; Lake, L.; Li, Y.; Farquharson, E.A.; Sutton, T. Phenotypic plasticity and its genetic regulation for yield, nitrogen fixation and δ13C in chickpea crops under varying water regimes. J. Exp. Bot. 2016, 67, 4339–4351. [Google Scholar] [CrossRef] [Green Version]
- Blankenagel, S.; Yang, Z.; Avramova, V.; Schön, C.-C.; Grill, E. Generating Plants with Improved Water Use Efficiency. Agronomy 2018, 8, 194. [Google Scholar] [CrossRef] [Green Version]
- Ullah, H.; Santiago-Arenas, R.; Ferdous, Z.; Attia, A.; Datta, A. Improving water use efficiency, nitrogen use efficiency, and radiation use efficiency in field crops under drought stress: A review. Adv. Agron. 2019, 156, 109–157. [Google Scholar]
- Vadez, V.; Kholova, J.; Medina, S.; Kakkera, A.; Anderberg, H. Transpiration efficiency: New insights into an old story. J. Exp. Bot. 2014, 65, 6141–6153. [Google Scholar] [CrossRef] [Green Version]
- Polley, H.W. Implications of atmospheric and climatic change for crop yield and water use efficiency. Crop Sci. 2002, 42, 131–140. [Google Scholar] [CrossRef]
- Ali, M.H.; Talukder, M.S.U. Increasing water productivity in crop production—A synthesis. Agric. Water Manag. 2008, 95, 1201–1213. [Google Scholar] [CrossRef]
- Santesteban, L.G.; Miranda, C.; Barbarin, I.; Royo, J.B. Application of the measurement of the natural abundance of stable isotopes in viticulture: A review. Aust. J. Grape Wine Res. 2015, 21, 157–167. [Google Scholar] [CrossRef]
- Berriel, V.; Monza, J.; Perdomo, C.H. Cover Crop Selection by Jointly Optimizing Biomass Productivity, Biological Nitrogen Fixation, and Transpiration Efficiency: Application to Two Crotalaria Species. Agronomy 2020, 10, 1116. [Google Scholar] [CrossRef]
- Elazab, A.; Molero, G.; Serret, M.D.; Araus, J.L. Root traits and δ13C and δ18O of durum wheat under different water regimes. Funct. Plant Biol. 2012, 39, 379–393. [Google Scholar] [CrossRef]
- Yasir, T.A.; Min, D.H.; Chen, X.J.; Condon, A.G.; Hu, Y.G. The association of carbon isotope discrimination (Δ) with gas exchange parameters and yield traits in Chinese bread wheat cultivars under two water regimes. Agric. Water Manag. 2013, 119, 111–120. [Google Scholar] [CrossRef]
- Berriel, V.; Mori, C.; Perdomo, C. Water status and 13C isotopic discrimination of two conventional pastures in Uruguay. Agrociencia 2014, 18, 1–13. (In Spanish) [Google Scholar]
- Hartman, G.; Danin, A. Isotopic values of plants in relation to water availability in the Eastern Mediterranean region. Oecologia 2010, 162, 837–852. [Google Scholar] [CrossRef] [Green Version]
- Stewart, G.R.; Turnbull, M.H.; Schmidt, S.; Erskine, P.D. 13C natural-abundance in plant-communities along a rainfall gradient: A biological integrator of water availability. Aust. J. Plant Physiol. 1995, 22, 51–55. [Google Scholar] [CrossRef]
- Ehleringer, J.R.; Cooper, T.A. Correlations between carbon isotope ratio and microhabitat in desert plants. Oecologia 1988, 76, 562–566. [Google Scholar] [CrossRef] [PubMed]
- Farquhar, G.D.; O’Leary, M.H.; Berry, J.A. On the Relationship Between Carbon Isotope Discrimination and the Intercellular Carbon Dioxide Concentration in Leaves. Funct. Plant Biol. 1982, 9, 121–137. [Google Scholar] [CrossRef]
- Santiago, L.S.; Silvera, K.; Andrade, J.L.; Dawson, T.E. The use of stable isotopes in tropical biology. Interciencia 2005, 30, 28–35. (In Spanish) [Google Scholar]
- Barbour, M.M. Stable oxygen isotope composition of plant tissue: A review. Funct. Plant Biol. 2007, 34, 83–94. [Google Scholar] [CrossRef]
- Hirl, R.T.; Ogée, J.; Ostler, U.; Schäufele, R.; Baca Cabrera, J.; Zhu, J.; Schliep, I.; Wingate, L.; Schnyder, H. Temperature sensitive biochemical 18O-fractionation and humidity-dependent attenuation factor are needed to predict δ18O of cellulose from leaf water in a grassland ecosystem. N. Phytol. 2021, 229, 3156–3171. [Google Scholar] [CrossRef] [PubMed]
- Chalk, P.M.; Craswell, E.T. An overview of the role and signifcance of 15N methodologies in quantifying biological N2 fxation (BNF) and BNF dynamics in agro-ecosystems. Symbiosis 2018, 75, 1–16. [Google Scholar] [CrossRef]
- Berriel, V.; Perdomo, C.; Monza, J. Carbon Isotope Discrimination and Water-Use Efficiency in Crotalaria Cover Crops under Moderate Water Deficit. J. Soil Sci. Plant Nutr. 2020, 20, 537–545. [Google Scholar] [CrossRef]
- Sulzman, E.W. Stable isotope chemistry and measurement: A primer. In Stable Isotopes in Ecology and Environmental Science, 2nd ed.; Michener, R., Lajtha, K., Eds.; Blackwell Publishing: Boston, NJ, USA, 2007; pp. 1–21. [Google Scholar]
- Farquhar, G.D.; Ehleringer, J.R.; Hubick, K.T. Carbon isotope discrimination and photosynthesis. Annu. Rev. Plant Biol. 1989, 40, 503–537. [Google Scholar] [CrossRef]
- Shearer, G.; Kohl, D.H. N2-fixation in field settings: Estimations based on natural 15N abundance. Aust. J. Plant Physiol. 1986, 13, 699–756. [Google Scholar]
- Di Rienzo, J.A.; Casanoves, F.; Balzarini, M.G.; Gonzalez, L.; Tablada, M.; Robledo, C.W. InfoStat; Version 2011; Grupo InfoStat, FCA, Universidad Nacional de Córdoba: Córdoba, Argentina, 2020. [Google Scholar]
- Saikia, P.; Nag, A.; Anurag, S.; Chatterjee, S.; Khan, M.L. Tropical Legumes: Status, Distribution, Biology and Importance. In The Plant Family Fabaceae; Hasanuzzaman, M., Araújo, S., Gill, S., Eds.; Springer: Singapore, 2020. [Google Scholar] [CrossRef]
- Zorrilla-Fontanesi, Y.; Pauwels, L.; Panis, B. Strategies to revise agrosystems and breeding to control Fusarium wilt of banana. Nat. Food 2020, 1, 599–604. [Google Scholar] [CrossRef]
- Condon, A.G. Drying times: Plant traits to improve crop water use efficiency and yield. J. Exp. Bot. 2020, 71, 2239–2252. [Google Scholar] [CrossRef]
- Hernandez-Ochoa, I.M.; Pequeno, D.N.L.; Reynolds, M. Adapting irrigated and rainfed wheat to climate change in semi-arid environments: Management, breeding options and land use change. Eur. J. Agron. 2019, 109, 125915. [Google Scholar] [CrossRef]
- Buto, O.; Galbiati, G.M.; Alekseeva, N.; Bernoux, M. Climate Finance in the Agriculture and Land Use Sector—Global and Regional Trends between 2000 and 2018; FAO: Rome, Italy, 2021. [Google Scholar]
- Iglesias, A.; Garrote, L. Adaptation strategies for agricultural water management under climate change in Europe. Agric. Water Manag. 2015, 155, 113–124. [Google Scholar] [CrossRef] [Green Version]
- Fageria, N.K. Maximizing Crop Yields; Marcel Dekker: New York, NY, USA, 1992. [Google Scholar]
- Baligar, V.C.; Fageria, N.K. Agronomy and Physiology of Tropical Cover Crops. J. Plant Nutr. 2007, 30, 1287–1339. [Google Scholar] [CrossRef]
- Sreeharsha, R.V.; Mudalkar, S.; Sengupta, D. Mitigation of drought-induced oxidative damage by enhanced carbon assimilation and an efficient antioxidative metabolism under high CO2 environment in pigeonpea (Cajanus cajan L.). Photosynth. Res. 2019, 139, 425–439. [Google Scholar] [CrossRef]
- Maxwell, T.M.; Silva, L.C.R.; Horwath, W.R. Integrating effects of species composition and soil properties to predict shifts in montane forest carbon-water relations. Proc. Natl. Acad. Sci. USA 2018, 115, E4219–E4226. [Google Scholar] [CrossRef] [PubMed] [Green Version]
- Pronger, J.; Campbell, D.I.; Clearwater, M.J.; Mudge, P.L.; Rutledge, S.; Wall, A.M.; Schipper, L.A. Toward optimisation of water use efficiency in dryland pastures using carbon isotope discrimination as a tool to select plant species mixtures. Sci. Total Environ. 2019, 665, 698–708. [Google Scholar] [CrossRef] [PubMed]
- Castillo, A.; Rebuffo, M.; Díaz, P.; García, C.; Monza, J.; Borsani, O. Physiological and biochemical responses to water deficit in Lotus uliginosus x L. corniculatus hybrids. Crop Pasture Sci. 2017, 68, 670–679. [Google Scholar] [CrossRef]
- Turner, N.C.; Palta, J.A.; Shrestha, R.; Ludwig, C.; Siddique, K.H.M.; Turner, D.W. Carbon isotope discrimination is not correlated with transpiration efficiency in three cool-season grain legumes (Pulses). J. Integr. Plant Biol. 2007, 49, 1478–1483. [Google Scholar] [CrossRef]
- Farquhar, G.D.; Cernusak, L.A.; Barnes, B. Heavy water fractionation during transpiration. Plant Physiol. 2007, 143, 11–18. [Google Scholar] [CrossRef] [Green Version]
- Ferrio, J.P.; Mateo, M.A.; Bort, J.; Abdalla, O.; Voltas, J.; Araus, J.L. Relationships of grain delta 13C and delta 18O with wheat phenology and yield under water-limited conditions. Ann. Appl. Biol. 2007, 150, 207–215. [Google Scholar] [CrossRef]
- Barbour, M.M.; Cernusak, L.A.; Whitehead, D.; Griffin, K.L.; Turnbull, M.H.; Tissue, D.T.; Farquhar, G.D. Nocturnal stomatal conductance and implications for modelling δ18O of leaf-respired CO2 in temperate tree species. Funct. Plant Biol. 2005, 32, 1107–1121. [Google Scholar] [CrossRef] [Green Version]
Publisher’s Note: MDPI stays neutral with regard to jurisdictional claims in published maps and institutional affiliations. |
© 2022 by the authors. Licensee MDPI, Basel, Switzerland. This article is an open access article distributed under the terms and conditions of the Creative Commons Attribution (CC BY) license (https://creativecommons.org/licenses/by/4.0/).