Article

Strategies to Reduce Crop Water Footprint in Intensive Wheat-Maize Rotations in North China Plain

1
State Key Laboratory of North China Crop Improvement and Regulation, Key Laboratory of Crop Growth Regulation of Hebei Province, College of Agronomy, Hebei Agricultural University, Baoding 071000, China
2
Department of Biological Engineering, Yangling Vocational & Technical College, Xianyang 712000, China
3
Biosystems Engineering Department, Auburn University, Auburn, AL 36830, USA
4
Institute of Environment and Sustainable Development in Agriculture, Chinese Academy of Agricultural Science, Beijing 100081, China
*
Author to whom correspondence should be addressed.
These authors contributed equally to this work.
Agronomy 2022, 12(2), 357; https://doi.org/10.3390/agronomy12020357
Submission received: 2 January 2022 / Revised: 22 January 2022 / Accepted: 29 January 2022 / Published: 31 January 2022

Abstract

:
The intensive use of groundwater and nitrogen fertilizer has led to serious negative impacts on the environment of the North China Plain (NCP). Water footprint is an emerging approach to assess the consumptive water use and the environmental impacts on winter wheat-summer maize systems. A seven-year rotation experiment was conducted to collect data on wheat and maize growth response to nitrogen rates and irrigation schedules and to explore how the water footprint was affected, using DSSAT 4.6 Wheat and Maize crop models. Results showed that the increase in farm inputs contributed greatly to the increase in water footprint, primarily through the grey water footprint. The water footprints of maize and wheat were more sensitive to the nitrogen rate and irrigation, respectively. An irrigation of 160 mm produced a minimum total water footprint and higher yield for wheat. The grey water footprint of maize increased linearly when the nitrogen rate applied to maize exceeded 60 kg ha−1. Water-saving irrigation with 300 kg ha−1 of nitrogen can maintain a higher grain yield and have little impact on the environment. The approach used and the results can help to develop management strategies to maintain high yields while minimizing the water footprint in NCP.

1. Introduction

The winter wheat-summer maize double cropping system in the North China Plain (NCP) is one of the most intensive agricultural systems worldwide and this rotation is widely used in Asian countries [1,2]. The North China Plain produces 56% of the wheat and 25% of the maize grain in China [3]. While the productivity of wheat and maize has been increasing in the recent decades, the intensive use of groundwater and nitrogen fertilizer has led to serious negative impacts on the environment. Therefore, the sustainability of intensive double cropping systems has been increasingly questioned [4,5]. To further promote water conservation in crop production, it is urgent to explore a greater adoption of water-efficient production systems [6,7].
Water footprint analysis can provide information on complex water relationships for policy makers, business leaders, regulators, and managers, to make decisions for this increasingly scarce resource [8,9]. The water footprint is defined as the volume of freshwater used to produce a crop measured over the various steps of the production chain [10]. The water footprint has three components: consumption of surface and ground water (blue water), consumption of rainwater in crop production (green water), and the volume of freshwater that is required to assimilate the load of pollutants during the crop production process (grey water) [10].
Many water footprint studies have been carried out to focus on water-intensive industrial processes and crops, such as cotton [11], tomato [12], strawberry [13], sugarcane [14], maize [15], olive [16], winter wheat [17], and others [18]. Gleeson et al. [19] compared the rate of global groundwater depletion with the rate of natural renewal and the supply needed to support ecosystems, and they found that the net global water footprint was driven by a few heavily overexploited aquifers. The global water footprint consumed by humans has been quantified by Hoekstra and Mekonnen [20]. They reported that the consumption of cereal products made the largest contribution to the water footprint of the average consumer. Grey water footprint was mainly generated from the production of domestic final demand [21]. Mekonnen and Hoekstra [22] reported that if the water footprint was reduced by 10% for current global crop production, the global water saving in crop production would be 52% compared to the reference water consumption. Therefore, developing management practices to reduce the water footprint in agricultural production would be a great benefit to society.
Morillo et al. [13] suggested that joint evaluation of crop water footprint and irrigation management will become a powerful tool for assessing irrigation processes. They used the methodology to evaluate strawberry production, and found that the blue water footprint was 55–66% higher than the water allowance proposed under lower water regulations. Chukalla et al. [23] comprehensively analyzed the potential to reduce the consumptive water footprint of a few crops at the field level by changing management practice such as irrigation technique, irrigation strategy and mulching practice, and they found that the highest reduction in consumptive water footprint was 28% for drip irrigation. Unreasonable nutrient management mainly contributed to pollution of freshwater. Many previous studies have assumed that 10% of the nitrogen application rate was subject to leaching and run-off. Brueck and Lammel [24] considered that this value was underestimated if the rates exceeded economic nitrogen rates. Nitrogen application rates should vary according to irrigation levels. It should be reduced under water limited condition for more efficient use of water and nitrogen [25]. However, there are still few studies on the effect of nitrogen rates and irrigation amount on water footprint. Although research on water footprint has been increasing rapidly, further studies focusing on how combinations of specific techniques and practices can actually lead to water footprint reduction are necessary [17].
Most former studies used the CROPWAT [13,17,26,27], input-output method [28,29] or AQUACROP [17,23] to quantify the water footprint of a crop. These models or methods used to estimate the yield depend on a simplified linear model which accounts for the effect of water deficit on yield reduction only, leaving out other factors, such as fertilizer application rate, soil salinity and crop growing characteristics [27]. A better estimate of crop water footprint could be made using process-oriented models that account for other yield-limiting factors. The Decision Support System for Agrotechnology Transfer (DSSAT) model is a widely used cropping system simulation model. Several researchers showed that once the model was properly calibrated, it was able to simulate the biomass growth, grain yield, and water and nitrogen balance in response to agricultural management [4,30,31]. DSSAT has already been successfully used all over the world for different purposes, such as climate change response [32,33], irrigation strategies [34,35], nitrogen management [36], plant density [37,38], rotation [39,40], etc. The DSSAT model can simulate the dynamic changes in soil water, evapotranspiration, N leaching and the potential yield of crops on a daily basis. Therefore, it could be a good tool to evaluate the water footprint. The DSSAT-wheat model has been used more and more to simulate water footprint of crops in many countries [41,42]. However, none of the previous studies focused on the effect of agricultural management, such as nitrogen rate and irrigation scheduling, on the water footprint of crops estimated by the DSSAT model.
In this paper, a systematic study including single- and multi- factor simulation was conducted to investigate wheat and maize production and water footprint analysis using the DSSAT-Wheat and -Maize model. The objectives of this study were (1) to evaluate the ability of Decision Support System for Agrotechnology Transfer (DSSAT v4.6, DSSAT Foundation Team, Florida, USA) to simulate continuous crop yields for winter wheat-summer maize rotation; (2) to understand the response of wheat and maize water footprint to irrigation scheduling and nitrogen rate; (3) to determine best management strategies in the North China Plain to optimize yield and water footprint. This detailed knowledge of water footprint of the intensive agricultural system may provide options for more management strategies in other intensive management cropping systems around the world.

2. Materials and Methods
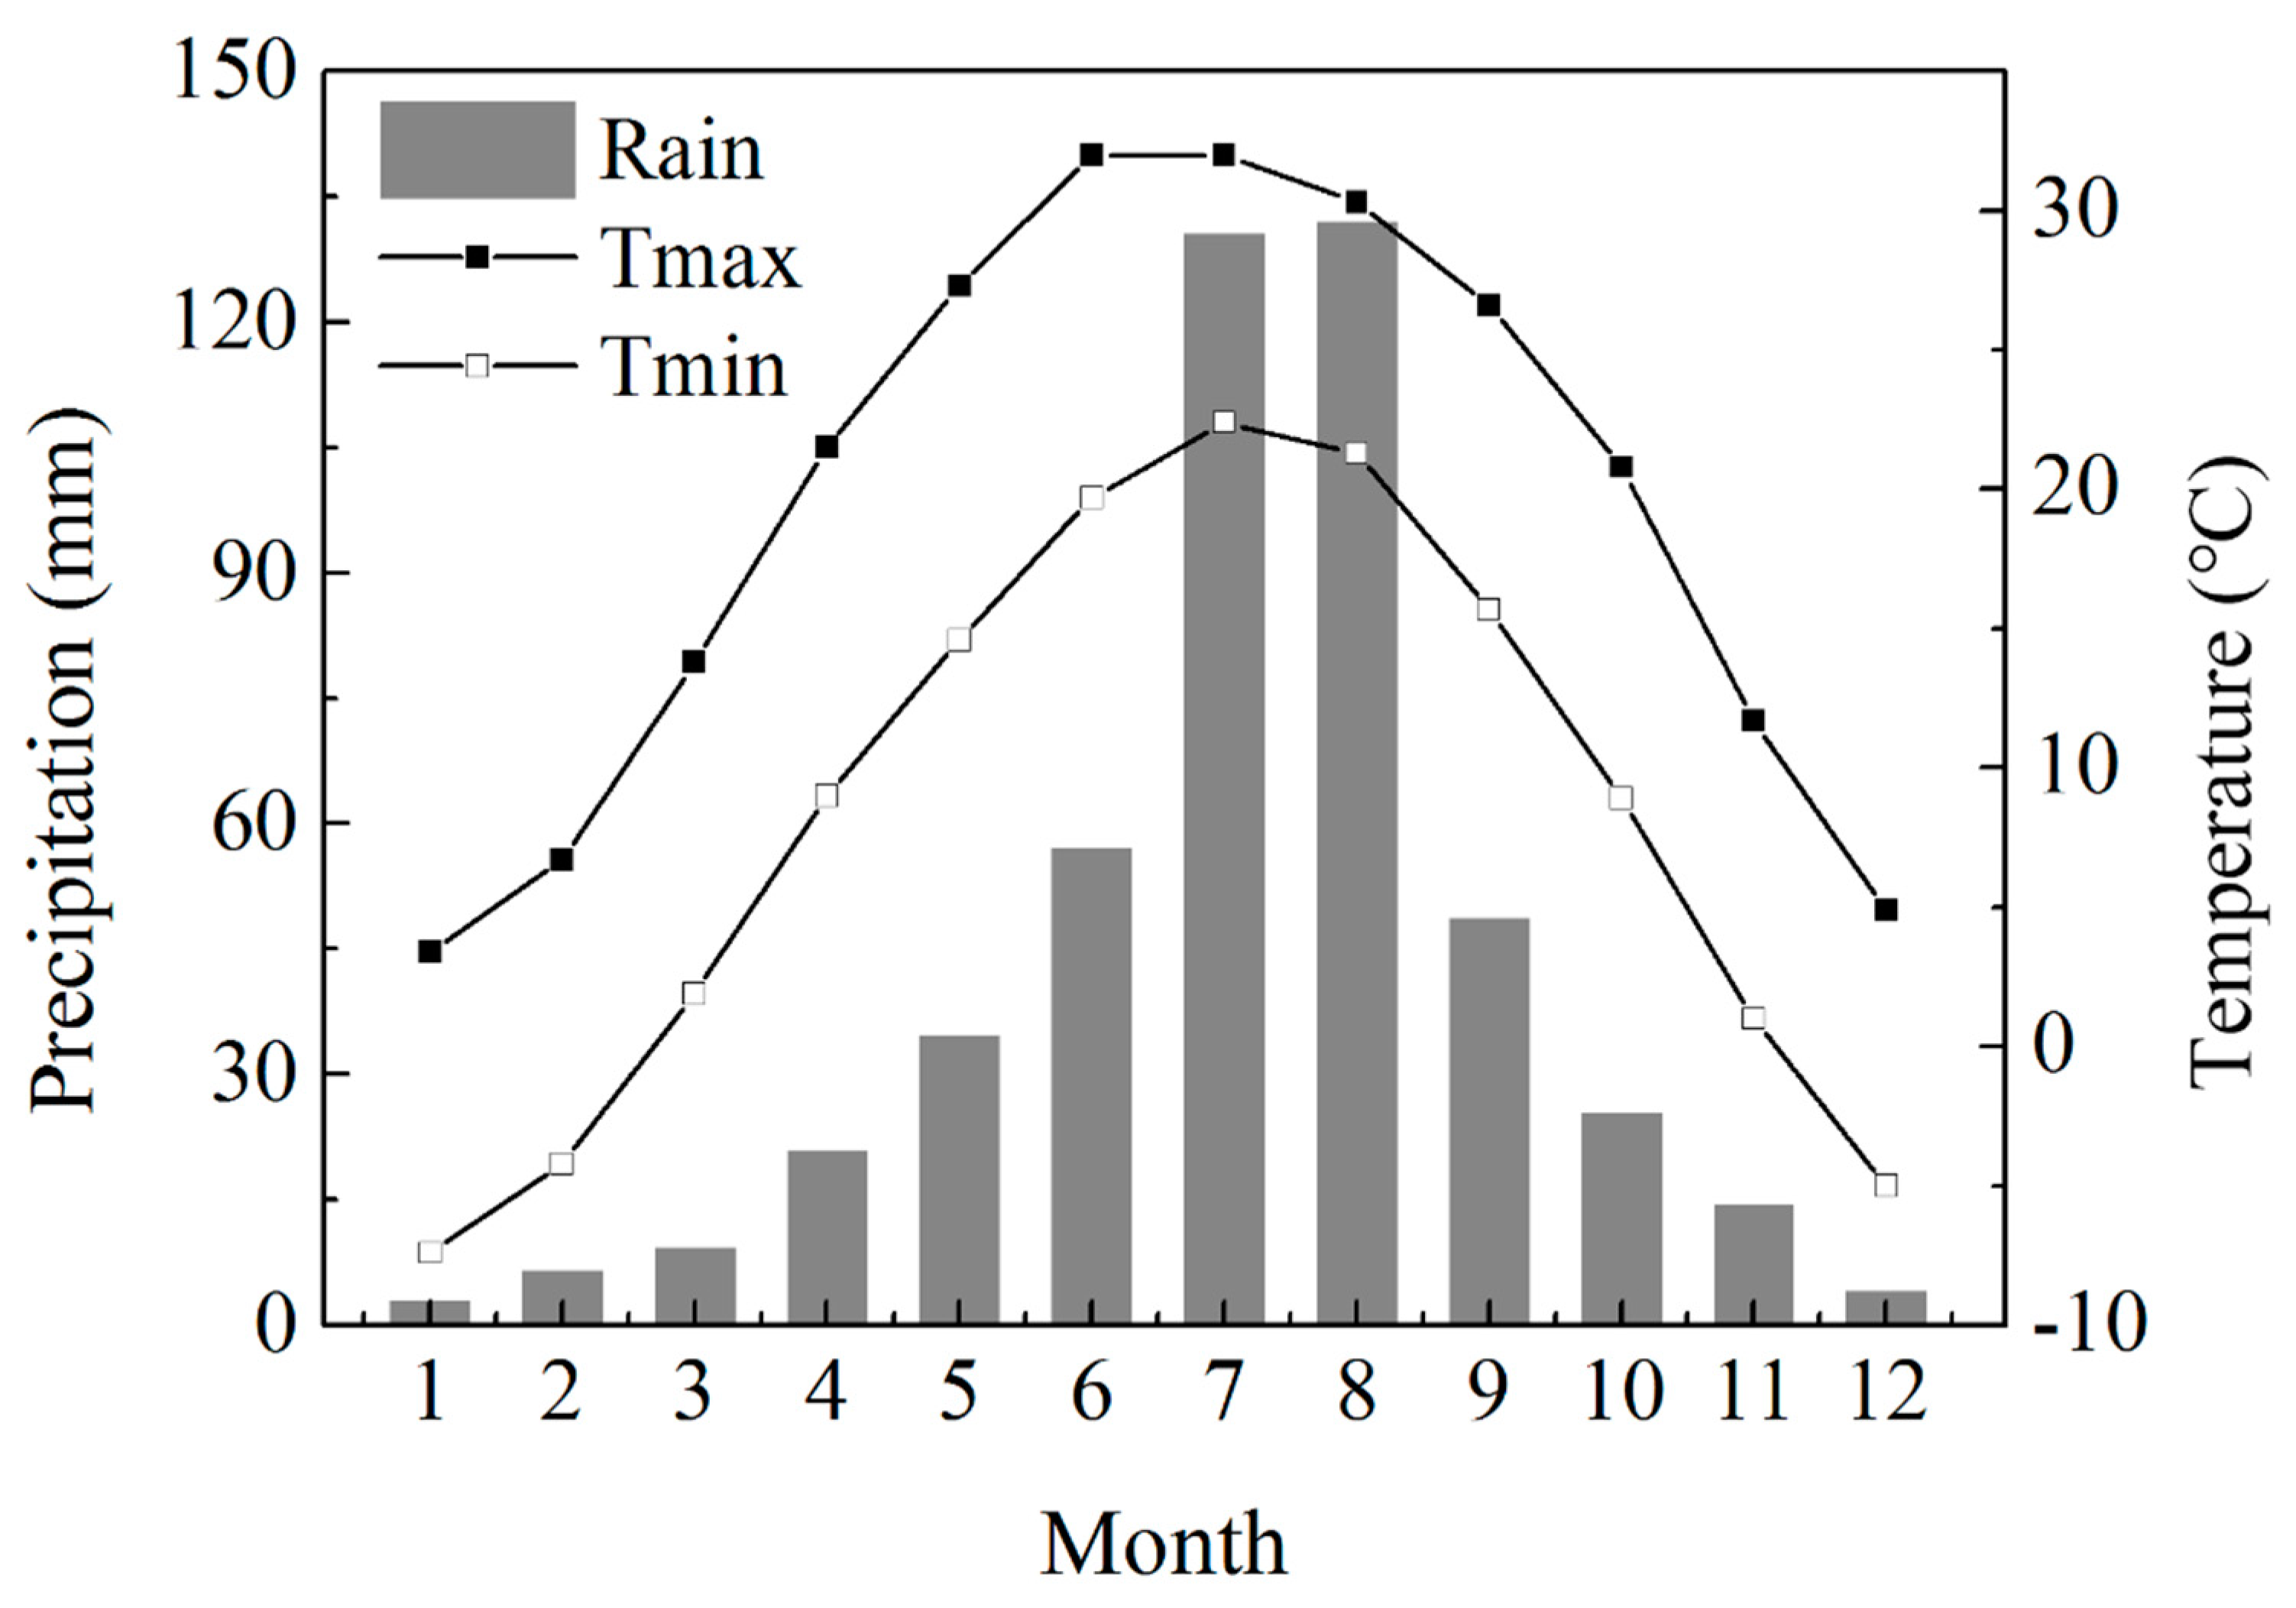
2.1. Study Site

A long-term fertilizer experiment was conducted at Gaocheng District, Shijiazhuang City, Hebei Province, which is in the central NCP. The typical cropping system is a winter wheat and summer maize double cropping system. Historical weather data were measured from 1966 to 2015. The region is semi-arid with a monsoon climate, and historical minimum and maximum daily temperatures ranged from −7.4–2.8 °C in winter to 22.4–32.0 °C in summer (Figure 1). Annual average precipitation is 485.9 mm, with more than 70% occurring from June to September. Only 20–30% of the precipitation typically occurs from October to early June during the wheat growing season. The soil type was clay-loam.

2.2. Field Management and Experiment Data

The experiment was set up as a split-plot design with two irrigation treatments in the main plots and three nitrogen rates in the sub-plots described by Lv et al. [43] and Zhang et al. [44]. Each plot is 4.8 m × 5.4 m. The two irrigation levels in the main plots were limited irrigation and full irrigation with border irrigation method. The limited irrigation treatment consisted of a single irrigation at jointing for wheat and a single irrigation at sowing for maize. The full irrigation included two irrigations at jointing and anthesis for wheat and two irrigations at sowing and 12-leaf stage for maize. An extra irrigation was applied to summer maize in 2008 and 2009. The three nitrogen levels of the subplots were 180, 240, 300 kg N ha1 for each crop. The experiment began in the fall of 2006 and continued through 2013. For winter wheat, 50% of the N fertilizer was applied at sowing as basal fertilizer, and 50% was applied as topdressing by broadcasting onto the soil surface before irrigation at the jointing stage. For summer maize, 40% of the N fertilizer was applied at sowing, while 60% of fertilizer was applied at the 12-leaf stage. The amount of each irrigation event was approximately 70–80 mm. The local cultivar of winter wheat and maize was planted each season. Winter wheat was sown in mid-October and harvested in early June, followed immediately by the sowing of maize in mid-June and harvesting in early October. Weeds, insect pests, and diseases were properly controlled and the crops were not limited by other nutrients.

2.3. Model Calibration and Evaluation

The DSSAT version 4.6 CSM-CERES-Wheat and CERES-Maize models [30,45] were used to simulate above-ground biomass, grain yield, and canopy nitrogen accumulation at maturity for the field experiments. The model requires daily weather data, soil profile characteristics, crop management data, and genotype coefficients as general inputs. Daily weather data from 1966 to 2015 including daily average, maximum and minimum temperature, precipitation, and sunshine hours were obtained from the weather station located in Gaocheng, China. Daily solar radiation was calculated using daily sunshine hours provided with Weatherman software, DSSAT 4.6 (DSSAT Foundation Team, Gainesville, FL, USA). The data of Yang et al. [46] were used to establish soil profile characteristics including lower limit, drained upper limit and saturated water holding capacity for different soil depths. The cultivar coefficients required to run the DSSAT-Wheat and Maize models are shown in Table 1 and Table 2. A standard iterative calibration procedure was used to estimate the genetic coefficients that minimized error in grain yield at maturity. Genetic coefficients were calibrated using full irrigation treatments. Following calibration, the model was evaluated using the limited irrigation treatments.

2.4. Systematic Exploration of Management Options of Irrigation and Nitrogen

After calibration and evaluation of the genetic coefficients, the DSSAT-CERES-Wheat and -Maize models were used to explore systematically and comprehensively how different management practices affect long-term yield and water footprint. The goal was to determine the best management practices that give a lower water footprint while maintaining an acceptable long-term yield. A weather dataset from Gaocheng, China, including daily minimum and maximum air temperatures, daily precipitation, and solar radiation from 1966 to 2015 was available for this analysis. The wheat cultivar and maize cultivar used for calibration and evaluation were used in the long-term simulations. The use of the fixed cultivars eliminates the impacts of other factors, and enables the investigation of the impact of climate variability and nitrogen as well as water supply levels on crop growth [47]. Table 3 shows the management scenarios that were simulated from 1966–2015.
In scenario 1, the five irrigation treatments were zero, one (80 mm at sowing), two (80 mm at sowing and 80 mm at jointing), three (80 mm at sowing, 80 mm at jointing and 80 mm at anthesis) and four (80 mm at sowing, 80 mm at jointing, 80 mm at anthesis and 80 mm at grain filling) times irrigations for winter wheat. The rotated maize was simulated with two irrigations (80 mm at sowing and 80 mm at 12-leaf expansion). In scenario 3, there were zero, one (80 mm at sowing), two (80 mm at sowing and 80 mm at 12-leaf expansion), three (80 mm at sowing, 80 mm at 12-leaf expansion and 80 mm at tasseling) and four (80 mm at sowing, 80 mm at 12-leaf expansion, 80 mm at tasseling and 80 mm at grain filling) times irrigation treatments for maize. In the rotation, the wheat was simulated with two irrigations (80 mm at jointing and 80 mm at anthesis). In scenarios 2 and 4, the crop was simulated with two irrigations at jointing and anthesis for wheat, and at sowing and 12-leaf expansion for maize. In all scenarios, 50% of N fertilizer was applied at sowing as basal fertilizer for both wheat and maize, and 50% of was applied at jointing for wheat, and at 12-leaf expansion for maize.

2.5. Water Footprint Calculation Methods

The water footprint (WF) of crop production was defined as the sum of green water footprint (WFgreen), blue water footprint (WFblue) and grey water footprint (WFgrey) of the wheat-maize cropping system. Green water footprint refers to consumption of water stored in the root zone as a result of precipitation. WFgreen was computed by comparing evapotranspiration (ET) simulated by the model against the cumulative precipitation (P) during the growing season [15]. Blue water footprint was defined as the consumption of surface and groundwater from irrigation. In this study, it refers to loss of available water extracted from groundwater. The WFgreen and WFblue were calculated as:
W F = W F green + W F blue + W F grey
W F green = W green Y
W F blue = W blue Y
W green = 10 ×   min ( E T , P )
W blue = 10 × irrigation
where WF is the total WF of crop production, with a unit of m3 t1; WFgreen is the green WF; WFblue is the blue WF; Wblue is the blue water evapotranspiration (mm); ET is the water evapotranspiration (mm); P is the precipitation (mm), Y is the crop yield (t ha1).
Grey water footprint refers to the freshwater required to assimilate the load of pollutants, and it expresses the degradative water use. In this study, Nleaching was computed by the crop models and the grey water footprint was computed as the water required to assimilate N lost below the root zone for each crop and season. The permissible concentration of N in drinking water is 10 mg L1. The WFgrey was defined as the ratio of degradative water use over the crop yield:
W F grey = W grey Y
W grey = N leaching ρ 0 ρ nat
where WFgrey (m3 ha1) is the grey WF; Wgrey (m3 ha1) is the degradative water use; Nleaching (kg ha1) is the amount of N leaching; ρ 0 is the maximum acceptable concentration (10 mg L1); ρ nat is the concentration in natural water, assumed to be 0 mg L−1.

2.6. Statistical Analysis

To quantify the goodness of fit of the model, four common statistical indicators were used: root mean square errors (RMSE), normalized root mean square errors (nRMSE), mean error (ME), and index of agreement (d value) [48,49].
R M S E = i = 1 n ( S i M i ) 2 n
n R M S E = R M S E M avg
M E = 1 n i = 1 n ( S i M i )
d = 1 i = 1 n S i M i i = 1 n ( | S i M avg | + | M i M avg | )
where n is the total number of data points, S and M represent the simulated and measured values, and Mavg is the average of measured values.
It is generally agreed that the model performance is excellent when its value of nRMSE is less than 10%, good when it is between 10–20%, fair when between 20–30%, and poor when greater than 30% [50].
Correlation analysis was used to relate the parameters among grain yield, N leaching, ET, annual water footprint, and agricultural inputs to assess the possible factors affecting crop productivity and water footprint. The ‘agricolae’ package [51] was used to perform this analysis using R version 3.3.2 (R Foundation for Statistical Computing, Vienna, Austria). We used the structural equation model (SEM) to explore the pathways of how nitrogen and irrigation affected annual water footprint using R package ‘lavaan’ [52].

3. Results

3.1. Model Calibration and Evaluation

The winter wheat and summer maize experiments under full irrigation over 7 years were chosen to calibrate the genetic coefficients in the crop models. The genetic coefficients for wheat and maize after calibration are shown in Table 1 and Table 2, respectively. Table 4 shows the resulting simulated and observed yields after calibration. Simulated yield of winter wheat agreed well with observations with a normalized nRSME < 10% and a d-index greater than 0.84 across different nitrogen treatments under full irrigation. Although the simulated yield of summer maize was a little lower than observations, the performance of the calibrated DSSAT-Maize model was considered as acceptable with a normalized nRSME < 10% and a d-index close to 1 across different nitrogen treatments under full irrigation. These results indicated that the model was able to accurately simulate the production of winter wheat and summer maize rotation response to different nitrogen treatments in North China Plain.
The observed data with different nitrogen treatments under limited irrigation over 7 years were used to evaluate the model for the study area (Table 4). The d-index for simulated and observed winter wheat grain yields ranged from 0.70 to 0.86, for the three nitrogen treatments, and the nRSME was approximately 12%. The d-index and nRSME of summer maize ranged from 0.71 to 0.84, and from 8.49% to 11.09%, respectively. The DSSAT-Wheat and -Maize simulated the grain yield of winter wheat and summer maize rotation for the evaluation dataset with reasonable accuracy.
The overall results indicate that the model simulated wheat and maize yield response to N and irrigation strategies very well. The nRMSE and d-index were 12.55% and 0.99 (n = 21) for winter wheat, and 9.80% and 1.00 (n = 21) for summer maize under limited irrigation. The values of nRMSE and d-index under full irrigation were 7.69% and 0.87 for winter wheat, and 8.66% and 1.00 for summer maize. The models gave good results in simulating the growth of winter wheat and summer maize with different nitrogen fertilizations under limiting irrigation condition compared to field data collected from 2006–2013. However, there was a slight underestimation of summer maize yield under full irrigation (Table 4). Though some deviations were found between simulated and observed yield under the full irrigation condition, the statistical analysis of the performance indicators showed that the deviations were acceptable. It can thus be used to investigate the effects of irrigation and nitrogen fertilizer on productivity and water balance of winter wheat and summer maize rotation at the study site.

3.2. The Effect of Management on Water Footprint

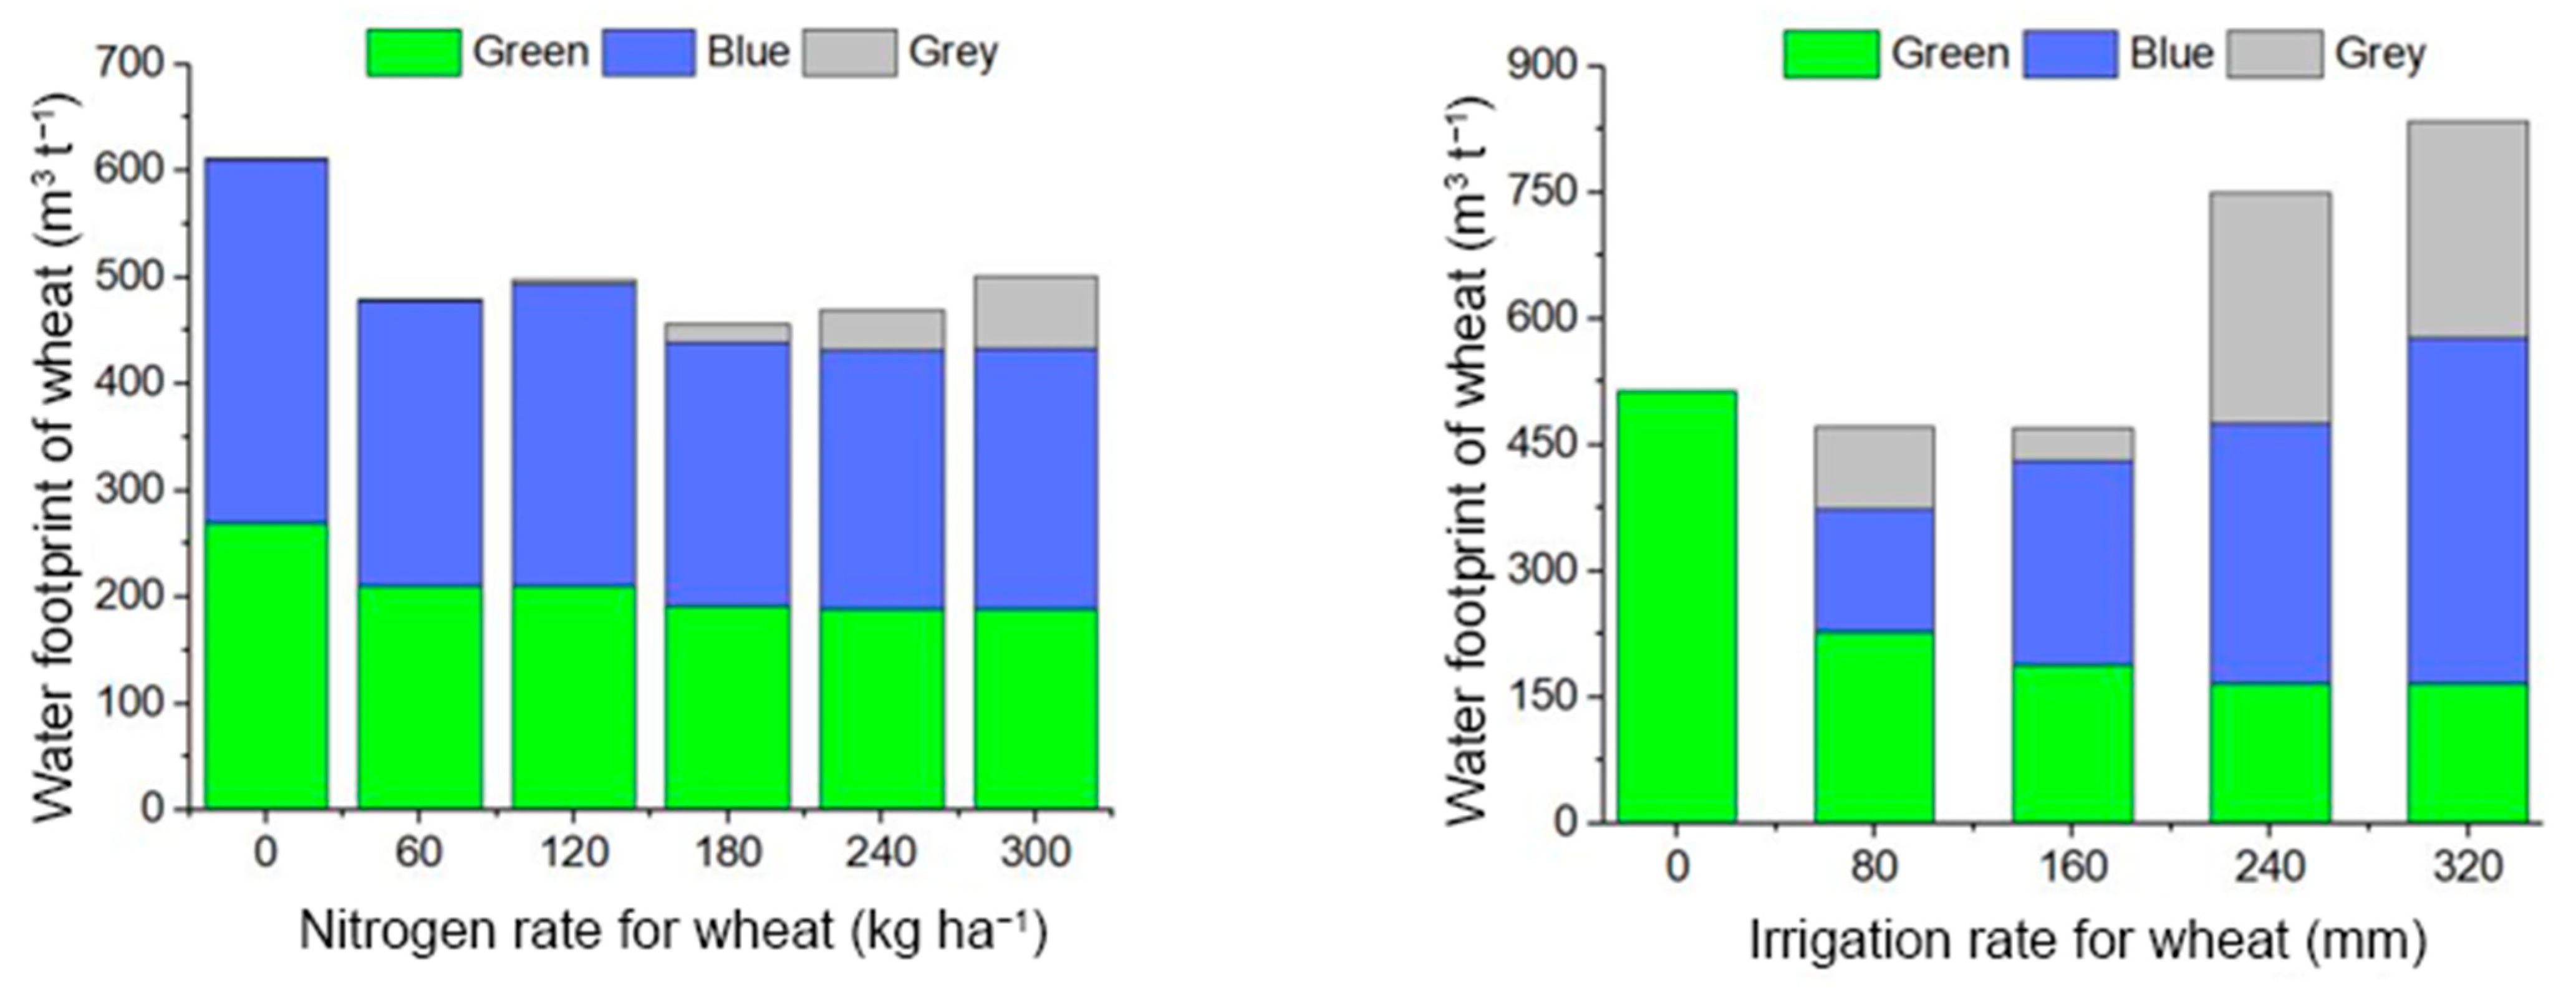
3.2.1. The Impact of Winter Wheat N and Irrigation Management on the Water Footprint of Winter Wheat

The water footprint was computed for different N strategies for winter wheat resulting from model runs using weather data from 1966–2015 and the calibrated cultivar coefficients. For these runs, irrigation was 160 mm at jointing and anthesis. Figure 2 shows the response of the long term average wheat water footprint to nitrogen rate and irrigation, respectively. The green and blue water footprint of winter wheat declined with increasing nitrogen rate, resulting in a decrease in the total water footprint for N rates less than 180 kg N ha1. As N rates increased above 180 kg ha1, the grey water footprint tended to increase, thus increasing the total water footprint of wheat.
A second analysis was run for wheat using 240 kg N ha1 and different irrigation amounts. The results showed that the response of the blue and green water footprint to irrigation rates were different. With increasing irrigation amounts, the blue water footprint of winter wheat increased, while the green water footprint decreased. When the irrigation amount was more than 160 mm, the green water footprint was less than the blue water footprint. The grey water footprint increased irregularly with irrigation. The minimum total water footprint was achieved with 160 mm of irrigation. When irrigation was more than 160 mm, the total water footprint increased due to the increase of blue and grey water footprint.

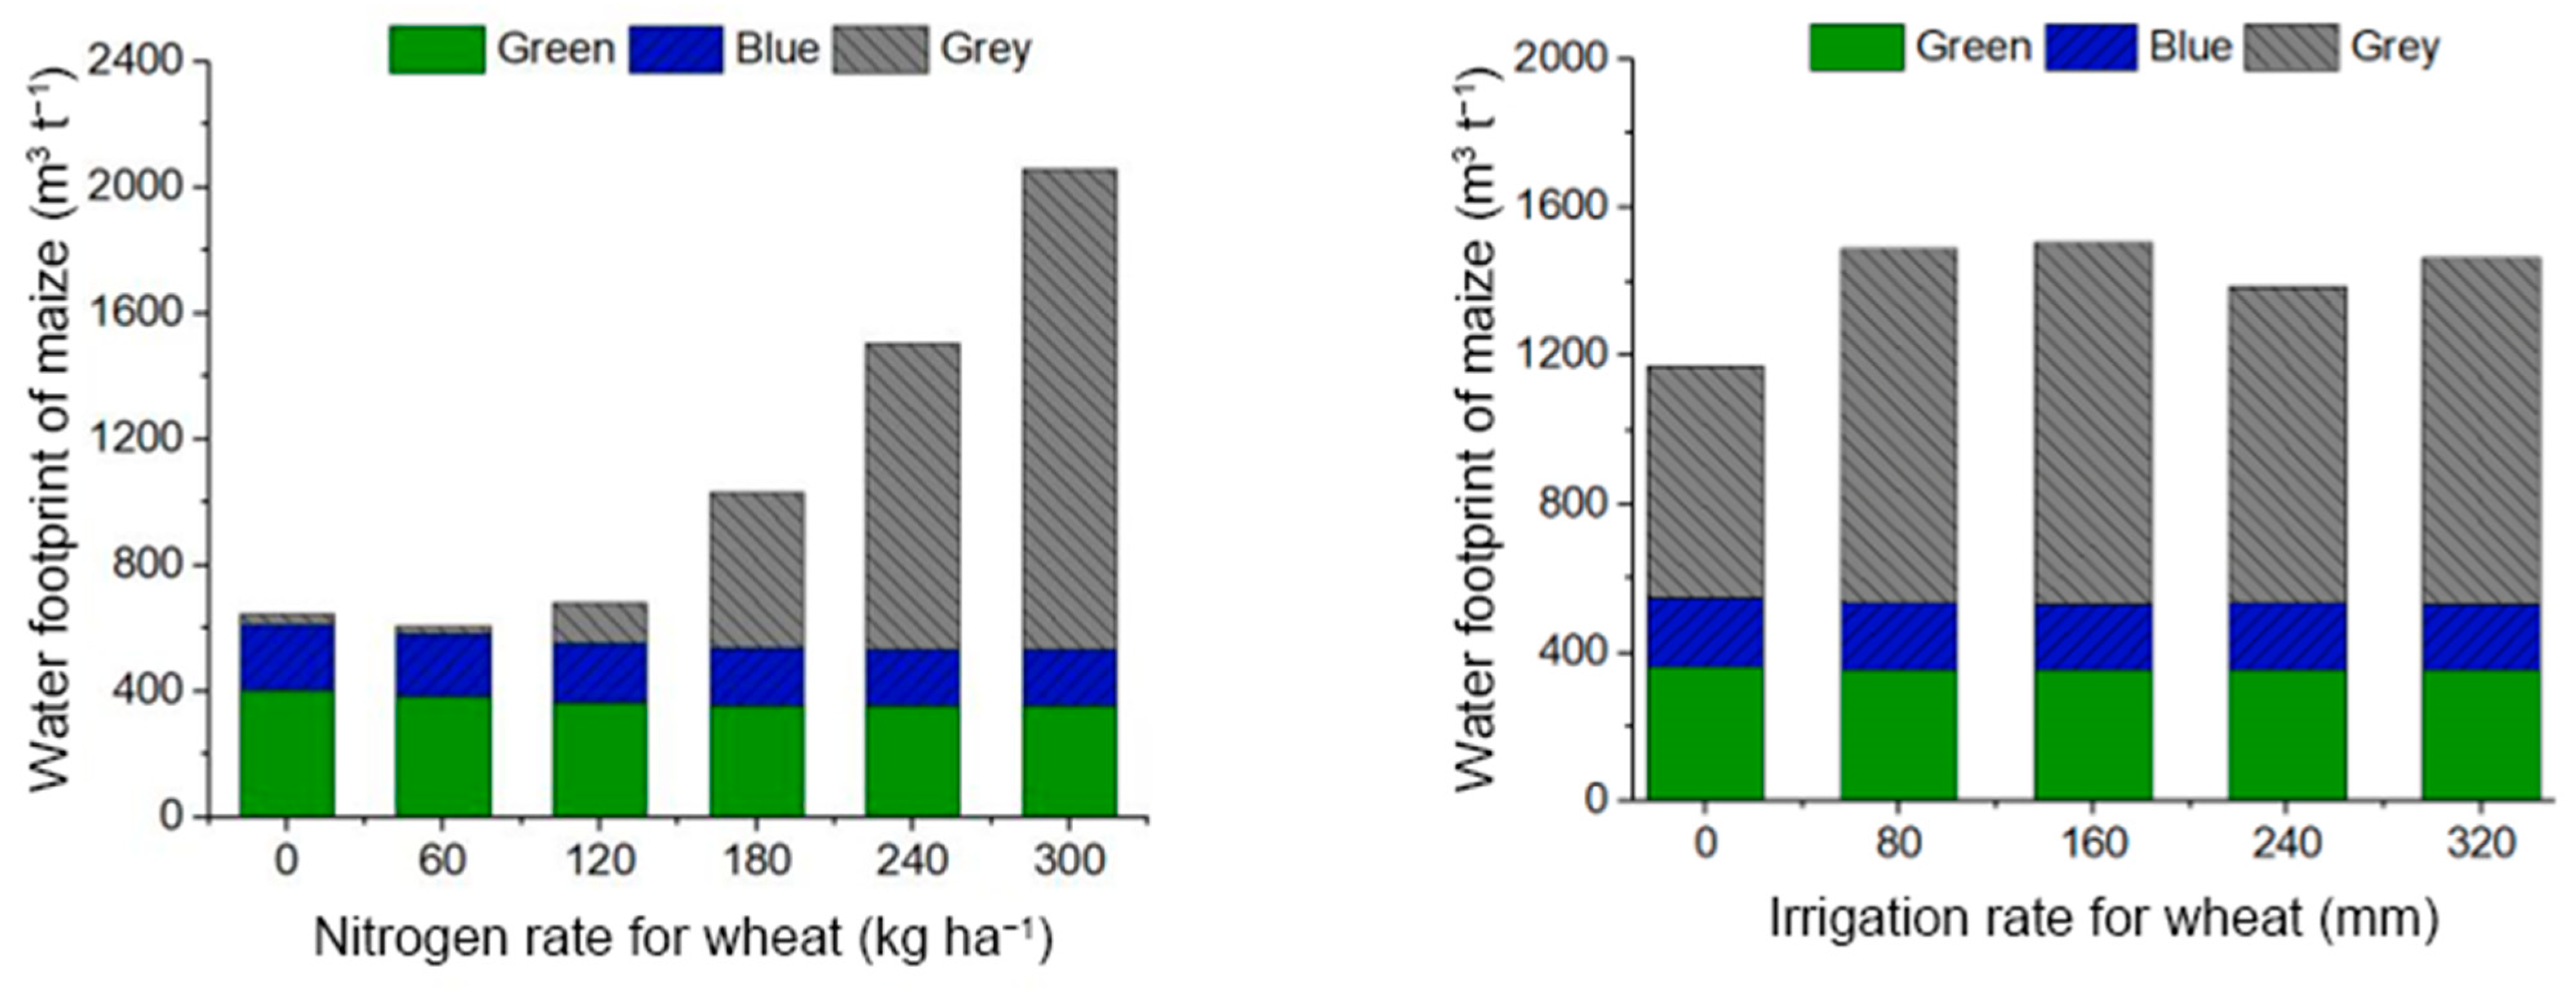
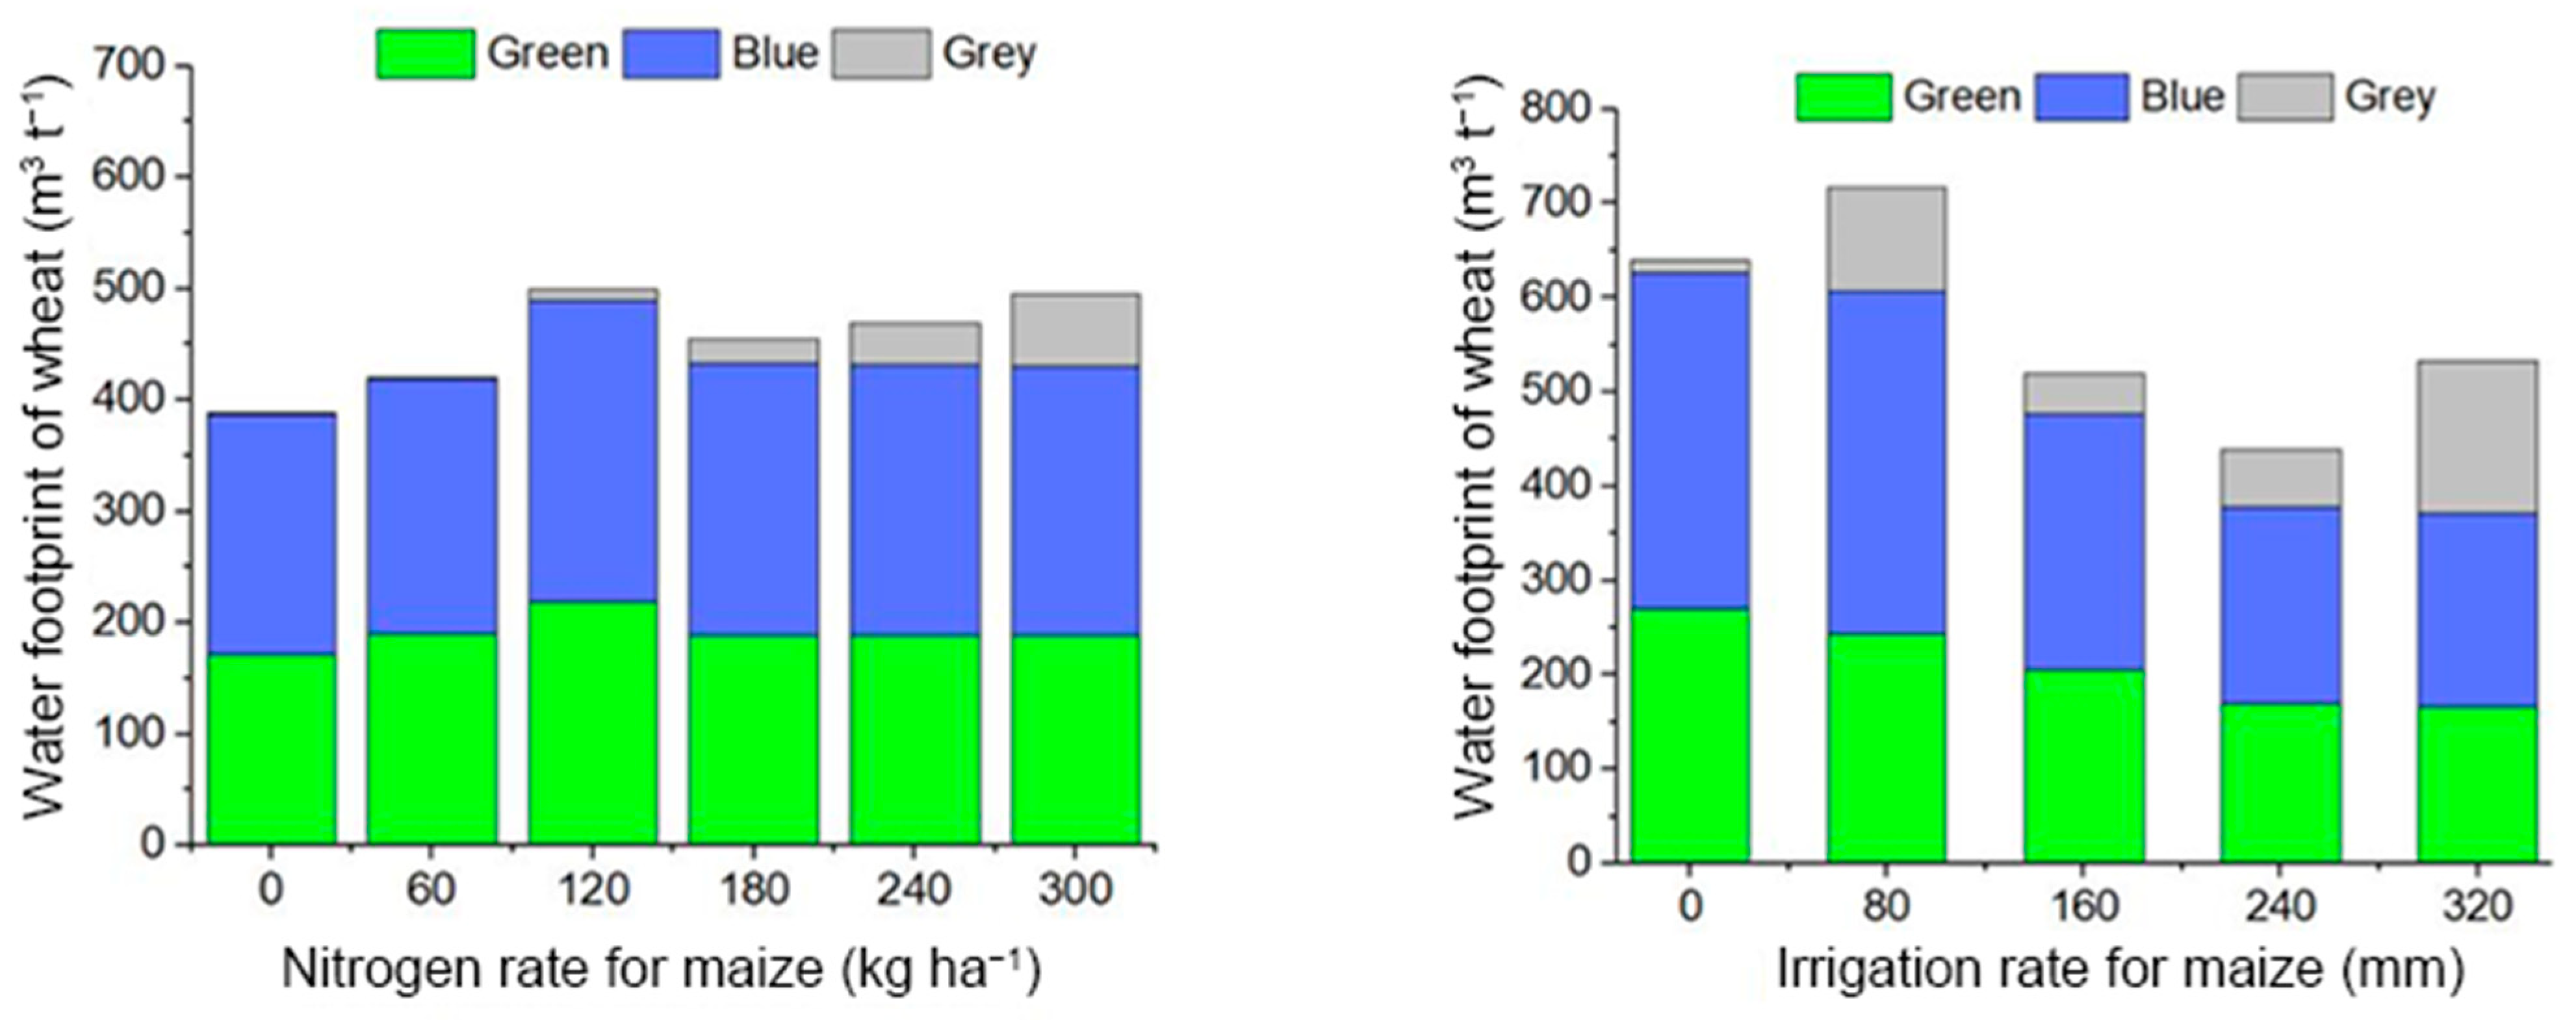
3.2.2. The Impact of Winter Wheat Irrigation and N Management on the Water Footprint of Summer Maize

The water footprint of summer maize was also affected by nitrogen rate applied to winter wheat (Figure 3). When summer maize was planted in rotation using a nitrogen rate of 240 kg ha1, the green and blue water footprint declined with increasing nitrogen rate applied to winter wheat. When the N rate applied to winter wheat was more than 120 kg ha1, the grey water footprint of summer maize increased, and thus the total water footprint increased dramatically. This suggested that excessive application of nitrogen fertilizer to winter wheat resulted in more nitrogen leaching to groundwater in the summer maize season.
The response of the water footprint of summer maize to different irrigation amounts applied to winter wheat is also shown in Figure 3. The green and blue water footprint for summer maize was not affected by irrigation applied to winter wheat. However, the grey water footprint of summer maize increased irregularly with winter wheat irrigation amounts. The total water footprint showed a similar tendency to the grey water footprint.

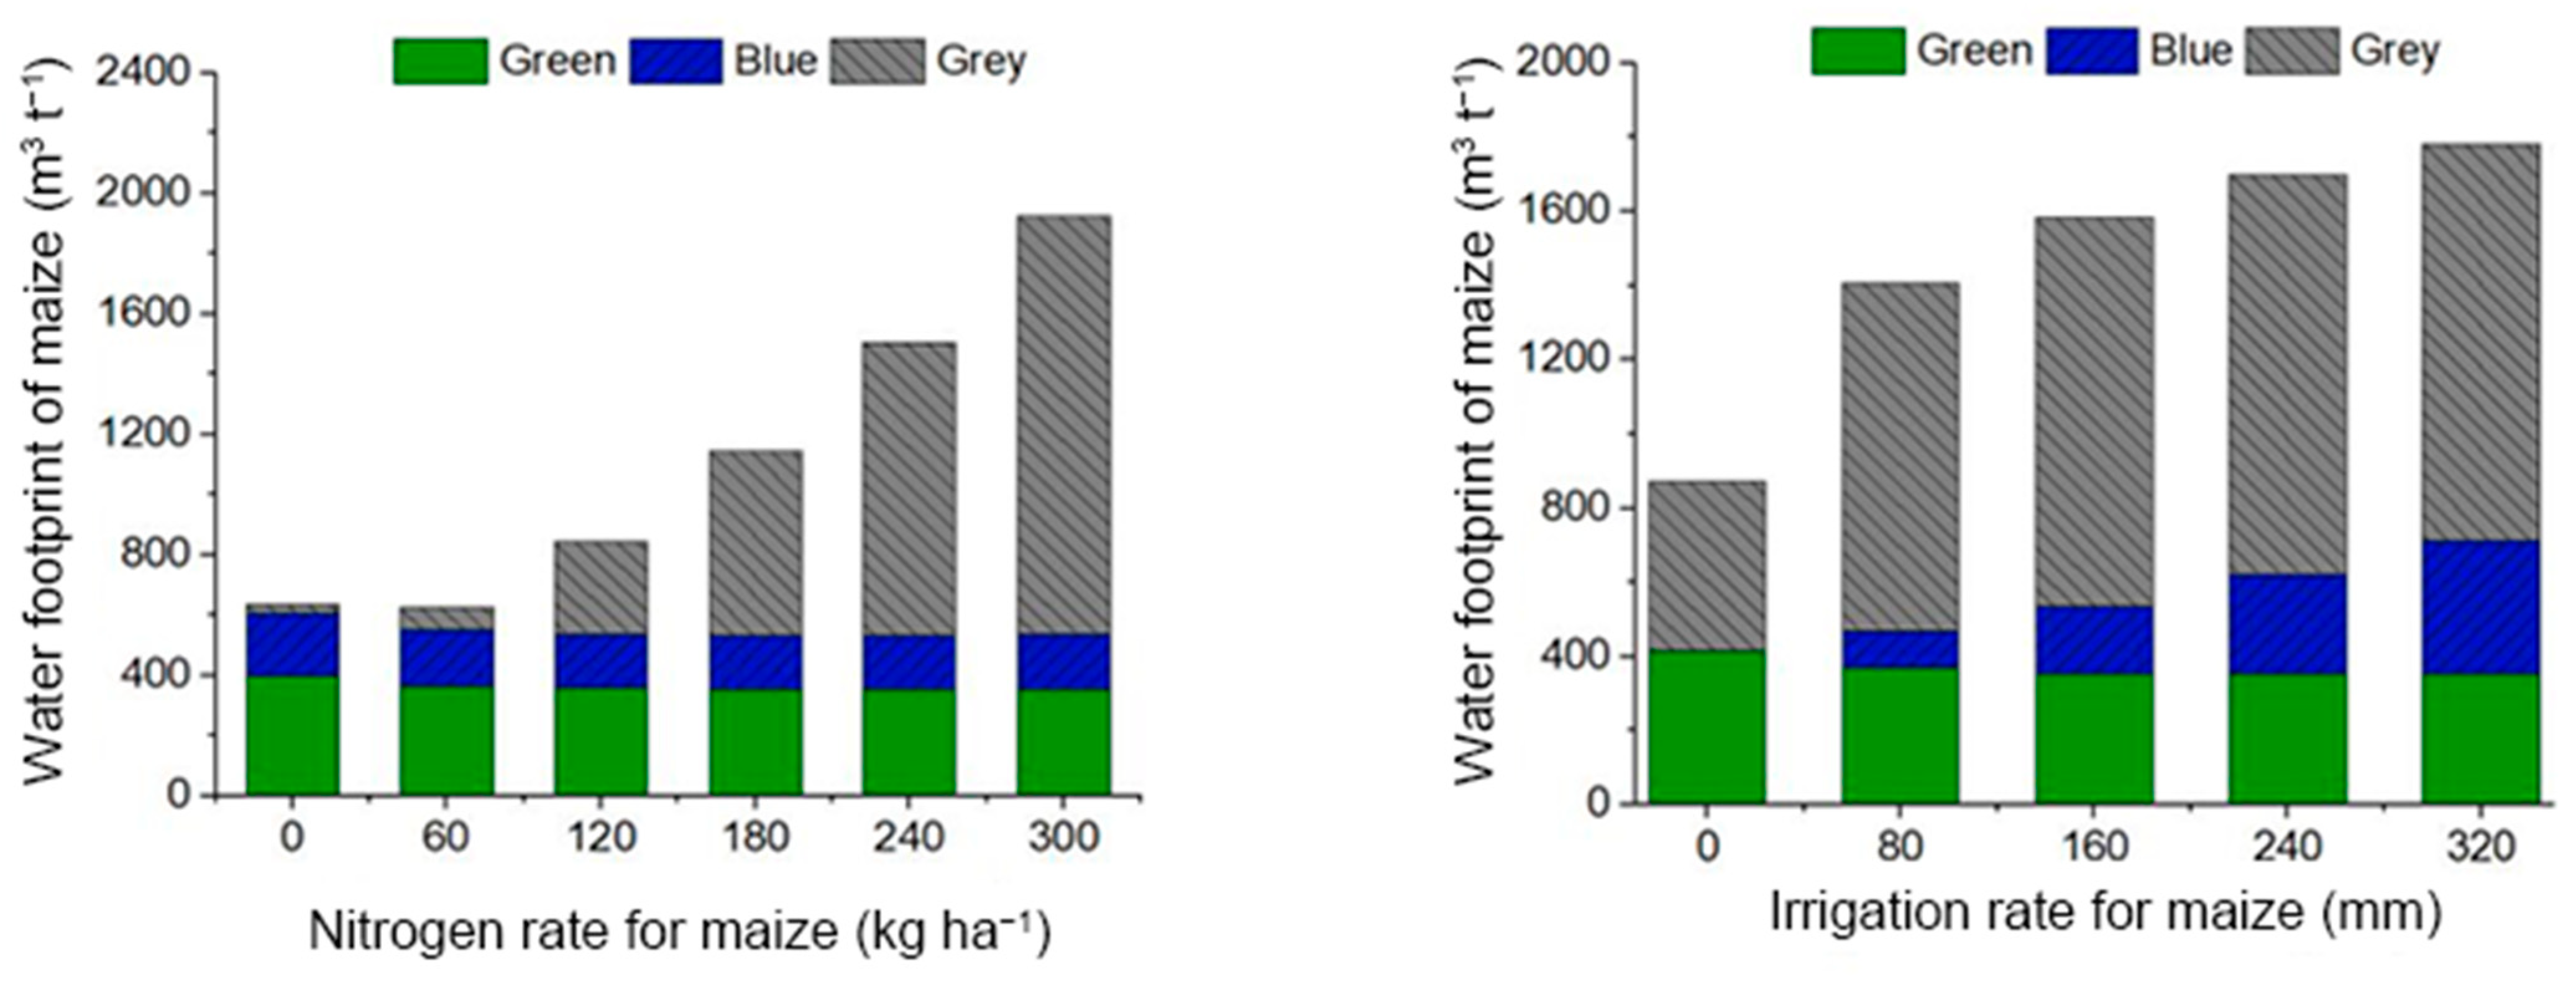
3.2.3. The Impact of Summer Maize Irrigation and N Management on the Water Footprint of Summer Maize

Water footprint components were simulated for summer maize using different N and irrigation levels for each of the 48 growth seasons (1967–2015) to assess the impact of nitrogen and irrigation (Figure 4) on the water footprint of summer maize. The green and blue water footprint declined with an increase in nitrogen rate; however, the grey water footprint, and thus the total water footprint, increased substantially with N levels above 60 kg ha−1.
The water footprint of summer maize generally increased with increasing irrigation applied to summer maize with an N application of 240 kg N ha1. There was a linear increase in blue water footprint of summer maize with increased irrigation rate in summer maize. The grey water footprint increased from 455 to 1049 m3 t1 when the amount of irrigation increased from 0 to 160 mm. When the amount of irrigation exceeded 160 mm, the grey water footprint remained stable.

3.2.4. The Impact of Summer Maize Irrigation and N Levels on the Water Footprint of Winter Wheat

The water footprint was dominated by many factors, including grain yield, and green, blue as well as grey water. Figure 5 shows the response of the winter wheat water footprint to different nitrogen and irrigation levels applied to summer maize. Compared with the treatment with no nitrogen fertilizer in summer maize, the total water footprint of winter wheat increased slightly, primarily due to increases in the grey water footprint of winter wheat with increases of nitrogen rate applied to summer maize.
The green, blue and total water footprint of winter wheat declined under increasing levels of irrigation applied to summer maize. The green, blue and total water footprint was higher when maize irrigation was less than 80 mm, because grain yield of winter wheat was decreased by drought stress. When the irrigation amount in maize increased from 80 to 240 mm, the green, blue, grey and total water footprint of winter wheat declined.

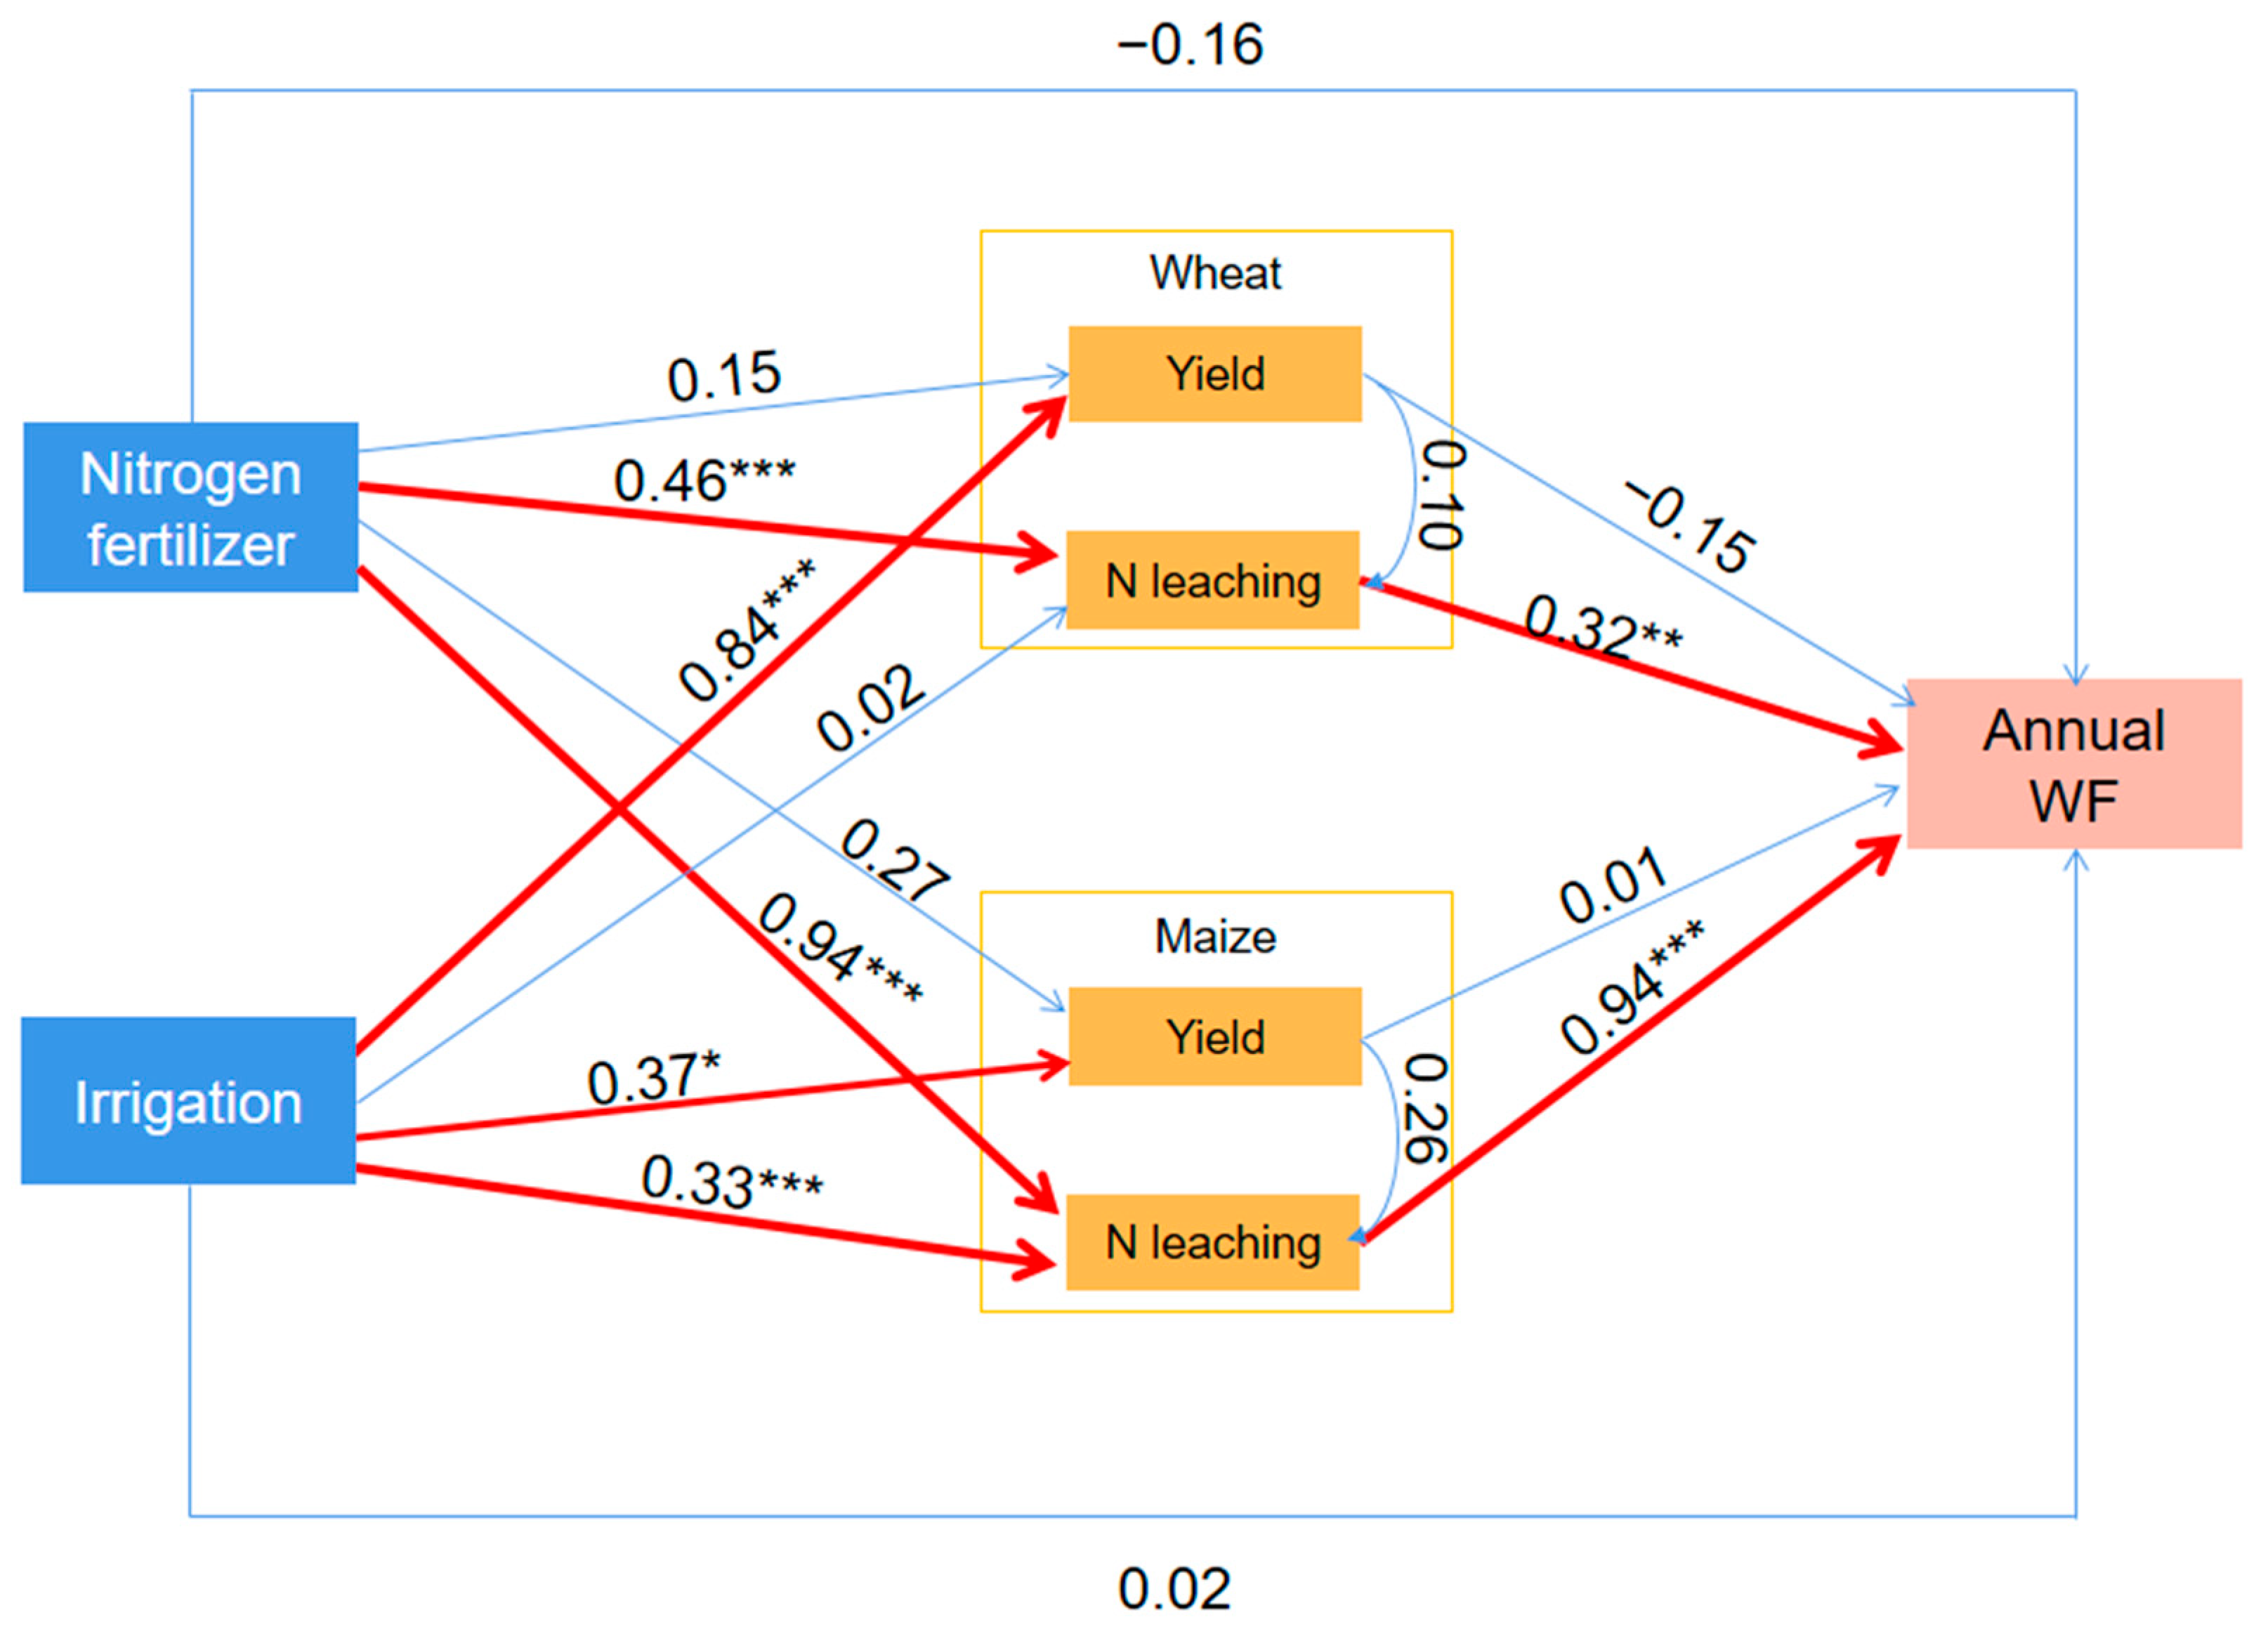
3.3. Managements Factors Influencing Average Water Footprint

A correlation analysis was conducted among different management factors related to crop yield and water footprint. The results showed that the annual water footprint was significantly positively correlated to annual nitrogen rate (R = 0.90, p < 0.001), but not related to annual irrigation (Table 5). Grain yield and N leaching of both wheat and maize showed positive correlation to annual water footprint. The structural equation model (SEM) showed that the positive effect of nitrogen on annual water footprint was mainly through its positive effect on N leaching of wheat and maize (Figure 6). Although the annual water footprint was not significantly correlated to annual irrigation, the SEM showed that irrigation also had an effect on the annual water footprint by N leaching of maize (Path coefficient = 0.33, p < 0.001). Note that grain yield of wheat and maize, which showed positive correlation to annual water footprint, was eliminated from the SEM as a significant indicator of annual water footprint. The SEM also showed that irrigation did not directly affect annual water footprint (path coefficient = 0.02, p > 0.05). All the results indicated that the annual water footprint in North China Plain was more sensitive to the grey water footprint.

4. Discussion

4.1. Evaluation of Methodology

Benchmarks for the water footprint of crop production can serve as a reference for setting water footprint reduction targets [17]. Lu et al. [53] studied the water footprint over 35 years at the field level in the North China Plain, and indicated that the water footprint of winter wheat was 890 m3 t1. Zhuo et al. [17] explored the water footprint of winter wheat at the national level and suggested that the average water footprint of winter wheat was 841 m3 t1 for humid areas in China. Mekonnen and Hoekstra [27] systematically analyzed the crop water footprint at a 5 by 5 min spatial resolution globally based on FAOSTAT data (1996–2005), and reported that the water footprint of maize in Hebei, the main part of NCP, was 1218 m3 t1. Lu et al. [53] reported that the water footprint of maize in NCP was 700 m3 t1. This range of values was probably because there were differences in soil properties, weather, crop characteristics, and leaching-runoff fraction of nitrogen, etc., among the sites of different studies [8]. Note that Lu et al. [53] used 4.35% of nitrogen fertilizer to estimate the grey water footprint, but Mekonnen and Hoekstra [27] used 10%. A fixed percentage of nitrogen fertilizer to estimate the grey water footprint is reasonable when estimated at the regional level, but may be inappropriate if the aim of the study is to optimize management practices at specific sites [25]. This study showed that the CERES-Wheat and -Maize model can simulate the productivity, water and nitrogen balance of winter wheat and summer maize rotation at the study site. Thus, the DSSAT model can be used to investigate the response of wheat and maize water footprint to irrigation and nitrogen. This study provides an example of such analysis for a representative site, through combination of field measurement data, cropping systems modelling, and scenario analysis.

4.2. The Effect of Managements on Water Footprint

The water footprint includes direct and indirect water consumption, as well as their environmental effects. The quantification of water footprint of crop production will contribute to the assessment of agricultural water utilization. The winter wheat-summer maize double cropping is a main rotation system in NCP. We found that the irrigation and N management strategies impact the water footprints for both the maize and wheat crops. Thus, integrated research on water footprint of wheat and maize is necessary in NCP.
The results of this study showed a significantly positive relationship between annual water footprint and grain yield (Table 5). Lu et al. [53] indicated that the increase in farm inputs, such as nitrogen fertilizer and irrigation, contributed greatly to the increase of water footprint in NCP. This means that increase in grain yield was accompanied by an increase in the water footprint. In our study, we found that the positive effect of nitrogen fertilizer and irrigation on annual water footprint was mainly through its positive effect on N leaching in both wheat and maize (Figure 6). Liu et al. [54] and Lu et al. [55] reported the decreasing marginal benefit of nitrogen and irrigation resulting in smaller yield increase. Thus, excessive nitrogen accumulates in soil, and the residual N moves out of root zone when there is higher rainfall or full irrigation. According to the water footprint theory, grey water footprint refers to the volume of water that is required to assimilate waste nutrients based on existing ambient water quality standards [27,56]. The results of this study showed that the annual water footprint in North China Plain was very sensitive to grey water footprint. These results suggested that reducing the grey water footprint was a way to decrease the annual water footprint in NCP.
In our study, we found that the water footprint of wheat increased with the increase of nitrogen rate, but the increments of total and grey water footprint of maize by increasing nitrogen fertilizer in maize were higher than those of wheat. This was due to higher NO3-N leaching that occurred in the maize season than that in wheat season due to more leaching out of the root zone under higher rainfall occurring during summer [57]. Li et al. [58] reported that the average NO3-N leaching losses during wheat-maize seasons were 6 and 58 kg NO3-N ha1 year1 for 200 and 400 kg N ha1 year1 of the nitrogen fertilization, respectively. This study showed similar result to those in previous studies, with the annual average NO3-N leaching losses 2.5 and 57.2 kg NO3-N ha1 year1 for the nitrogen rates 240 and 420 kg N ha1 year1, respectively. The results of this study also showed that the grey water footprint of maize increased linearly when the nitrogen rate applied to maize exceeded 60 kg ha1. A similar result of increasing N leaching of maize due to increased nitrogen in NCP was obtained by Wang et al. [59]. The water footprint of summer maize was also significantly affected by the nitrogen rate applied to winter wheat (Figure 2). Previous research indicated that because of limited rainfall and irrigation, N applied during the winter wheat season primarily accumulated in soil, and NO3-N leaching out of the root zone is negligible under limited irrigation scheduling. However, this residual N is highly susceptible to leaching out of the root zone during the summer maize season due to higher rainfall [60,61,62]. These results indicated that farmers should first try to reduce the nitrogen rate applied during the maize season, but the nitrogen rate applied to wheat should also be considered.
The results of this study showed that the blue, grey and total water footprint of wheat and maize increased with an increase in irrigation. The increase in water footprint with increasing irrigation was higher than that with increasing nitrogen for wheat. This means that soil water becomes more limiting in the water footprint of wheat than nitrogen. It can also be seen in Figure 5 that residual nitrogen and water of maize affected the water footprint of wheat. For instance, when the irrigation amount for maize increased from 80 to 240 mm, the green, blue, grey, and total water footprint of wheat significantly declined. However, the total water footprint of wheat increased slowly with increases in the nitrogen rate for maize.
The correlation analysis indicated that grain yields of wheat and maize were positively correlated to irrigation. Thus, the grain yields of wheat and maize increased with increasing irrigation. The positive effect of irrigation on the annual water footprint was mainly through its positive effect on N leaching in maize, but not on grain yield and N leaching in wheat. Irrigation of 160 mm for wheat can maintain a high grain yield, and furthermore, 70% of the annual precipitation typically occurring in the maize season will satisfy the water demand of maize in most years, so the irrigation amount during maize season can likely be reduced in order to reduce the annual water footprint in reduced irrigation cropping systems.

4.3. Optimization of Fertilizer Strategies

Chen et al. [63] and Ma et al. [64] reported that to achieve maximum water productivity, approximately 1–3 irrigations were recommended for wheat in different weather seasons, and 0–2 irrigations were recommended for maize in the NCP. Typical production practices in the NCP include 3 irrigations for winter wheat and 1–2 irrigations for maize [65]. China is targeting a 30% reduction in irrigation and zero growth in the use of chemical fertilizers and pesticides by 2020 to avoid further damage to the environment [66]. Thus, it is urgent to explore reduced irrigation strategies that will maintain yield and further increase water use efficiency. Sun et al. [67] reported that minimum irrigation applied at sowing for wheat and maize will result in lower crop productivity and increased inter-annual variability in crop yields. This study showed that 160 mm irrigation produced a minimum total water footprint for wheat. However, because soil water content was significantly lower after wheat harvest, maize was irrigated immediately after sowing to ensure seed germination. Therefore, irrigation applied at sowing and jointing for winter wheat and at sowing for maize may be the best water-saving strategy.
In order to explore a further reduction of the water footprint in NCP, we simulated the response of wheat and maize to different nitrogen treatments under water-saving irrigation conditions. Table 6 shows that the grain yield and marginal return of both wheat and maize decreased with the reduction in nitrogen rate of wheat. This response was significantly affected by maize nitrogen application. Increasing the nitrogen rate in maize contributes to an increase in the grain yield and marginal return of wheat. Winter wheat can grow much deeper roots than maize. Thus, the deep-rooted winter wheat could be able to recover nitrogen from deeper soil layers than maize. Note that the loss in yield and marginal return of winter wheat due to reduce N rate cannot be compensated by increasing the maize N rate, because the recovery of residual N was so much lower (only 4.9% to 8.7%) for winter wheat [68]. This can also be seen in Table 6. For instance, treatment 3 produced 88.87% of the grain yield of treatment 7, although the N rates of treatment 3 and 7 both were 300 kg ha1.
The water footprint of wheat and maize decreased with decreasing nitrogen rates. The application of N 240 kg ha1 to wheat followed by 60 kg ha1 to maize produced the minimum water footprint for the wheat-maize rotation (Rwheat + Rmaize = 2). This would likely be the best strategy if the management objective was to have a lower water footprint. Table 5 also shows that different performance criteria led to different ranking. Based on grain yield and marginal return, nitrogen application of 240 kg ha1 to wheat followed by 150 and 240 kg ha1 to maize were the best systems (Rwheat + Rmaize = 3). Yield stability of cropping systems may be more important than yield maximization [69]. According to this criterion, applying 240 kg ha1 to wheat followed by 60 kg ha1 to maize was the most stable system (Rwheat +Rmaize = 7). Taking grain yield, marginal return and water footprint into consideration, the sequence analysis indicated that the application of N 240 kg ha1 to wheat followed by 60 kg ha1 to maize (No. 7) produced the minimum water footprint and higher grain yield and marginal return. Zhao et al. [4] suggested that application of 150 kg ha1 to wheat followed by 180 kg ha1 to maize can maintain the potential productivity of grain yield and have the minimum impact on the environment in NCP using the APSIM model. Liu et al. [70] reported that the recommended nitrogen application rate was 107 kg ha1 for wheat and 99 kg ha1 for maize. Soil mineral N content is a critical guide to maximize maize yield, and a minimum soil N concentration of 6.1 mg kg–1 was recommended at sowing in the rotation system [71]. In this study, the results also showed the annual water footprint in North China Plain was very sensitive to grey water footprint of summer maize. The grey water footprint of maize increased linearly when the nitrogen rate applied to maize exceeded 60 kg ha1. The application of 240 kg ha1 to wheat followed by 60 kg ha1 to maize (No. 7) may be the best management strategy.

5. Conclusions

The winter wheat-summer maize double cropping is the primary cropping system in the North China Plain (NCP), and thus integrated research on the water footprint of wheat and maize is necessary. In this study, the DSSAT-CERES-Wheat and -Maize model was used to evaluate grain yield and water footprint in the double cropping system of winter wheat and summer maize based on 48 years of historical weather data in NCP. It was found that the increase in N inputs contributed greatly to the increase in water footprint, mainly through the grey water footprint. Management practices (i.e., N application) in winter wheat affected the water footprint of summer maize. The response of the water footprint of wheat to nitrogen and irrigation was different from that of maize. Based on the simulation results, 240 mm water-saving irrigation with 300 kg ha1 of nitrogen (240 kg N ha1 for wheat and 60 kg N ha1 for maize) can maintain higher grain yield and have a lower water footprint and thus, lower impact on the environment. For the NCP, the water footprint of wheat and maize can be improved by following improved irrigation and nitrogen management strategies.

Author Contributions

Methodology, D.Z.; software, D.Z.; validation, D.Z., D.L. and W.D.B.; formal analysis, D.Z. and D.L.; investigation, H.L. and H.W.; data curation, D.L. and J.L.; writing—original draft preparation, D.Z.; writing—review and editing, D.L., R.L. and H.J.; supervision, Y.L. and W.D.B. All authors have read and agreed to the published version of the manuscript.

Funding

This research was funded by China Agriculture Research System (CARS-03-05), by National Science and Technology Support Program of China “The science and technology engineering for grain bumper harvest” (2013BAD07B05), and by National Key Special Program of China “Technological innovation for grain bumper harvest and high income” (2017YFD0300909), and by Natural Science Foundation of Yangling Vocational and Technical College (BG202005), and by National Key Research and Development Program of China (2021YFD1901004-2), and by the National Institute of Food and Agriculture, U.S. Department of Agriculture, Hatch project (ALA014-1-16016), and by the China Scholarship Council.

Institutional Review Board Statement

Not applicable.

Informed Consent Statement

Not applicable.

Data Availability Statement

All data supporting the results of this study are included in the manuscript and datasets are available upon request.

Acknowledgments

We are grateful to the laboratory staff and the undergraduate students Qin Fang, Shuai Cui and Tian Lv of the Hebei Agricultural University for their contributions. The valuable comments of the editor and anonymous reviewers are greatly acknowledged.

Conflicts of Interest

The authors declare no conflict of interest.

References

  1. Wang, J.; Wang, E.L.; Yang, X.G.; Zhang, F.S.; Yin, H. Increased yield potential of wheat-maize cropping system in the North China Plain by climate change adaptation. Clim. Change 2012, 113, 825–840. [Google Scholar] [CrossRef]
  2. Carberry, P.S.; Liang, W.L.; Twomlow, S.; Holzworth, D.P.; Dimes, J.P.; McClelland, T.; Huth, N.I.; Chen, F.; Hochman, Z.; Keating, B.A. Scope for improved eco-efficiency varies among diverse cropping systems. Proc. Natl. Acad. Sci. USA 2013, 110, 8381–8386. [Google Scholar] [CrossRef] [PubMed] [Green Version]
  3. Chinese Statistical Bureau. China Statistical Yearbook; China Statistics Press: Beijing, China, 2016. [Google Scholar]
  4. Zhao, Z.G.; Qin, X.; Wang, E.L.; Carberry, P.; Zhang, Y.H.; Zhou, S.L.; Zhang, X.Y.; Hu, C.S.; Wang, Z.M. Modelling to increase the eco-efficiency of a wheat-maize double cropping system. Agric. Ecosyst. Environ. 2015, 210, 36–46. [Google Scholar] [CrossRef]
  5. Zhao, J.; Zhang, X.P.; Yang, Y.D.; Zang, H.D.; Yan, P.; Meki, M.N.; Doro, L.; Sui, P.; Jeong, J.; Zeng, Z.H. Alternative cropping systems for groundwater irrigation sustainability in the North China Plain. Agric. Water Manag. 2021, 250, 106867. [Google Scholar] [CrossRef]
  6. Xu, Y.J.; Huang, K.; Yu, Y.J.; Wang, X.M. Changes in water footprint of crop production in Beijing from 1978 to 2012: A logarithmic mean Divisia index decomposition analysis. J. Clean. Prod. 2015, 87, 180–187. [Google Scholar] [CrossRef]
  7. Darbyshire, R.; Crean, E.; Dunn, T.; Dunn, B. Predicting panicle initiation timing in rice grown using water efficient systems. Field Crops Res. 2019, 239, 159–164. [Google Scholar] [CrossRef]
  8. Zhai, Y.J.; Tan, X.F.; Ma, X.T.; An, M.G.; Zhao, Q.L.; Shen, X.X.; Hong, J.L. Water footprint analysis of wheat production. Ecol. Indic. 2019, 102, 95–102. [Google Scholar] [CrossRef]
  9. Sun, Y.Y.; Zhi, Y.; Zhao, Y.W. Indirect effects of carbon taxes on water conservation: A water footprint analysis for China. J. Environ. Manag. 2021, 279, 111747. [Google Scholar] [CrossRef]
  10. Hoekstra, A.Y.; Chapagain, A.K.; Aldaya, M.M.; Mekonnen, M.M. The Water Footprint Assessment Manual: Setting the Global Standard; Earthscan: London, UK, 2011. [Google Scholar]
  11. Chapagain, A.K.; Hoekstra, A.Y.; Savenije, H.H.G.; Gautam, R. The water footprint of cotton consumption: An assessment of the impact of worldwide consumption of cotton products on the water resources in the cotton producing countries. Ecol. Econ. 2006, 60, 186–203. [Google Scholar] [CrossRef]
  12. Chapagain, A.K.; Orr, S. An improved water footprint methodology linking global consumption to local water resources: A case of Spanish tomatoes. J. Environ. Manag. 2009, 90, 1219–1228. [Google Scholar] [CrossRef]
  13. Morillo, J.G.; Diaz, J.A.R.; Camacho, E.; Montesinos, P. Linking water footprint accounting with irrigation management in high value crops. J. Clean. Prod. 2015, 87, 594–602. [Google Scholar] [CrossRef]
  14. Scarpare, F.V.; Hernandes, T.A.D.; Ruiz-Correa, S.T.; Kolln, O.T.; Gava, G.J.D.C.; Santos, L.N.S.D.; Victoria, R.L. Sugarcane water footprint under different management practices in Brazil: Tiete/Jacare watershed assessment. J. Clean. Prod. 2016, 112, 4576–4584. [Google Scholar] [CrossRef]
  15. Bocchiola, D.; Nana, E.; Soncini, A. Impact of climate change scenarios on crop yield and water footprint of maize in the Po valley of Italy. Agric. Water Manag. 2013, 116, 50–61. [Google Scholar] [CrossRef]
  16. Pellegrini, G.; Ingrao, C.; Carnposeo, S.; Tricase, C.; Conto, F.; Huisingh, D. Application of water footprint to olive growing systems in the Apulia region: A comparative assessment. J. Clean. Prod. 2016, 112, 2407–2418. [Google Scholar] [CrossRef]
  17. Zhuo, L.; Mekonnen, M.M.; Hoekstra, A.Y. Benchmark levels for the consumptive water footprint of crop production for different environmental conditions: A case study for winter wheat in China. Hydrol. Earth Syst. Sc. 2016, 20, 4547–4559. [Google Scholar] [CrossRef] [Green Version]
  18. Finogenova, N.; Dolganova, I.; Berger, M.; Nunez, M.; Blizniukova, D.; Mueller-Frank, A.; Finkbeiner, M. Water footprint of German agricultural imports: Local impacts due to global trade flows in a fifteen-year perspective. Sci. Total Environ. 2019, 662, 521–529. [Google Scholar] [CrossRef]
  19. Gleeson, T.; Wada, Y.; Bierkens, M.F.P.; van Beek, L.P.H. Water balance of global aquifers revealed by groundwater footprint. Nature 2012, 488, 197–200. [Google Scholar] [CrossRef]
  20. Hoekstra, A.Y.; Mekonnen, M.M. The water footprint of humanity. Proc. Natl. Acad. Sci. USA 2012, 109, 3232–3237. [Google Scholar] [CrossRef] [Green Version]
  21. Zhao, X.; Liao, X.W.; Chen, B.; Tillotson, M.R.; Guo, W.; Li, Y.P. Accounting global grey water footprint from both consumption and production perspectives. J. Clean. Prod. 2019, 225, 963–971. [Google Scholar] [CrossRef]
  22. Mekonnen, M.M.; Hoekstra, A.Y. Water footprint benchmarks for crop production: A first global assessment. Ecol. Indic. 2014, 46, 214–223. [Google Scholar] [CrossRef] [Green Version]
  23. Chukalla, A.D.; Krol, M.S.; Hoekstra, A.Y. Green and blue water footprint reduction in irrigated agriculture: Effect of irrigation techniques, irrigation strategies and mulching. Hydrol. Earth Syst. Sc. 2015, 19, 4877–4891. [Google Scholar] [CrossRef] [Green Version]
  24. Brueck, H.; Lammel, J. Impact of fertilizer N application on the grey water footprint of winter wheat in a NW-European temperate climate. Water 2016, 8, 356. [Google Scholar] [CrossRef]
  25. Muratoglu, A. Grey water footprint of agricultural production: An assessment based on nitrogen surplus and high-resolution leaching runoff fractions in Turkey. Sci. Total Environ. 2020, 742, 140553. [Google Scholar] [CrossRef] [PubMed]
  26. Zeng, Z.; Liu, J.; Koeneman, P.H.; Zarate, E.; Hoekstra, A.Y. Assessing water footprint at river basin level: A case study for the Heihe River Basin in Northwest China. Hydrol. Earth Syst. Sc. 2012, 16, 2771–2781. [Google Scholar] [CrossRef] [Green Version]
  27. Mekonnen, M.M.; Hoekstra, A.Y. The green, blue and grey water footprint of crops and derived crop products. Hydrol. Earth Syst. Sc. 2011, 15, 1577–1600. [Google Scholar] [CrossRef] [Green Version]
  28. Zhang, Z.Y.; Yang, H.; Shi, M.J. Analyses of water footprint of Beijing in an interregional input-output framework. Ecol. Econ. 2011, 70, 2494–2502. [Google Scholar] [CrossRef]
  29. Zhang, C.; Anadon, L.D. A multi-regional input-output analysis of domestic virtual water trade and provincial water footprint in China. Ecol. Econ. 2014, 100, 159–172. [Google Scholar] [CrossRef]
  30. Hoogenboom, G.; Jones, J.W.; Wilkens, P.W.; Porter, C.H.; Boote, K.J.; Hunt, L.D.; Singh, U.; Lizaso, J.I.; White, J.M.; Uryasev, O. Decision Support System for Agrotechnology Transfer (DSSAT) Version 4.6; DSSAT Foundation: Prosser, WA, USA, 2015. [Google Scholar]
  31. Batchelor, W.D.; Basso, B.; Paz, J.O. Examples of strategies to analyze spatial and temporal yield variability using crop models. Eur. J. Agron. 2002, 18, 141–158. [Google Scholar] [CrossRef]
  32. Li, Y.C.; Huang, H.P.; Ju, H.; Lin, E.D.; Xiong, W.; Han, X.; Wang, H.R.; Peng, Z.P.; Wang, Y.Q.; Xu, J.W.; et al. Assessing vulnerability and adaptive capacity to potential drought for winter-wheat under the RCP 8.5 scenario in the Huang-Huai-Hai Plain. Agric. Ecosyst. Environ. 2015, 209, 125–131. [Google Scholar] [CrossRef]
  33. Awan, Z.A.; Khaliq, T.; Akhtar, M.M.; Imran, A.; Irfan, M.; Ahmed, M.J.; Ahmad, A. Building climate-resilient cotton production system for changing climate scenarios using the DSSAT model. Sustainability 2021, 13, 10495. [Google Scholar] [CrossRef]
  34. Jiang, Y.W.; Zhang, L.H.; Zhang, B.Q.; He, C.S.; Jin, X.; Bai, X. Modeling irrigation management for water conservation by DSSAT-maize model in arid northwestern China. Agric. Water Manag. 2016, 177, 37–45. [Google Scholar] [CrossRef]
  35. Xiang, Z.; Bailey, R.T.; Nozari, S.; Husain, Z.; Kisekka, I.; Sharda, V.; Gowda, P. DSSAT-MODFLOW: A new modeling framework for exploring groundwater conservation strategies in irrigated areas. Agr. Water Manag. 2020, 232, 103033. [Google Scholar] [CrossRef]
  36. Si, Z.Y.; Zain, M.; Li, S.; Liu, J.M.; Liang, Y.P.; Gao, Y.; Duan, A.W. Optimizing nitrogen application for drip-irrigated winter wheat using the DSSAT-CERES-Wheat model. Agr. Water Manag. 2021, 244, 106592. [Google Scholar] [CrossRef]
  37. Ren, X.M.; Sun, D.B.; Wang, Q.S. Modeling the effects of plant density on maize productivity and water balance in the Loess Plateau of China. Agric. Water Manag. 2016, 171, 40–48. [Google Scholar] [CrossRef]
  38. Zhang, D.; Wang, H.G.; Li, D.X.; Li, H.R.; Ju, H.; Li, R.Q.; Batchelor, W.D.; Li, Y.M. DSSAT-CERES-wheat model to optimize plant density and nitrogen best management practices. Nutr. Cycl. Agroecosys. 2019, 114, 19–32. [Google Scholar] [CrossRef]
  39. Li, Z.T.; Yang, J.Y.; Drury, C.F.; Hoogenboom, G. Evaluation of the DSSAT-CSM for simulating yield and soil organic C and N of a long-term maize and wheat rotation experiment in the Loess Plateau of Northwestern China. Agric. Syst. 2015, 135, 90–104. [Google Scholar] [CrossRef]
  40. Araya, A.; Kisekka, I.; Gowda, P.H.; Prasad, P.V.V. Evaluation of water-limited cropping systems in a semi-arid climate using DSSAT-CSM. Agric. Syst. 2017, 150, 86–98. [Google Scholar] [CrossRef] [Green Version]
  41. Ventrella, D.; Giglio, L.; Charfeddine, M.; Dalla Marta, A. Consumptive use of green and blue water for winter durum wheat cultivated in Southern Italy. Ital. J. Agrometeorol. 2015, 20, 33–44. [Google Scholar]
  42. Yesilköy, S.; Saylan, L. Yields and water footprints of sunflower and winter wheat under different climate projections. J. Clean. Prod. 2021, 2, 126780. [Google Scholar] [CrossRef]
  43. Lv, L.H.; Dong, Z.Q.; Zhang, J.T.; Zhang, L.H.; Liang, S.B.; Jia, X.L.; Yao, H.P. Effect of water and nitrogen on yield and nitrogen utilization of winter wheat and summer maize. Sci. Agri. Sin. 2014, 47, 3839–3849. [Google Scholar]
  44. Zhang, J.T.; Chen, Q.Y.; Lv, L.H.; Shen, H.P.; Jia, X.L.; Liang, S.P. Optimum combination of irrigation and nitrogen for high yield and nitrogen use efficiency in winter wheat and summer maize rotation system. J. Plant Nutr. Fert. 2016, 22, 886–896. [Google Scholar] [CrossRef]
  45. Jones, J.W.; Hoogenboom, G.; Porter, C.H.; Boote, K.J.; Batchelor, W.D.; Hunt, L.A.; Wilkens, P.W.; Singh, U.; Gijsman, A.J.; Ritchie, J.T. The DSSAT cropping system model. Eur. J. Agron. 2003, 18, 235–265. [Google Scholar] [CrossRef]
  46. Yang, Y.H.; Watanabe, M.; Zhang, X.Y.; Zhang, J.Q.; Wang, Q.X.; Hayashi, S. Optimizing irrigation management for wheat to reduce groundwater depletion in the piedmont region of the Taihang Mountains in the North China Plain. Agric. Water Manag. 2006, 82, 25–44. [Google Scholar] [CrossRef]
  47. Chen, C.; Wang, E.L.; Yu, Q. Modeling wheat and maize productivity as affected by climate variation and irrigation supply in North China Plain. Agron. J. 2010, 102, 1037–1049. [Google Scholar] [CrossRef] [Green Version]
  48. Willmott, C.J. Some Comments on the Evaluation of Model Performance. Bull. Am. Meteorol. Soc. 1982, 63, 1309–1313. [Google Scholar] [CrossRef] [Green Version]
  49. Yang, J.; Greenwood, D.J.; Rowell, D.L.; Wadsworth, G.A.; Burns, I.G. Statistical methods for evaluating a crop nitrogen simulation model, N_ABLE. Agric. Syst. 2000, 64, 37–53. [Google Scholar] [CrossRef]
  50. Jamieson, P.D.; Porter, J.R.; Wilson, D.R. A test of the computer-simulation model Archwheat1 on wheat crops grown in New-Zealand. Field Crops Res. 1991, 27, 337–350. [Google Scholar] [CrossRef]
  51. De Mendiburu, F. Agricolae: Statistical Procedures for Agricultural Research; R Team: Vienna, Austria, 2012; Volume 1, pp. 2–4. [Google Scholar]
  52. Rosseel, Y. Lavaan: An R Package for Structural Equation Modeling. J. Stat. Softw. 2012, 48, 1–36. [Google Scholar] [CrossRef] [Green Version]
  53. Lu, Y.; Zhang, X.Y.; Chen, S.Y.; Shao, L.W.; Sun, H.Y. Changes in water use efficiency and water footprint in grain production over the past 35 years: A case study in the North China Plain. J. Clean. Prod. 2016, 116, 71–79. [Google Scholar] [CrossRef]
  54. Liu, X.J.; Zhang, Y.; Han, W.X.; Tang, A.H.; Shen, J.L.; Cui, Z.L.; Vitousek, P.; Erisman, J.W.; Goulding, K.; Christie, P.; et al. Enhanced nitrogen deposition over China. Nature 2013, 494, 459–462. [Google Scholar] [CrossRef]
  55. Lu, J.; Hu, T.; Geng, C.; Cui, X.; Fan, J.; Zhang, F. Response of yield, yield components and water-nitrogen use efficiency of winter wheat to different drip fertigation regimes in Northwest China. Agri. Water Manag. 2021, 255, 107034. [Google Scholar] [CrossRef]
  56. Feng, H.; Sun, F.; Liu, Y.; Zeng, P.; Che, Y. Mapping multiple water pollutants across china using the grey water footprint. Sci. Total Environ. 2021, 785, 147255. [Google Scholar] [CrossRef]
  57. Lu, J.; Hu, T.; Zhang, B.; Wang, L.; Yang, S.H.; Fan, J.L.; Yan, S.C.; Zhang, F. Nitrogen fertilizer management effects on soil nitrate leaching, grain yield and economic benefit of summer maize in Northwest China. Agri. Water Manag. 2021, 247, 106739. [Google Scholar] [CrossRef]
  58. Li, X.X.; Hu, C.S.; Delgado, J.A.; Zhang, Y.M.; Ouyang, Z.Y. Increased nitrogen use efficiencies as a key mitigation alternative to reduce nitrate leaching in North China Plain. Agric. Water Manag. 2007, 89, 137–147. [Google Scholar] [CrossRef]
  59. Wang, S.Q.; Wei, S.C.; Liang, H.Y.; Zheng, W.B.; Li, X.X.; Hu, C.S.; Currell, M.J.; Zhou, F.; Min, L.L. Nitrogen stock and leaching rates in a thick vadose zone below areas of long-term nitrogen fertilizer application in the North China Plain: A future groundwater quality threat. J. Hydrol. 2019, 576, 28–40. [Google Scholar] [CrossRef]
  60. Lu, Y.; Wang, E.L.; Zhao, Z.; Liu, X.W.; Tian, A.L.; Zhang, X.Y. Optimizing irrigation to reduce N leaching and maintain high crop productivity through the manipulation of soil water storage under summer monsoon climate. Field Crops Res. 2021, 265, 108110. [Google Scholar] [CrossRef]
  61. Li, Y.; Liu, H.J.; Huang, G.H. The effect of nitrogen rates on yields and nitrogen use efficiencies during four years of wheat-maize rotation cropping seasons. Agron. J. 2016, 108, 2076–2088. [Google Scholar] [CrossRef]
  62. Li, Y.; Liu, H.J.; Huang, G.H.; Zhang, R.H.; Yang, H.Y. Nitrate nitrogen accumulation and leaching pattern at a winter wheat: Summer maize cropping field in the North China Plain. Environ. Earth. Sci. 2016, 75, 118. [Google Scholar] [CrossRef]
  63. Chen, C.; Wang, E.L.; Yu, Q.A. Modelling the effects of climate variability and water management on crop water productivity and water balance in the North China Plain. Agric. Water Manag. 2010, 97, 1175–1184. [Google Scholar] [CrossRef]
  64. Ma, Y.; Feng, S.Y.; Song, X.F. A root zone model for estimating soil water balance and crop yield responses to deficit irrigation in the North China Plain. Agric. Water Manag. 2013, 127, 13–24. [Google Scholar] [CrossRef]
  65. Pei, H.W.; Shen, Y.J.; Liu, C.M. Nitrogen and water cycling of typical cropland in the North China Plain. Chin. J. Appl. Ecol. 2015, 26, 283–296. [Google Scholar] [CrossRef]
  66. Gu, L.M.; Liu, T.N.; Wang, J.F.; Liu, P.; Dong, S.T.; Zhao, B.Q.; So, H.B.; Zhang, J.W.; Zhao, B. Lysimeter study of nitrogen losses and nitrogen use efficiency of Northern Chinese wheat. Field Crops Res. 2016, 188, 82–95. [Google Scholar] [CrossRef]
  67. Sun, H.Y.; Zhang, X.Y.; Wang, E.L.; Chen, S.Y.; Shao, L.W. Quantifying the impact of irrigation on groundwater reserve and crop production-A case study in the North China Plain. Eur. J. Agron. 2015, 70, 48–56. [Google Scholar] [CrossRef]
  68. Wu, Y.C.; Zhou, S.L.; Wang, Z.M.; Feng, H.Y.; Lu, L.Q.; Wang, R.Z. Recovery of residual fertilizer-nitrogen by wheat in a winter wheat-summer maize rotation in the North China Plain: A soil column study. Agron. J. 2009, 101, 925–932. [Google Scholar] [CrossRef]
  69. Kadiyala, M.D.M.; Jones, J.W.; Mylavarapu, R.S.; Li, Y.C.; Reddy, M.D. Identifying irrigation and nitrogen best management practices for aerobic rice-maize cropping system for semi-arid tropics using CERES-rice and maize models. Agric. Water Manag. 2015, 149, 23–32. [Google Scholar] [CrossRef] [Green Version]
  70. Liu, L.; Yao, S.; Zhang, H.; Muhammed, A.; Xu, J.; Li, R.; Zhang, D.; Zhang, S.; Yang, X. Soil nitrate nitrogen buffer capacity and environmentally safe nitrogen rate for winter wheat-summer maize cropping in Northern China. Agric. Water Manag. 2019, 213, 445–453. [Google Scholar] [CrossRef]
  71. Peng, Y.; Yu, P.; Li, X.; Li, C. Determination of the critical soil mineral nitrogen concentration for maximizing maize grain yield. Plant Soil 2013, 372, 41–51. [Google Scholar] [CrossRef]
Figure 1. Distribution of the monthly rain, maximum (Tmax) and minimum temperature (Tmin) at Gaocheng, China, over 49 years.
Agronomy 12 00357 g001
Figure 2. Water footprint of winter wheat: response to different management practices applied to winter wheat from 1966 to 2015.
Agronomy 12 00357 g002
Figure 3. Water footprint of summer maize: response to nitrogen rate and irrigation applied to winter wheat from 1966 to 2015. Summer maize was planted with 240 kg ha−1 of nitrogen rate and 160 mm of irrigation.
Agronomy 12 00357 g003
Figure 4. Water footprint of summer maize: response to different management practices applied to summer maize from 1967 to 2015.
Agronomy 12 00357 g004
Figure 5. The water footprint of winter wheat: response to nitrogen rate and irrigation applied to summer maize from 1967 to 2015. Winter wheat was planted with 240 kg ha1 of nitrogen rate and 160 mm of irrigation.
Agronomy 12 00357 g005
Figure 6. A structural equation model of management effects on water footprint. Red arrows represent significant positive pathways, and blue arrows indicate insignificant pathways. Bold numbers indicate the standard path coefficient. * p < 0.05, ** p < 0.01, *** p < 0.001; root mean square of approximation (RMSEA) = 0.388, p = 0.000.
Agronomy 12 00357 g006
Table 1. Genetic coefficients calibrated for winter wheat cultivar.
Cultivar CoefficientDefinitionCalibrated Value
P1VDays, optimum vernalizing temperature, required for vernalization45
P1DPhotoperiod response (% reduction in rate 10 h−1 drop in photoperiod)70
P5Grain filling (excluding lag) phase duration (°C day)720
G1Kernel number per unit canopy weight at anthesis (g)30
G2Standard kernel size under optimum conditions (mg)29
G3Standard, non-stressed mature tiller wt (including grain, g dry weight)1.0
PHINTInterval between successive leaf tip appearances (°C day)90
Table 2. Genetic coefficients calibrated for summer maize cultivar.
Cultivar CoefficientDefinitionCalibrated Value
P1Degree days (base 8 °C) from emergence to end of juvenile phase260.0
P2Photoperiod sensitivity coefficient (0–1.0)0.3
P5Thermal time from silking to physiological maturity 870.0
G2Maximum potential number of kernels per plant820.0
G3Kernel filling rate during the linear grain filling stage and under optimum conditions (mg day−1)9.0
PHINTInterval between successive leaf tip appearances (°C day)38.9
Table 3. Irrigation and nitrogen rate simulated with the CERES-Wheat and -Maize model.
ScenarioWheatMaize
Irrigation
(mm)
Nitrogen
(kg ha−1)
Irrigation
(mm)
Nitrogen
(kg ha−1)
10, 80, 160, 240, 320240160240
21600, 60, 120, 180, 240, 300160240
31602400, 80, 160, 240, 320240
41602401600, 60, 120, 180, 240, 300
Table 4. Comparison of observed and simulated grain yields for winter wheat and summer maize from 2006 to 2013.
Treatment Winter Wheat Summer Maize
nObserved
t ha−1
Simulated
t ha−1
ME
t ha−1
nRMSE
%
dnObserved
t ha−1
Simulated
t ha−1
ME
t ha−1
nRMSE
%
d
Limited Irrigation
N18076.9956.284−0.71112.550.8679.0888.957−0.13111.090.71
N24076.9197.4330.51412.900.7078.9479.0830.1369.560.83
N30076.9267.3050.37912.190.7378.7489.0970.3508.490.84
Total216.9477.0070.06012.550.99218.9289.0460.1189.801.00
Full Irrigation
N18078.0698.004−0.0655.840.9379.4758.610−0.8659.820.73
N24077.9048.1010.1968.700.8579.3419.108−0.2336.140.82
N30078.0748.1010.0278.270.8479.1469.107−0.0399.540.72
Total218.0168.0680.0537.690.87219.3218.942−0.3798.661.00
N180, 180 kg N ha−1; N240, 240 kg N ha−1; N300, 300 kg N ha−1.
Table 5. The correlation coefficients between management practices and water footprint properties.
NitrogenIrrigationWheatMaize
YieldETN LeachingYieldETN Leaching
Wheat yield0.290.86 ***1.00
Wheat ET0.160.91 ***0.96 ***1.00
Wheat N leaching0.62 ***0.030.270.191.00
Maize yield0.43 **0.55 ***0.56 ***0.49 **0.061.00
Maize ET0.200.79 ***0.67 ***0.66 ***−0.090.85 ***1.00
Maize N Leaching0.90 ***0.290.45 **0.33 *0.50 **0.68 ***0.50 **1.00
Total WF0.90 ***0.180.35 *0.210.65 ***0.49 **0.300.90 ***
* p < 0.05, ** p < 0.01, *** p < 0.001. ET, evapotranspiration.
Table 6. Ranking fertilizer strategies in order of performance using different criteria.
NoWheatMaizeRs
YieldCVWFReturnYieldCVWFReturn
t ha−1R%Rm3 t−1R$ ha−1 Rt ha−1R%Rm3 t−1R$ ha−1R
14.85930.427670.281084.596.22916.601764.861843.9958
24.93832.338659.871121.887.31819.112699.342184.2853
35.51733.409604.051330.678.00622.036683.632379.5649
45.81625.501525.231385.967.40722.519726.352270.8744
56.03528.145520.921466.058.23521.594662.322514.4533
66.45328.486579.541616.938.45322.428800.072542.6438
76.20427.774515.111471.648.42421.433655.412637.0122
86.63226.793615.361626.128.53121.965873.482622.6229
96.83125.732795.991699.018.49222.3171253.592556.4334
1 W60 + M60; 2, W60 + M150; 3, W60 + M240; 4, W150 + M60; 5, W150 + M150; 6, W150 + M240; 7, W240 + M60; 8, W240 + M150; 9, W240 + M240. W, wheat; M, maize. 60, 150 and 240 is nitrogen rate (kg ha1). CV, coefficient of variation. WF, water footprint; R, rank. Rs, the sum rank of all parameters. US$ = 6.6 Chinese Yuan. The prices for land preparation and sowing were: wheat grain (0.36$ kg1), water power ($0.08 m−3), ploughing ($68 ha1), rotary ($45 ha1), wheat sowing ($56 ha1), wheat seeds ($0.52 kg1), herbicides and pesticides ($23 ha1), harvest ($145 ha1), N fertilizer ($0.59 kg1), P2O5 fertilizer (0.52 kg1), and labor price ($8 day1).
Publisher’s Note: MDPI stays neutral with regard to jurisdictional claims in published maps and institutional affiliations.

