Article

Long-Term Organic Manure Application Alters Urease Activity and Ureolytic Microflora Structure in Agricultural Soils

1
School of Environment and Energy, Peking University Shenzhen Graduate School, Shenzhen 518055, China
2
Key Laboratory of Aquatic Botany and Watershed Ecology Wuhan Botanical Garden, Chinese Academy of Sciences, Wuhan 430070, China
*
Author to whom correspondence should be addressed.
Agronomy 2022, 12(12), 3018; https://doi.org/10.3390/agronomy12123018
Submission received: 31 August 2022 / Revised: 18 October 2022 / Accepted: 21 October 2022 / Published: 29 November 2022
(This article belongs to the Special Issue Nitrogen Cycle in Farming Systems)

Abstract

:
Ureolytic microbes in soil produce urease to catalyze the hydrolysis of urea to NH3/NH4+. Manure is widely applied in agriculture and has the potential to influence soil urease activity. In this study, we examined the responses of the ureolytic microbial community to manure application in two agricultural soils from north (N) and south (S) China using high-throughput sequencing of the ureC genes. We found that N soil and S soil harbored significantly distinct ureolytic communities, as no OTU was shared between two locations. The slight variation of the ureolytic community (32.2%, Adonis) was observed in N soil where low rates of manure were applied. However, dramatic alteration of the structure of ureolytic community (83.4%, Adonis) was found, possibly by promoting the growth of Betaproteobacteria and Deltaproteobacteria and the suppression of the growth of Actinobacteria in S soil where high rates of manure were inputted. The total C and C/N ratio were the main environmental factors driving the microbial communities. The relative ratios of ureC to 16S rRNA genes ranged from 1.5 to 3.5% among the two soils. The abundance of ureC genes was significantly and positively correlated with total phosphorus (TP, r = 0.87, p < 0.001). Positive correlations between the urease activity and soil available NH4+ (r = 0.81, p = 0.001), TP (r = 0.84, p = 0.001), and the abundance of ureC (r = 0.87, p < 0.001) were observed in our study. We speculate that sufficient soil phosphorus promotes the growth of ureolytic microbes, which results in higher urease activity and the greater release of available NH4+.

1. Introduction

Urea is an organic nitrogen compound commonly found in soil. In natural soils, urea is an intermediate product during the degradation of nitrogenous compounds [1]. It is also a widely used fertilizer in agriculture, and makes up approximately 60% of the world’s consumption of nitrogen fertilizer [2]. Urea applied to soil is usually rapidly hydrolyzed to NH3/NH4+ by urease (EC 3.5.1.5), and provides an effective nitrogen source for soil microorganisms and plants [3]. Therefore, urease plays a crucial role in determining soil fertility and is widely used as a soil quality indicator [4,5,6].
Soil urease was mainly produced by microbes. It was shown that 17 to 30% of the cultivable bacterial population in soil was ureolytic [7]. The functional ureolytic microbial community can also be identified by targeting the ureC gene and this gene encoding the alpha subunit of urease [8]. A number of studies employed clone library technology by targeting the ureC gene and revealed the ureolytic microbial community composition in groundwater [9], grassland [10], and open-ocean and estuarine planktonic communities [11]. In addition, these low-throughput sequencing techniques may underestimate the diversity of ureolytic microorganisms. High-throughput sequencing technologies offer the means to explore the environmental microbiota with higher resolution, coverage, and flux. Therefore, this study used high-throughput sequencing technology to reveal the diversity of ureolytic microorganisms in two typical agricultural soils in China.
The black soil area of northeast China (Udic Mollisol, USDA classification) is about 15 Mha (Institute of Soil Research, Chinese Academy of Sciences, 1978), which is one of the three major black soil areas in the world. Known for its soil fertility and productivity, the region provides 20 percent of China’s grain production. Red soil is widely distributed in southern China, accounting for about 56.9 Mha land area and 6.5% of the total cultivated land area in China (National Soil Survey, 1998). Although rich in hydrothermal resources, red soils are usually less productive because of their acidity and sterility. Many studies have addressed the promotive effects of organic fertilization on soil urease activity [12,13,14,15]. However, the response of the ureolytic microbial community to organic manure fertilization in soils is still unclear. Therefore, we intend to investigate the difference of the ureolytic microbial communities in Black and Red soils as influenced by long-term organic manure fertilization. The high-throughput sequencing technology of the ureolytic microorganism marker genes (ureC) was employed to examine the community of ureolytic microorganisms in the two soils. Urease activity, ureC and 16S rRNA gene abundances were also quantified.

2. Materials and Methods

2.1. Experimental Site and Sampling

The soils were sampled from the Black Soil Ecological Experimental Station in north China (N) and the Red Soil Experimental Station in south China (S), respectively. The Black Soil Ecological Experimental Station is located at Haerbin (45°40′ N, 126°37′ E), Heilongjiang Province, and a wheat-corn-soybean rotation system has been established. The annual mean temperature and precipitation for this region are approximately 3.5 °C and 569 mm, respectively. The soil is classified as Udic Mollisols with a clay loam texture, derived from loamy loess, containing 18% sand, 48% silt, and 34% clay. The Red Soil Experimental Station is located in Qiyang (26°45′ N, 111°52′ E), Hunan Province, and a wheat-corn rotation system has been adopted. The mean annual temperature and precipitation for this region are ~17.8 °C and ~1255 mm, respectively. The soil is an Agri-udic Ferrosol with a silty clay texture derived from Quaternary Red Clay Earth, bearing 8.7% sand, 46.3% silt, and 45.0% clay. The treatments in both stations were with three replicates in a completely randomized design. For the current study, the control (CK) and organic manure (M) treatments in two stations were chosen with the total soil samples of 12 (2 sites × 2 treatments × 3 replicates). The CK was used as the control which receives the same management as M treatment except for fertilization. In the north site, the horse manure was applied at the rate of 75 kg/hm2-N once every 3 years at late October after corn harvesting since 1979. The moisture content of horse manure is 70%. The average organic matter content, total nitrogen, total phosphorus and total potassium are 41.8%, 1.52%, 1.85%, and 0.49%, respectively, on a dry matter basis. In the south site, swine manure was applied at the rate of 300 -N kg/hm2 every year since 1990. The moisture content of horse manure is 73%. The average organic matter content, total nitrogen, total phosphorus and total potassium are 39.8%, 2.07%, 2.95%, and 0.62%, respectively, on a dry matter basis. The amount of manure applied was in accordance with native farmers’ customary dosage at both sites.
Soil samples were collected in July 2015 and November 2016 for the N and S sites, respectively. Nine soil cores at 0–20 cm depth were collected from each plot and mixed carefully to provide a single sample. The soil cores were gently broken apart along the natural break points and sieved (<5 mm) to remove plant residues and organic debris. Each soil sample was divided into three parts. One was frozen at −80 °C for DNA extraction, another was stored at 4 °C for urease activity, and the third portion was air-dried for soil physicochemical analysis.

2.2. Soil Physicochemical Properties and Urease Activity

Soil pH was determined in a soil suspension with deionized water (1:2.5, w/v) using a pH meter (UB-7, UltraBASIC, Denver, CO). The concentrations of total carbon (TC) and nitrogen (TN) were measured by dry combustion analysis using a Vario MAX-CN Elemental Analyzer (Elementar, Hanau, Germany). Total phosphorus (TP) was determined by flow injection analysis [16]. The soil organic carbon (SOC) was determined by the K2Cr2O7—H2SO4 oxidation method of Walkley–Black [16]. Soil exchangeable ammonium (NH4+-N) was determined on a FIAstar 5000 Analyzer (Foss Tecator, Denmark) after extraction of fresh soil with 2 M KCl (1:5; w/v).
Urease activity was measured following the methods of Hoffmann [17]. Briefly, 20 mL citrate phosphate buffer (pH 6.7) and 10 mL 10% urea solution were added to 5 g air-dried soil as substrates, the mixture was incubated at 38 °C in the dark for 3 h, and then diluted with 38 °C water to 50 mL and filtered. The released ammonium in the soil suspension was determined by the indophenol blue reaction and measured spectrophotometrically at 578 nm using an L6 UV-Visible Spectrophotometer (INESA, Shanghai, China).

2.3. DNA Extraction

The total genomic DNA was extracted from 0.5 g soil as described previously by Griffiths et al. [18]. Humic acid, a PCR inhibitor, was removed from the soil DNA by using DNA-EZ Reagents M Humic acid-Be-Gone B (Sangon Biotech, Shanghai, China). The purification protocols were performed according to the manufacturer’s instructions. The quality and concentration of DNA was determined using a Nanodrop spectrophotometer (NanoDrop Technologies, Wilmington, NC, USA).

2.4. Quantification of ureC and 16S rRNA Genes

The copy numbers of ureC genes and 16S rRNA genes were quantified in triplicate by real-time PCR on an ABI Prism 7300 cycler (Applied Biosystems, Germany) with the primer pairs ureC-F/ureC-R (5′− TGG GCC TTA AAA THC AYG ARG AYT GGG −3′/5′− GGT GGT GGC ACA CCA TNA NCA TRT C −3′) [8] and 16S-338F/16S-518R (5′− ACT CCT ACG GGA GGC AGC AG −3′/5′− ATT ACC GCG GCT GCT GG −3′) [19], respectively. Standard curves for the ureC and 16S rRNA genes were obtained using a dilution series (102 to 1010 copies) of plasmid DNA containing ureC and 16S rRNA genes fragment. Reaction mixtures (25 μL) contained 12.5 μL of 2 × SYBR Premix Ex Taq (TaKaRa, Dalian, China), 0.2 μM of each primer and 1 μL of DNA template (1–10 ng). Negative controls without any template were randomly distributed in the plate.

2.5. PCR Amplification of ureC Gene and Sequencing

Fragments of the ureC gene for high throughput sequencing were amplified in a 25 μL PCR system containing 12.5 μL Taq PCR Master Mix (Vazyme, Nanjing, China), 2 μM of ureC primers, 1μL DNA templates and 9.5 μL DEPC water with an annealing temperature of 49 °C. To enable samples mixed while sequencing, barcodes were incorporated between the adapter and reverse primer. Triplicate PCRs were performed for each sample, and the amplicons were pooled and purified. Equimolar concentrations were sequenced on an Illumina MiSeq platform according to the standard protocols.
The obtained sequences were extracted, trimmed, and quality screened using Qiime http://qiime.org/ (version 1.7.0, accessed on 12 July 2017). In brief, sequencing reads were assigned to each sample according to their unique barcodes, and low-quality sequences (quality score < 20; length < 150 bp) were removed. The remained reads were spliced using FLASH (version 1.2.7, http://ccb.jhu.edu/software/FLASH/, accessed on 12 July 2017) based on overlap sequence (length > 10 bp), and no ambiguous base was allowed in the overlap region. After splicing, the chimeras were identified using the Mothur command chimera.uchime with default parameters. The remaining high-quality reads were aligned and clustered into operational taxonomic units (OTUs) based on 97% sequence similarity, and singleton OTUs (with only one read) were removed. The longest sequence of each of the remained OTU were selected as the representative for BLASTn searches against the NCBI nonredundant (nr) database, with a minimum E value of 1e-20 to retrieve NCBI sequence identifiers. Subsequently, the OTUs were assigned to the top hit reference sequences with maximum score.

2.6. Statistical Analysis

The soil chemical properties, urease activity, and ureolytic community parameters for each treatment were calculated by averaging the three replicates for each sample. A one-way ANOVA was carried out to examine the differences in soil chemical properties, urease activity, and ureolytic community parameters by the SPSS 19.0 statistical software (SPSS, Chicago, IL, USA), where the between- and within subject variation was determined for the four treatments. The Fisher’s least significant difference (LSD) test was used at the 95% probability level for the assessment between pairs of treatment means (p < 0.05). The relationships between soil chemical properties, ureolytic community parameters, and urease activity were measured by Pearson’s correlation analysis. In order to account for differences in sequencing depth between samples, the read set was normalized to approximately 28,500 sequences for each sample. The richness and diversity indices including Ace, Chao1, Shannon, and Simpson indices were calculated using Mothur (version 1.40.0; http://www.mothur.org/wiki/MainPage, accessed on 30 August 2022). Nonparametric multivariate analysis of variance (Adonis) using distance matrices (method = “bray”) were used to examine the community difference among groups [20]. Microbial community structure and soil properties were compared using redundancy discriminate analysis (RDA) with the ‘vegan’ package in R. Mantel tests (1000 permutations) using the ‘mantel’ function in the ‘vegan’ package were performed to determine the effects of selected soil chemical variables on the composition of the ureolytic community.

3. Results

3.1. Soil Physicochemical Properties

The physicochemical properties of the soil samples are shown in Table 1. As compared to the north site, the control soil of the south site shows significantly lower pH, TC, TN, C/N ratio, TP, and SOC (Table 1, pairwise test, p < 0.05). The manure application changed the soil physicochemical properties significantly except for a slight improvement of TC and TN in the north soils, while it considerably enhanced the pH, TC, TN, C/N, TP and SOC in the south soils (Table 1).

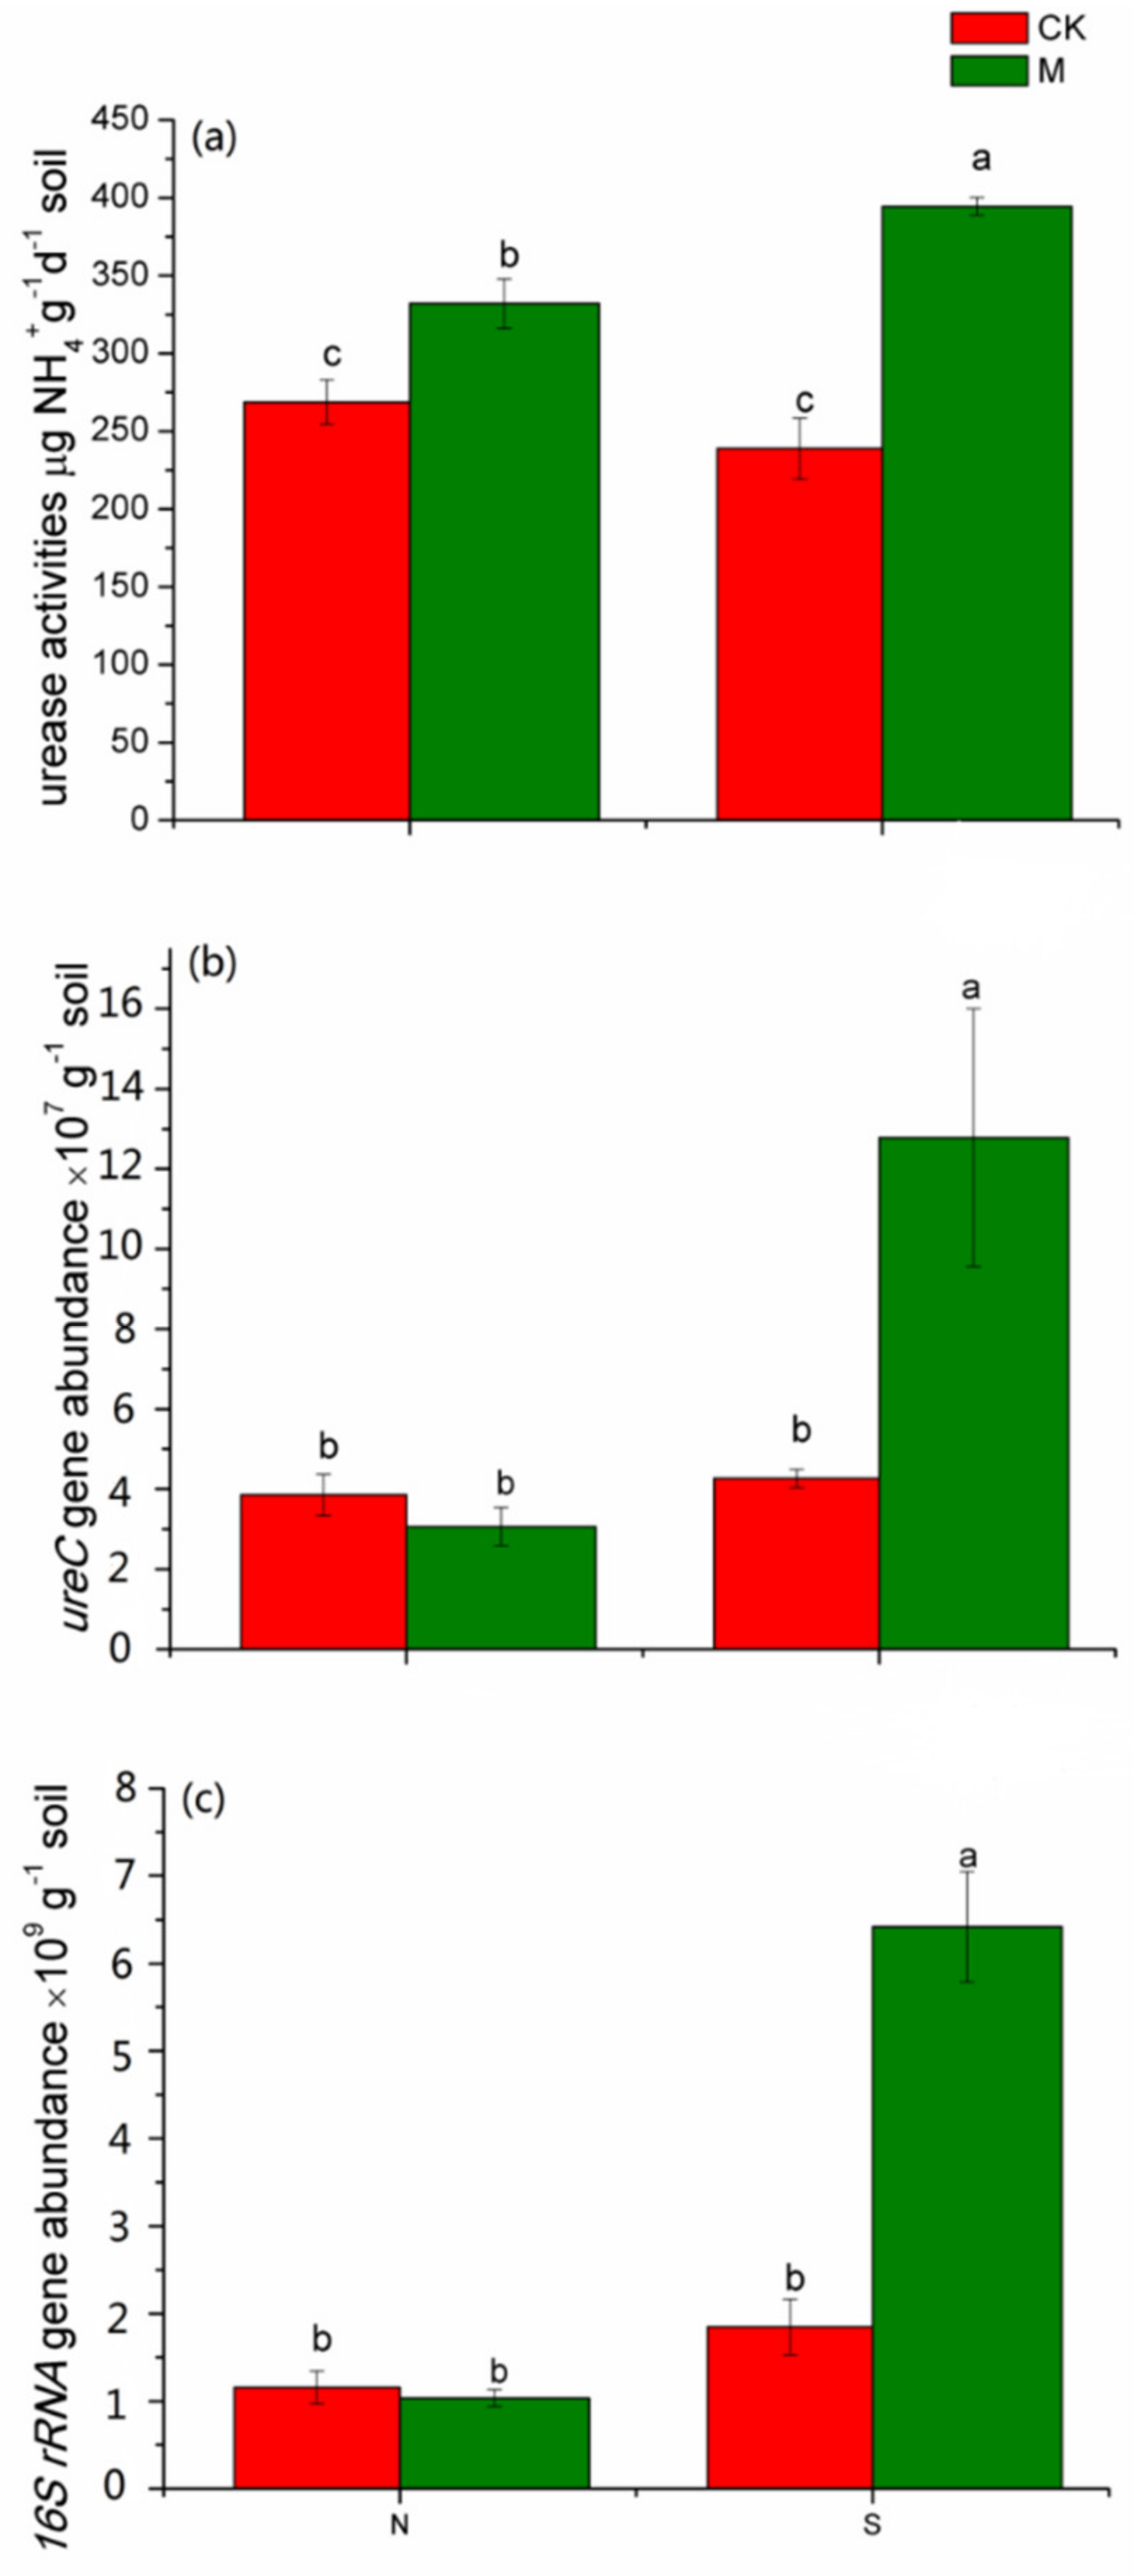
3.2. The Urease Activity and Abundance of the Ureolytic Microflora

The urease activities for the control soils from the two sites were not significantly different (Figure 1a). Manure application enhanced soil urease activities for both sites. The average copy numbers for the 16S rRNA and ureC genes in CK (1.16 × 10⁹ ± 1.88 × 10⁸, 3.85 × 10⁷ ± 5.14 × 10⁶ copies g−1 dry soil, respectively) and M (1.04 × 10⁹ ± 9.66 × 10⁷, 3.06 × 10⁷ ± 4.81 × 10⁶ copies g−1 dry soil, respectively) of the North were not significantly different either (Figure 1b,c). However, the mean abundances of the 16S rRNA and ureC gene in M (6.42 × 10⁹ ± 6.29 × 10⁸, 1.28 × 10⁸ ± 3.22 × 10⁷ copies g−1 dry soil, respectively) were prominently higher than those in CK (1.85 × 10⁹ ± 3.20 × 10⁸, 4.26 × 10⁷ ± 2.31 × 10⁶ copies g−1 dry soil, respectively) of the South (Figure 1b,c). A significant correlation was found between the ureC gene copy number and that of 16S rRNA gene (r = 0.926, p < 0.001). The relative ratios of ureC gene to 16S rRNA gene ranged from 1.5% to 3.5%. The urease activity was also significantly correlated with the copy numbers of ureC (r = 0.727, p = 0.007).

3.3. The α-Diversity of the Ureolytic Microflora

A total of 667,290 (Table 2) high-quality ureC gene sequences with an average read length of 320 bp were obtained from 12 soil samples. Sequence clustering yielded 8738 OTUs, of which 5168 OTUs belong to North samples and 3570 OTUs belong to South samples, and there were no shared OTU between the two sites. The numbers of high quality sequences, even depth high quality sequences and OTUs for each sample, and α-diversity indexes, are shown in Table 2. For the control soils, observably lower richness (Ace and Chao1 indexes) and α- diversity (Shannon and Simpson indexes) were found in the south compared to those in the north, indicating the significant effect of location on ureolytic microflora diversity. However, they were not influenced by manure application at either site (Table 2).

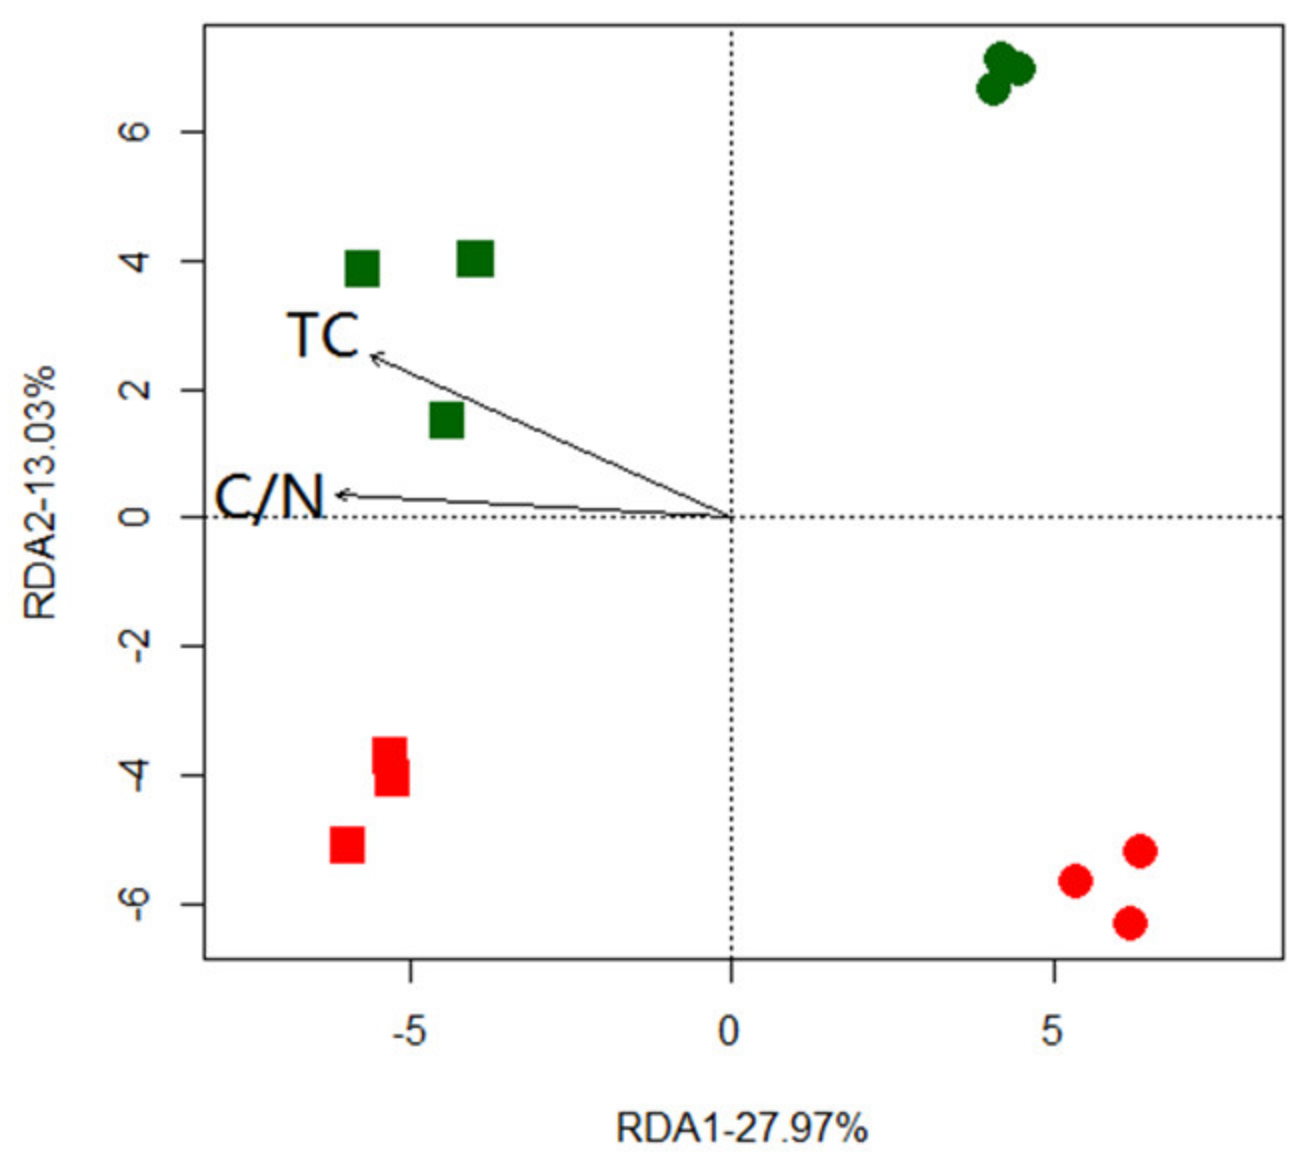
3.4. The Structure of Ureolytic Microflora and Drivers

The redundancy analysis (RDA) of the ureolytic microflora and environmental variables with Bray-Curtis dissimilarity matrices were performed in R with the “vegan” package based on the relative abundance of OTUureC. The most relevant environmental variables combination to ureolytic microflora was selected using the ‘bioenv’ function (Figure 2). This was supported by the mantel test, which showed that TC (R = 0.77, p = 0.001) and C/N (R = 0.86, p = 0.001) were significantly related with ureolytic microflora. The first and second canonical axes explained 27.97% and 13.03%, of the total ureolytic community variation, respectively. The samples were clearly separated on the first canonical axis by location, whereas the influence of manure application became evident on the second axis.

3.5. The Composition of Ureolytic Microflora

The taxonomic compositions of ureolytic microbial community assemblages at the phylum level in samples are shown in Figure 3, and the relative abundance of abundant (>1%) ureolytic microbiomes at phylum level are listed in Table 3. It is clear that the ureolytic microbial community at both sites are dominated by Betaproteobacteria (39.9% and 28.5% for N and S site, respectively), Alphaproteobacteria (13.2% and 36.2%, respectively), Gammaproteobacteria (13.2% and 8.2%, respectively), Deltaproteobacteria (10.6% and 9.7%, respectively), Actinobacteria (13.9% and 4.7%, respectively) and Verrucomicrobia (4.1% and 2.2%, respectively, Figure 3). In addition, Nitrospirae (7.0%) and Bacteroidetes (3.8%) are also abundant (relative abundance >1%) in the N site but not in the S site. Planctomycetes, Cyanobacteria, Firmicutes, Thaumarchaeota, Ascomycota, Deinococcus-Thermus, Chloroflexi are present at lower abundances at both sites, accounting for 2.46% of all sequences (Figure 3). An ANOVA analysis revealed that all abundant phyla are altered by location or manure application except for Verrucomicrobia, which are consistent in all samples. Alphaproteobacteria, Gammaproteobacteria, Actinobacteria and Nitrospirae differ significantly between the two locations (p < 0.05) in which Alphaproteobacteria and Actinobacteria show higher relative abundance in the S site while Gammaproteobacteria and Nitrospirae are more abundant in the N site (p < 0.05). The relative abundance of Betaproteobacteria and Deltaproteobacteria is the lowest in S-CK than in the other three treatments (p < 0.05). Actinobacteria was significantly decreased by manure application in the S site (p < 0.05).

4. Discussion

Ureolytic microbes play a pivotal role in the supply of soil bio-available NH4+. In this study, we determined the abundance, structure, and activity of soil ureolytic microflora by high-throughput sequencing and urease activity measurement in two distinct farmlands located in South (S, Red soil) and North (N, Black soil) China, which are both under long-term manure application. The results revealed a strong endemicity of the ureolytic microbial community, as no OTU is shared between the two locations. Their structure and function are significantly influenced by manure application at both sites. However, the strength of the impact was determined by the dosage of manure applied.
Black soil in the Northeast is well known to be fertile and productive for its richness in organic matter. Therefore, the native famers usually applied a small amount of manure to the soil. This low dosage of manure application has a slight but significant influence on soil physicochemical properties, urease activity and ureolytic community. For example, among the test physicochemical properties, only TC and TN were improved by 14.5% and 22.3%, respectively, after manure application in this site. The urease activity was increased by 22.2%. Manure led to a 32.2% (Adonis) variation in the ureolytic community compared with CK. However, this amount of manure does not significantly change the abundance of ureolytic microorganisms.
Red soil was barren and lacked organic matter due to intense leaching. The application of large quantities of manure in this region led to a dramatic shift of soil physicochemical properties, urease activity, and the abundance and structure of the ureolytic community. The concentration of SOC, TN, TP, and NH4+ in the soil has been improved by 111.5%, 83.6%, 278.4%, and 11.7%, respectively, after manure application. The urease activity was increased by 65.0%. Manure lead to an 83.4% (Adonis) variation of the ureolytic community and an increment of 199.6% for the abundance of ureolytic microorganisms.
Although high throughput sequencing technology provides a sweeping perspective on the composition of soil bacterial communities, it is still hard to interpret the taxonomic survey data in an ecologically meaningful manner. We are unable to determine why certain taxa are more abundant in some soils than in others. At present, one unified concept used to describe the life history and characteristics of microbes is the r- to K- selection continuum [21], which originates from plant and animal ecology. Microbiologists tend to use the terms copiotroph and oligotroph to describe those microorganisms with ecological attributes typical of r- and Kstrategists, respectively. Copiotrophs preferentially consume labile soil organic C pools and have high nutritional requirements and growth rates at appropriate conditions. In contrast, oligotrophs usually exhibit lower growth rates and are likely to outcompete copiotrophs in conditions of low nutrient availability due to their higher substrate affinities [22,23]. In our study, the Black soil in north China is known as having high nutrient availability, while the Red soil in south China is nutrient deficient (Table 1). However, the high rates of manure application (S-M) made the Red soil become well-nourished (Table 1). Therefore, we speculate that the microbes which are more abundant in Black soil and in manure-treated Red soil are copiotrophic ureolytic microbes. Otherwise, they are oligotrophic ureolytic microbes. Therefore, our results suggest that the Betaproteobacteria and Deltaproteobacteria are copiotrophs, while Actinobacteria are oligotrophs. The Pearson’s correlation test also indicated that the Betaproteobacteria (r = 0.60, p = 0.041) and Deltaproteobacteria (r = 0.70, p = 0.012) are positively correlated with SOC, and Actinobacteria are negatively correlated with SOC (r = −0.82, p = 0.001). Betaproteobacteria and Deltaproteobacteria are commonly considered as copiotrophic bacterial taxa and are associated with substrates rich in organic carbon [24,25,26]. Actinobacteria are known as a copiotrophic group, and a decreased relative abundance in nutrients-rich soils were observed in this study and also in others [27,28]. It seems that Actinobacteria are not consistently copiotrophic or oligotrophic [29].
The growth rate hypothesis (GRH) proposes that elevated growth rates are linked to elevated demands for p for the synthesis of p-rich ribosomal RNA (rRNA) [30,31,32,33]. Therefore, high p availability was needed to support the fast grow microorganisms [34]. Räsänen et al. [35] suggested that short-term phosphorus addition would benefit bacterial net growth in a fresh water system. We also found a positive correlation between ureC abundance and TP (r = 0.87, p < 0.001). The Pearson’s test also showed that the urease activity is positively correlated with NH4+ (r = 0.81, p = 0.001), TP (r = 0.84, p = 0.001), and ureC abundance (r = 0.87, p < 0.001). Therefore, we speculated that a higher concentration of p promotes the growth of ureolytic microbiomes, which produces higher urease activity and the release of more available NH4+. No significant correlation between urease activity and α-diversity index was found, indicating that α-diversity is not a controlling factor for urease activity.

5. Conclusions

We revealed a strong endemicity of the ureolytic microbial community in the farmlands between south and north China. Long-term manure application significantly altered the ureolytic microflora and improved urease activity in both sites. The relative ratios of ureC to 16S rRNA genes ranged from 1.5 to 3.5%, and the abundance of ureC genes was positively correlated with TP. The structure of ureolytic microflora were determined by TC and C/N. Soil urease activity was positively correlated with soil available NH4+, TP, and ureC abundance.

Author Contributions

Conceptualization, L.W. and X.X.; methodology, L.W.; software, L.W.; validation, L.W. and X.X.; formal analysis, X.X.; investigation, L.W.; resources, X.X.; data curation, X.X.; writing—original draft preparation, L.W.; writing—review and editing, L.W. and X.X.; visualization, L.W.; supervision, X.X.; project administration, X.X. All authors have read and agreed to the published version of the manuscript.

Funding

This research received no external funding.

Conflicts of Interest

The authors declare that they have no competing interests.

Compliance with Ethical Standards

This article does not contain any studies with animals performed by any of the authors. All authors have read and approved the final manuscript.

References

  1. Vogels, G.; van der Drift, C. Degradation of purines and pyrimidines by microorganisms. Bacteriol. Rev. 1976, 40, 403–468. [Google Scholar] [CrossRef] [PubMed]
  2. Glibert, P.M.; Maranger, R.; Sobota, D.J. The Haber Bosch-harmful algal bloom (HB-HAB) link. Environ. Res. Lett. 2014, 9, 105001. [Google Scholar] [CrossRef] [Green Version]
  3. Mobley, H.L.T.; Hausinger, R.P. Microbial ureases: Significance, regulation, and molecular characterization. Microbiol. Mol. Biol. Rev. 1989, 53, 85–108. [Google Scholar] [CrossRef] [PubMed]
  4. Bolton, J.B.; Elliott, L.F.; Papendick, R.I.; Bezdicek, D.F. Soil microbial biomass and selected soil enzyme activities: Effect of fertilization and cropping practices. Soil Biol. Biochem. 1985, 17, 297–302. [Google Scholar] [CrossRef]
  5. Cetin, S.C.; Ekinci, H.; Kavdir, Y.; Yüksel, O. Using soil urease enzyme activity as soil quality indicator for reflecting fire influence in forest ecosystem. Fresenius Environ. Bull. 2009, 18, 2380–2387. [Google Scholar]
  6. García-Ruiz, R.; Ochoa, V.; Hinojosa, M.B.; Carreira, J.A. Suitability of enzyme activities for the monitoring of soil quality improvement in organic agricultural systems. Soil Biol. Biochem. 2008, 40, 2137–2145. [Google Scholar] [CrossRef]
  7. Lloyd, A.B.; Sheaffe, M.J. Urease activity in soils. Plant Soil 1973, 39, 71–80. [Google Scholar] [CrossRef]
  8. Reed, K.E. Restriction enzyme mapping of bacterial urease genes: Using degenerate primers to expand experimental outcomes. Biochem. Mol. Biol. Educ. 2001, 29, 239–244. [Google Scholar] [CrossRef]
  9. Greshan, T.L.; Sheridan, P.P.; Watwood, M.E.; Fujita, Y.; Collwell, F.S. Design and validation of ureC-based primers for groundwater detection of urea-hydrolyzing bacteria. Geomicrobiol. J. 2007, 24, 353–364. [Google Scholar] [CrossRef]
  10. Singh, B.K.; Nunan, N.; Millard, P. Response of fungal, bacterial and ureolytic communities to synthetic sheep urine deposition in a grassland soil. FEMS Microbiol. Ecol. 2009, 70, 109–117. [Google Scholar] [CrossRef] [Green Version]
  11. Collier, J.L.; Baker, K.M.; Bell, S.L. Diversity of urea-degrading microorganisms in open-ocean and estuarine planktonic communities. Environ. Microbiol. 2009, 11, 3118–3131. [Google Scholar] [CrossRef] [PubMed]
  12. Haynes, R.J.; Naidu, R. Influence of lime, fertilizer and manure applications on soil organic matter content and soil physical conditions: A review. Nutr. Cycl. Agroecosyst. 1998, 51, 123–137. [Google Scholar] [CrossRef]
  13. Kandeler, E.; Stemmer, M.; Klimanek, E.M. Response of soil microbial biomass, urease and xylanase within particle size fractions to long-term soil management. Soil Biol. Biochem. 1999, 31, 261–273. [Google Scholar] [CrossRef]
  14. Liang, Q.; Chen, H.; Gong, Y.; Yang, H.; Fan, M.; Kuzyakov, Y. Effects of 15 years of manure and mineral fertilizers on enzyme activities in particle-size fractions in a north China plain soil. Eur. J. Soil Biol. 2014, 60, 112–119. [Google Scholar] [CrossRef]
  15. Nayak, D.R.; Jagadeesh, B.Y.; Adhya, T.K. Long-term application of compost influences microbial biomass and enzyme activities in a tropical aeric endoaquept planted to rice under flooded condition. Soil Biol. Biochem. 2007, 39, 1897–1906. [Google Scholar] [CrossRef]
  16. Nelson, D.W.; Sommers, L.E. Total carbon, organic carbon and organic matter. In Methods of Soil Analysis; Page, A.L., Miller, R.H., Keeney, D.R., Eds.; America Society of Agronomy: Madison, WI, USA, 1982; pp. 539–579. [Google Scholar]
  17. Hoffmann, G. Eine photometrische Methode zur Bestimmung der Phosphatase-Aktivität in Böden. J. Plant Nutr. Soil Sci. 1968, 118, 161–172. [Google Scholar] [CrossRef]
  18. Griffiths, R.I.; Whitely, A.S.; O’Donnell, A.G.; Bailey, M.J. Rapid method for coextraction of DNA and RNA from natural environments for analysis of ribosomal DNA and rRNA based microbial community composition. Appl. Environ. Microbiol. 2000, 66, 5488–5491. [Google Scholar] [CrossRef] [PubMed] [Green Version]
  19. Fierer, N.; Jackson, J.A.; Vilgalys, R.; Jackson, R.B. Assessment of soil microbial community structure by use of taxon-specific quantitative PCR assays. Appl. Environ. Microbiol. 2005, 71, 4117–4120. [Google Scholar] [CrossRef] [Green Version]
  20. Anderson, M.J. A new method for non-parametric multivariate analysis of variance. Austral Ecol. 2001, 26, 32–46. [Google Scholar]
  21. MacArthur, R.; Wilson, E. The Theory of Island Biogeography; Princeton University Press: Princeton, NJ, USA, 1967. [Google Scholar]
  22. Meyer, O. Functional groups of microorganisms. In Biodiversity and Ecosystem Function; Schulze, E., Mooney, H., Eds.; Springer-Verlag: New York, NY, USA, 1994; pp. 67–96. [Google Scholar]
  23. Tate, R. Soil Microbiology; John Wiley and Sons: New York, NY, USA, 2000. [Google Scholar]
  24. Fazi, S.; Amalfitano, S.; Pernthaler, J.; Puddu, A. Bacterial communities associated with benthic organic matter in headwater stream microhabitats. Environ. Microbiol. 2005, 7, 1633–1640. [Google Scholar] [CrossRef]
  25. Kirchman, D.L. The ecology of Cytophaga–Flavobacteria in aquatic environments. FEMS Microbiol. Ecol. 2002, 39, 91–100. [Google Scholar] [CrossRef] [PubMed]
  26. Simon, M.; Grossart, H.P.; Schweitzer, B.; Ploug, H. Microbial ecology of organic aggregates in aquatic ecosystems. Aquat. Microb. Ecol. 2002, 28, 175–211. [Google Scholar] [CrossRef]
  27. Ai, C.; Liang, G.; Sun, J.; Wang, X.; He, P.; Zhou, W.; He, X. Reduced dependence of rhizosphere microbiome on plant-derived carbon in 32-year long-term inorganic and organic fertilized soils. Soil Biol. Biochem. 2015, 80, 70–78. [Google Scholar] [CrossRef]
  28. Griffith, J.C.; Lee, W.G.; Orlovich, D.A.; Summerfield, T.C. Contrasting bacterial communities in two indigenous chionochloa (poaceae) grassland soils in new zealand. PLoS ONE 2017, 12, e0179652. [Google Scholar] [CrossRef] [Green Version]
  29. Fierer, N.; Bradford, M.A.; Jackson, R.B. Toward an ecological classification of soil bacteria. Ecology 2007, 88, 1354–1364. [Google Scholar] [CrossRef]
  30. Elser, J.J.; Sterner, R.W.; Galford, A.E.; Chrzanowski, T.H.; Findalay, D.L.; Mills, K.H.; Paterson, M.J.; Stainton, M.P.; Schindler, D.W. Pelagic C:N:P stoichiometry in a eutrophied lake: Responses to a whole-lake food-web manipulation. Ecosystems 2000, 3, 293–307. [Google Scholar] [CrossRef]
  31. Elser, J.J.; Fagan, W.F.; Denno, R.F.; Dobberfuhl, D.R.; Folarin, A.; Huberty, A.; Interlandi, S.; Kilham, S.S.; McCauley, E.; Schulz, K.L.; et al. Nutritional constrains in terrestrial and freshwater food webs. Nature 2000, 408, 578–580. [Google Scholar] [CrossRef] [PubMed]
  32. Elser, J.J.; Sterner, R.W.; Gorokhova, F.; Fagan, W.F.; Markov, T.A.; Cotner, J.B.; Harrison, J.F.; Hobbie, S.E.; Odell, G.M.; Weider, L.W. Biological stoichiometry from genes to ecosystem. Ecol. Lett. 2000, 5, 540–550. [Google Scholar] [CrossRef] [Green Version]
  33. Sterner, R.W.; Elser, J.J. Ecological Stoichiometry: The Biology of Elements from Molecules to the Biosphere; Princeton University Press: Princeton, NJ, USA, 2002. [Google Scholar]
  34. Delgado-Baquerizo, M.; Reich, P.B.; Khachane, A.N.; Campbell, C.D.; Thomas, N.; Freitag, T.E.; Abu Al-Soud, W.; Sørensen, S.; Bardgett, R.D.; Singh, B.K. It is elemental: Soil nutrient stoichiometry drives bacterial diversity. Environ. Microbiol. 2016, 19, 1176–1188. [Google Scholar] [CrossRef] [Green Version]
  35. Räsänen, N.; Kankaala, P.; Tahvanainen, T.; Akkanen, J.; Saarnio, S. Short-term effects of phosphorus addition and pH rise on bacterial utilization and biodegradation of dissolved organic carbon (DOC) from boreal mires. Aquat. Ecol. 2014, 48, 435–446. [Google Scholar] [CrossRef]
Figure 1. Urease activity (a), abundance of ureC (b) and 16S rRNA (c) genes. Error bars represent standard errors of three replicates. Bars with different letters (shown above each bar) were found to be significantly different (p < 0.05) by Fisher’s LSD test (p < 0.05). Abbreviations: N, north site; S, south site; CK, no fertilization; M, organic manure fertilization.
Agronomy 12 03018 g001
Figure 2. Redundancy analysis (RDA) of the ureolytic microflora and environmental variables with Bray-Curtis dissimilarity matrices based on the relative abundance of OTUureC. N (square), S (circle); CK (red), M (green). TC and C/N was the most relevant environmental variables to ureolytic microflora selected using the ‘bioenv’ function in R. Abbreviations: TC, total carbon; C/N, carbon nitrogen ratio. N, north site; S, south site; CK, no fertilization; M, organic manure fertilization.
Agronomy 12 03018 g002
Figure 3. The relative abundance of ureolytic microbes across samples at phylum/class level.
Agronomy 12 03018 g003
Table 1. Soil physicochemical properties of the studied soil samples.
TreatmentpHTCTNC/NNH4+-NSOCTP
(g/kg)(g/kg) (mg/kg)(g/kg)(mg/kg)
NCK6.33 ± 0.01 a14.49 ± 0.04 b1.12 ± 0.02 b12.93 ± 0.22 a5.11 ± 0.58 b8.19 ± 0.53 a385.43 ± 0.67 ab
NM6.23 ± 0.12 a16.73 ± 0.31 a1.37 ± 0.06 a12.23 ± 0.8 a4.87 ± 0.15 b9.56 ± 1.02 a465.59 ± 25.91 ab
SCK5.06 ± 0.05 b4.04 ± 0.28 d0.73 ± 0.01 c5.53 ± 0.43 c9.44 ± 2.40 a3.91 ± 0.42 b300.90 ± 9.07 c
SM6.35 ± 0.06 a10.67 ± 0.14 c1.34 ± 0.01 a7.78 ± 0.13 b10.54 ± 1.18 a8.27 ± 0.09 a1138.61 ± 95.11 a
Abbreviations: TC, total carbon; TN, total nitrogen; C/N, carbon nitrogen ratio; NH4+, ammonium nitrogen; SOC, soil organic carbon; TP, total phosphorus; NCK, no fertilization in North site; NM, organic manure treatment in North site; SCK, no fertilization in South site; SM, organic manure in South site; Data are expressed as the mean ±SE values; n = 3; Different letters represent significant differences at p < 0.05 given from Fisher’s least significant difference (LSD) between four treatments.
Table 2. α-diversity indices of ureC gene for the studied soil samples.
SampleNo. of ReadsNo. of Even Depth ReadsNo. of OTUsChao1ACEShannonSimpson
NCK-158,49828,3062855
NCK-282,37528,2812836
NCK-369,62128,22728493042 ± 21 a3148 ± 23 a9.54 ± 0.21 a0.994 ± 0.002 a
NM-162,20828,2752432
NM-256,32428,5763025
NM-3105,33228,13528462950 ± 353 a3032 ± 371 a9.39 ± 0.41 a0.992 ± 0.004 ab
SCK-143,24928,5752101
SCK-243,88328,6601387
SCK-345,24828,64319651963 ± 418 b1945 ± 422 b8.25 ± 0.68 b0.976 ± 0.010 b
SM-133,37828,6861653
SM-235,00728,7591666
SM-332,16728,77716841670 ± 16 b1670 ± 16 b8.73 ± 0.23 ab0.987 ± 0.007 ab
Abbreviations: NCK, no fertilization in north site; NM, organic manure treatment in north site; SCK, no fertilization in south site; SM, organic manure in south site; the Ace, Chao1, Shannon, and Simpson index were calculated using Mothur (version 1.40.0) based on the even depth reads table; Data are expressed as the mean ±SE values; n = 3; Different letters represent significant differences at p < 0.05 given from Fisher’s least significant difference (LSD) between four treatments.
Table 3. Relative abundance of abundant (>1%) ureolytic microbes at phylum level.
TreatmentBetaproteobacteriaAlphaproteobacteriaGammaproteobacteriaDeltaproteobacteriaActinobacteriaNitrospiraeVerrucomicrobiaBacteroidetes
NCK42.3 ± 3.2% a13.0 ± 2.0% b12.7 ± 2.1% a11.3 ± 2.3% a5.0 ± 1.0% c5.7 ± 2.5% a4.0 ± 1.0% a3.0 ± 1.7% ab
NM36.0 ± 2.6% a13.3 ± 2.9% b14.0 ± 2.0% a10.0 ± 2.0% a4.7 ± 1.5% c8.7 ± 3.1% a4.3 ± 1.2% a4.7 ± 2.9% a
SCK24.7 ± 6.8% b38.0 ± 8.7% a9.0 ± 1.0% b6.3 ± 0.6% b18.0 ± 3.5% a0.7 ± 0.6% b2.3 ± 1.5% a0.3 ± 0.6% b
SM32.3 ± 3.2% ab34.3 ± 3.2% a7.3 ± 0.6% b13.0 ± 1.7% a10.0 ± 1.0% b0.0 ± 0.0% b2.0 ± 0.0% a0.0 ± 0.0% b
Abbreviations: NCK, no fertilization in north site; NM, organic manure treatment in north site; SCK, no fertilization in south site; SM, organic manure in south site; Data are expressed as the mean ±SE values; n = 3; Different letters represent significant differences at p < 0.05 given from Fisher’s least significant difference (LSD) test between four treatments.
Publisher’s Note: MDPI stays neutral with regard to jurisdictional claims in published maps and institutional affiliations.

