Article

Research on Precise Fertilization Method of Rice Tillering Stage Based on UAV Hyperspectral Remote Sensing Prescription Map

1
College of Information and Electrical Engineering, Shenyang Agricultural University, Shenyang 110866, China
2
Liaoning Agricultural Information Engineering Technology Research Center, Shenyang 110866, China
*
Author to whom correspondence should be addressed.
Agronomy 2022, 12(11), 2893; https://doi.org/10.3390/agronomy12112893
Submission received: 13 October 2022 / Revised: 13 November 2022 / Accepted: 17 November 2022 / Published: 18 November 2022

Abstract

:
Tillering fertilization is an important part of field management in rice production. As the first peak fertilizer requirement period of rice, tillering fertilization directly affects the number of tillers and the growth of rice in the middle and late stages. In order to investigate a method of constructing an accurate fertilizer prescription map in the tillering stage using an unmanned aerial vehicle (UAV) remote sensing nitrogen demand diagnosis and reduce the amount of chemical fertilizer while ensuring the rice yield, this study realized the diagnosis of the rice nitrogen nutrient demand using UAV hyperspectral remote sensing during the tilling stage fertilization window. The results showed that the fertilizer amount was determined using the characteristic waveband and remote sensing. The results showed that five rice hyperspectral variables were extracted in the range of 450–950 nm by the feature band selection and feature extraction for the inversion of rice nitrogen content, and the inversion model of rice nitrogen content constructed by the whale-optimized extreme learning machine (WOA-ELM) was better than that constructed by the whale-optimized extreme learning machine (ELM). The model coefficient of determination was 0.899 and the prescription map variable fertilizer application method based on the nitrogen content inversion results reduced the nitrogen fertilizer by 23.21%. The results of the study can provide data and a model basis for precise variable fertilizer tracking by agricultural drones in the cold rice tillering stage.

1. Introduction

Rice is one of the most important staple crops in the world and the northeast region of China is the main rice production area [1]. The northeast region of China is known as the cold region due to the regional environmental climate changes, and there are obvious differences in the rice cultivation patterns and field management patterns of rice cultivation between this region and other regions [2,3,4,5]. The cold region rice cultivation climate is characterized by low temperatures in early spring, low temperatures and soil temperatures after rice transplanting, and a slow release of nutrients so extra root fertilization is required during the critical fertility period to ensure the final yield and quality [6]. It is also the first fertilizer requirement peak in the growth cycle of rice and the fertilization effect directly affects the number of tillers and the growth in the middle and later stages [7,8]. Excessive fertilization during the tillering stage is likely to increase the ineffective tiller rate and shade the overlapping leaves, whereas the high nitrogen content of the leaves is likely to prevent the transfer of nitrogen metabolism to carbon metabolism, which can prolong nutritional growth, delay the spike stage, and increase the risk of collapse and disease, all of which are not conducive to a stable rice yield [9].
In recent years, the use of agricultural drones for precision fertilizer tracking operations during rice production has been increasingly applied, improving operational efficiency while also reducing farmers’ labor intensity and lowering labor costs [10].
By comparing the droplet uniformity and droplet deposition density under different flight speeds and spray rates of spraying UAVs in paddy fertilizer application operations, Muhammad et al. [11] found that the best spraying effect was achieved when the UAV maintained a low flight speed (2 m/s) with a spray rate of 3.00 L/min, which also provided a basis for determining the optimal operating parameters of the UAV spraying system. Cancan et al. [12] proposed a variable speed fertilizer control system for a UAV-mounted granular fertilizer spreader based on variable-rate technology and the control system could quickly and accurately respond to changes in the target discharge rate, and in a field experiment based on prescription diagrams, Shi et al. [13] found that the error was less than 6.07%. To investigate the effect of spraying a UAV downwash field on plant shape, rice was observed under different flight parameters generated by the UAV. The degree of deformation under the downwash field generated by the different flight parameters of the UAV [14] was closely related to the maximum speed of the downwash field, followed by the flight speed and height; when the maximum wind speed was less than 3 m/s, the downwash field had no significant effect on the plant shape of the induced rice; To investigate the interaction between the rice canopy and the drone wind field, Li et al. [15] collected vertical wind speed data at different heights of the rice canopy using wind speed sensors and found that the vertical wind field formed by the decaying airflow among rice plants was stratified. The lower the height, the greater the reduction, which provides a theoretical basis for the study of the penetration rate of rice canopy droplets and pollination parameters.
Most of the existing rice UAV fertilizer-tracking operations rely on the experience of managers in fertilizer-tracking decisions and lack an effective basis for fertilizer-tracking decisions. With the rapid development of UAV low-altitude remote sensing technology, researchers have carried out research into rice nutrition using UAV remote sensing diagnosis [16,17]. By evaluating the effectiveness of multiple background-effect removal methods in a UAV multispectral rice nitrogen concentration monitoring study, Wang et al. [18] found that the abundance-adjusted vegetation index approach could be refined with a higher number of endmembers and automated endmember extraction and further evaluated for assessing the effect of separating the sunlit components from the shaded components of the canopy. James et al. [19] tried using commercial-scale imagery acquired from airplanes to evaluate a number of nitrogen-uptake modeling methodologies. It was concluded that the machine learning model using multiple remote sensing features predicted the rice N content better than the traditional vegetation index regression method with a root mean square error (RMSE) of 22.9 kg/ha. Shi et al. [20] estimated the dry weight, leaf area index, and nitrogen accumulation of the rice canopy by obtaining RGB images of the canopy and concluded that the regression model based on the random forest algorithm had the best accuracy and generalization ability [21].
At present, most of the research on rice UAV precision fertilizer chasing focuses on nitrogen nutrient detection and there is a lack of research and application examples of combining nutrient diagnosis with UAV precision spraying. In addition, it is difficult to directly guide rice field management with the established rice nutrient detection model. Therefore, this study combines the remote sensing diagnosis of a rice tillering fertilizer-chasing drone with the precision fertilizer-chasing feature of agricultural drones, uses the hyperspectral technology of drones to establish the prescription map of rice tillering fertilizer chasing, and on this basis, combines the parameters of an agricultural drone operation to rasterize the plots to be chased and form the spraying map of the fertilizer-chasing operation, and finally carries out precision fertilizer chasing using plant-protection drones to provide the rice-tillering drone precision variable. It also provides a foundation for the data and model and a reference basis for the rice tillering period.

2. Materials and Methods

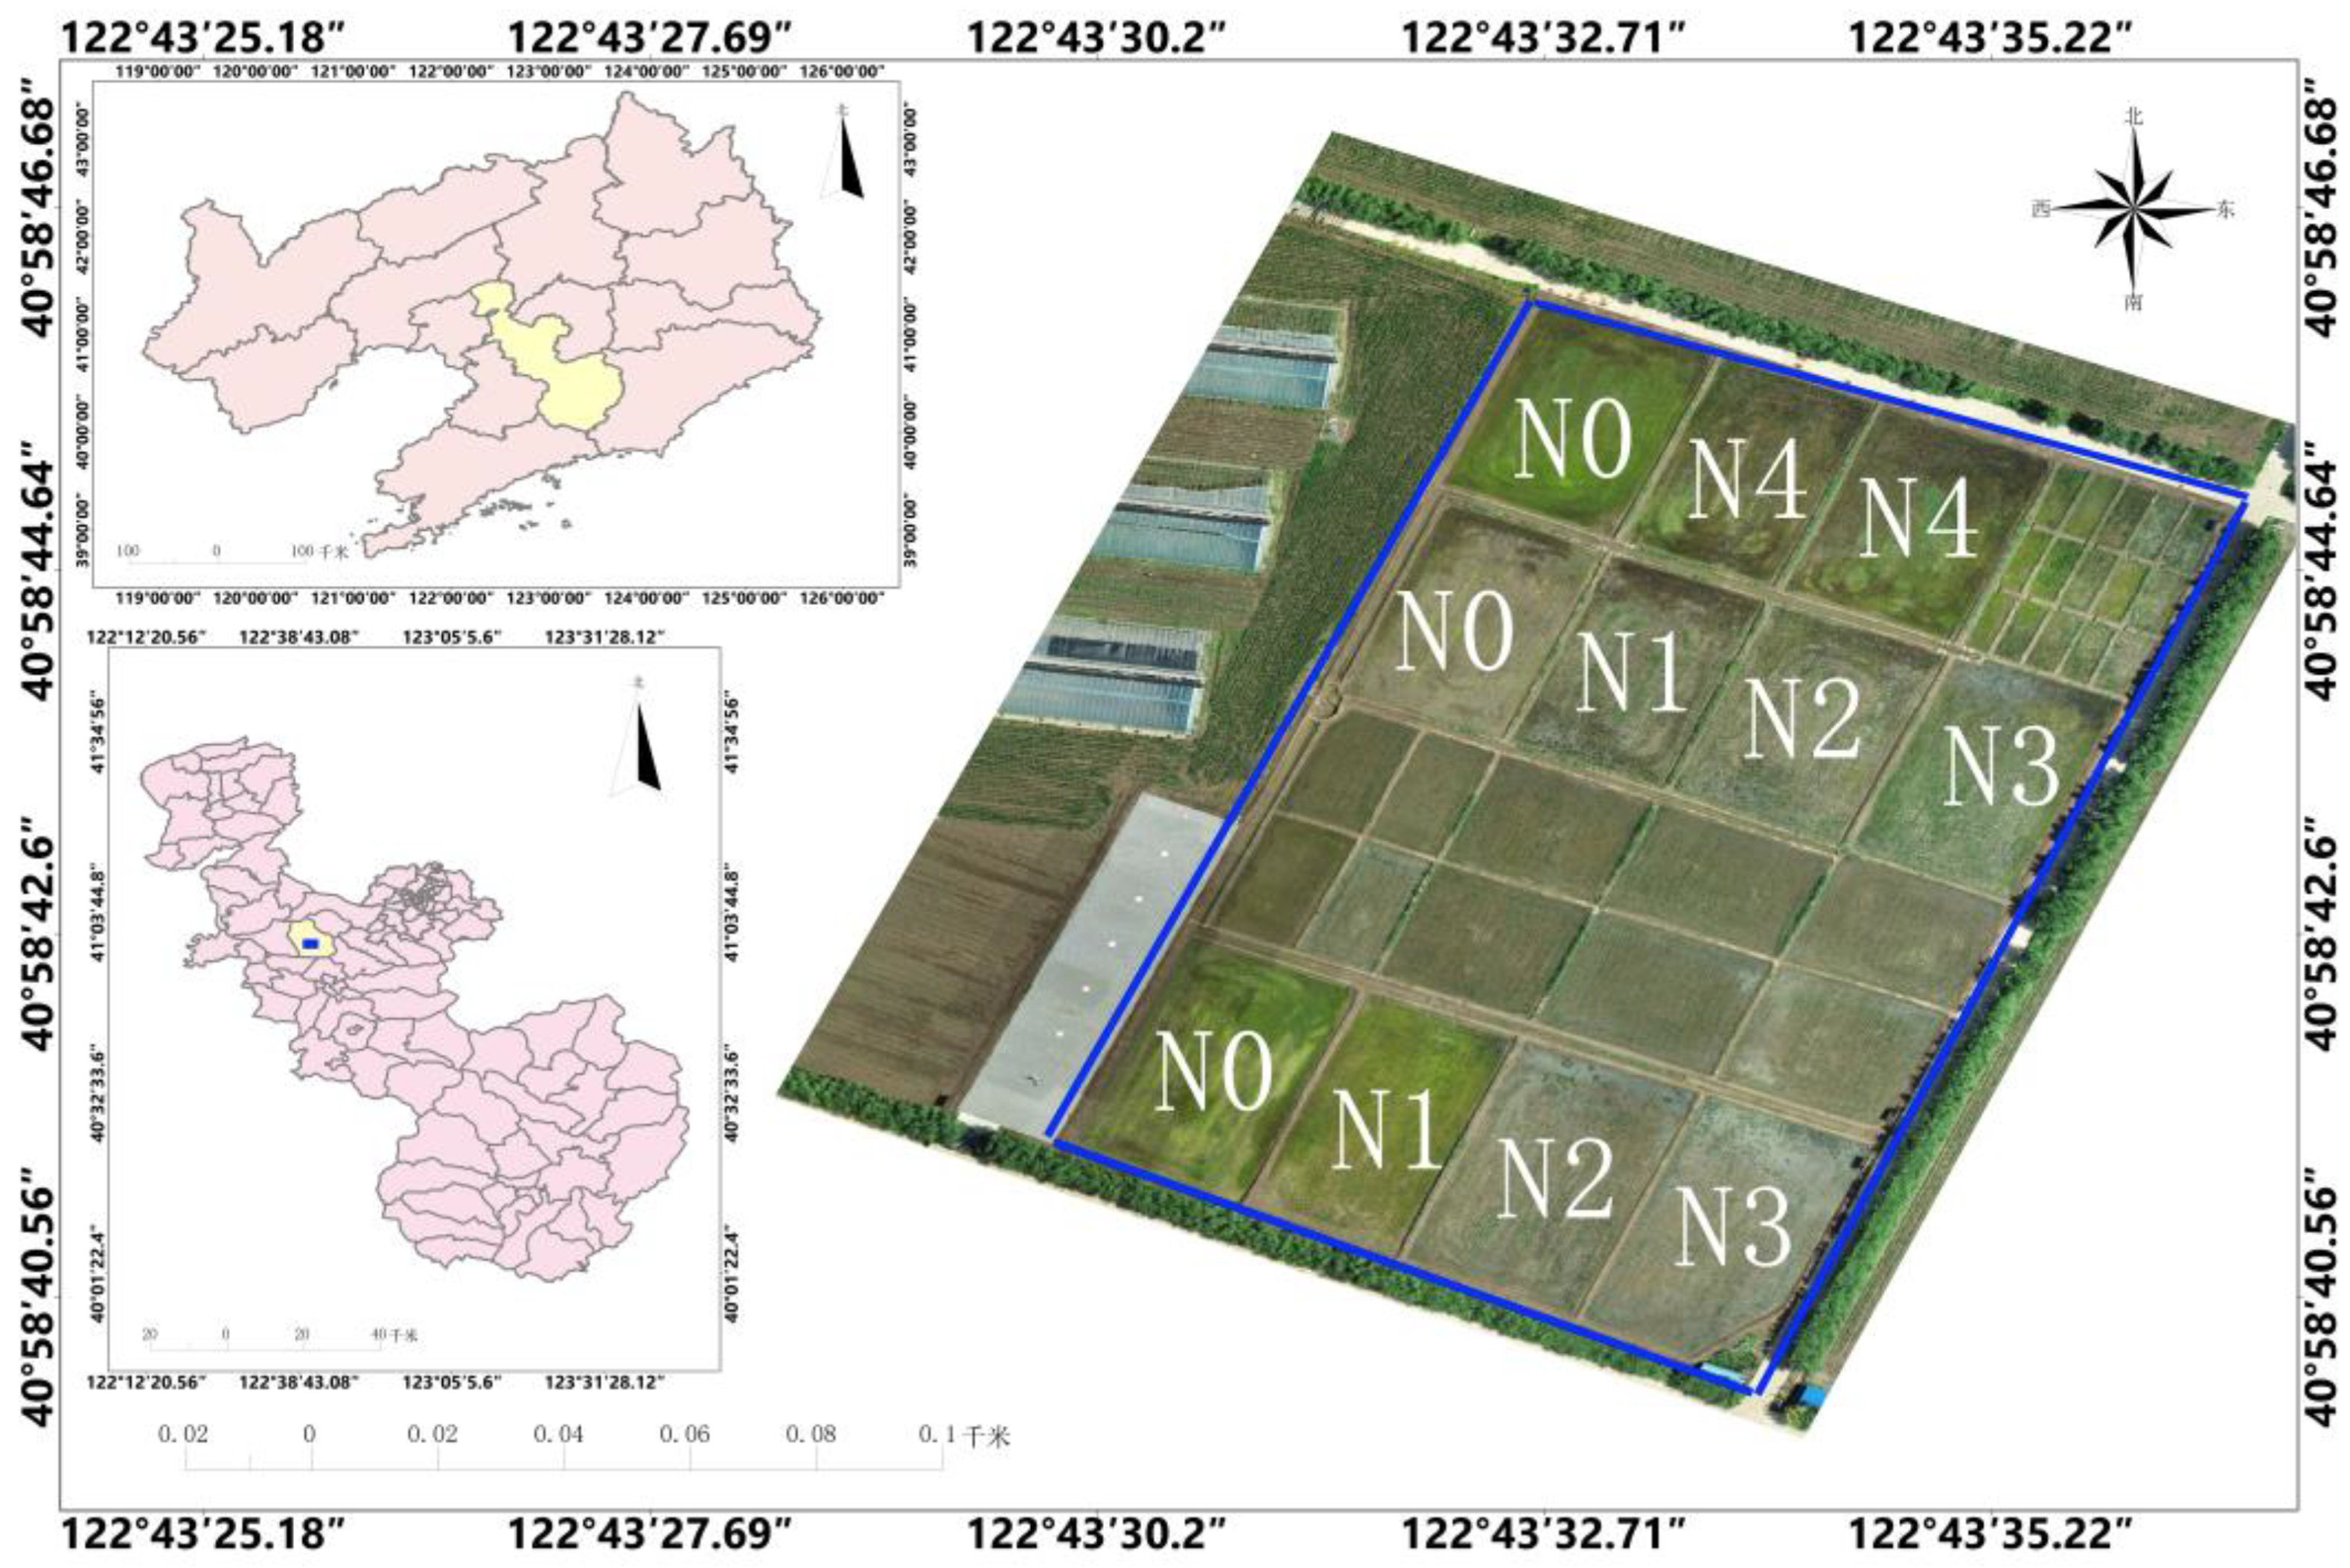
2.1. Study Area and Experimental Details

The experiments were conducted in June−September 2021 at the precision agriculture aerial research base of Shenyang Agricultural University, Gengzhuang Town, Haicheng City, Liaoning Province (40°58′45.39″ N, 122°43′47.0064″ E), and the test variety was “Shennong 9816”. There were five nitrogen (N) fertilizer gradient treatments in the test field: N0, N1, N2, N3, and N4, which were shown in Figure 1. N3 was the local standard N application rate; the N4 and N2 experimental application rates were increased and decreased by 25% of N3, and the N1 rate was decreased by 50% of N3. The five different N application rates were N0 (without N), N1 (100 kg/ha), N2 (150 kg/ha), N3 (200 kg/ha), and N4 (250 kg/ha). Each treatment was replicated four times for a total of 15 test plots. The mass fractions of the total N and quick-acting N in 0–0.5 m tillage soil in the test field were 154 and 104.032 mg/kg, respectively, and the rest of the field was managed under high-yield cultivation. Data were collected at the rejuvenation, tillering, and tasseling stages (as shown in Table 1).

2.2. Data Collection

The UAV hyperspectral platform was the M600 PRO six-rotor UAV (SZ DJI Technology Co. Ltd., China) and the hyperspectral imager was the GaiaSky-mini built-in push-sweep airborne hyperspectral imaging system (Sichuan Shuangli Hepu Technology Co. Ltd., China). The band range of the hyperspectral data was 400–1000 nm, the resolution was 3 nm, the number of influential bands was 253, and the flying height of the UAV was 100 m. Due to the large water layer in the rice field during the tillering period, if the traditional hyperspectral acquisition time is used, it will be interfered with by specular reflection and other interference, causing spectral pollution. Therefore, in order to obtain better data quality, the UAV hyperspectral data acquisition time was selected as between 08:00 and 08:30 in this study, and in order to minimize the measurement error of the hyperspectral images due to the change in the solar altitude angle, the hyperspectral imager was used for the acquisition of white standard-version (reflectance >99%) and instrument-background noise spectral data every 5 min, which was applied to the later hyperspectral calibration of reflectance. Meanwhile, a 1.5 m × 1.5 m diffuse reflectance plate with 60% reflectance was placed in each hyperspectral acquisition area for later reflection data calibration.
For each plot in the sampling point, rice was sampled destructively from the entire hole and then brought back to the laboratory. Then, all the fresh leaves of rice in that hole were cut off and placed in an oven at 120 °C for 60 min and then dried at 65 °C to a constant amount. After weighing and crushing, the ground powder was tested for nitrogen content (mg/g) of the leaves using the Kjeldahl method. At harvest, a 2 m × 2 m area of rice was taken from each test plot and the thousand-grain weight and seed yield were measured.

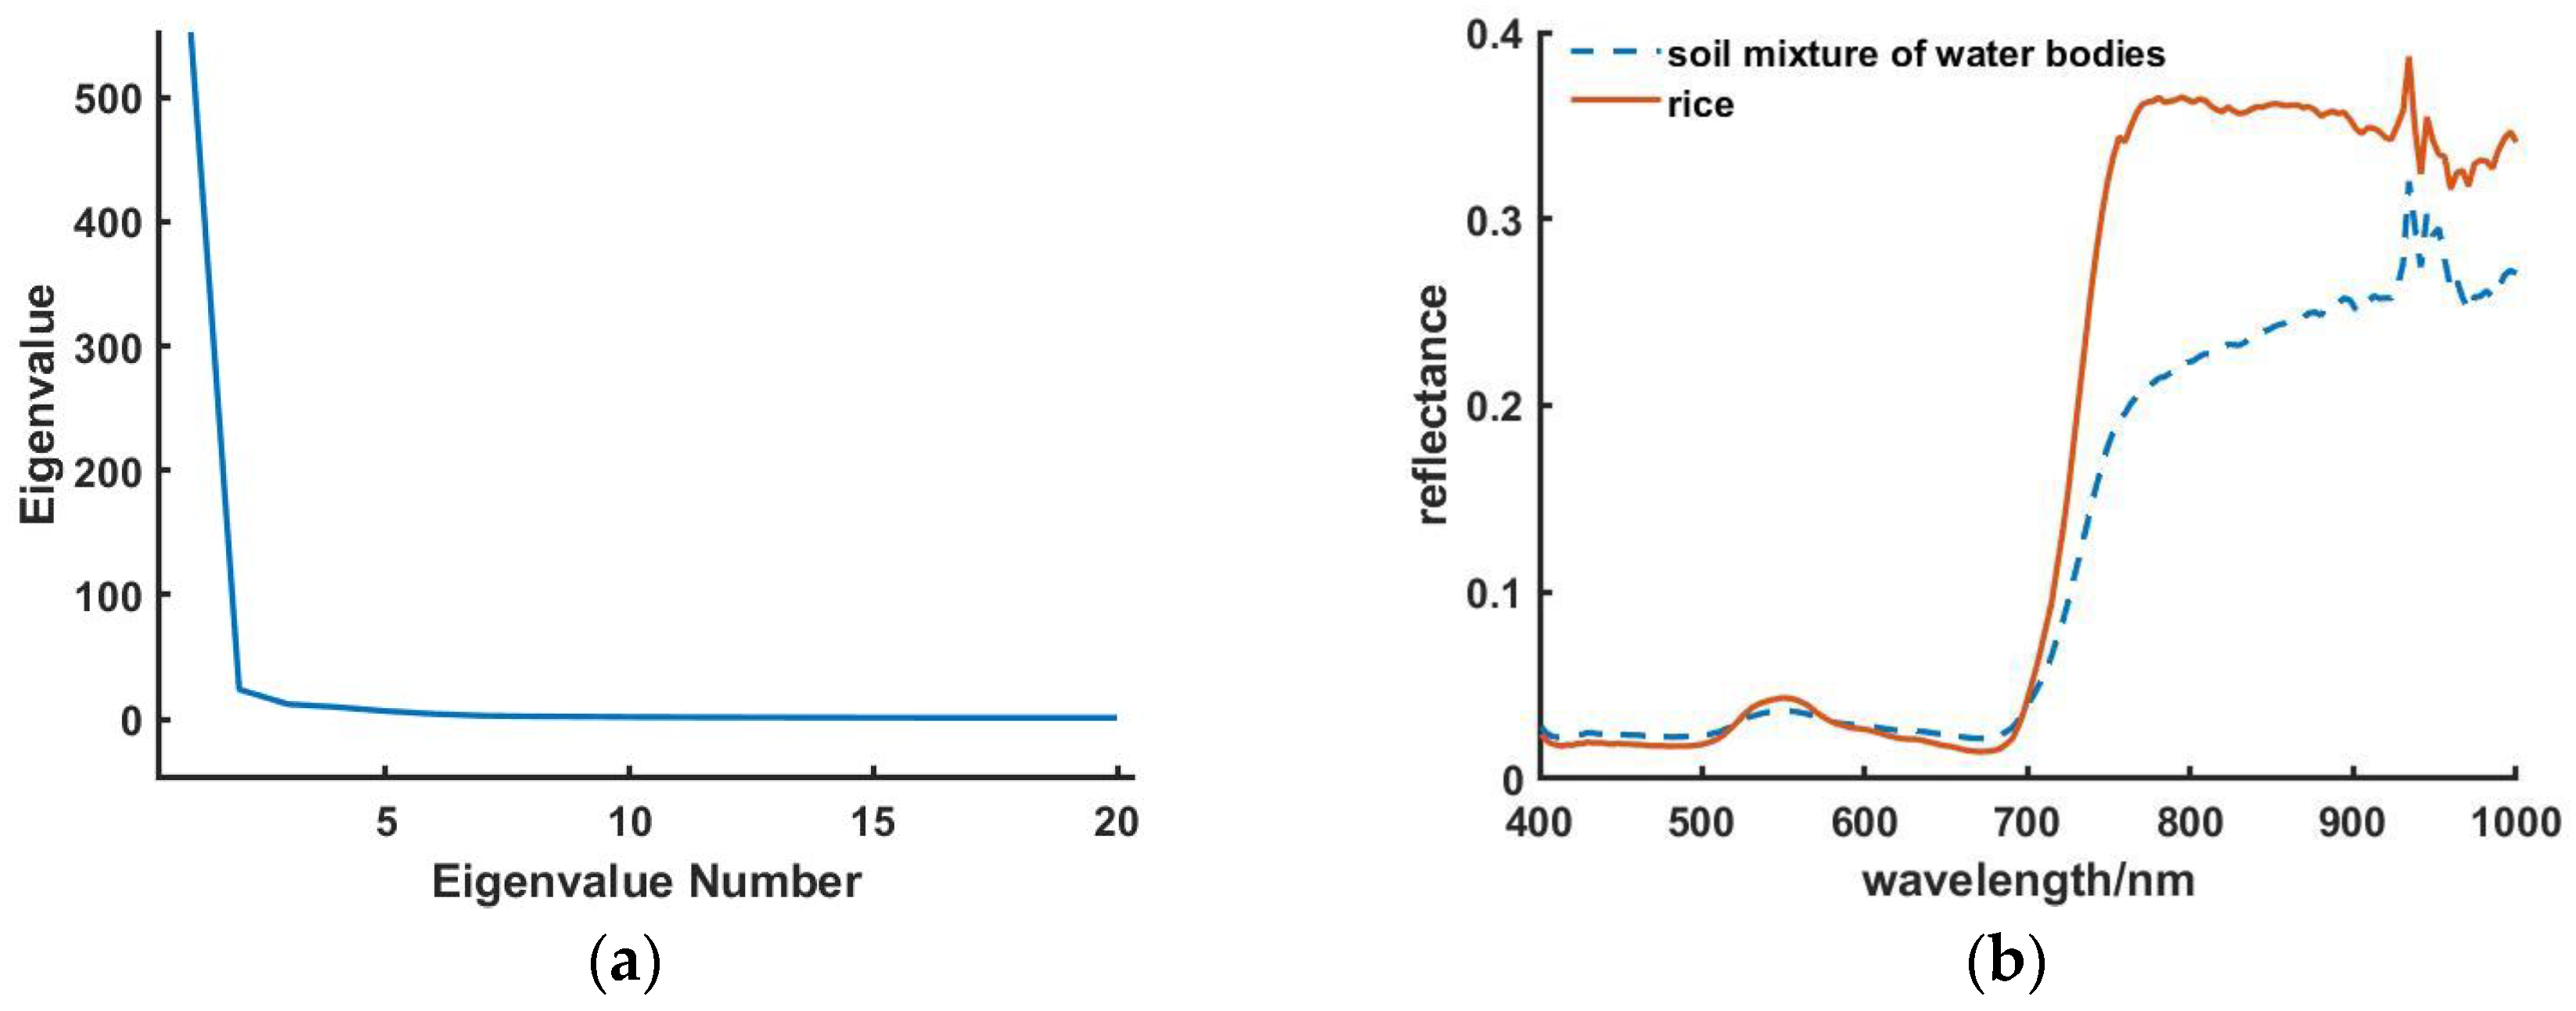
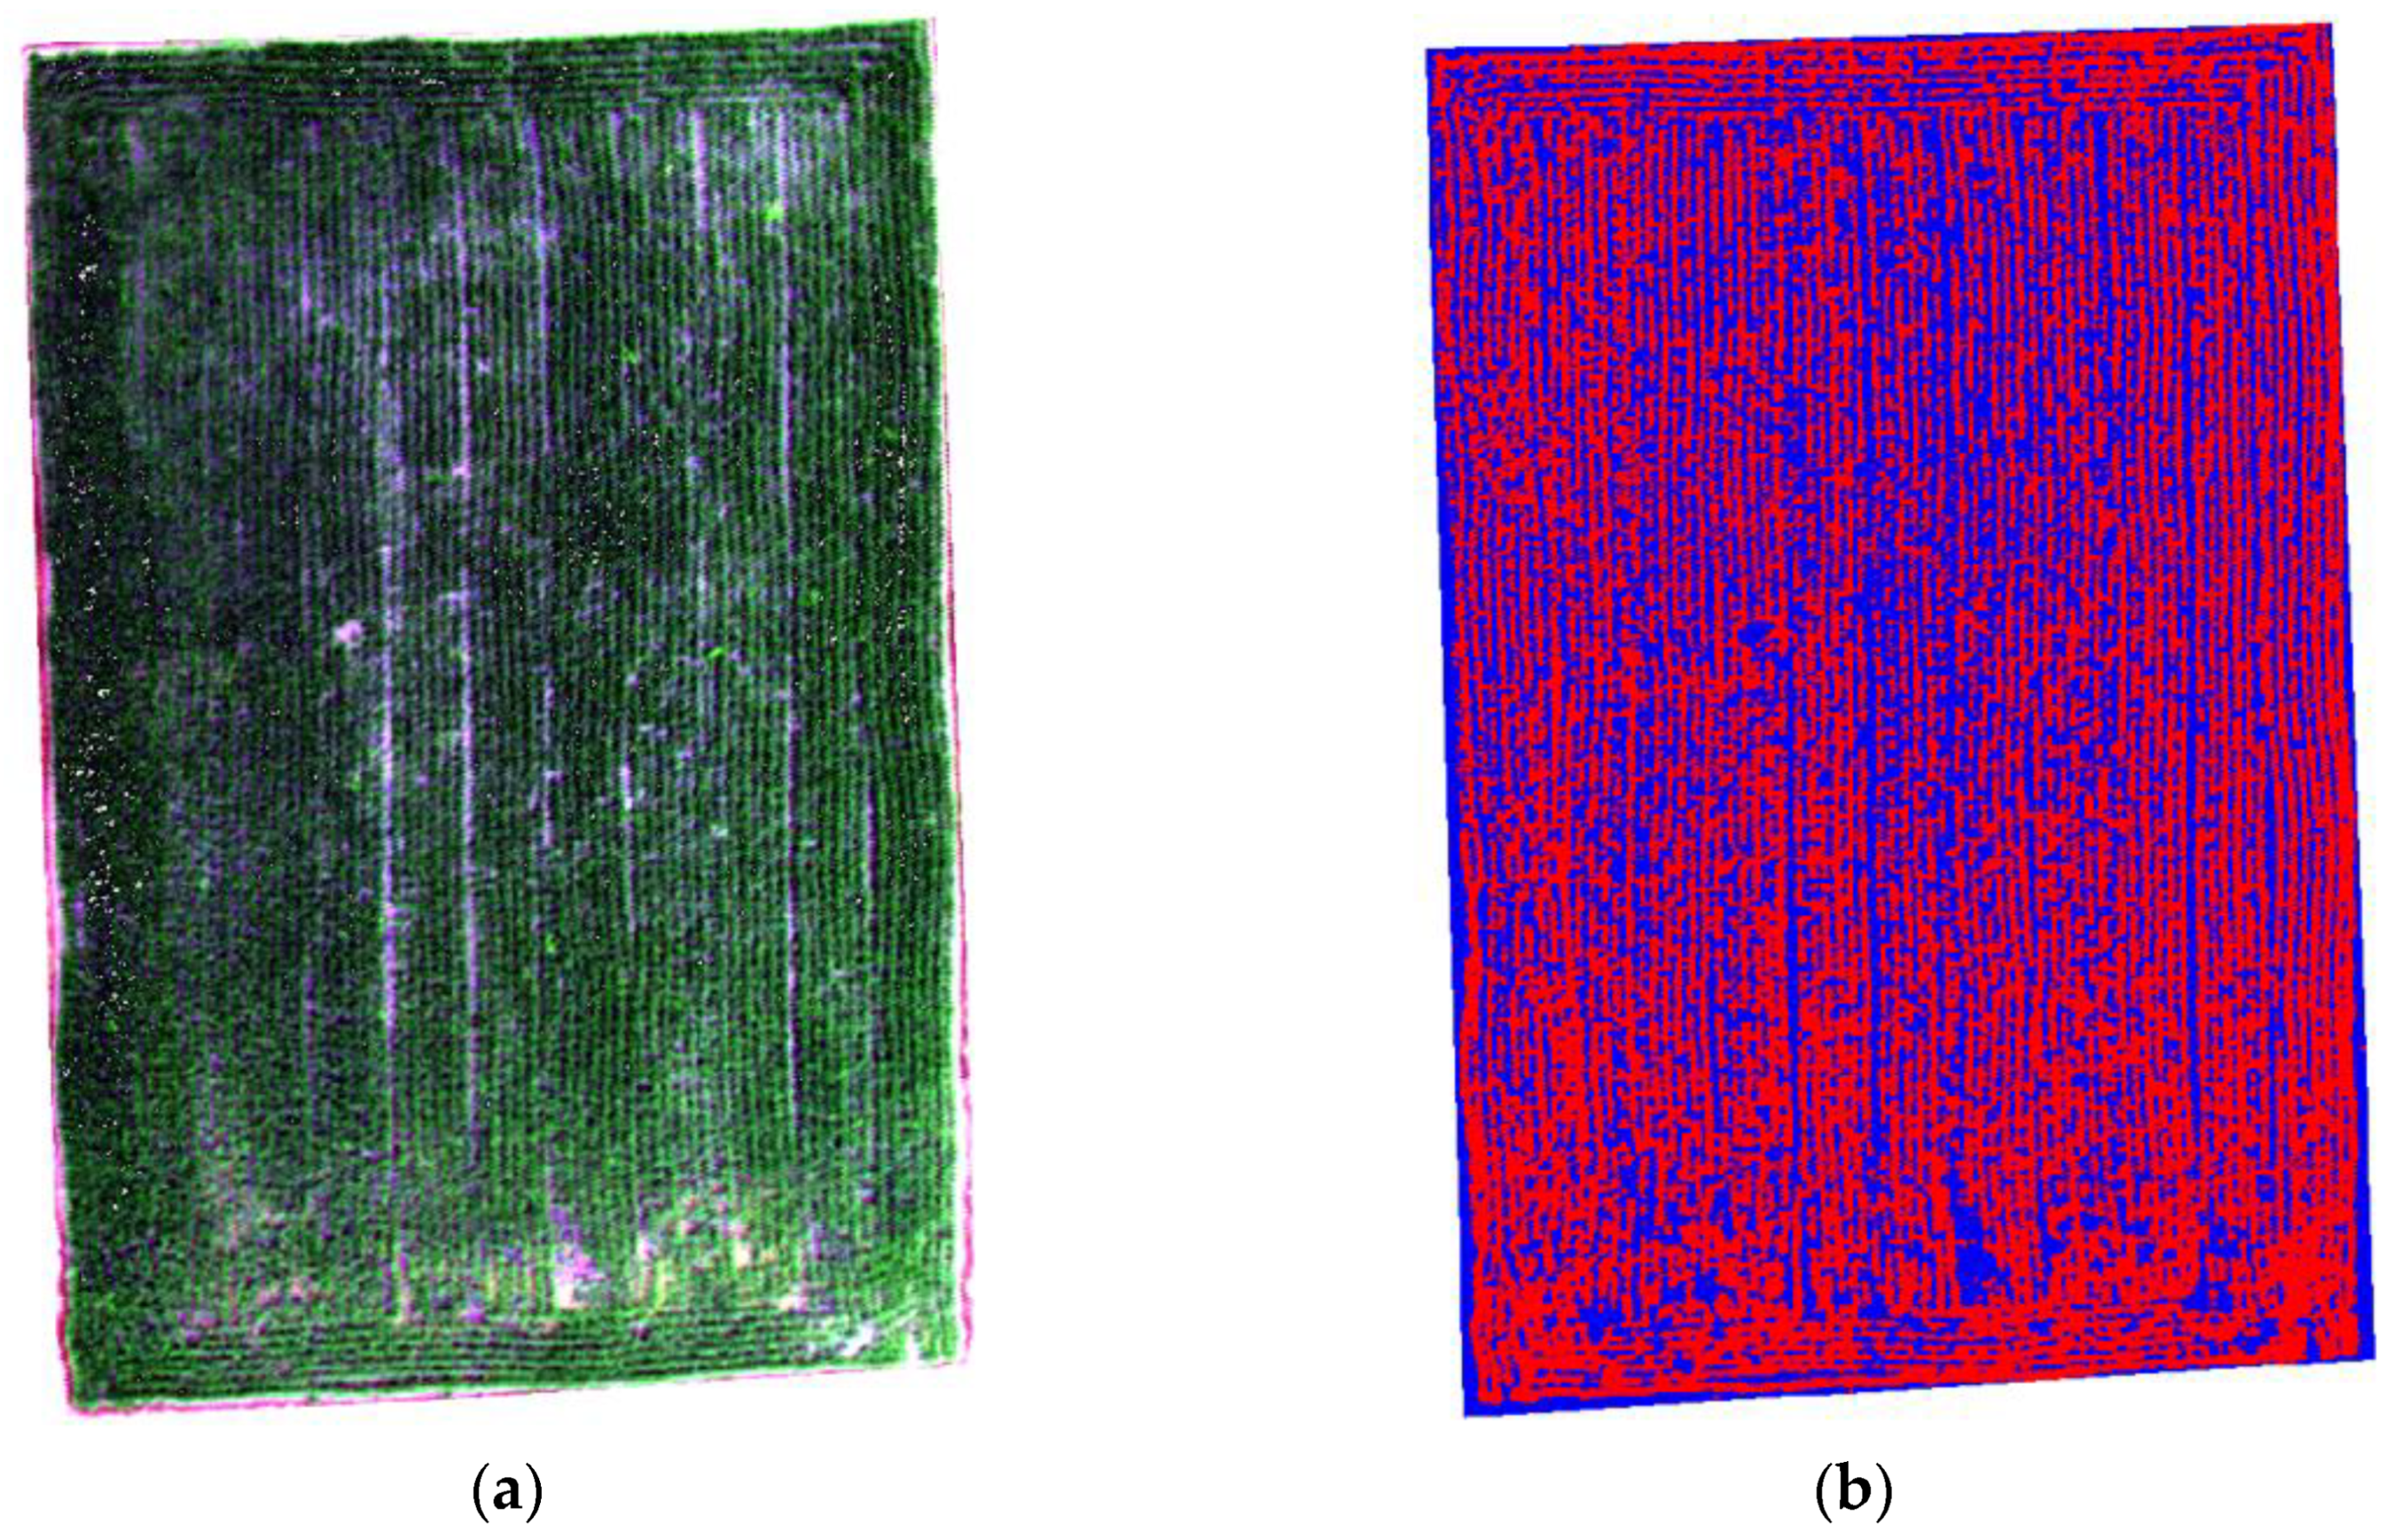
2.3. UAV Hyperspectral Remote Sensing Image Unmixing

The spatial and spectral resolutions of the UAV hyperspectral remote sensing images were relatively high, whereas the rice fields were not yet closed at the tillering stage, and a scene of hyperspectral images includes both rice and disturbance feature information such as water bodies and soil so it is necessary to unmix the UAV hyperspectral remote sensing images and extract rice hyperspectral information for subsequent modeling [22]. In this study, the minimum noise fraction rotation (MNF) method was first used to separate the noise from the data to reduce the computational effort of the subsequent processing [23]. Then, the hyperspectral reflectance curves belonging to rice were extracted from the UAV remote sensing images using the Pixel Purity Index (PPI) method [24], and a feature end-element Popper library was constructed. Finally, the hyperspectral information of rice was extracted by unmixing the UAV hyperspectral remote sensing images using the orthogonal subspace projection method.

2.4. Hyperspectral Remote Sensing Modeling Method for Nitrogen Content of Rice

Hyperspectral data have continuous characteristics in the spectral dimension compared with broadband multispectral data, which can characterize more rice information. At the same time, hyperspectral data also contain a large amount of redundant information, which can cause a reduction in the modeling accuracy and efficiency. In this study, the successive projections algorithm (SPA) combined with red-edge reflectance was used to reduce the dimensionality of the hyperspectral information in the range of 400 nm to 1000 nm [25]. The dimensionality-reduced data were used as the input to the hyperspectral inversion model of nitrogen concentration for the extreme learning machine (ELM) and the whale-optimized extreme learning machine (WOA-ELM) [26].

2.5. UAV Remote Sensing Rice Fertilization Decision and Prescription Map Generation Method

In this study, a production standard field was set as a reference standard in the experimental area according to the field management plan given by rice cultivation experts, the average nitrogen concentration of rice in the standard field in the same period was taken as the target of nitrogen chasing and recorded as N s t d , and the inverse value of the nitrogen concentration of rice to be chased was recorded as N r . Then the diagnosis of nitrogen deficiency in rice at the tillering stage was
N x = N s t d N r
N x is the amount of nitrogen deficiency per unit area at the location to be fertilized. When N r   > 0, it indicates that the nitrogen content at the current location is lower than the nitrogen value of the reference field and external spraying of follow-up fertilizer is required. When N r ≤ 0, it indicates that the location should not be externally sprayed with follow-up fertilizer at present.
After obtaining the nitrogen deficiency amount per unit area of rice, it is necessary to convert the nitrogen deficiency amount into a prescription map to be able to guide the agricultural drones to carry out accurate fertilizer-chasing operations. Since the hyperspectral remote sensing image of a UAV contains a hyperspectral reflectance curve at each pixel point, a fertilizer-chasing amount can be generated for each pixel point using a hyperspectral remote sensing image. Therefore, this study combines the spraying width (w) and speed (v) of the plant protection drone to grid the fertilizer plots per second and generates a nitrogen fertilizer amount for each grid.
A G N = N x × n × B s t d × C s t d k × u × C x  
In the above equation, n is the nitrogen fertilizer concentration (mg/mL) in the UAV tank, B s t d is the above-ground biomass of rice within a single raster area of a standard field (w × v); C s t d and C x are the rice cover within the raster area of the standard field and the field to be fertilized, respectively; k is the fertilizer utilization rate; u is the fertilizer conversion rate; and u and k are empirical values. Through a literature analysis in this study, u was set to 0.6 and k was set to 0.4 [27].

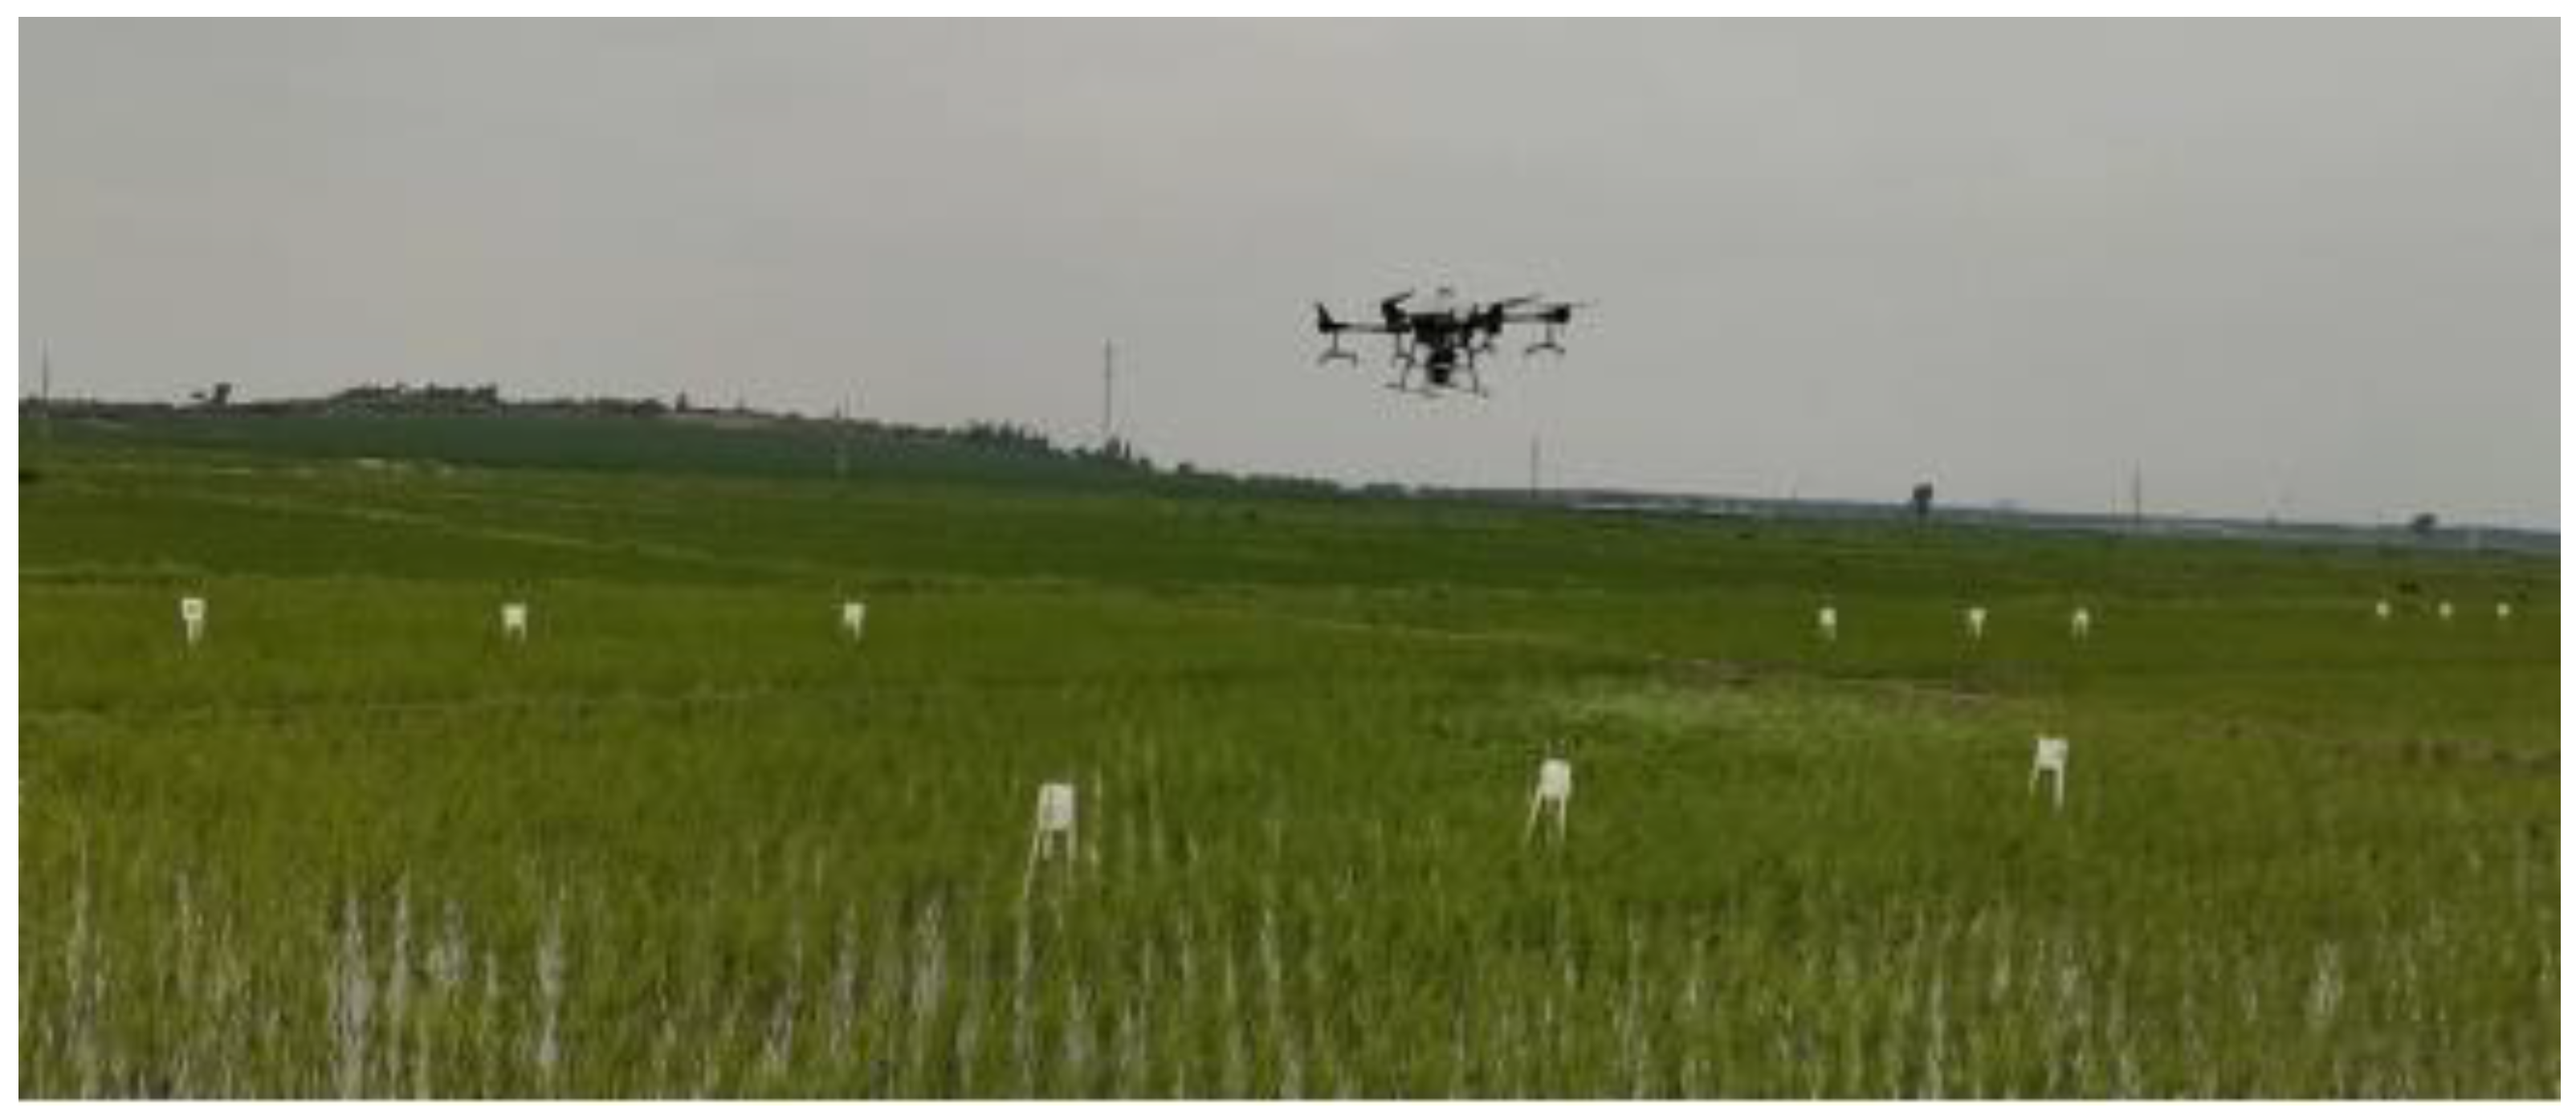
2.6. Agricultural UAV Fertilizer-Chasing Variable Spraying and Effect Evaluation

Differential GPS technology was used to determine the actual position of each chasing grid in the chasing field and the process identification (PID) algorithm was used to achieve variable spraying by controlling the pulse width modulation (PWM) signal of the liquid medicine pump. During the spraying process of the plant protection drone, the fog droplet test cards were arranged on the ground at the same time to calculate parameters such as the fog droplet coverage as an evaluation of the variable chasing effect of the agricultural drone rice tillering stage.

3. Results and Analysis

3.1. Hyperspectral Image Unmixing Results of Rice Tillering Stage

Rice UAV hyperspectral remote sensing image extraction requires the separation of rice from water bodies [28]. Since rice fields are covered with a water layer during the tillering period, the interior of the rice fields mainly consists of two kinds of features, namely rice and the soil mixture of water bodies. The rest of the disturbance features account for very little so this study mainly focused on the extraction of hyperspectral images of the above two kinds of features and extracted the hyperspectral end-element images of the rice fields using the minimum noise separation and pure image element index methods [29,30]. Among them, the minimum noise fraction (MNF) rotation was mainly used to determine the effective data dimension in the hyperspectral images. The forward MNF transformation was used in this paper (Figure 2), and it can be seen from the results that the MNF rotation was essentially a dimensionality reduction process; five band features were extracted from the remote sensing images obtained in this study after the MNF transformation. The extraction results are shown in Figure 2.
Some sunlight is reflected when it hits the water layer and some is reflected by the soil below after passing through the water layer, which eventually forms a mixed spectrum of both. Due to the practical needs of cultivation management in the tillering stage of paddy fields, the soil is completely covered by water and there is no pure soil or pure water, so this study sets the mixed state of water and soil as one type of feature.
In this study, the support vector machine classification method [31] was used with 176 bands as inputs and the region of interest consisted of 320 pixel points for the water and soil mixture, 221 pixel points for rice, and the sample separation of the two regions of interest was 2.0. The hyperspectral information of rice was extracted from the UAV hyperspectral images, as shown in Figure 3b, with red representing rice and blue representing the soil–water mixture.

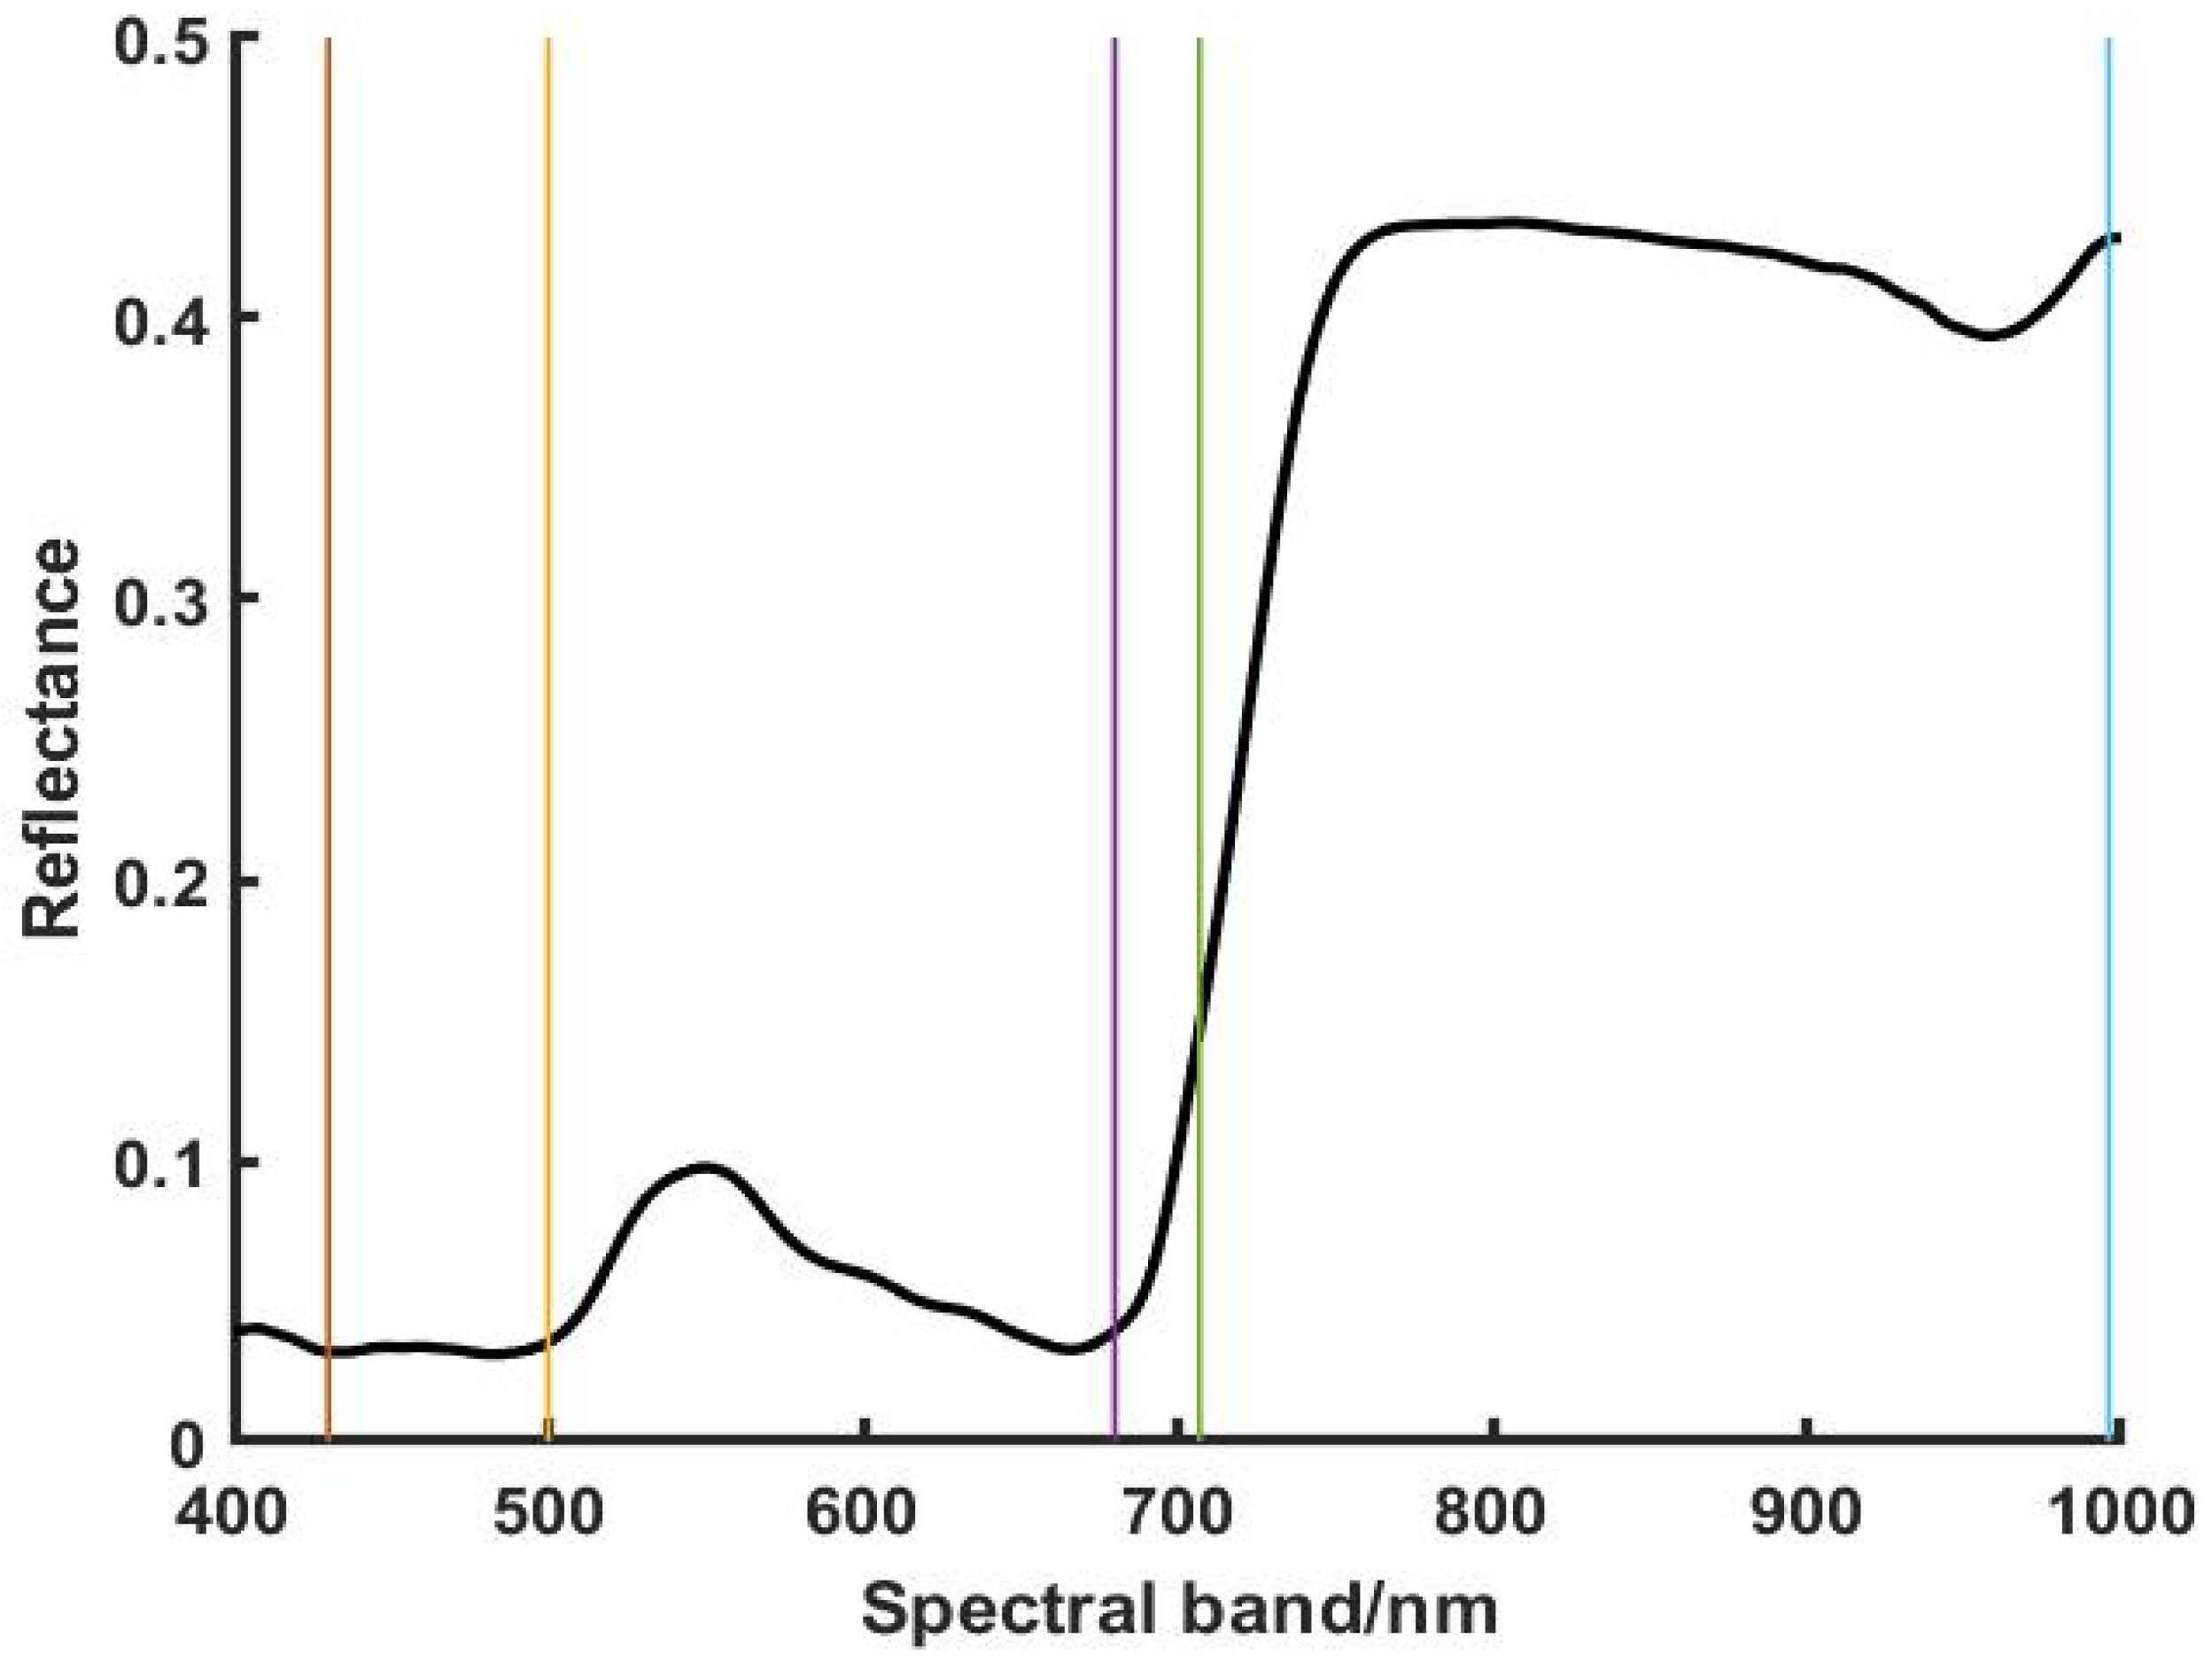
3.2. Hyperspectral Extraction of Rice at Tilling Stage

In this study, the hyperspectral range of 400 nm~1000 nm acquired by the UAV hyperspectral images was first segmented and then feature extraction was performed separately using SPA. The segmentation results are shown in Figure 4 In this study, the hyperspectral range was divided into five segments, which were 400 nm~500 nm, 500 nm~600 nm, 600 nm~690 nm, 690 nm~760 nm, and 760 nm~1000 nm. In the range of 690 nm~760 nm, the reflectance of the red edge of the hyperspectral range was extracted as a feature. The remaining four bands were extracted using the SPA method and five hyperspectral features were extracted in the range of 400 nm~1000 nm. The characteristic bands were 430 nm, 500 nm, 680 nm 707 nm, and 996 nm.

3.3. WOA-ELM Inversion Model for Nitrogen Content of Rice

The extracted five rice hyperspectral feature covariates were used as the ELM and WOA-ELM model inputs to establish the nitrogen content inversion model. Through repeated experiments, the model parameters of the WOA optimization algorithm were set as follows: the maximum number of iterations was 50, the initial number of populations was 45, and the number of hidden layers was 10. The results of the inversion model of rice nitrogen content using the WOA-ELM inversion method were better than the inversion effect using ELM alone, with an R2 of 0.899 and an RMSE of 0.271 (Figure 5).

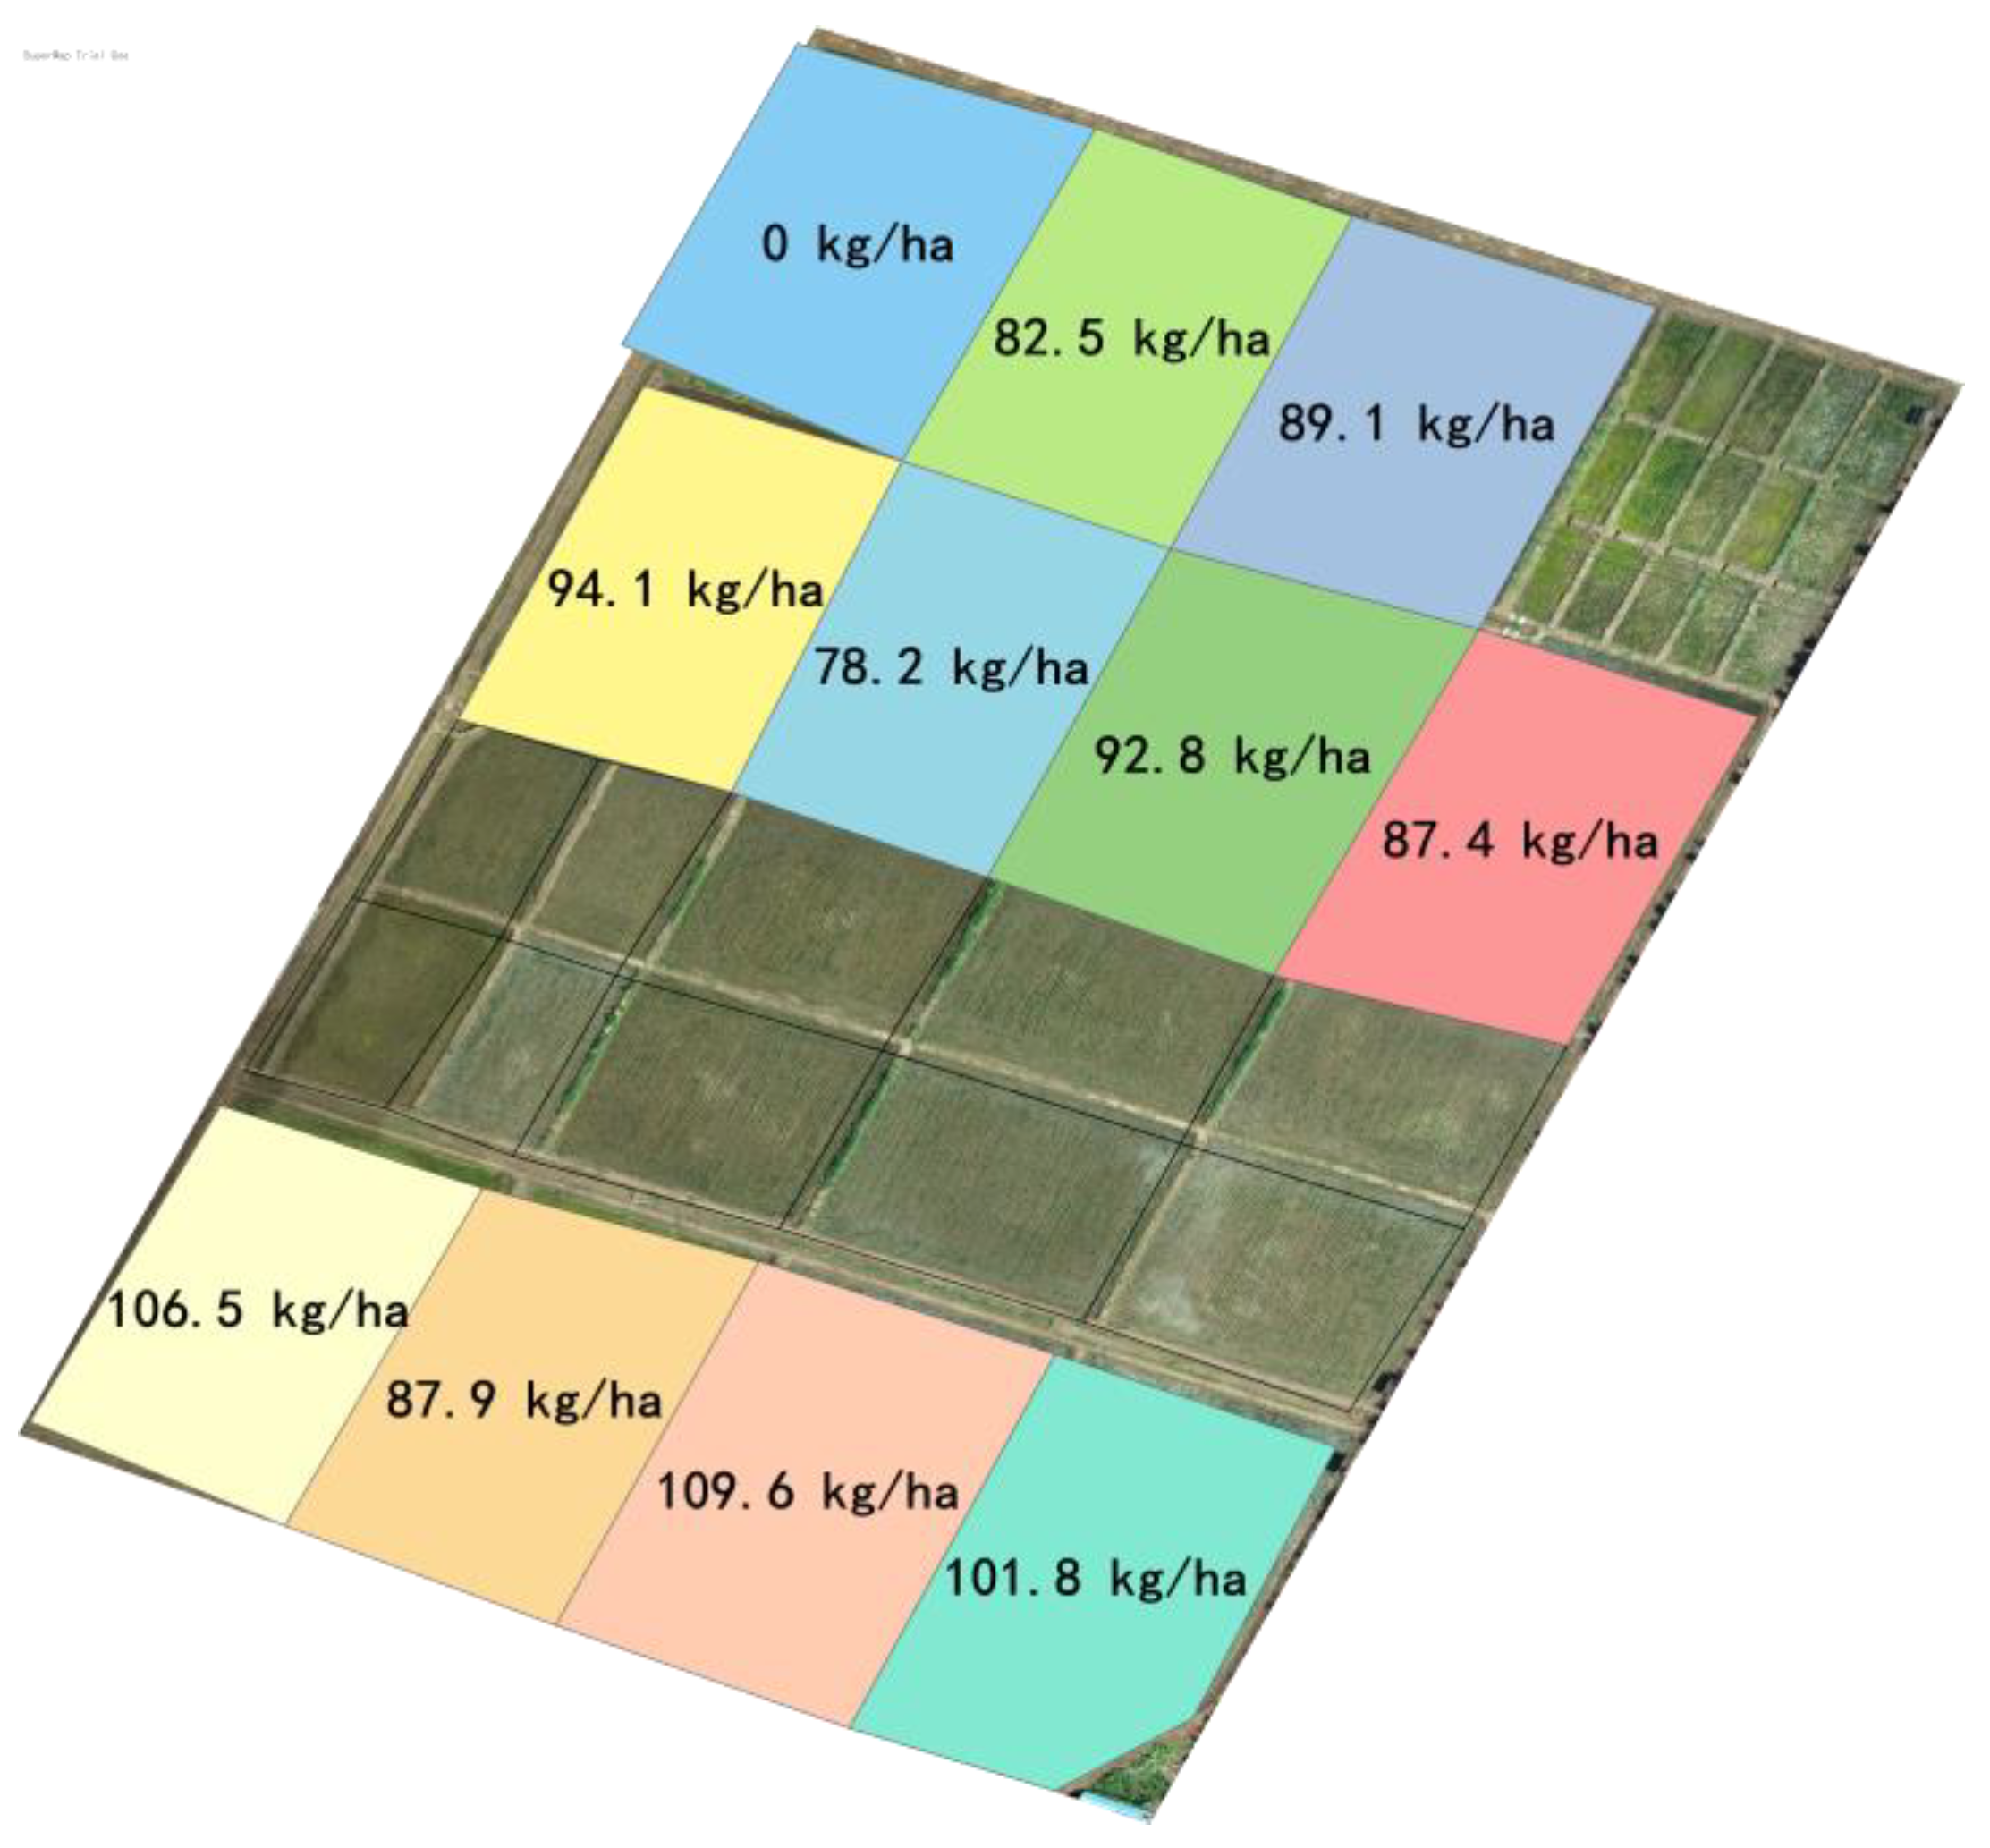
3.4. Rice Fertilization Prescription Map Generation for Agricultural UAVs

A UAV fertilizer-chasing operation needs to consider parameters such as the flight speed and spray width of agricultural drones, as well as the response time of the spreading system. Since the UAV hyperspectral remote sensing image is continuous information in a two-dimensional space, each pixel point can invert a fertilizer-chasing volume. In the actual operation, the agricultural UAV granular-fertilizer-spreading operation system cannot target each pixel point for the direct spraying operation. A raster segmentation of the hyperspectral remote sensing image inversion results is required. Meanwhile, since water exists in the field for most of the time during the mid-growth stage of rice, this study generated the agricultural UAV fertilizer-chasing operation prescription map with the minimum unit of the field and combined the differential GPS information to form an agricultural UAV-variable fertilizer-chasing prescription map (Figure 6).

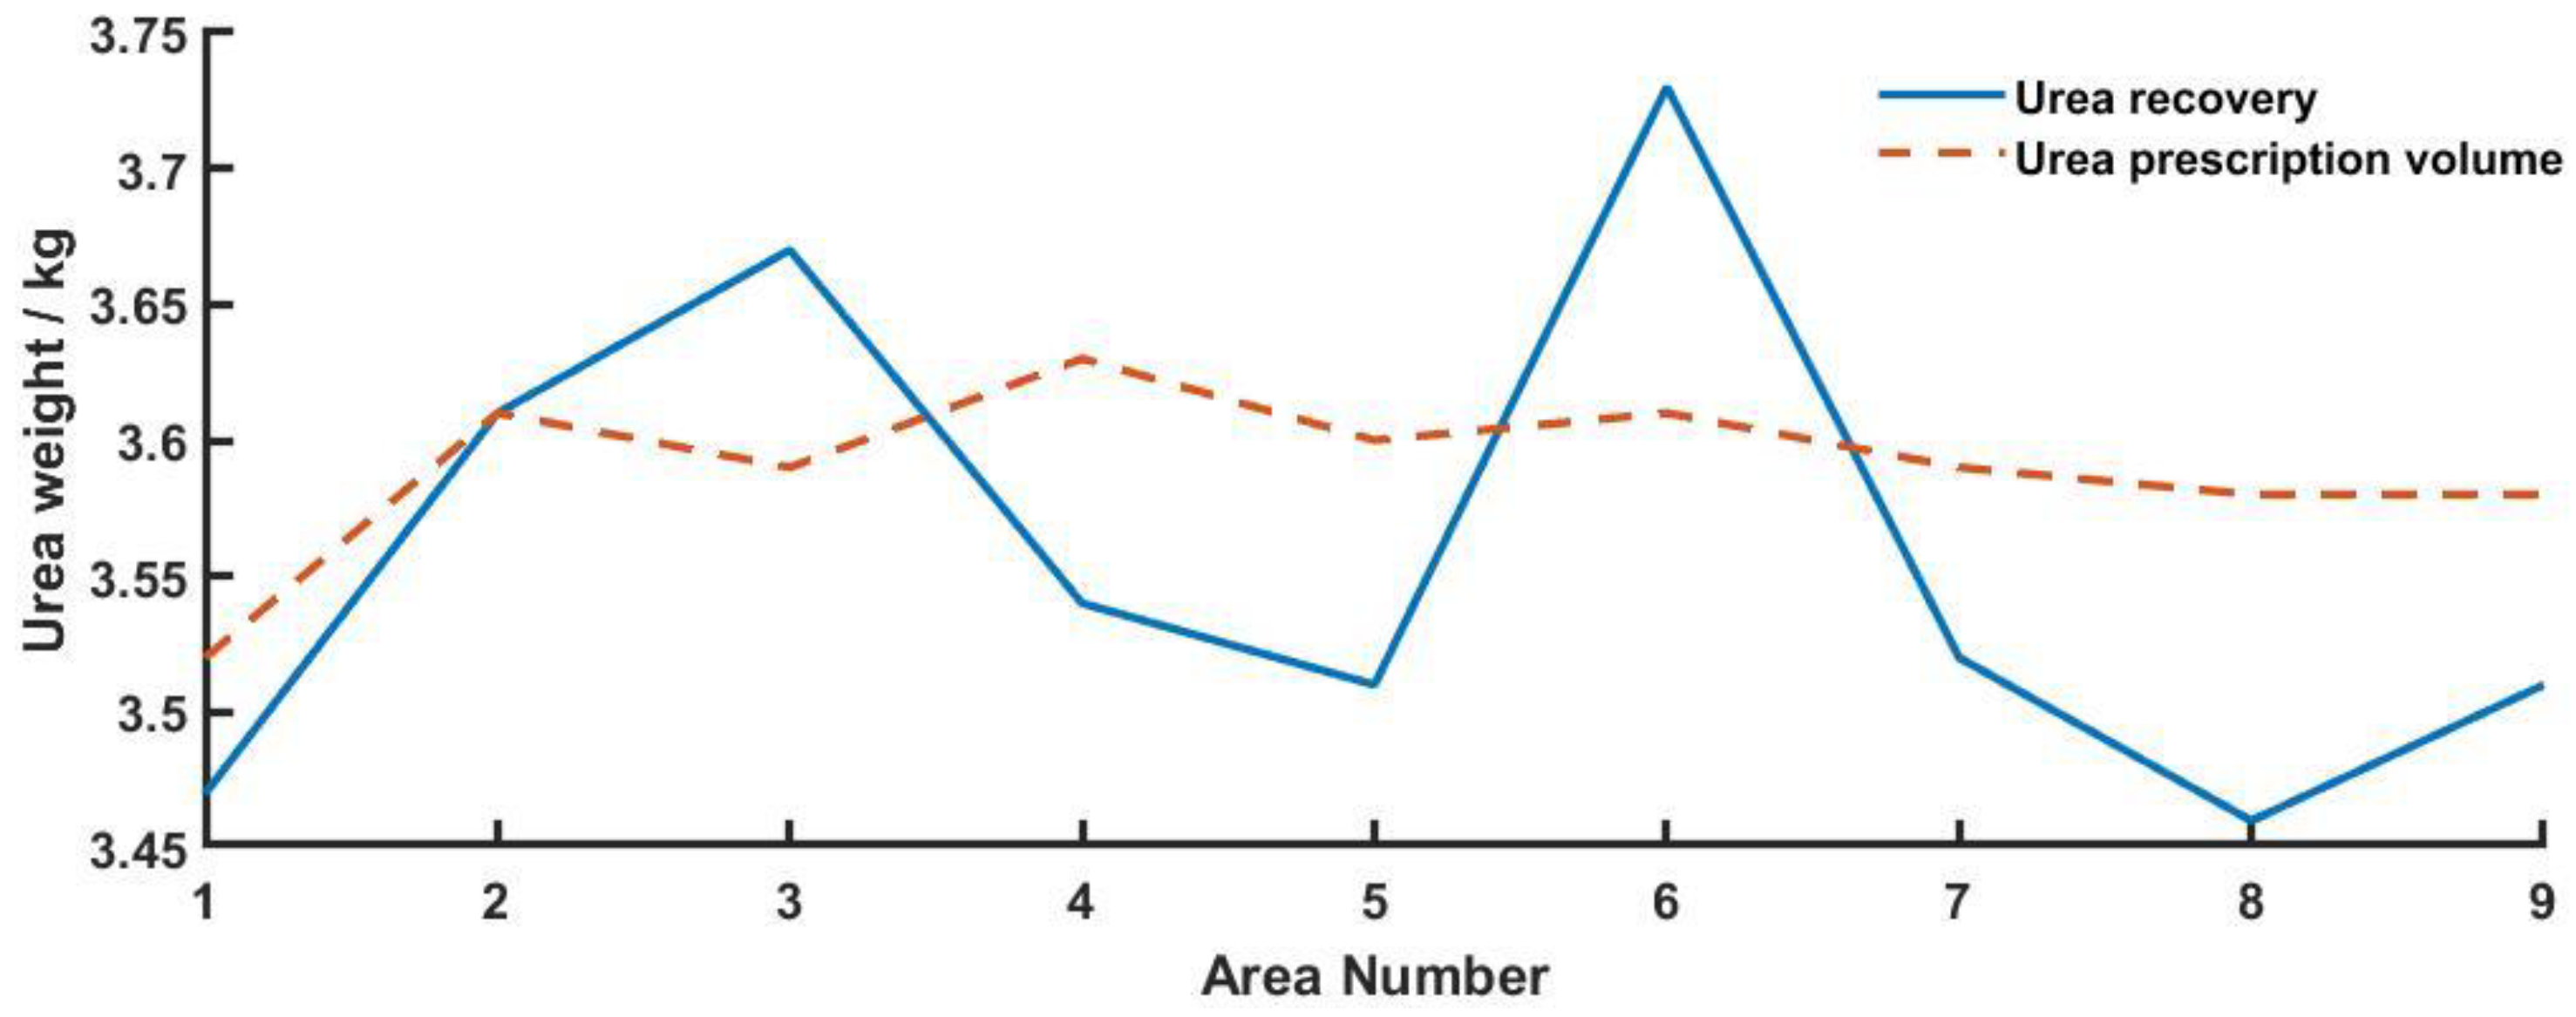
3.5. Evaluation of Fertilizer Chasing and Spraying Effect by Agricultural UAVs

In this study, 20 fertilizer granule collection buckets were set up in the field, as shown in Figure 7. The white markers in the paddy field are the granule fertilizer recovery buckets set up for this study and the results are shown in Figure 8, where the amount of fertilizer collected in the buckets is converted into standard units by combining the cross-sectional areas of the recovery buckets.
From the effect of the spreading and recovery of agricultural UAV granular fertilizer, the difference between the actual spreading amount of the UAV granular fertilizer and the spreading amount on the prescription map was small. The error value of each plot did not exceed 4.3% and the RMSE between the two was 0.0841. The reason for such a result is due to the joint influence of multiple factors such as the wind field and system delay during the operation of the agricultural UAV spreading system, but the overall difference between the deposition effect and the tracking amount given in the prescription map was not great. The actual fertilizer application is shown in Table 2 and after removing control area 9, the ratio of the total actual fertilizer application to the standard fertilizer application was calculated. The results yielded a 24.76% reduction in the amount of nitrogen fertilizer chasing compared to traditional manual fertilization.

4. Discussion and Conclusions

This paper attempts to use UAV hyperspectral remote sensing technology to obtain the nitrogen deficit status in rice fields to assist in the generation of fertilizer application prescription maps, thus realizing the technical linkage of “accurate monitoring—accurate fertilizer application”, which provides a new idea and solution for accurate fertilizer application by UAVs. It provides a new idea and solution for UAV precision fertilization.
The nitrogen deficit is calculated based on the nitrogen content of the reference field managed by the expert recommendation program, which can avoid errors caused by factors such as variety and climate, is more relevant and convincing, and is easier to implement in actual production than in empirical calculations. The hyperspectral inversion model of nitrogen content was well constructed using the extreme learning machine method optimized using the whale optimization algorithm, with a model coefficient of determination R2 of 0.899. The nitrogen content (Nr), field standard N content (Nstd), nitrogen fertilizer concentration (n), rice above-ground biomass (Bstd), rice cover (Cstd, Cx), fertilizer utilization rate (k), conversion rate (u), and other indicators were combined with the area to be fertilized to construct an agricultural drone decision model AGN and generate the fertilizer-chasing prescription map. The experimental results showed that the granular fertilizer-spreading error was small and the final fertilizer application was reduced better than when using a traditional manual fertilizer application. In addition, the chasing amount was reduced by 24.76%, indicating that precise fertilization according to the actual nitrogen fertilizer demand in the rice field had a positive effect on reducing fertilizer use.
The conversion process between the rice N deficit and the actual fertilizer application is complicated and a simple calculation based on the absorption rate will have some errors. In addition, the monitoring of the N content adopts a machine learning method and there is a possibility of poor generalization. The prescription map is generated by the units of the field and the fertilizer application amount does not change according to the different rice-growth conditions in the field and the granular fertilizer application. The process of granular fertilizer application is also affected by problems such as the wind field and system delay. In the future, we will conduct in-depth research on the estimation of the nitrogen deficit and a precise fertilizer-tracking method. In addition, we will further optimize the method of fertilizer prescription map generation and granular fertilizer application control systems while exploring a more practical and mechanistic method of nitrogen deficit estimation in order to improve the final tracking accuracy.

Author Contributions

Conceptualization, F.Y., J.B., Z.J. and C.C.; methodology, F.Y., J.B., Z.J., H.Z. and Z.G.; software, F.Y., Z.J.; validation, F.Y., J.B., Z.J. and H.Z.; formal analysis, J.B. and Z.J.; investigation, F.Y., J.B.; resources, F.Y., C.C.; data curation, F.Y., J.B. and Z.J.; writing—original draft preparation, F.Y., J.B. and Z.J.; writing—review and editing, F.Y., J.B. and Z.J.; visualization, J.B. and Z.J.; supervision, C.C.; project administration, F.Y. and C.C.; funding acquisition, C.C. All authors have read and agreed to the published version of the manuscript.

Funding

This work was supported by grants from the Scientific Study Project for the Ministry of Education, Liaoning Province (LSNZD202005).

Data Availability Statement

All data supporting the findings of this study are included in the article.

Conflicts of Interest

The authors declare no conflict of interest.

References

  1. Ma, G.-H.; Yuan, L.-P. Hybrid rice achievements, development and prospect in China. J. Integr. Agric. 2015, 14, 197–205. [Google Scholar] [CrossRef]
  2. Cao, D.; Feng, J.-Z.; Bai, L.-Y.; Xun, L.; Jing, H.-T.; Sun, J.-K.; Zhang, J.-H. Delineating the rice crop activities in Northeast China through regional parametric synthesis using satellite remote sensing time-series data from 2000 to 2015. J. Integr. Agric. 2021, 20, 424–437. [Google Scholar] [CrossRef]
  3. Chen, P.; Nie, T.; Chen, S.; Zhang, Z.; Qi, Z.; Liu, W. Recovery efficiency and loss of 15N-labelled urea in a rice-soil system under water saving irrigation in the Songnen Plain of Northeast China. Agric. Water Manag. 2019, 222, 139–153. [Google Scholar] [CrossRef]
  4. Liu, Y.; Liu, X.; Liu, Z. Effects of climate change on paddy expansion and potential adaption strategies for sustainable agriculture development across Northeast China. Appl. Geogr. 2022, 141, 102667. [Google Scholar] [CrossRef]
  5. Xin, F.; Xiao, X.; Dong, J.; Zhang, G.; Zhang, Y.; Wu, X.; Li, X.; Zou, Z.; Ma, J.; Du, G.; et al. Large increases of paddy rice area, gross primary production, and grain production in Northeast China during 2000–2017. Sci. Total Environ. 2020, 711, 135183. [Google Scholar] [CrossRef]
  6. Yin, Y.; Peng, X.; Guo, S.; Zhai, L.; Hua, L.; Wang, H.; Liu, H. How to improve the light-simplified and cleaner production of rice in cold rice areas from the perspective of fertilization. J. Clean. Prod. 2022, 361, 131694. [Google Scholar] [CrossRef]
  7. Prudnikova, E.; Savin, I.; Vindeker, G.; Grubina, P.; Shishkonakova, E.; Sharychev, D. Influence of Soil Background on Spectral Reflectance of Winter Wheat Crop Canopy. Remote Sens. 2019, 11, 1932. [Google Scholar] [CrossRef] [Green Version]
  8. Wang, W.; Wu, Y.; Zhang, Q.; Zheng, H.; Yao, X.; Zhu, Y.; Cao, W.; Cheng, T. AAVI: A Novel Approach to Estimating Leaf Nitrogen Concentration in Rice From Unmanned Aerial Vehicle Multispectral Imagery at Early and Middle Growth Stages. IEEE J. Sel. Top. Appl. Earth Obs. Remote Sens. 2021, 14, 6716–6728. [Google Scholar] [CrossRef]
  9. Yang, D.; Peng, S.; Zheng, C.; Xiang, H.; Huang, J.; Cui, K.; Wang, F. Effects of nitrogen fertilization for bud initiation and tiller growth on yield and quality of rice ratoon crop in central China. Field Crop. Res. 2021, 272, 108286. [Google Scholar] [CrossRef]
  10. Rejeb, A.; Abdollahi, A.; Rejeb, K.; Treiblmaier, H. Drones in agriculture: A review and bibliometric analysis. Comput. Electron. Agric. 2022, 198, 107017. [Google Scholar] [CrossRef]
  11. Kharim, M.N.A.; Wayayok, A.; Shariff, A.R.M.; Abdullah, A.F.; Husin, E.M. Droplet deposition density of organic liquid fertilizer at low altitude UAV aerial spraying in rice cultivation. Comput. Electron. Agric. 2019, 167, 105045. [Google Scholar] [CrossRef]
  12. Song, C.; Zhou, Z.; Zang, Y.; Zhao, L.; Yang, W.; Luo, X.; Jiang, R.; Ming, R.; Zang, Y.; Zi, L.; et al. Variable-rate control system for UAV-based granular fertilizer spreader. Comput. Electron. Agric. 2020, 180, 105832. [Google Scholar] [CrossRef]
  13. Shi, Q.; Liu, D.; Mao, H.; Shen, B.; Li, M. Wind-induced response of rice under the action of the downwash flow field of a multi-rotor UAV. Biosyst. Eng. 2021, 203, 60–69. [Google Scholar] [CrossRef]
  14. Yao, L.; Wang, Q.; Yang, J.; Zhang, Y.; Zhu, Y.; Cao, W.; Ni, J. UAV-Borne Dual-Band Sensor Method for Monitoring Physiological Crop Status. Sensors 2019, 19, 816. [Google Scholar] [CrossRef] [PubMed] [Green Version]
  15. Li, J.; Shi, Y.; Lan, Y.; Guo, S. Vertical distribution and vortex structure of rotor wind field under the influence of rice canopy. Comput. Electron. Agric. 2019, 159, 140–146. [Google Scholar] [CrossRef]
  16. Li, D.; Wang, X.; Zheng, H.; Zhou, K.; Yao, X.; Tian, Y.; Zhu, Y.; Cao, W.; Cheng, T. Estimation of area- and mass-based leaf nitrogen contents of wheat and rice crops from water-removed spectra using continuous wavelet analysis. Plant Methods 2018, 14, 1–20. [Google Scholar] [CrossRef] [PubMed]
  17. Zhou, K.; Cheng, T.; Zhu, Y.; Cao, W.; Ustin, S.L.; Zheng, H.; Yao, X.; Tian, Y. Assessing the Impact of Spatial Resolution on the Estimation of Leaf Nitrogen Concentration Over the Full Season of Paddy Rice Using Near-Surface Imaging Spectroscopy Data. Front. Plant Sci. 2018, 9, 964. [Google Scholar] [CrossRef] [PubMed] [Green Version]
  18. Wang, W.; Zheng, H.; Wu, Y.; Yao, X.; Zhu, Y.; Cao, W.; Cheng, T. An assessment of background removal approaches for improved estimation of rice leaf nitrogen concentration with unmanned aerial vehicle multispectral imagery at various observation times. Field Crop. Res. 2022, 283, 108543. [Google Scholar] [CrossRef]
  19. Brinkhoff, J.; Dunn, B.W.; Robson, A.J. Rice nitrogen status detection using commercial-scale imagery. Int. J. Appl. Earth Obs. Geoinf. 2021, 105, 102627. [Google Scholar] [CrossRef]
  20. Shi, P.; Wang, Y.; Xu, J.; Zhao, Y.; Yang, B.; Yuan, Z.; Sun, Q. Rice nitrogen nutrition estimation with RGB images and machine learning methods. Comput. Electron. Agric. 2021, 180, 105860. [Google Scholar] [CrossRef]
  21. Barbedo J G, A. Detection of nutrition deficiencies in plants using proximal images and machine learning: A review. Comput. Electron. Agric. 2019, 162, 482–492. [Google Scholar] [CrossRef]
  22. Moghimi, A.; Yang, C.; Anderson, J.A. Aerial hyperspectral imagery and deep neural networks for high-throughput yield phenotyping in wheat. Comput. Electron. Agric. 2020, 172, 105299. [Google Scholar] [CrossRef] [Green Version]
  23. Lixin, G.; Weixin, X.; Jihong, P. Segmented minimum noise fraction transformation for efficient feature extraction of hyperspectral images. Pattern Recognit. 2015, 48, 3216–3226. [Google Scholar] [CrossRef]
  24. Chang, C.I.; Li, Y.; Wu, C.C. Band detection in hyperspectral imagery by pixel purity index. In Proceedings of the 2015 7th Workshop on Hyperspectral Image and Signal Processing: Evolution in Remote Sensing (WHISPERS), Tokyo, Japan, 2–5 June 2015; pp. 1–4. [Google Scholar]
  25. Zhang, Y.; Gao, J.; Cen, H.; Lu, Y.; Yu, X.; He, Y.; Pieters, J.G. Automated spectral feature extraction from hyperspectral images to differentiate weedy rice and barnyard grass from a rice crop. Comput. Electron. Agric. 2019, 159, 42–49. [Google Scholar] [CrossRef]
  26. Ahmad, M.; Shabbir, S.; Oliva, D.; Mazzara, M.; Distefano, S. Spatial-prior generalized fuzziness extreme learning machine autoencoder-based active learning for hyperspectral image classification. Optik 2020, 206, 163712. [Google Scholar] [CrossRef]
  27. Hou, Y.; Zhou, Y.; Zhou, W. Comparative research of evaluation nitrogen fertilizer efficiency between the nitrogen use efficiency and fertilizer yield method. J. Northeast. Agric. Univ. 2013, 44, 28–36, (in Chinese with English abstract). [Google Scholar]
  28. Pandey, A.; Jain, K. An intelligent system for crop identification and classification from UAV images using conjugated dense convolutional neural network. Comput. Electron. Agric. 2021, 192, 106543. [Google Scholar] [CrossRef]
  29. Wang, Z.; Tian, S. Ground object information extraction from hyperspectral remote sensing images using deep learning algorithm. Microprocess. Microsyst. 2021, 87, 104394. [Google Scholar] [CrossRef]
  30. Lone, Z.A.; Pais, A.R. Object detection in hyperspectral images. Digit. Signal Process. 2022, 131, 103752. [Google Scholar] [CrossRef]
  31. Zhang, L.; Zhang, Z.; Wu, C.; Sun, L. Segmentation algorithm for overlap recognition of seedling lettuce and weeds based on SVM and image blocking. Comput. Electron. Agric. 2022, 201, 107284. [Google Scholar] [CrossRef]
Figure 1. Location map of test site.
Agronomy 12 02893 g001
Figure 2. Extraction of the end-element hyperspectral image of the rice fields: (a) MNF rotation to determine spectral feature dimensions; (b) terrestrial end-element hyperspectral image.
Agronomy 12 02893 g002
Figure 3. Terrestrial end-element hyperspectral images: (a) Original hyperspectral images; (b) Hyperspectral unmixing results.
Agronomy 12 02893 g003
Figure 4. Rice hyperspectral reflectivity segment.
Agronomy 12 02893 g004
Figure 5. Inverse modeling of nitrogen content of rice.
Agronomy 12 02893 g005
Figure 6. Fertilizer prescription chart for agricultural drones.
Agronomy 12 02893 g006
Figure 7. Fertilizer granule collection method.
Agronomy 12 02893 g007
Figure 8. Comparison of the actual spreading amount of granular fertilizer and the spreading amount of the prescription chart.
Agronomy 12 02893 g008
Table 1. The key test time nodes.
TimeRice Growth PeriodTest Contents
12 May 2021 Sampling of arable soil
25 May 2021Transplanting
11 June 2021Tillering stageRemote sensing decision of topdressing UAV
12 June 2021Tillering stagePrecise variable topdressing of plant protection UAV
20 October 2021Mature periodYield measurement
2 November 2019 Sampling of arable soil
Table 2. Actual fertilizer chasing in each area.
Subdivision NumberFirst Fertilization Amount
/kg·ha−2
Second Fertilization Amount
/kg·ha−2
Third Fertilization Amount
/kg·ha−2
Actual Total Fertilizer Application
/kg·ha−2
Standard Fertilizer Application
/kg·ha−2
100106.5106.5200
2401087.9137.9200
36015109.6184.6200
48020101.8201.8200
5802087.4187.4200
6601592.8167.8200
7401078.2128.2200
80094.194.1200
900000
10401082.5132.5200
11601589.1164.1200
Total460115929.91504.92000
Publisher’s Note: MDPI stays neutral with regard to jurisdictional claims in published maps and institutional affiliations.

