Article

Effects of Leaf Surface Roughness and Contact Angle on In Vivo Measurement of Droplet Retention

1
Key Laboratory of Plant Protection Engineering, Ministry of Agriculture and Rural Affairs, Jiangsu University, Zhenjiang 212013, China
2
Key Laboratory of Modern Agricultural Equipment and Technology, Ministry of Education, Jiangsu University, Zhenjiang 212013, China
3
Nanjing Institute of Agricultural Mechanization, Ministry of Agriculture and Rural Affairs, Nanjing 210014, China
*
Authors to whom correspondence should be addressed.
Agronomy 2022, 12(9), 2228; https://doi.org/10.3390/agronomy12092228
Submission received: 19 July 2022 / Revised: 8 September 2022 / Accepted: 15 September 2022 / Published: 19 September 2022

Abstract

:
Droplet retention during pesticide application is a serious problem because run-off droplets flow out of the target area and pose a hazard to human health and the environment. The present study was conducted with the aim to measure the droplet retention of sprayed droplets on crop leaves in vivo using a constructed test system. In the measurement, three crop species with different surface properties (tomato, chili pepper, and winter wheat) were selected for droplet retention determination, and the variations in the time intervals of maximum retention and stable retention were determined. Contact angle and surface roughness ( R a ), which are the most important surface properties of crop leaves, were used as independent variables. The R a values of tomato, pepper, and winter wheat were 24.73 μ m , 5.28 μ m , and 17.59 μ m , respectively, while the contact angles of tomato, pepper, and winter wheat were 97.67°, 70.07° and 131.98°, respectively. The results showed that the curves of droplet retention on sprayed tomato and wheat leaves had similar patterns over time and could be divided into four periods (rapidly increasing period, slowly increasing period, collapsing period, and stable period). The maximum droplet retention on tomato leaf surface was R m a x = 0.169 g cm 2 , and the stable retention was R s t = 0.134 g cm 2 . The maximum droplet retention on the surface of winter wheat leaf was R m a x = 0.244 g cm 2 , and the stable retention was R s t = 0.093 g cm 2 . However, droplet retention on pepper leaves was different from that on tomato and wheat leaves. The curve pattern of droplet retention on pepper leaves over time showed two peaks and two valleys. Moreover, the maximum retention, R m a x , was in the range of 0.149~0.151 g cm 2 , and the stable retention was R s t = 0.077 g cm 2 . It is expected that the obtained results can be used to characterize the properties of crop leaves and that this study can contribute to the improvement of droplet retention for effective chemical application and the reduction in the environmental pollution caused by agricultural pesticides.

1. Introduction

Agricultural spraying is a complex process that can be macroscopically described as an interesting scenario in which droplets interact with leaves as they reach the leaf surface and undergo kinetic behaviors such as droplet retention, deposition, spreading, rebounding, and running-off [1,2,3,4]. As the droplets accumulated on the leaves reach the saturation point of the retention or storage capacity of leaves, the droplets begin to run off, flowing into the soil and posing a threat to human health and the environment [5,6]. Great attention has been paid to droplet retention in agricultural production, because only the fraction of droplets captured by the crop leaves can play a role in crop protection [7], and the retention of droplets on the crop is the goal of agrochemical sprays, which can improve the efficiency of pesticide use.
Research has been carried out on droplet retention because of its importance, and the concept of retention has been proposed in previous work. Furmidge [8] measured the maximum retention of sprayed liquid on the leaf surface of various plants by spraying the surface until beyond-run-off conditions. Yuan et al. [9] proposed a micro-weight method to determine the point of run-off (POR) and also measured the maximum stable retention on crop leaves. However, the definition of retention is qualitative, as there is no unified method for the quantitative measurement of droplet retention. The measuring methods currently used include the elution method [8,10], the immersion method [11], and the weighing method [9,12,13]. The studies on droplet retention using the elution method date back to the 1960s. Furmidge [10] established a retention theory to predict spray retention on solid surfaces, and plant leaves and artificial surfaces were selected for spray retention experiments. During the experiments, plant leaves were extracted from living bodies, and a dye solution was selected as the spray liquid. The sprayed liquid retained on the surface was eluted after the spray process was completed. The dye concentration was analyzed spectrophotometrically, and the droplet retention on the surface could be calculated. Dorr et al. [14]. reported a model for predicting the adhesion and retention of droplets based on the simplified assumption that droplets impinged perpendicularly on the horizontal surface. Dorr et al. [15] measured droplet retention on whole plants and artificial surfaces, and the authors also used a dye solution as the spray liquid for plants. After spraying, the whole plant was eluted with deionized water to determine the recovery rate of the dye on the plant and artificial surface. However, droplet retention on the whole plant was strongly influenced by the canopy density and growth stage of the plant [16]. It is also a challenge to ensure that dyes can be quantitatively washed off. Cunningham and Harden [11] compared the immersion and elution methods for measuring droplet retention on mature citrus leaves. In the immersion method, the leaf is immersed in the solution for a few seconds and then withdrawn from the liquid surface, until no more droplets run off the surface. Therefore, no part of the measurements performed using the immersion method is related to the spraying process. In the elution method, the collected droplets on the surface must be eluted with deionized water, and the droplet retention on the surface can be calculated using optical technology. This method is not suitable for direct use in the field, because it requires an optical instrument and is time consuming. Yuan et al. [9] and Lu et al. [13] measured droplet retention on the leaf surfaces of rice, cotton, cucumber, and other plants using the weighing method. Yuan et al. used a manual sprayer to spray until the droplets on the leaves began to run off and recorded the maximum reading of the electronic balance during the spraying process. Lu et al. [13] extended Yuan’s method to study the retention of electrostatic droplets on cucumber leaves planted in a greenhouse and explored the effects of spray distance and application rate on droplet retention. The results showed that the peak retention was found at a spraying distance of 125 cm and the application range of 1.26~3.36 kL/hm2. Compared with the above methods, the leaves in these studies did not need to be cut off from living plants, and the true states of the leaves were maintained. Therefore, dynamic measurement of leaf retention of live plants during agricultural spraying is required.
The factors affecting droplet retention on crop leaves include the properties of the liquid (surface tension, viscosity), of the droplets (size, velocity), of the leaf surface (roughness, wettability, orientation), etc. [17]. In the current research study, the surface properties of plants that affected droplet retention were mainly wettability and roughness. The most commonly used techniques to quantify the wettability of polymeric biomaterials are contact-angle measurements [18]. The contact angle is also important in spraying, because it is used to describe the wettability of the leaf surface to predict the droplet behaviors on it. The contact angle is affected not only by surface roughness but also by the chemical constituents of the boundary layer of the crop leaf, such as wax or hair [19]. Therefore, Qiu et al. [20] developed a method to determine the contact angle by extracting the outline of the droplet at the three-phase contact point and calculated the contact angle by fitting the polynomial function of the pixel number. For the surface roughness of plant leaves, the surface roughness index, R a , that is, the arithmetic mean of the absolute values of the surface height deviations measured from the mean plane, is usually chosen to quantitatively express roughness [21,22]. Therefore, three species of crop leaves with different surface properties were selected for the experiments in this study.
In this study, we developed a system to measure droplet retention on leaves and selected three crops with different leaf surface properties to quantitatively measure droplet retention on leaves. The results of the study are expected to provide a scientific basis for reducing pesticide loss and improving application efficiency in terms of precision applications.

2. Materials and Methods

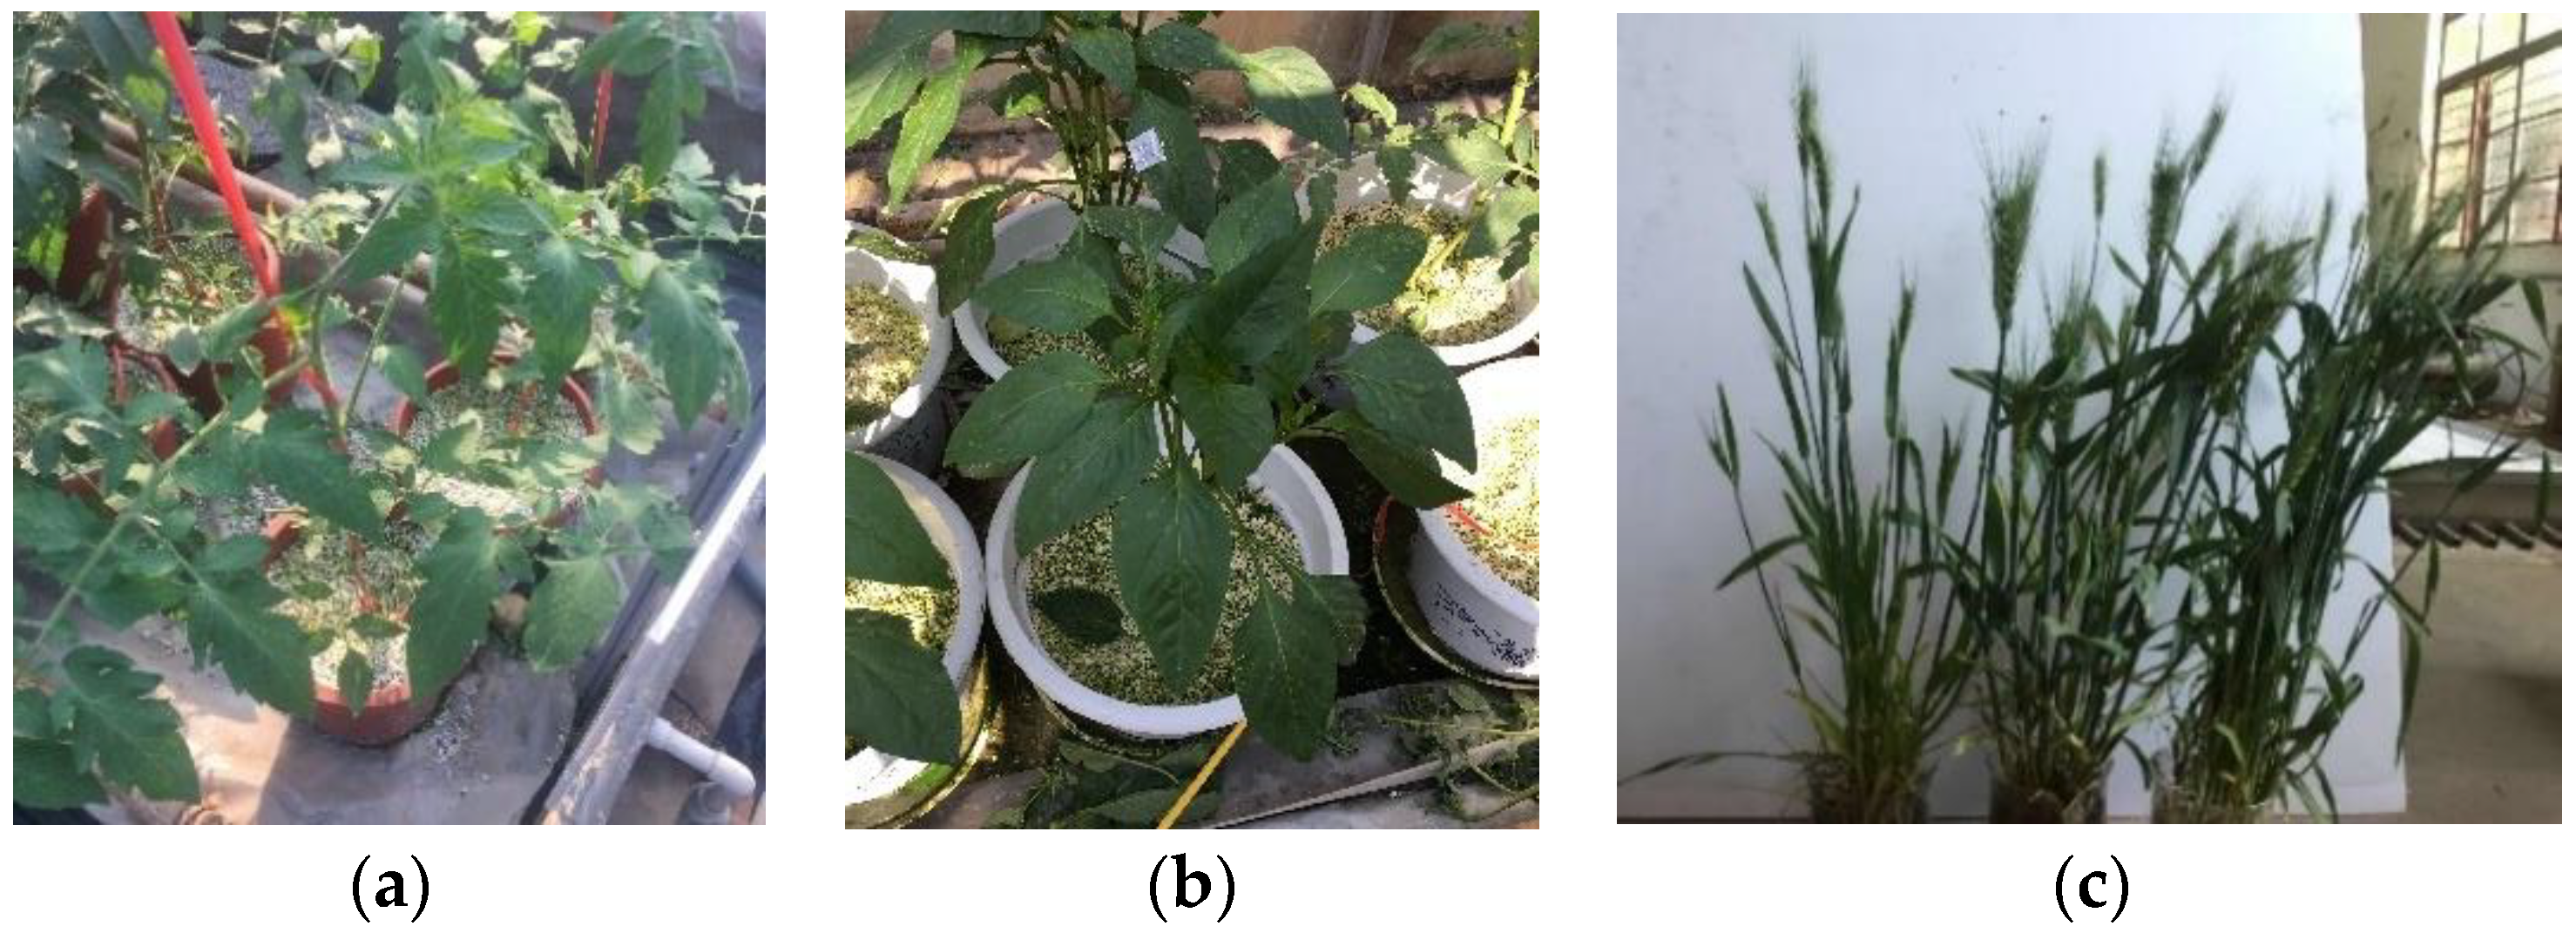
2.1. Crops and Culture Environment

Three crops with different leaf surface microstructures were selected for the experiments: tomato (Solanum L., Muchoo Tommimary DRK0568), chili pepper (Capsicum annuum L., Zamboni), and winter wheat (Triticum aestivum L., Jimai22). Tomato and pepper seedlings were planted in culture pots with organic soil as the growing medium, and one plant was planted in each pot. The pots were 20 cm in diameter at the bottom, 35 cm in diameter at the top, and 25 cm in height. The seedlings were placed in a greenhouse (temperature of 20 °C and relative humidity of 70%) for 45 days. Winter wheat plants were cultivated under natural conditions in a field in Zhenjiang New District (32.13687° N, 119.73203° E) until the nodulation stage (when the first internode of the main stem of winter wheat is 1.5 cm~2 cm above the ground). Figure 1 shows the morphological characteristics of the three crops. Tomato leaves were 10–25 cm long, odd-pinnate leaves, with 5–9 leaflets on the petiole, and each leaflet was 8 cm long with serrated margins (Figure 1a). The leaves of pepper were 10–13 cm long and had serrated margins (Figure 1b), and those of winter wheat were narrowly lanceolate, in rows, and 25 cm long (Figure 1c). Healthy and mature leaves without mechanical damage were selected for the in vivo experiments. For each crop type, three plants showing good growth were selected, and three leaves per plant were chosen for subsequent experimental measurements.

2.2. Spray System

A spray system [23] was built to generate droplet clusters when spraying under crop protection conditions. The spray system consisted of a standard fan nozzle (Lechler ST110-02; Lechler Inc., Ulmer Strasse, Metzingen, Germany), a diaphragm pump (PLD-1205; yinong plant protection equipment co., ltd, Shijiazhuang, China), a controller (SMC AR-3000; SMC China Co., Shanghai, China), and a water tank (volume, 40 L) connected via plastic hoses. After the system was set up, the flow rate and droplet size parameters were measured at a spray pressure of 0.3 MPa. A laser particle sizer (winner319A; Jinan Winner Particle Instruments Stock Co., Ltd., Jinan, China) was used to measure the droplet size distribution and mean volume diameter (VMD) of the 146 μ m spray system. An electronic balance (0.1 g accuracy and 15 kg weighing capacity; AL204; Mettler Toledo, Greifensee, Switzerland) was used to measure the flow rate of the spray system, which was 0.78 L/min per unit time. At the beginning of the test, a standard fan nozzle was mounted on a tripod located 500 mm directly above the plant leaves being tested. The spray system used deionized water as the spray medium.

2.3. Measurement of Foliar Parameters

2.3.1. Measurement of Leaf Area

To measure the droplets retention per unit area of a crop leaf, the area of leaf sample needs to be measured. To avoid destroying the microstructure of the leaf surface and to quickly and accurately determine the leaf area of the leaf samples, we selected the AM-350 leaf area meter (0.065 mm 2 resolution and ±5% length and width, ±5% area, and ±5% circumferential accuracy; Zealquest technology Co., Ltd., Shanghai, China) to determine the leaf area of the measured leaves.

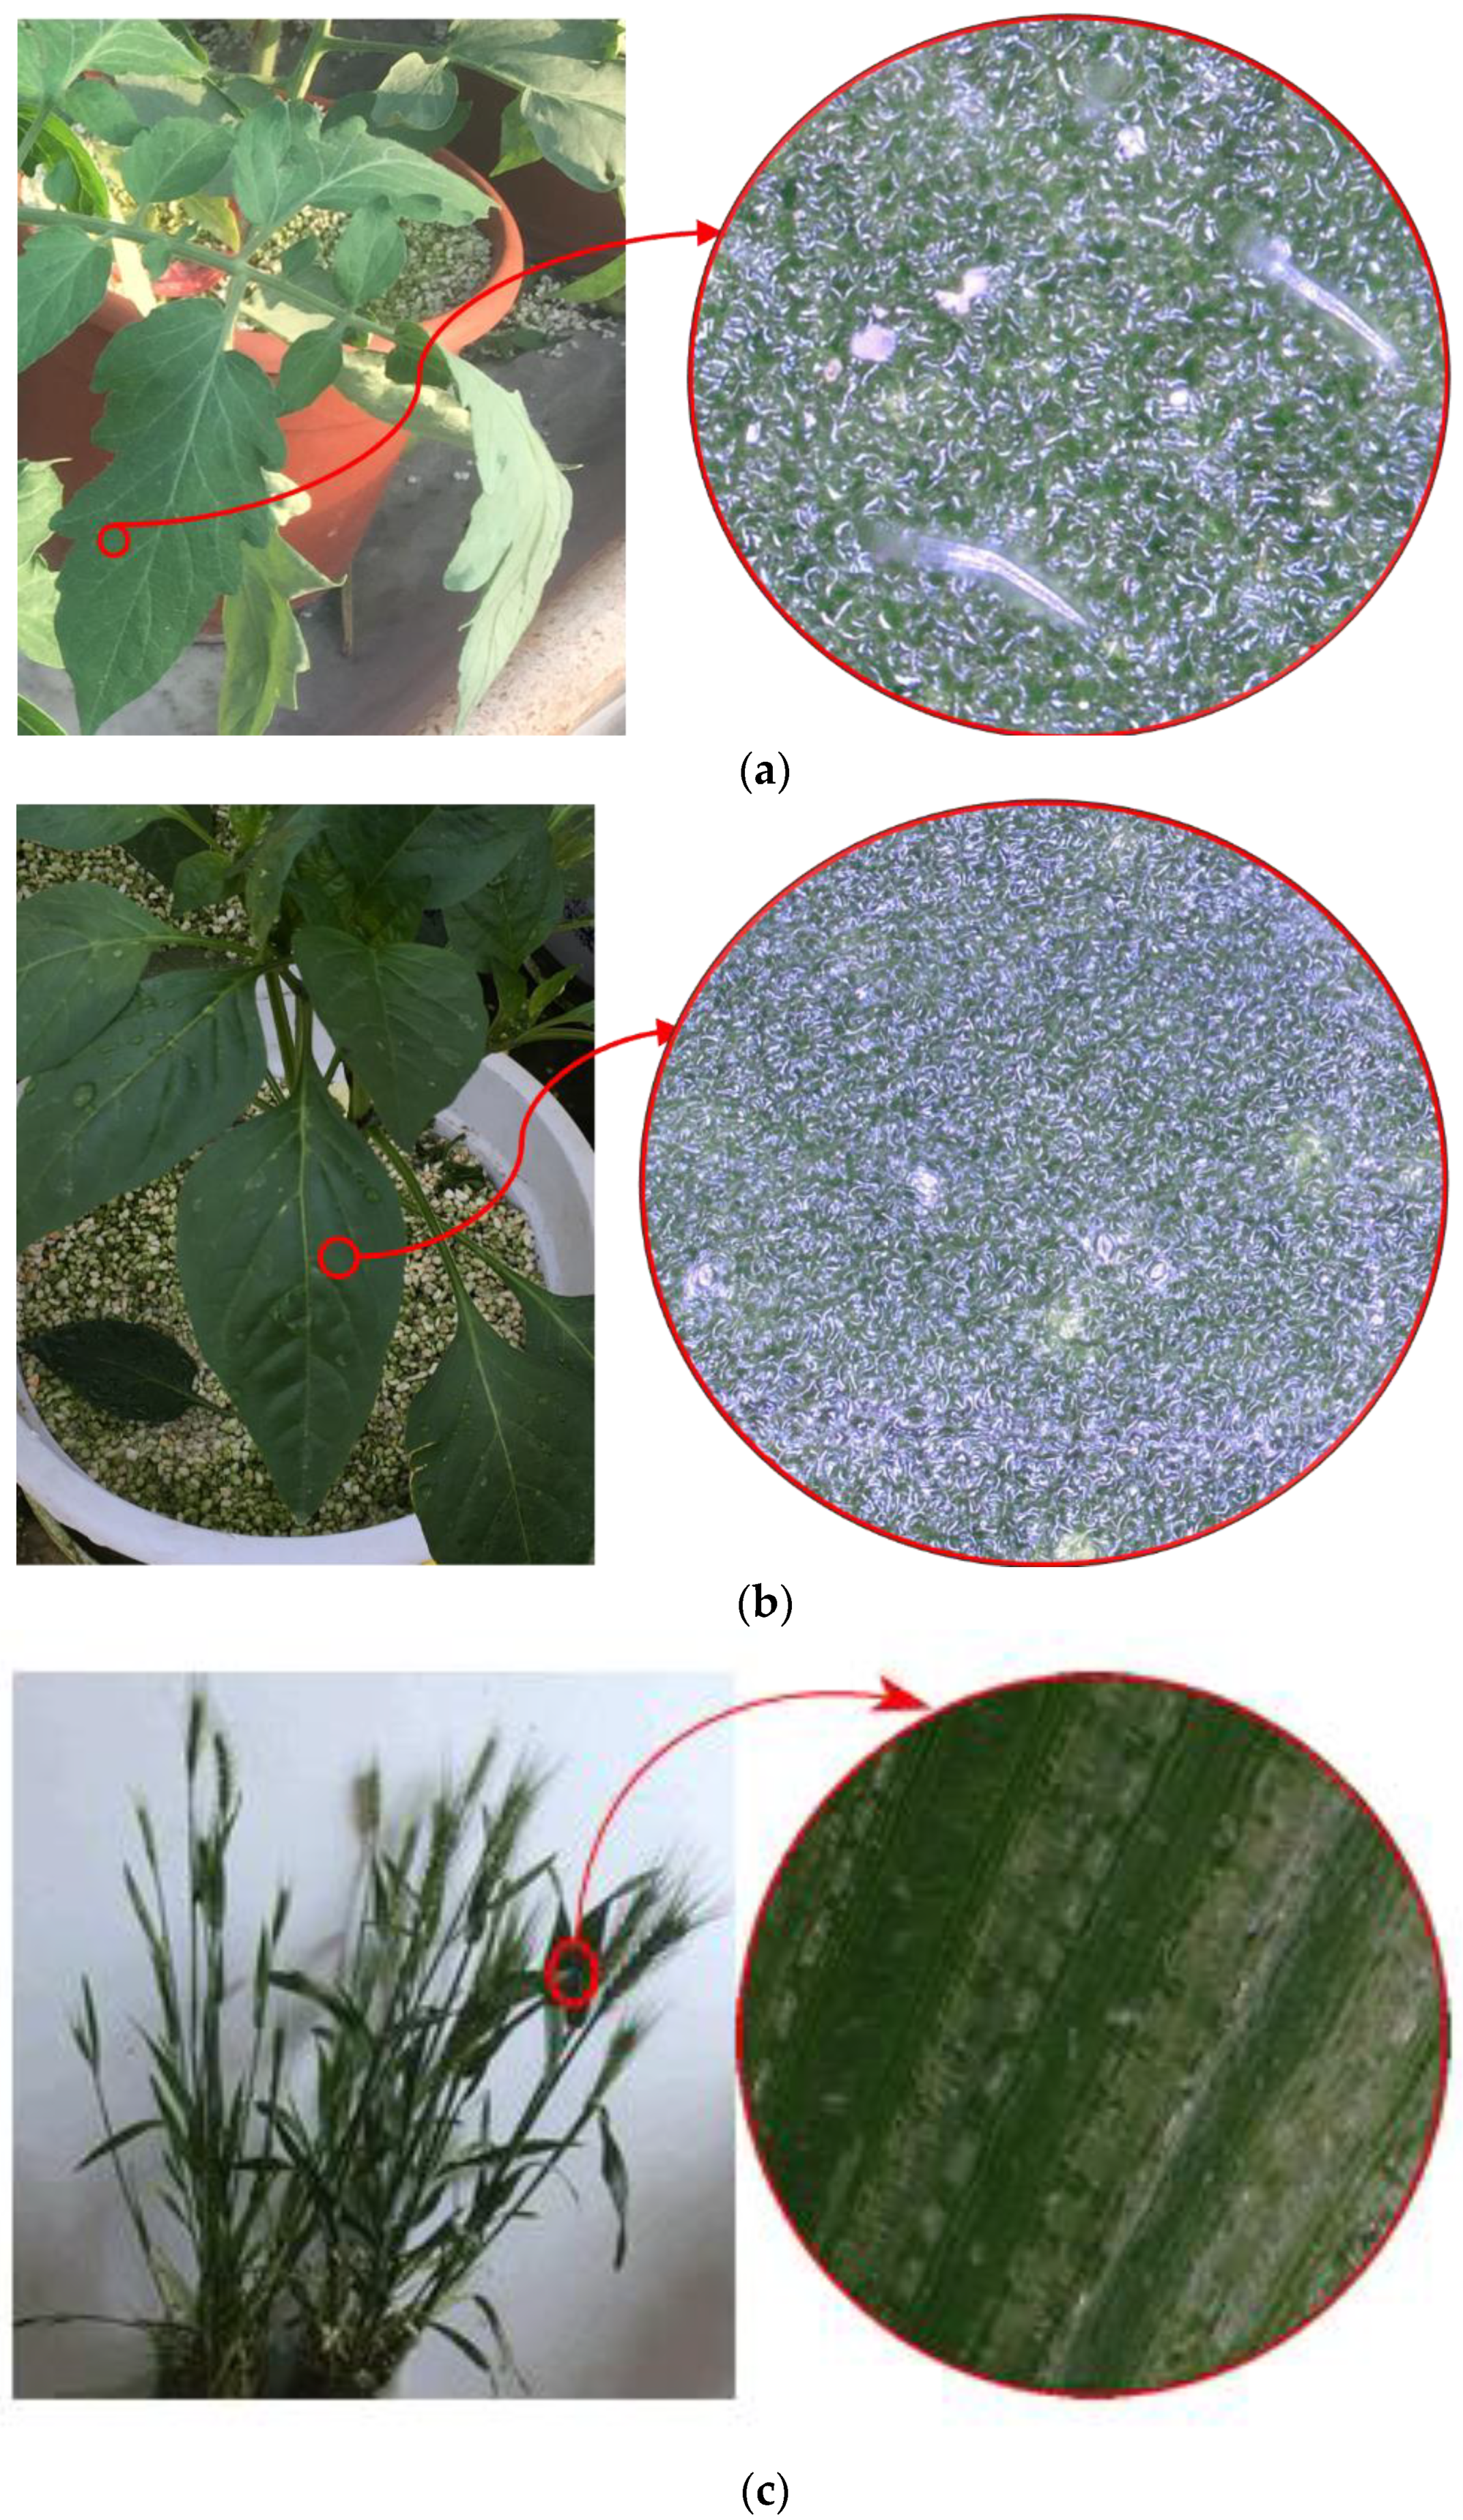
2.3.2. Measurement of Surface Roughness

Surface roughness can have a significant effect on surface wettability [22], and the surface roughness of plant leaves is directly related to the surface microstructure. For example, leaves with glandular hairs are extremely difficult to wet [24,25]. Visual observation showed that the roughness of the leaf surface of tomato was significantly different from those of winter wheat and chili pepper. To quantify the surface roughness of the leaf surfaces of the three crops, we used a 3D digital microscope (Keyence VHX-900F) to calculate the surface roughness, R a , of the tested leaf surfaces. Surface roughness is defined as the arithmetic mean of the absolute values of surface height deviations measured from the midplane [21], as shown in Equation (1).
R a = 1 N i j Z i , j Z ave
where Z i , j is the distance between each point and the mean plane; Z a v e is the height of the mean plane; N is the total number of points in each image.
Before starting the measurements, the 3D digital microscope was calibrated. Calibration was performed using a steel plate (GCR15; Harbin Measuring & Cutting Tool Group Co., Ltd., Harbin, China) with a known surface roughness of R a = 0.8 μ m as the standard sample. When measuring the leaf sample, the sample leaf was placed on the microscope stage, so that the measured leaf could be clearly seen during filming. Each leaf sample was photographed three times.

2.3.3. Measurement of Contact Angles

The contact angle of the leaf surface was used to quantify the wettability of different plant species. It is usually measured using imaging techniques to obtain the profile of a single mist droplet [20]. To obtain the contact angles of the leaf samples, we used a contact-angle meter (KSV CAM-101; KSV Instruments Ltd., Helsinki, Finland) for the measurements. A 2 μ L droplet (deionized water) was applied to the leaf surface using a micro syringe. After the placement was completed, the profile of the droplet was photographed and extracted. The contact angle could then be determined by fitting a polynomial function and calculating the number of pixels.

2.4. Measurement of Droplet Retention

To measure the change in the quality of droplets retained on the leaf surface with time, we developed a device to measure the retained mass on the leaf surface, as shown in Figure 2.
The equipment used to measure the retained mass mainly included a high-precision electronic balance (AL204; Mettler Toledo, Switzerland), a knife carrier with an angle-adjustment mechanism, a tripod, and a waterproof cover. The harvesting knife was attached to the knife carrier with double-sided adhesive tape, and the angle between the knife carrier and the horizontal plane was adjusted using the angle-adjustment mechanism. The knife carrier was connected to the electronic scale via a cylindrical glass rod. The upper end of the glass rod was attached to the leaf carrier, and the lower end was attached to the center of the electronic scale. To avoid measurement errors caused by droplets dripping onto the tray of the electronic balance, a prismatic, table-like, waterproof cover was used to prevent droplets from settling directly onto the tray of the electronic balance during testing. On the one hand, droplets that did not remain on the leaves slid down the outer wall of the protective cover, ensuring that the scale’s reading accurately reflected the droplets’ whereabouts on the crop leaves. On the other hand, the pyramid-shaped protective cover prevented droplets from settling on the scale and protected it from damage. To unambiguously describe the retained mass of the droplet population on the leaves, we defined the maximum retention, R s t , and the stable retention, R m a x . The retained mass of the droplet population per unit area was defined as the maximum retained mass.
R s t = M s t L A
R max = M max L A
where R s t is the stable retention after the point of run-off; R max is the maximum retention at the critical point of run-off; M s t and M m a x denote the stabilized mass weights after the point of run-off and the maximum mass weights at the point of run-off, respectively; L A is the leaf area.

3. Results

3.1. Crop-Leaf Parameters

The leaf microstructure (roughness) and wettability of chili pepper, tomato, and winter wheat were significantly different. Figure 3 shows the surface morphology of the leaves of chili pepper, tomato, and winter wheat.
Glandular hairs (leaf trichomes) were significantly distributed on the surface of tomato leaves, whereas they were not observed on the surface of chili pepper and winter wheat leaves. The spatial distribution density of glandular hairs on tomato leaves was 36 ± 4 hairs mm 2 , and the length was 95 ± 4 μ m . The leaf surfaces of all three crops were covered with a waxy layer. The morphological structure of the waxy layer on the leaf surface of winter wheat was characterized by a long stripe-like distribution with a uniform arrangement. The waxy layers on the leaf surfaces of tomato and bell pepper were characterized by a granular distribution and non-uniformity. Table 1 shows the measured values of leaf area, surface roughness, and surface contact angle of the leaves of tomato, chili pepper, and winter wheat plants. The leaf areas of the three leaf samples of tomato, chili pepper, and winter wheat were 14.20 cm 2 , 24.29 cm 2 , and 20.90 cm 2 , respectively. The surface roughness of chili pepper was 5.28 μ m , the smallest value among the three crops. The surface roughness of tomato leaves was 24.73 μm, 4.68 times higher than that of chili pepper, mainly because the microscopic surface of tomato leaves had a lot of glandular hairs. The surface roughness of winter wheat leaves was 17.59 μ m , 3.33 times higher than that of chili pepper, which was consistent with people’s subjective perception, as they felt greater sliding resistance when touching winter wheat leaves. The contact angles of the three crops were used to characterize the wettability of the crops. The surface contact angle of chili pepper leaves was 70.7°, which was the lowest value. The surface contact angles of tomato and winter wheat leaves were 97.67° and 131.98°, respectively. The larger the contact angle, the more difficult it is to wet the surface [26], making it possible to distinguish hydrophilic and hydrophobic surfaces. Thus, the leaves of chili pepper were hydrophilic, while the surfaces of tomato and winter wheat leaves were hydrophobic.

3.2. Droplet Retention on Crop Leaves

3.2.1. Droplet Retention on Tomato Leaves

Figure 4 shows the variation curve of the retained mass of the droplet population on the surface of tomato leaves per unit area over time. The deposition pattern of the droplet population on tomato leaves consisted of the retained mass rapidly increasing to a peak value and then leveling off until it stabilized. Droplet mass retention was defined as stable droplet retention if the change in droplet mass in retention mass per unit time was less than 0.02 g cm 2 . The maximum retention of the fog droplet population on the surface of tomato leaves was 0.169 g cm 2 , and the stable retention was 0.134 g cm 2 . We divided the retention process into four phases.
(1) Rapidly increasing stage (SA segment in Figure 4): the retained mass of the droplet population on tomato leaves per unit area rapidly increased at a rate of 0.1031 g cm 2 s 1 . The reason for this phenomenon is that leaves have a certain capacity to store droplets [27], and the rate of increase in retained mass is closely related to the flow rate of the spray system until the storage capacity of leaves is reached. During the period of rapid increase, the trend of the increase in droplet retained mass on tomato leaves showed strong linearity, which was mainly due to the stable droplet population provided by the spray system. The droplet mass retained on the leaves steadily increased, and the increase in retention was theoretically proportional to the flow rate of the spray system.
(2) Slowly increasing stage (AB segment in Figure 4): The rate of the increase in the retained mass of droplets on tomato leaves gradually slowed down with the increase in spray duration. The rate of the increase in droplet-population retained mass per unit tomato leaf area decreased to 0.03 g cm 2 . First, this could have been due to the fact that as the droplet population continued to impinge on the surface of the tomato leaf, a large number of droplets accumulated on the leaf surface and gradually reached the limit of the storage capacity of the leaf. Secondly, the leaf surface was gradually wetted by the droplets, and the fusion and coalescence of several droplets occurred. The droplet size of the droplet population on the tomato leaf surface gradually increased, resulting in the loss of large droplets. Thus, the increase in adhesive mass was rather slow.
(3) Collapse period (BC segment in Figure 4): The adhesive mass per leaf area rapidly decreased after the maximum adhesive capacity was reached. The reason for this phenomenon was that the mass of the droplet population held on the surface of the tomato leaves reached the maximum of the water-holding capacity of the leaves, while droplets continued to be deposited on the surface of the tomato leaves. When the water-holding capacity of the tomato leaves reached its maximum, the droplet population accumulated on the leaves to form large droplets. If spraying continues, the mass of these large droplets reaches above the weight that tomato leaves can support, resulting in droplet losses and a rapid reduction in droplet retention mass. For this reason, the curve shown in Figure 4 sharply decreases.
(4) Stable period (CD segment in Figure 4): The variation in the mass of the fog droplet population on the leaf was small in this stage, and the mass variation per unit area was less than 0.02 g. This could have been due to the fact that the leaf surface was covered with a water film, which filled the roughness of the leaf surface and made the mist droplets more susceptible to loss. The mass of the droplet population deposited on the leaf surface was in dynamic equilibrium with the mass of the lost droplet population in terms of retained mass.

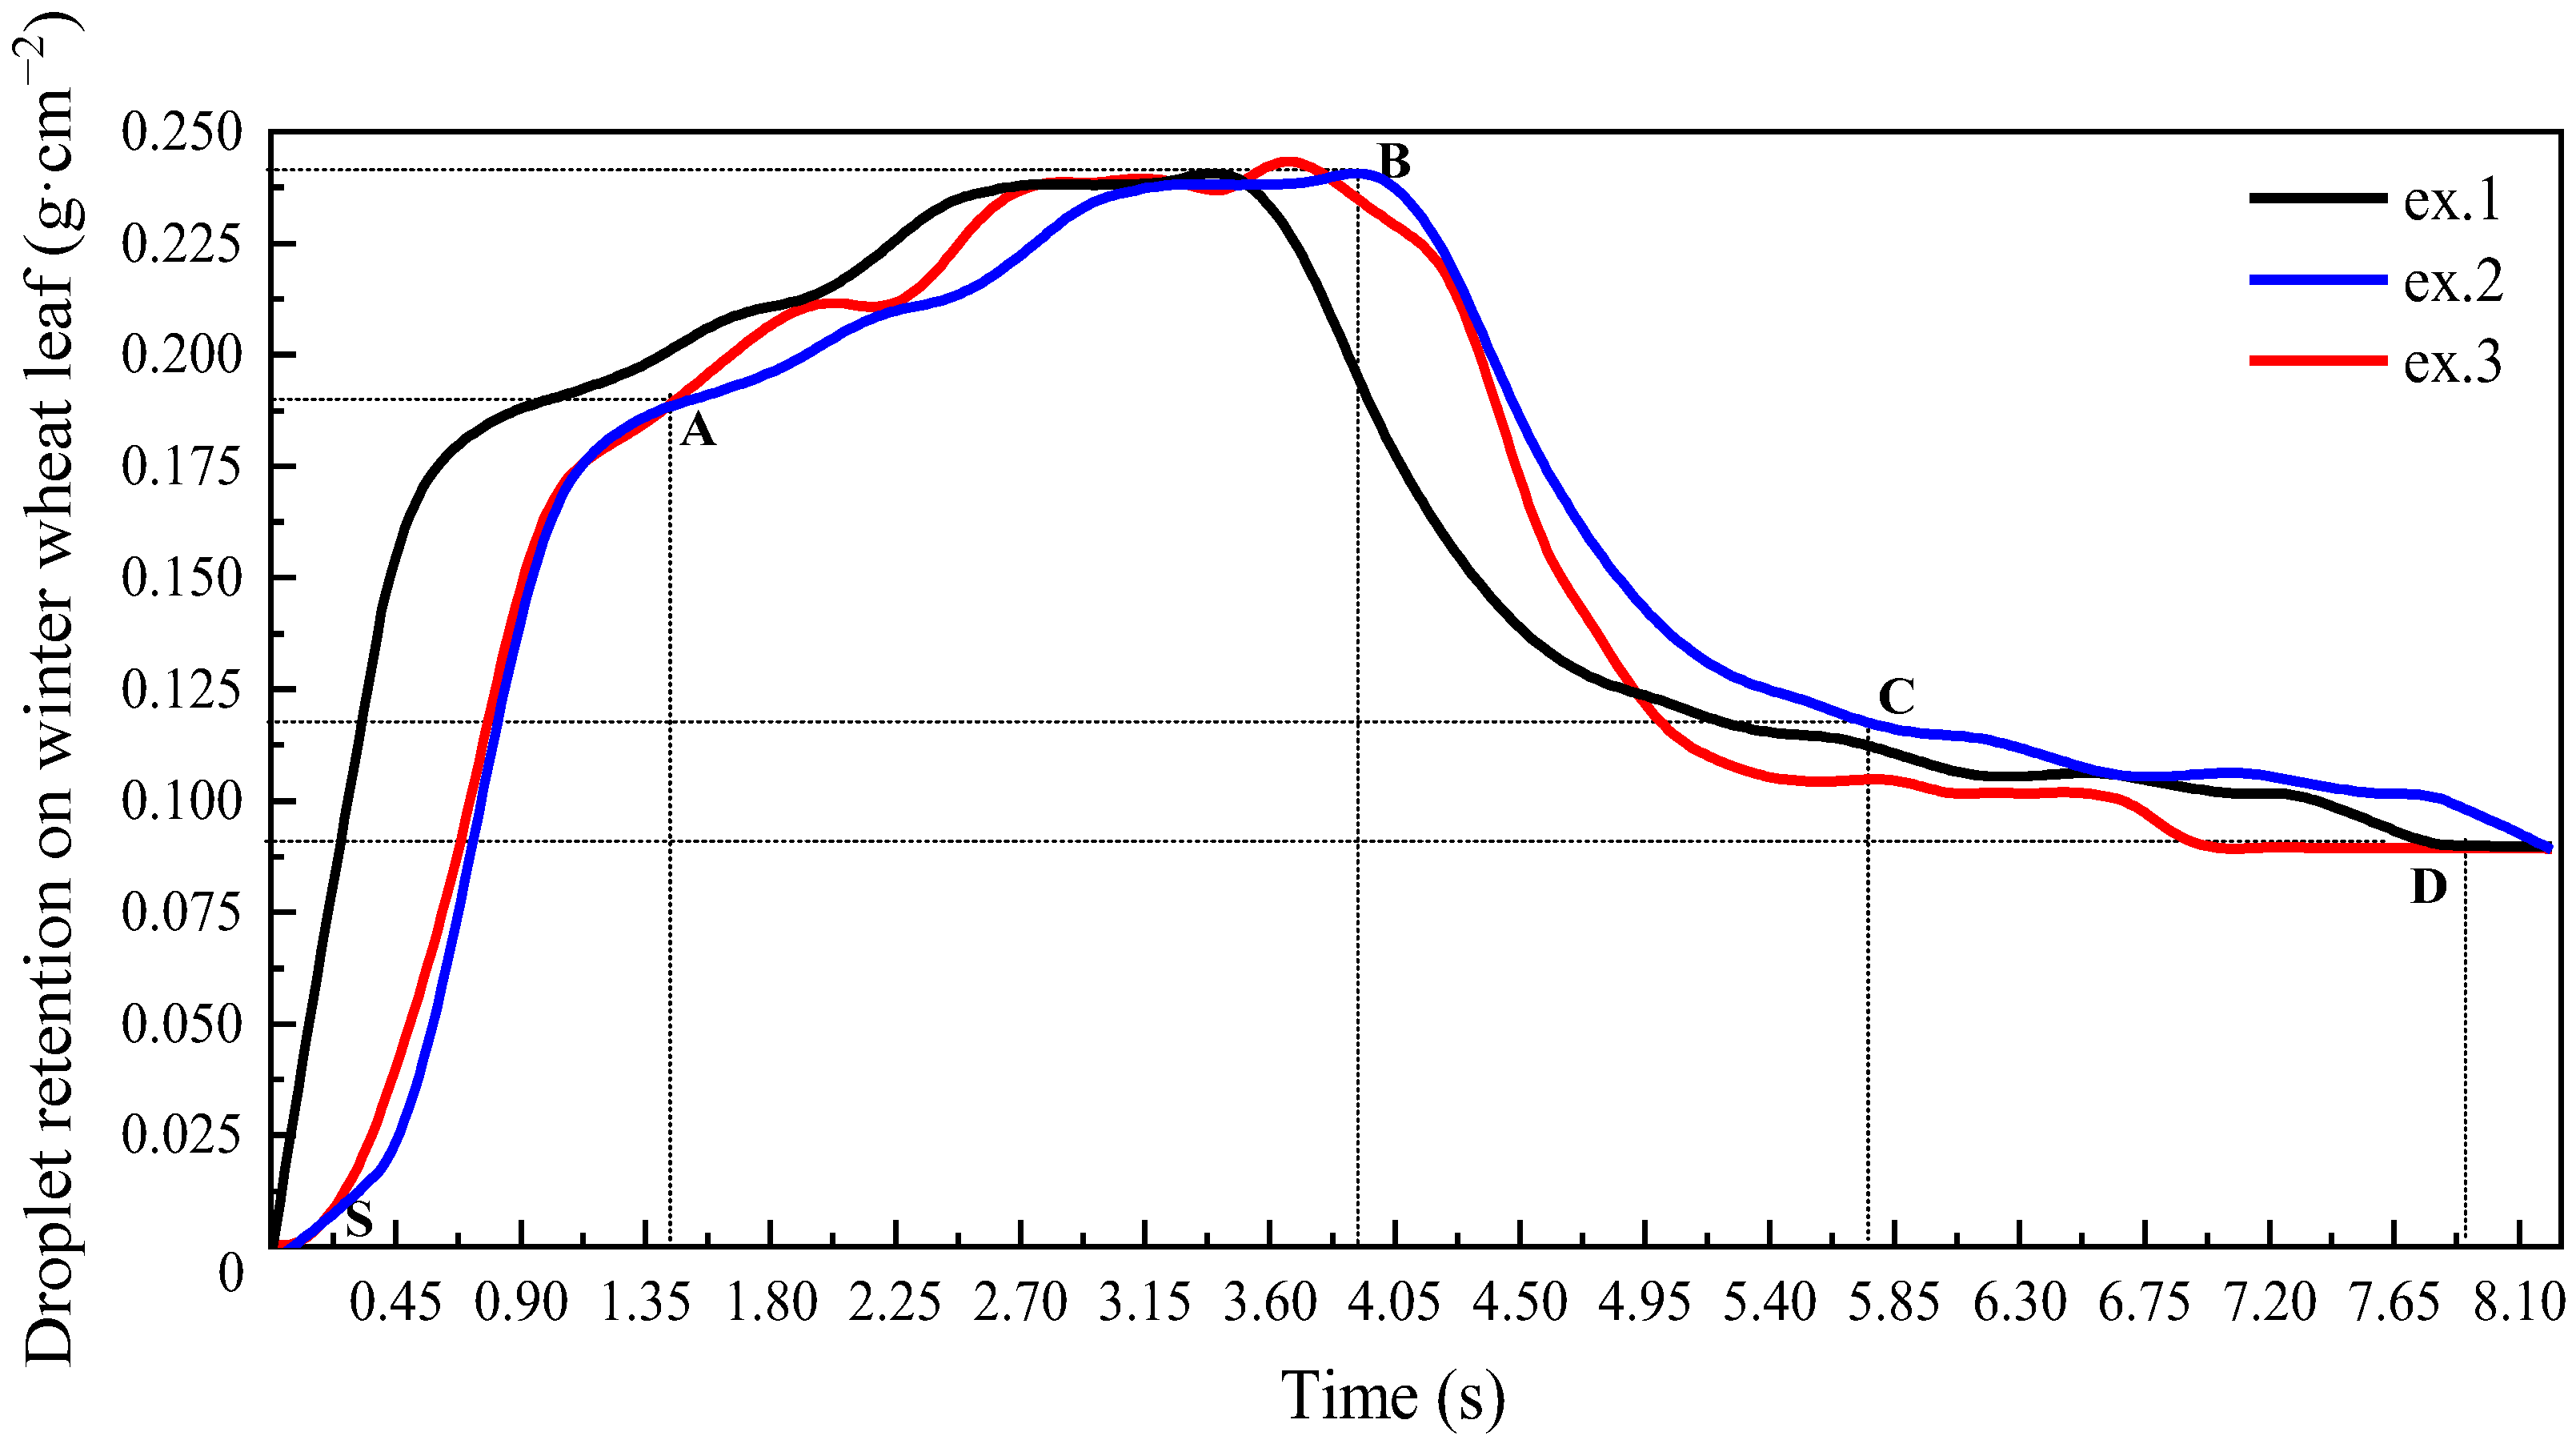
3.2.2. Droplet Retention on Winter Wheat Leaves

Figure 5 shows the three replicate experimental curves of the retention of fog droplets on wheat leaves per unit area over time. From the experimental curve patterns, it could be seen that the trend of the mass deposition of fog droplets on winter wheat leaves was similar to the deposition pattern of tomato leaves and could be divided into four phases: rapid increase (SA), slow increase (AB), rapid collapse (BC) after reaching the peak, and finally stable deposited mass (CD). During the rapid-rise phase, the deposition of the fog droplet population on leaves was 0.19 g cm 2 , which lasted for a total of 1.45 s. Thus, the deposition rate of the fog droplet population on winter wheat leaves was 0.131 g cm 2 s 1 , which was mainly due to the rapid deposition of the fog droplets on the surface of winter wheat leaves and the rapid increase in droplet mass. During the slow-rise phase, the fog droplet population on the leaf surface accumulated into a small number of large droplets and slipped on the leaf surface, resulting in a slow increase in droplet mass. After reaching maximum retention, the droplet mass stabilized on the surface of winter wheat leaves. The maximum retention of droplets on the surface of wheat leaves was 0.244 g cm 2 , and the stable retention was 0.093 g cm 2 . The overall trend was altogether very similar to that of the retention of droplets on tomato leaves.

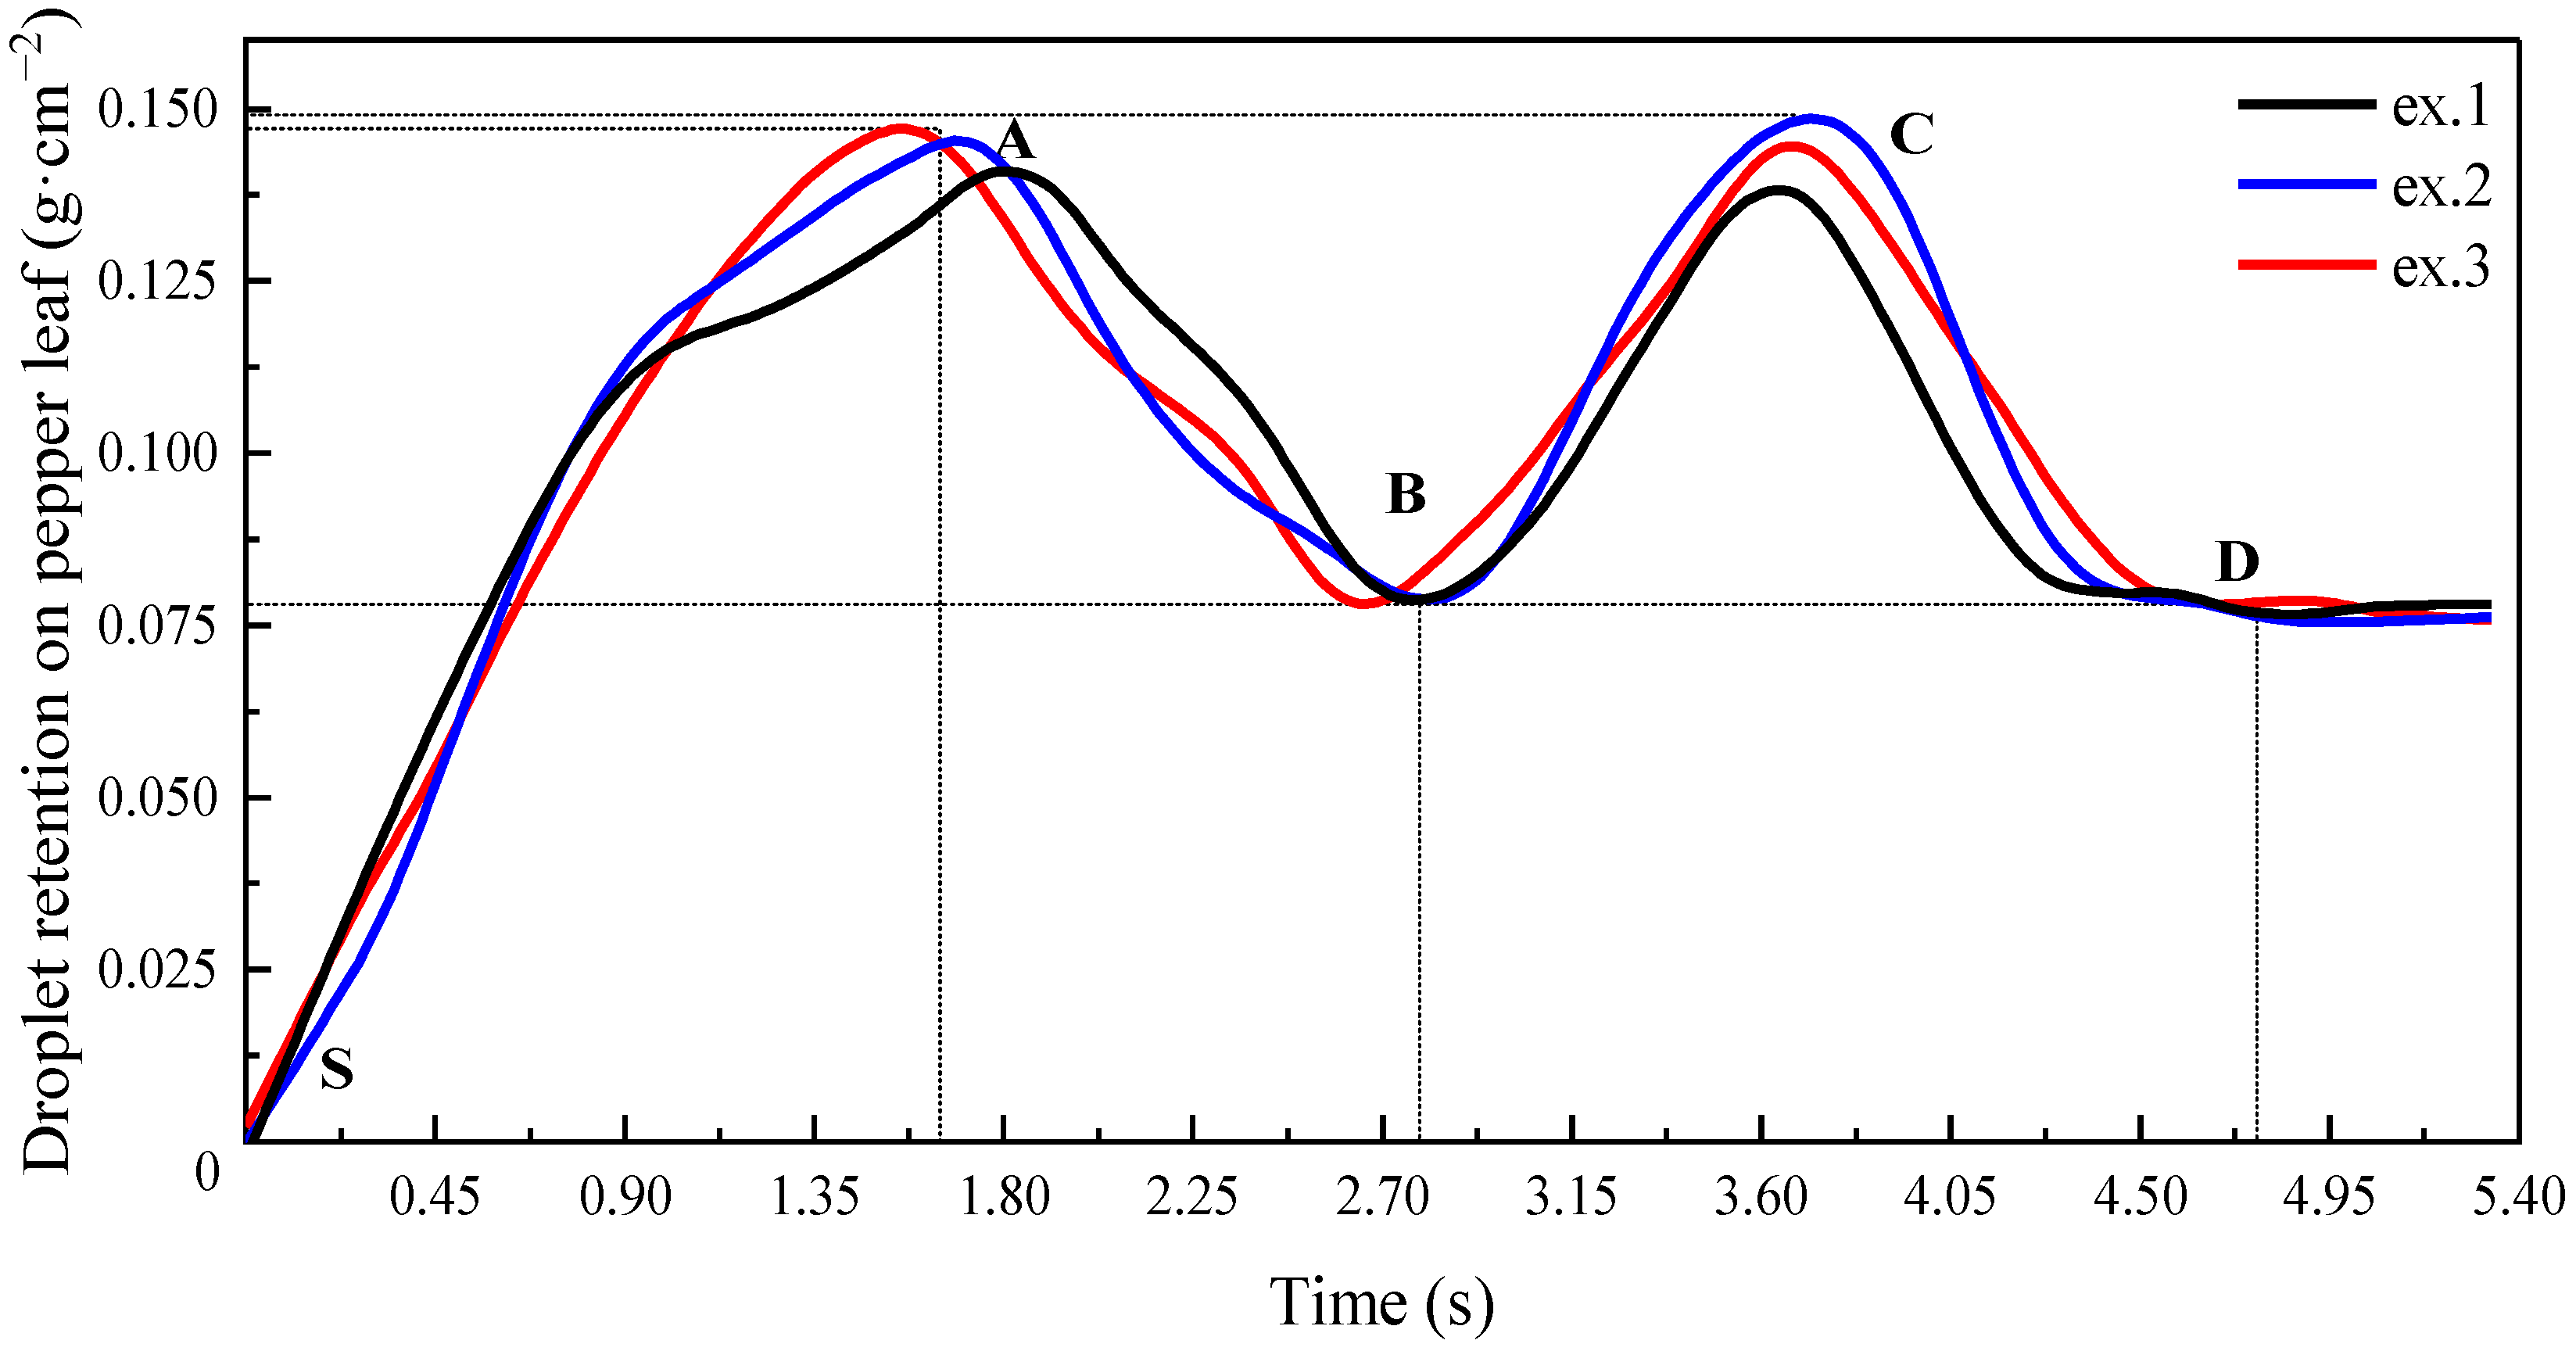
3.2.3. Droplet Retention on Pepper Leaves

Figure 6 shows the curves of the retained mass of droplets per unit area of chili pepper leaves over time. The curve plot over the entire time period shows that the retained mass of droplets per unit area of chili pepper leaves rapidly increased to a peak (SA) and experienced two peaks before stabilizing at 0.077 g cm 2 . In contrast with the variation patterns of the retained mass in tomato and winter wheat, the mass of fog droplets on the leaf surface of chili pepper exhibited two peaks. The first maximum retained mass (A) appeared at 1.70 s, and the maximum retained mass ranged from 0.149 to 0.151 g cm 2 . The second maximum retained mass (C) appeared at 3.82 s, and its value range was the same as that of the first peak. The retention on chili pepper leaves showed periodic fluctuations with a fluctuation period of 2.0 ± 0.2 s. A possible reason for this phenomenon is the lower surface roughness of chili pepper leaves compared with tomato and winter wheat plants.

4. Discussion

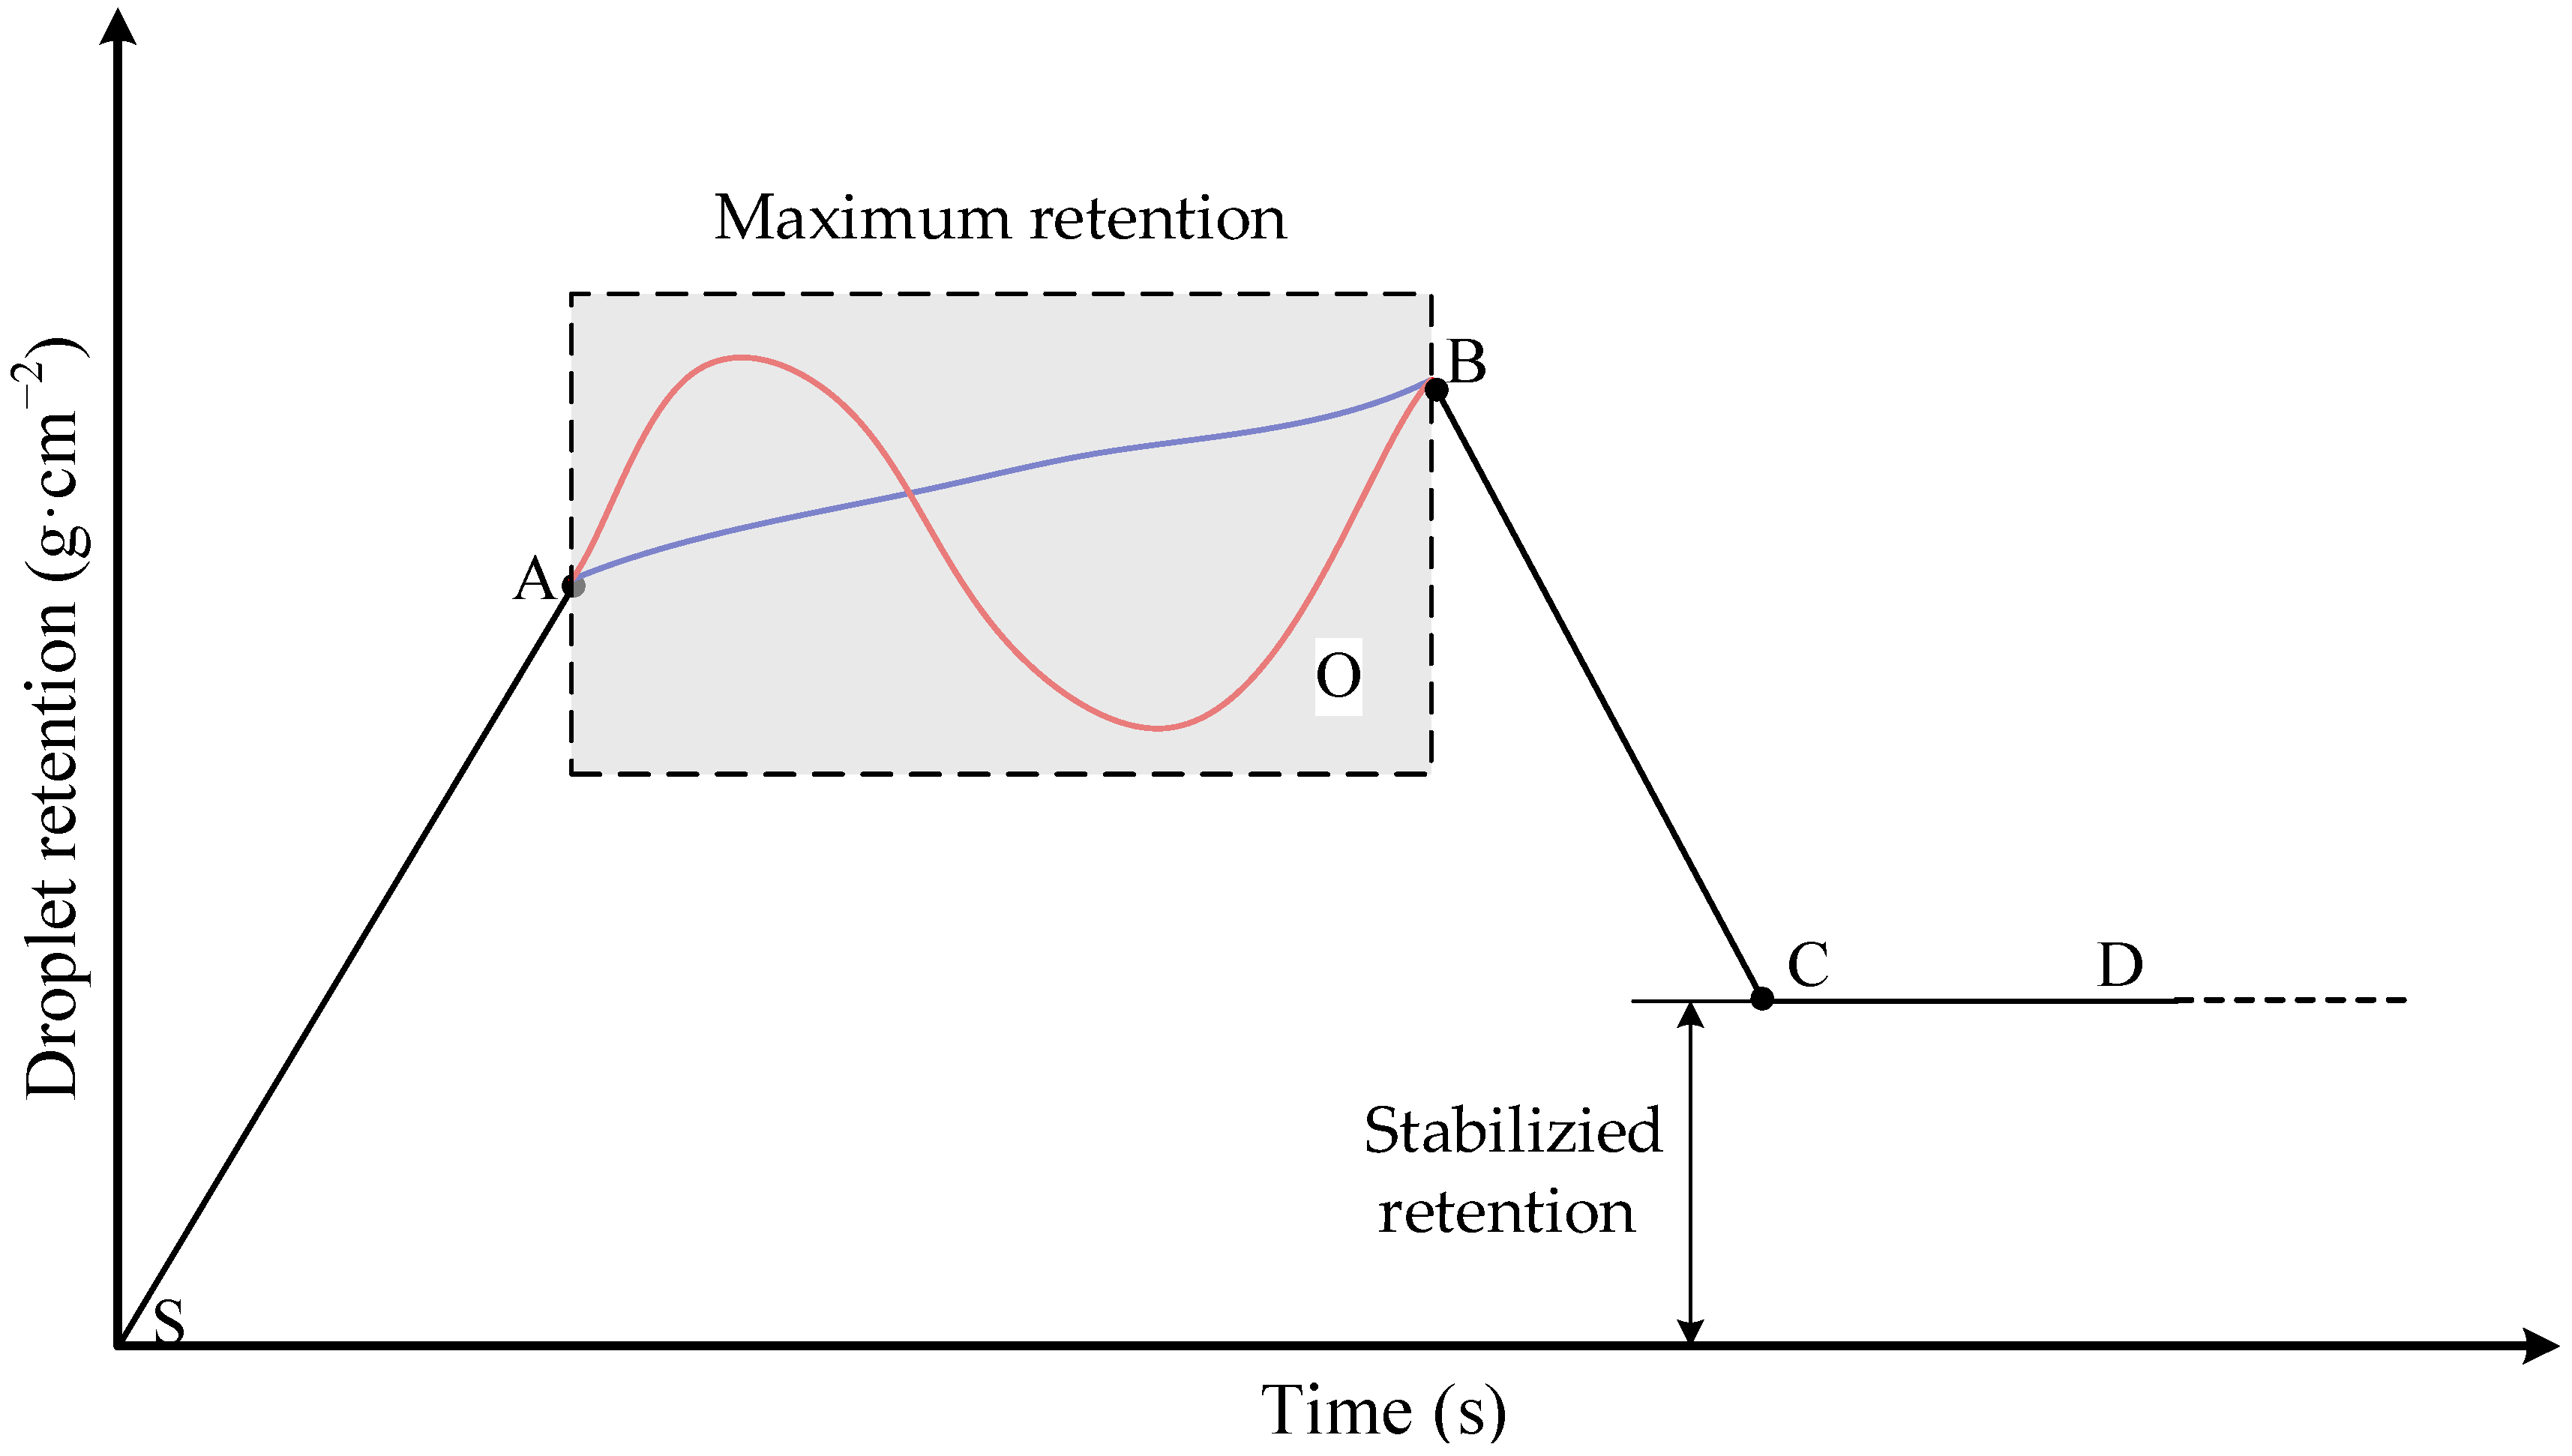
4.1. Model of Droplet Retention on Leaf Surface

Figure 7 shows the variation pattern of the retained mass of the fog droplet population on the foliage of the plants over time.
Depending on the shape of the retention model curve, it can be divided into four stages: a rapid-growth phase, a slow-growth phase, a strong-decline phase, and a stable phase. During the rapid accumulation (SA) phase, the droplet mass on plant foliage increased with the increase in spray time, with a strong linear relationship. The rates of increase during the rapid-growth phase were not the same for chili pepper, tomato, and winter wheat leaves and were 0.088 g cm 2 s 1 , 0.1071 g cm 2 s 1 , and 0.131 g cm 2 s 1 , respectively. This linear relationship was closely related to the surface microstructure and wettability of the leaves. If the water storage capacity of the leaf is equated with a microscopic container, the volume of liquid inside the container, i.e., the storage mass of the leaf, is affected by the droplet distribution law of the spray system, the physical properties of the leaf, the ambient temperature, and other conditions. Since the area of the leaf was very small relatively to the area of the droplet group, we assumed that the spray system produced a uniform distribution of the droplet group so that the input mass of the droplet group was the same. However, due to the different microstructure and wettability of the leaf surface, there was a different degree of liquid splashing, which led to a different acceleration of the droplet retained mass on the different leaves. The linear increase in the droplet-population retained mass over time was mainly due to the large water storage capacity of the leaf and the stable delivery of the droplet population via the spray system. In the slow-increase phase (AB), the droplet retained mass on the leaf surface increased with the spraying time, but the rate of increase was slower, and the variation in the droplet-retained-mass curve on the leaf was large. The leaf and the droplets are considered as a dynamic system, and the system has a critical stability property when the retention of the leaf is about to reach the maximum retention. Thus, when the fog droplets continue to act on the system, the behavior of the leaf becomes more complex. When the leaf surface was gradually wetted by the droplets, liquid film gradually formed on the leaf surface, and some of the aggregated large droplets were lost, making the retention quality curve more complex. However, when the spraying process continued, the amount of deposited droplets was still larger than the amount of lost droplets. In the collapse phase (BC), droplets continued to impact the leaf surface, but the retained mass of droplets on the leaf surface had reached the maximum retained mass, so a large number of large droplets formed by aggregation were lost from the leaf surface. As a result, the retention of droplets sharply decreased. In the stabilization phase (CD), there was little difference in the retained mass of droplets on the leaf surface of different plants. This may have been due to the fact that the leaves were wet and the leaf surface was covered with liquid film, which made the leaf surface less complex; thus, an equilibrium was reached between the droplet mass retained on the leaf surface and the droplet mass lost from the leaf surface.
We recorded the retention of water droplets on the surface of tomato leaves using a high-speed camera. Figure 8 shows the images of droplet retention on tomato leaves taken using the high-speed camera; these images clearly reflect trends similar to those observed using the quantitative measurement method. When the tomato leaves were not moistened, the droplets deposited on the leaf surface were almost uniformly distributed on the leaf surface, as shown in Figure 8a. After the leaves were gradually moistened, the droplets on the leaf surface began to aggregate into larger droplets at different locations on the leaf surface, as shown in Figure 8b. They began to roll along the leaf blade inclined toward the petiole and reached the maximum capacity of the leaf surface, i.e., the point of critical flow velocity of droplets on the leaf surface, as shown in Figure 8c. Subsequently, larger droplets rolled off the leaf surface, as shown in Figure 8d.

4.2. Effects of Leaf Surface Properties on Droplet-Population Retention

Surface texture, microstructure, material properties, spatial location, droplet size, spray system flow rate, and ambient wind speed all affect the quality of droplets deposited on plant leaves. The interactions between the glandular-hair structures and the droplets can be categorized under three types: film effect, penetration effect, and support effect. The “film effect” is the case where there are only a few glandular hairs (<1 mm 2 ) on the leaf surface; the hairs have no effect on droplet retention, and the droplets on the surface can form a liquid film on the leaf surface. The “penetration effect” is the case where the density of glandular hairs on the leaf surface is between 5 and 20 mm 2 , and the wettability is high (contact angle < 70°); the hairs penetrate the droplets and cause them to remain on the plant leaf, an effect consistent with Wenzel’s model [28]. The “support effect” requires a density of glandular hairs on the leaf surface greater than 20 mm 2 and low wettability of the surface (>130°); dense glandular hairs prevent the droplets from reaching the leaf support; this effect is consistent with the Cassie–Baxter model [29]. The surface microstructure of tomato leaves showed a leaf surface with a spike-shaped column with a density of 36 ± 4 hairs mm 2 covered in a waxy layer. The contact angle on the leaf surface was 97.67°. Based on the theories about the interactions between glandular-hair structures and droplets, it is known that the interaction between tomato leaves and droplets cannot be fully represented by these theories, but the experimental results showed that this interaction was closer to the penetration effect. Figure 9 shows that the droplets with a size of 5 mm 3 that fell on the surface of tomato leaves were surrounded by glandular-hair structures and held onto the surface of the leaves. However, the glandular-hair structures of chili pepper and winter wheat leaves were almost negligible compared with the height of the glandular hairs on tomato leaves. This could explain the higher quality of the stable retention of the fog droplet population on tomato leaves compared with chili pepper and winter wheat leaves. Regarding the stable retained mass of droplets on chili pepper and winter wheat leaves, chili pepper leaves had the lowest stable droplet retained mass (0.077 g cm 2 ), which could have been due to the fact that chili pepper leaves had a smoother leaf surface. Aboud and Kietzig [30] analyzed the effect of water droplets on surfaces with different wettability and roughness. They reported that the promotion of splash was affected by a greater hydrophobicity of surfaces with similar roughness. The retention of water droplets on leaf surfaces was determined not only via the microstructure but also via the macroscopic roughness, with chili pepper leaves with smooth surfaces retaining much less droplet mass than the leaves of the other two crops.
Our experiments were conducted in a controlled environment in the laboratory so that the droplets could not be blown off by ambient wind. However, since the field environment is not a completely enclosed space, winds of less than 0.5 m s 1 can easily be generated in the environment and can hardly be perceived by humans. Similarly, the properties of the leaf material play a crucial role for plant leaves in supporting the population of raindrops or fog droplets. To reduce the influence of the large differences in the mechanical properties of leaves in different locations on the measurement results, we used mature leaves and fixed them on the slides to reduce the influence of the mechanical properties of the leaves on the measurement results.

4.3. Effect of the Lateral Retention Force on Droplet Retention

According to a single droplet on an inclined plane, a force analysis was carried out as shown in Figure 10. Droplet motion is affected not only by gravity but also by the retention force. The retention force can be divided into two components: normal force and lateral force. The lateral retention force, f , is the dominating force that affects droplet sliding on a surface.
As shown in Figure 10, the lateral retention force, f , was calculated as shown below.
f = ρ V g sin θ
where   ρ is the density of the droplet; V is the volume of the droplet; g is the gravitational acceleration.
Tadmor et al. [31] pointed out that the lateral force, f , is an increasing function of the resting time interval, t , during which the droplet rests on the surface prior to the commencement of sliding. The authors demonstrated that in the initial period, f is a monotonically increasing function of the resting time interval, t , and after some time, f reaches a plateau. In this work, we observed the same general curve variation in the first phase (Figure 4, Figure 5 and Figure 6). The droplets were all at rest as soon as the droplets deposited on the leaf surface. The phenomenon explains the reason why the droplet retention rapidly increased in the first period. If the spraying process continues, the droplets retention on the leaf surface reaches its maximum and is determined by the maximum frictional force ( f = ρ V g sin θ ).
Furmidge [32] pointed out that during the process of droplet adhesion, droplet retention on the leaf surface continues to increase until the surface is saturated with droplets. At this point, “run-off” commences, and upon continued spraying, the retained volume tends to decrease. This is in accordance with our test results.
Each droplet is considered to be subjected to lateral and normal retention forces, and it is the lateral retention force that ensures that the droplets adhere to the leaf surface and do not slide down. A droplet that rests on the surface when the lateral retention force is active is called a rested droplet. As the number of droplets deposited on the surface increases, droplet coalescence occurs, and the droplet size increases. According to research by Yadav et al. [33], f V 1 / 3 is usually a decaying function of V ; for an ideal droplet, V = 4 3 π r 3 . As the droplet size increases to a critical value, the lateral retention force, f , decreases to such an extent that the droplet can no longer rest on the leaf surface but slides down the surface. If the spraying process is continued, the droplets become larger and larger and may even form a mist stream, i.e., the droplet volume runs off the surface. For this reason, a collapsing period appeared in the retention–time curve in our study as shown in Figure 4, Figure 5 and Figure 6. After that, the retention curve remains horizontal, mainly because the droplets mass on the leaf has reached a dynamic equilibrium. This dynamic equilibrium is due to the fact that the droplet mass flowing onto the leaf is equal to the droplet mass flowing out of the leaf.

5. Conclusions

In this study, we present a droplet retention measurement device that measures droplet retention quality on the leaf surface of living plants in real time during spraying. Droplet retention on the leaves of three crops was measured considering leaf surface roughness and contact angle properties. The main conclusions are as follows:
(1) A device for the real-time measurement of droplet retention on the surface of live plant leaves was designed and built. The device was used to monitor and measure the maximum retention and discharge point of sprayed liquid in real time.
(2) The change trends of the retained mass of the mist droplet population on the leaves of crops with different surface roughness and wettability over time were investigated. The retention–time curves of fog droplet populations on leaves could be divided into four periods: rapidly increasing period, slowly increasing period, collapsing period, and stable period. Large surface roughness, especially in leaves with long glandular hairs, could improve the stable retention of droplets on plant leaves.
(3) During the interaction between droplets and plant leaves, the droplet retention curves show a variety of deposition patterns over time, and the deposition on the surface of plant leaves tends to a steady state.
This work could serve as a reference for the real-time measurement and improvement of mist-droplet-population retained mass on various crops. In our experiments, the leaves were fixed at 30° and artificially attached to a rigid body. However, it is a fact that the leaves of plants have very low bending stiffness and high flexibility at the leaf tips, and that leaves move and deform during the spraying process. These factors will be discussed in a paper on the motion behavior of leaves under droplet impact.

Author Contributions

Conceptualization, J.M., C.C. and B.Q.; methodology, J.M. and B.Q.; software, X.D., S.Z. and K.L.; validation, X.D., S.Z. and B.Q.; formal analysis, J.M. and C.C.; investigation, C.C., K.L. and S.Z.; resources, B.Q.; data curation, J.M., C.C. and K.L.; writing—original draft preparation, J.M.; writing—review and editing, B.Q.; visualization, X.D. and B.Q.; supervision, X.D., B.Q.; project administration, B.Q.; funding acquisition, B.Q. and J.M. All authors have read and agreed to the published version of the manuscript.

Funding

This research study was funded by National Natural Science Foundation of China (grant No. 31971790), Primary Research & Development Plan of Jiangsu Province (grant No. BE2020328), a project funded by Priority Academic Program Development of Jiangsu Higher Education Institutions (No. PAPD-2018-87), Graduate Research and Innovation Program of Jiangsu Province (grant No. KYLX16_0908), and China Agriculture Research System of MOF and MARA (grant No. CARS-12).

Institutional Review Board Statement

Not applicable.

Informed Consent Statement

Not applicable.

Data Availability Statement

Not applicable.

Acknowledgments

Thanks to Key Laboratory of Plant Protection Engineering, Ministry of Agriculture and Rural Affairs, for providing measurement equipment and helping the authors to complete the experiment. Thanks to the editors and experts for suggesting changes to this article.

Conflicts of Interest

The authors declare no conflict of interest.

References

  1. Dorr, G.J.; Wang, S.; Mayo, L.C.; McCue, S.W.; Forster, W.A.; Hanan, J.; He, X. Impaction of Spray Droplets on Leaves: Influence of Formulation and Leaf Character on Shatter, Bounce and Adhesion. Exp. Fluids 2015, 56, 143. [Google Scholar] [CrossRef]
  2. Park, H.; Kim, S.; Gruszewski, H.A.; Schmale, I.I.I.D.G.; Boreyko, J.B.; Jung, S. Dynamics of splashed droplets impacting wheat leaves treated with a fungicide. J. R. Soc. Interface 2020, 17, 20200337. [Google Scholar] [CrossRef] [PubMed]
  3. Andrade, R.D.; Skurtys, O.; Osorio, F. The Impact of Liquid Drops on Purple Cabbage Leaves (Brassica oleracea L. Var. Capitata). Ing. Investig. 2012, 32, 79–82. [Google Scholar]
  4. Dong, X.; Zhu, H.; Yang, X. Characterization of Droplet Impact and Deposit Formation on Leaf Surfaces. Pest Manag. Sci. 2015, 71, 302–308. [Google Scholar] [CrossRef]
  5. Zhang, H.; Dorr, G.J.; Hewitt, A.J. Retention and Efficacy of Ultra-Low Volume Pesticide Applications on Culex Quinquefasciatus (Diptera: Culicidae). Environ. Sci. Pollut. Res. 2015, 22, 16492–16501. [Google Scholar] [CrossRef] [PubMed]
  6. Papierowska, E.; Mazur, R.; Stańczyk, T.; Beczek, M.; Szewińska, J.; Sochan, A.; Ryżak, M.; Szatyłowicz, J.; Bieganowski, A. Influence of Leaf Surface Wettability on the Drop Splash Phenomenon. Agric. Forest Meteorol. 2019, 279, 107762. [Google Scholar] [CrossRef]
  7. Shao, F.; Wang, L.; Sun, F.; Li, G.; Yu, L.; Wang, Y.; Zeng, X.; Yan, H.; Dong, L.; Bao, Z. Study on different particulate matter retention capacities of the leaf surfaces of eight common garden plants in Hangzhou, China. Sci. Total Environ. 2019, 652, 939–951. [Google Scholar] [CrossRef]
  8. Furmidge, C.G.L. Physico-Chemical Studies on Agricultural Sprays. IV—The Retention of Spray Liquids on Leaf Surfaces. J. Sci. Food Agric. 1962, 13, 127–140. [Google Scholar] [CrossRef]
  9. Yuan, H.; Qi, S.; Yang, D. Study on the Point of Run-off and the Maximum Retention of Spray Liquid on Crop Leaves. Chin. J. Pestic. Sci. 2000, 2, 66–71. [Google Scholar]
  10. Furmidge, C.G.L. Studies at Phase Interfaces. I. The Sliding of Liquid Drops on Solid Surfaces and a Theory for Spray Retention. J. Colloid Sci. 1962, 17, 309–324. [Google Scholar] [CrossRef]
  11. Cunningham, G.P.; Harden, J. Reducing Spray Volumes Applied to Mature Citrus Trees. Crop Prot. 1998, 17, 289–292. [Google Scholar] [CrossRef]
  12. Hall, F.R.; Downer, R.A.; Cooper, J.A.; Ebert, T.A.; Ferree, D.C. Changes in Spray Retention by Apple Leaves during a Growing Season. HortScience 1997, 32, 858–860. [Google Scholar] [CrossRef]
  13. Lu, J.; Jia, W.; Qiu, B.; Li, P. Experiment on Retention of Spray Liquid on Cucumber Leaves. Trans. Chin. Soc. Agric. Mach. 2010, 41, 60–64. [Google Scholar]
  14. Dorr, G.J.; Kempthorne, D.M.; Mayo, L.C.; Forster, W.A.; Zabkiewicz, J.A.; McCue, S.W.; Belward, J.A.; Turner, I.W.; Hanan, J. Towards a Model of Spray–Canopy Interactions: Interception, Shatter, Bounce and Retention of Droplets on Horizontal Leaves. Ecol. Modelling 2014, 290, 94–101. [Google Scholar] [CrossRef]
  15. Dorr, G.J.; Forster, W.A.; Mayo, L.C.; McCue, S.W.; Kempthorne, D.M.; Hanan, J.; Turner, I.W.; Belward, J.A.; Young, J.; Zabkiewicz, J.A. Spray Retention on Whole Plants: Modelling, Simulations and Experiments. Crop Prot. 2016, 88, 118–130. [Google Scholar] [CrossRef]
  16. Butler Ellis, M.C.; Webb, D.A.; Western, N.M. The Effect of Different Spray Liquids on the Foliar Retention of Agricultural Sprays by Wheat Plants in a Canopy. Pest Manag. Sci. 2004, 60, 786–794. [Google Scholar] [CrossRef]
  17. Zwertvaegher, I.K.; Verhaeghe, M.; Brusselman, E.; Verboven, P.; Lebeau, F.; Massinon, M.; Nicolaï, B.M.; Nuyttens, D. The Impact and Retention of Spray Droplets on a Horizontal Hydrophobic Surface. Biosyst. Eng. 2014, 126, 82–91. [Google Scholar] [CrossRef]
  18. Agrawal, G.; Negi, Y.S.; Pradhan, S.; Dash, M.; Samal, S.K. 3—Wettability and contact angle of polymeric biomaterials. In Characterization of Polymeric Biomaterials; Woodhead Publishing: Cambridge, UK, 2017; pp. 57–81. [Google Scholar] [CrossRef]
  19. Koch, K.; Bhushan, B.; Barthlott, W. Diversity of Structure, Morphology and Wetting of Plant Surfaces. Soft Matter 2008, 4, 1943–1963. [Google Scholar] [CrossRef]
  20. Qiu, B.; Zhao, X.; Jia, W.; Zhang, Z. Stable Interval Method Based on Images to Measure Drop Contact Angles on Plant Leaf Surfaces. Trans. Chin. Soc. Agric. Mach. 2009, 40, 139–144. [Google Scholar]
  21. Wang, H.; Feng, H.; Liang, W.; Luo, Y.; Malyarchuk, V. Effect of Surface Roughness on Retention and Removal of Escherichia Coli O157:H7 on Surfaces of Selected Fruits. J. Food Sci. 2009, 74, E8–E15. [Google Scholar] [CrossRef]
  22. Bediaf, H.; Sabre, R.; Journaux, L.; Cointault, F. Comparison of Leaf Surface Roughness Analysis Methods by Sensitivity to Noise Analysis. Biosyst. Eng. 2015, 136, 77–86. [Google Scholar] [CrossRef]
  23. Ma, J.; Liu, K.; Chen, C.; Ahmad, F.; Qiu, B. Influence of Plant Leaf Moisture Content on Retention of Electrostatic-Induced Droplets. Sustainability 2021, 13, 11685. [Google Scholar] [CrossRef]
  24. De Ruiter, H.; Uffing, A.J.M.; Meinen, E.; Prins, A. Influence of Surfactants and Plant Species on Leaf Retention of Spray Solutions. Weed Sci. 1990, 38, 567–572. [Google Scholar] [CrossRef]
  25. Hunsche, M.; Bringe, K.; Schmitz-Eiberger, M.; Noga, G. Leaf Surface Characteristics of Apple Seedlings, Bean Seedlings and Kohlrabi Plants and Their Impact on the Retention and Rainfastness of Mancozeb. Pest. Manag. Sci. 2006, 62, 839–847. [Google Scholar] [CrossRef] [PubMed]
  26. Göhl, J.; Mark, A.; Sasic, S.; Edelvik, F. An Immersed Boundary Based Dynamic Contact Angle Framework for Handling Complex Surfaces of Mixed Wettabilities. Int. J. Multiph. Flow 2018, 109, 164–177. [Google Scholar] [CrossRef]
  27. Holder, C.D.; Lauderbaugh, L.K.; Ginebra-Solanellas, R.M.; Webb, R. Changes in Leaf Inclination Angle as an Indicator of Progression toward Leaf Surface Storage during the Rainfall Interception Process. J. Hydrol. 2020, 588, 125070. [Google Scholar] [CrossRef]
  28. Guo, M.; Böttcher, F.; Hertkorn, J.; Schmidt, J.-N.; Wenzel, M.; Büchler, H.P.; Langen, T.; Pfau, T. The Low-Energy Goldstone Mode in a Trapped Dipolar Supersolid. Nature 2019, 574, 386–389. [Google Scholar] [CrossRef]
  29. Bormashenko, E.; Bormashenko, Y.; Stein, T.; Whyman, G.; Bormashenko, E. Why Do Pigeon Feathers Repel Water? Hydrophobicity of Pennae, Cassie-Baxter Wetting Hypothesis and Cassie-Wenzel Capillarity-Induced Wetting Transition. J. Colloid Interface Sci. 2007, 311, 212–216. [Google Scholar] [CrossRef]
  30. Aboud, D.G.K.; Kietzig, A.-M. Splashing Threshold of Oblique Droplet Impacts on Surfaces of Various Wettability. Langmuir 2015, 31, 10100–10111. [Google Scholar] [CrossRef]
  31. Tadmor, R.; Chaurasia, K.; Yadav, P.S.; Leh, A.; Bahadur, P.; Dang, L.; Hoffer, W.R. Drop Retention Force as a Function of Resting Time. Langmuir 2008, 24, 9370–9374. [Google Scholar] [CrossRef]
  32. Cao, C.; Song, Y.-Y.; Zhou, Z.-L.; Cao, L.-D.; Li, F.-M.; Huang, Q.-L. Effect of Adhesion Force on the Height Pesticide Droplets Bounce on Impaction with Cabbage Leaf Surfaces. Soft Matter 2018, 14, 8030–8035. [Google Scholar] [CrossRef] [PubMed]
  33. Yadav, P.S.; Bahadur, P.; Tadmor, R.; Chaurasia, K.; Leh, A. Drop Retention Force as a Function of Drop Size. Langmuir 2008, 24, 3181–3184. [Google Scholar] [CrossRef] [PubMed]
Figure 1. Photos of the three species of crop plants: (a) tomato; (b) pepper; (c) winter wheat.
Agronomy 12 02228 g001
Figure 2. Experimental setup of droplet retention measurement: (A) spray nozzle; (B) droplet clouds; (C) micro slide; (D) glass rod; (E) foamy pyramid-like protective cover; (F) electronic balance; (G) computer; (H) balance readings; (I) plants.
Agronomy 12 02228 g002
Figure 3. Leaves of three species of crops under microscope view: (a) tomato; (b) pepper; (c) winter wheat.
Agronomy 12 02228 g003
Figure 4. Variation curve of droplet retention on tomato leaves.
Agronomy 12 02228 g004
Figure 5. Variation curve of droplet retention on winter wheat leaves.
Agronomy 12 02228 g005
Figure 6. Variation curve of droplet retention on pepper leaves.
Agronomy 12 02228 g006
Figure 7. Simplified model of droplet retention on leaf surface.
Agronomy 12 02228 g007
Figure 8. Images of droplet retention on tomato leaf captured using a high-speed camera. Initial stage of droplet deposition on leaf surface with uniform droplet volume distribution (a). With continuous spraying, droplets merge (b) and form droplets with different volumes. The largest volume of droplets (c) eventually leads to loss (d).
Agronomy 12 02228 g008
Figure 9. The drop on tomato leaf. (a) A drop initially reaches the glandular hairs; (b) the glandular hair occurs bending under the action of drop; (c) completely immersion of the glandular hairs into the drop (shadowed area); (d) penetration of glandular hairs inside the drop.
Agronomy 12 02228 g009
Figure 10. Force analysis of droplet retained on a surface.
Agronomy 12 02228 g010
Table 1. Results of surface properties of crop leaves.
Crop
Species
Surface
Properties
Average Leaf Area (cm2)Surface
Roughness ( μ m )
Surface Hydrophobicity ( θ / ° )
TomatoGlandular hairs14.2024.7397.67°
PepperWax24.295.2870.07°
Winter wheatWaxy crystals20.9017.59131.98°
Publisher’s Note: MDPI stays neutral with regard to jurisdictional claims in published maps and institutional affiliations.

