Article

RTM Inversion through Predictive Equations for Multi-Crop LAI Retrieval Using Sentinel-2 Images

1
Department of Sustainable Crop Production (DI.PRO.VE. S.), Università Cattolica del Sacro Cuore, 29122 Piacenza, Italy
2
Remote Sensing and Spatial Analysis Research Center (CRAST), Università Cattolica del Sacro Cuore, 29122 Piacenza, Italy
3
Consorzio Bonifica CER, 40137 Bologna, Italy
4
Department of Agricultural and Food Sciences (DISTAL), Alma Mater Studiorum Università di Bologna, 40126 Bologna, Italy
*
Author to whom correspondence should be addressed.
Agronomy 2022, 12(11), 2835; https://doi.org/10.3390/agronomy12112835
Submission received: 30 September 2022 / Revised: 5 November 2022 / Accepted: 10 November 2022 / Published: 13 November 2022
(This article belongs to the Section Farming Sustainability)

Abstract

:
Near-real-time, high-spatial-resolution leaf area index (LAI) maps would enable producers to monitor crop health and growth status, improving agricultural practices such as fertiliser and water management. LAI retrieval methods are numerous and can be divided into statistical and physically based methods. While statistical methods are generally subject to high site-specificity but possess high ease of implementation and use, physically based methods are more transferable, albeit more complex to use in operational settings. In addition, statistical methods need a large amount of data for calibration and subsequent validation, and this is only seldom feasible. Techniques based on predictive equations (PEphysical) represent a viable alternative, allowing the partial combination of statistical and physical methods merits while minimising their shortcomings. In this paper, predictive equation-based techniques were compared with four other methods: two radiative transfer model (RTM) inversion methods, one based on neural network (NNET) and one based on a look-up table (LUT), and two empirical methods (one using empirical models based on vegetation indices and in situ data and one based on empirical models found in the scientific literature). The methods were chosen based on common use. To evaluate the performance of the studied methods, the coefficient of determination (R2), root mean square error (RMSE), and normalised root mean square error (nRMSE, %) between the estimates and in situ LAI measurements were reported. The best PEphysical results, achieved by the OSAVI index (RMSE = 0.84 m2 m−2), provided better performance for LAI recovery than the NNET-based RTM inversions (0.86 m2 m−2) or the estimates made by LUT (0.94 m2 m−2). Furthermore, the best PEphysical produced accuracies comparable to the best empirical model (RMSE = 0.71 m2 m−2), calibrated through in situ data, and similar to the best literature model (RMSE = 0.76 m2 m−2). These results indicated that PEphysical can be used to recover LAI with transferability comparable to literature models.

1. Introduction

Timely information on crop growth and health is increasingly important for developing strategic food policies and for supporting natural resource management [1,2,3]. Mapping crop biophysical parameters is essential in many applications of land surface monitoring [4,5]. Leaf Area Index (LAI), in particular, is of particular interest and the most studied among biophysical parameters. A key canopy structural variable, it is often used to model surface energy balance and crop productivity as well as study water and carbon balances from the soil–crop–atmosphere continuum [6,7,8,9]. For these reasons, at field scale, the availability of near real-time estimation of LAI would enable producers to monitor crop health and growth status and improve agricultural practices’ efficiency, such as fertiliser application and water management [1,10]. However, direct measurements of biophysical parameters are labour-intensive [11]. For this reason, the use of remote-sensing techniques involving satellites providing a high rate of revisit frequency, requiring limited labour, and enabling crop biophysical parameter measurement at different scales, is rapidly expanding [12]. Recently, several approaches have been developed to retrieve crop biophysical parameters through remote-sensing techniques. These techniques can be summarised into two main approaches [13,14]: (i) statistical approaches, which typically consist of relating the biophysical parameters to spectral data through linear or non-linear regression techniques (e.g., polynomial regressions or machine learning algorithms) and (ii) physical approaches using physically based radiative transfer models (RTMs) [15,16]. In statistical approaches, biophysical parameters are correlated with vegetation indices (VIs) that combine two or more spectral bands sensitive to the biophysical parameter of interest [17]. This technique enables enhancing the spectral characteristics of a specific vegetation property while minimising the background effects of soil, atmosphere [18,19,20,21], and sun-target-sensor geometry [22]. While the statistical approach has some advantages, including the ease of use in operational settings and their availability in the scientific literature [14], it also has several disadvantages. Models based on statistical approaches are known to have reduced transferability to conditions other than those in which they were developed [23,24] and require in situ data for their calibration. Therefore, the robustness of these models will depend on the amount, quality, and distribution of data, which are often very complex to collect in large numbers [25].
In contrast, the physical approaches using radiative transfer models (RTMs) are more robust for LAI retrieval, overcoming the problem of lack of transferability due to their ability to simulate radiative behaviour mechanistically. However, RTMs are more complex and require more computational cost in their calibration step compared with statistical approaches. RTMs model the spectral variation of the canopy reflectance using physical principles involving viewing and illumination geometry, biophysical and biochemical characteristics of leaves and canopy, and soil characteristics [16]. In literature, adequate results have been reported for LAI retrieval using the PROSAIL canopy reflectance model-a combination of the PROSPECT [26] and SAIL [27] models-as revised by Jacquemoud et al. [16]. The PROSAIL model does not directly produce estimates of a crop’s biophysical parameters, but it does enable the generation of a spectral database that must subsequently be inverted using appropriate inversion strategies in order to retrieve the related biophysical parameters [28,29]. Available inversion techniques include Look Up Tables—LUT [30,31,32] and hybrid regression approaches based on machine learning algorithms, such as artificial neural networks (NNET) [33,34], which combine physical and statistical methods. Another inversion technique was proposed by Haboudane et al. [18] and Atzberger et al. [35]. They developed VIs–LAI relationships calibrated on synthetic data generated by RTM (e.g., so-called predictive equations) for model inversion. This technique combines the advantages of physical and statistical approaches, being characterized by simplicity of application and robustness in LAI retrieval. However, in previous studies, the PEphysical were evaluated on a small number of crops (maize, wheat, soybeans, or grasslands), preventing the identification of “universal” relationships between LAI and VIs. In operational situations, a universal algorithm is more functional than crop-specific relations for retrieving different crops’ LAI [36]. Therefore, the use of a higher number of crops must be investigated to identify an algorithm based on PEphysical that achieves reliable accuracy on average, regardless of the type of canopy structure.
In this context, the main objective of this study was to evaluate the accuracy and the transferability of PEphysical calibrated on data simulated by PROSAIL in LAI retrieval of multiple crops by comparing them with some of the most common LAI retrieval methods, such as (i) empirical models based on VIs and in situ data, (ii) empirical correlations found in scientific literature, (iii) the PROSAIL model inversion based on LUT, and (iv) the PROSAIL model inversion based on NNET models. Moreover, the overall aim of this study was to apply a cost-effective strategy for local validation of different LAI retrieval methods in a specific area.

2. Materials and Methods

2.1. Study Area

The test sites are located in the Po plain of the Emilia-Romagna region, Northern Italy, which is characterised by a temperate climate corresponding to the “Cfa” group according to the Köppen–Geiger climate classification [37] with an average annual precipitation of 700 mm and an average annual temperature of 14 °C. Field measurements were conducted at three different test sites and during three growing seasons: at the Acqua Campus agricultural test field, a Canale Emiliano-Romagnolo (CER) research centre in the municipality of Budrio (Bologna) in 2019 and 2020; in two farms near Ravenna in 2020 and 2021; in two fields near Piacenza in 2021 (Figure 1).

2.2. Field Measurement Protocol

Ground-based LAI measurements were collected at each test site. The size of the sampling units was based on an Elementary Sampling Unit (ESU) to better correlate the data with satellite resolution. Each ESU corresponded to a Sentinel-2 pixel (20 × 20 m) and included three fixed-pattern secondary sampling units (SSUs) along the diagonal axis for each of the four pixels 10 × 10 m constituting the ESU (Figure 2).
A total of 40 elementary sampling units (ESUs) were chosen in the centre of the monitored fields, maintaining a minimum distance of 10 m from the field boundaries. In situ LAI measurements were recorded within the SSUs by using an AccuPAR LP-80® portable photosynthetically active radiation ceptometer to measure LAI non-destructively. For each ESU, the LAI values of the twelve SSUs were averaged and the average LAI value per ESU was obtained. The vertices and centre of the ESUs were geolocated using a GPS, providing an accuracy of less than 1 m for subsequent matching of the average LAI estimate with the corresponding Sentinel-2 reflectance data. In total, 106 LAI data from 40 ESUs were taken evaluating six different crops: Garlic (Allium sativum L.), Tomato (Solanum lycopersicum L.), Potato (Solanum tuberosum L.), Maize (Zea mays L.), Onion (Allium cepa L.), and Spinach (Spinacia oleracea L.), as shown in Table 1, which summarises the characteristics of the three test sites used in this study. The dataset covers a wide range of LAI values, i.e., from 0.05 to 7, providing an optimal experimental dataset for evaluating each methodology.

2.3. Satellite Data Acquisition and Processing

The Sentinel-2 (S2) mission of the European Space Agency’s Copernicus program consists of a pair of satellites launched in 2015 and 2017. Both satellites carry a Multi-Spectral Imager (MSI) with a swath of 290 km and provide data in 13 spectral bands ranging from the visible and near-infrared to the shortwave infrared region, including four bands at 10 m, six bands at 20 m, and three bands at 60 m spatial resolution [38]. Sentinel-2 provides data every 10 days at the equator with one satellite and five days with two satellites under cloud-free conditions, resulting in 2–3 days at mid-latitudes. Sentinel-2 images at Level 2A were downloaded for free from the Copernicus Open Access Hub website (https://scihub.copernicus.eu/ (accessed on 30 May 2021)). All field campaigns were carried out at days close, with a maximum of five days’ difference, to the Sentinel-2 overflight dates over the study area (Table 1).

3. Methods

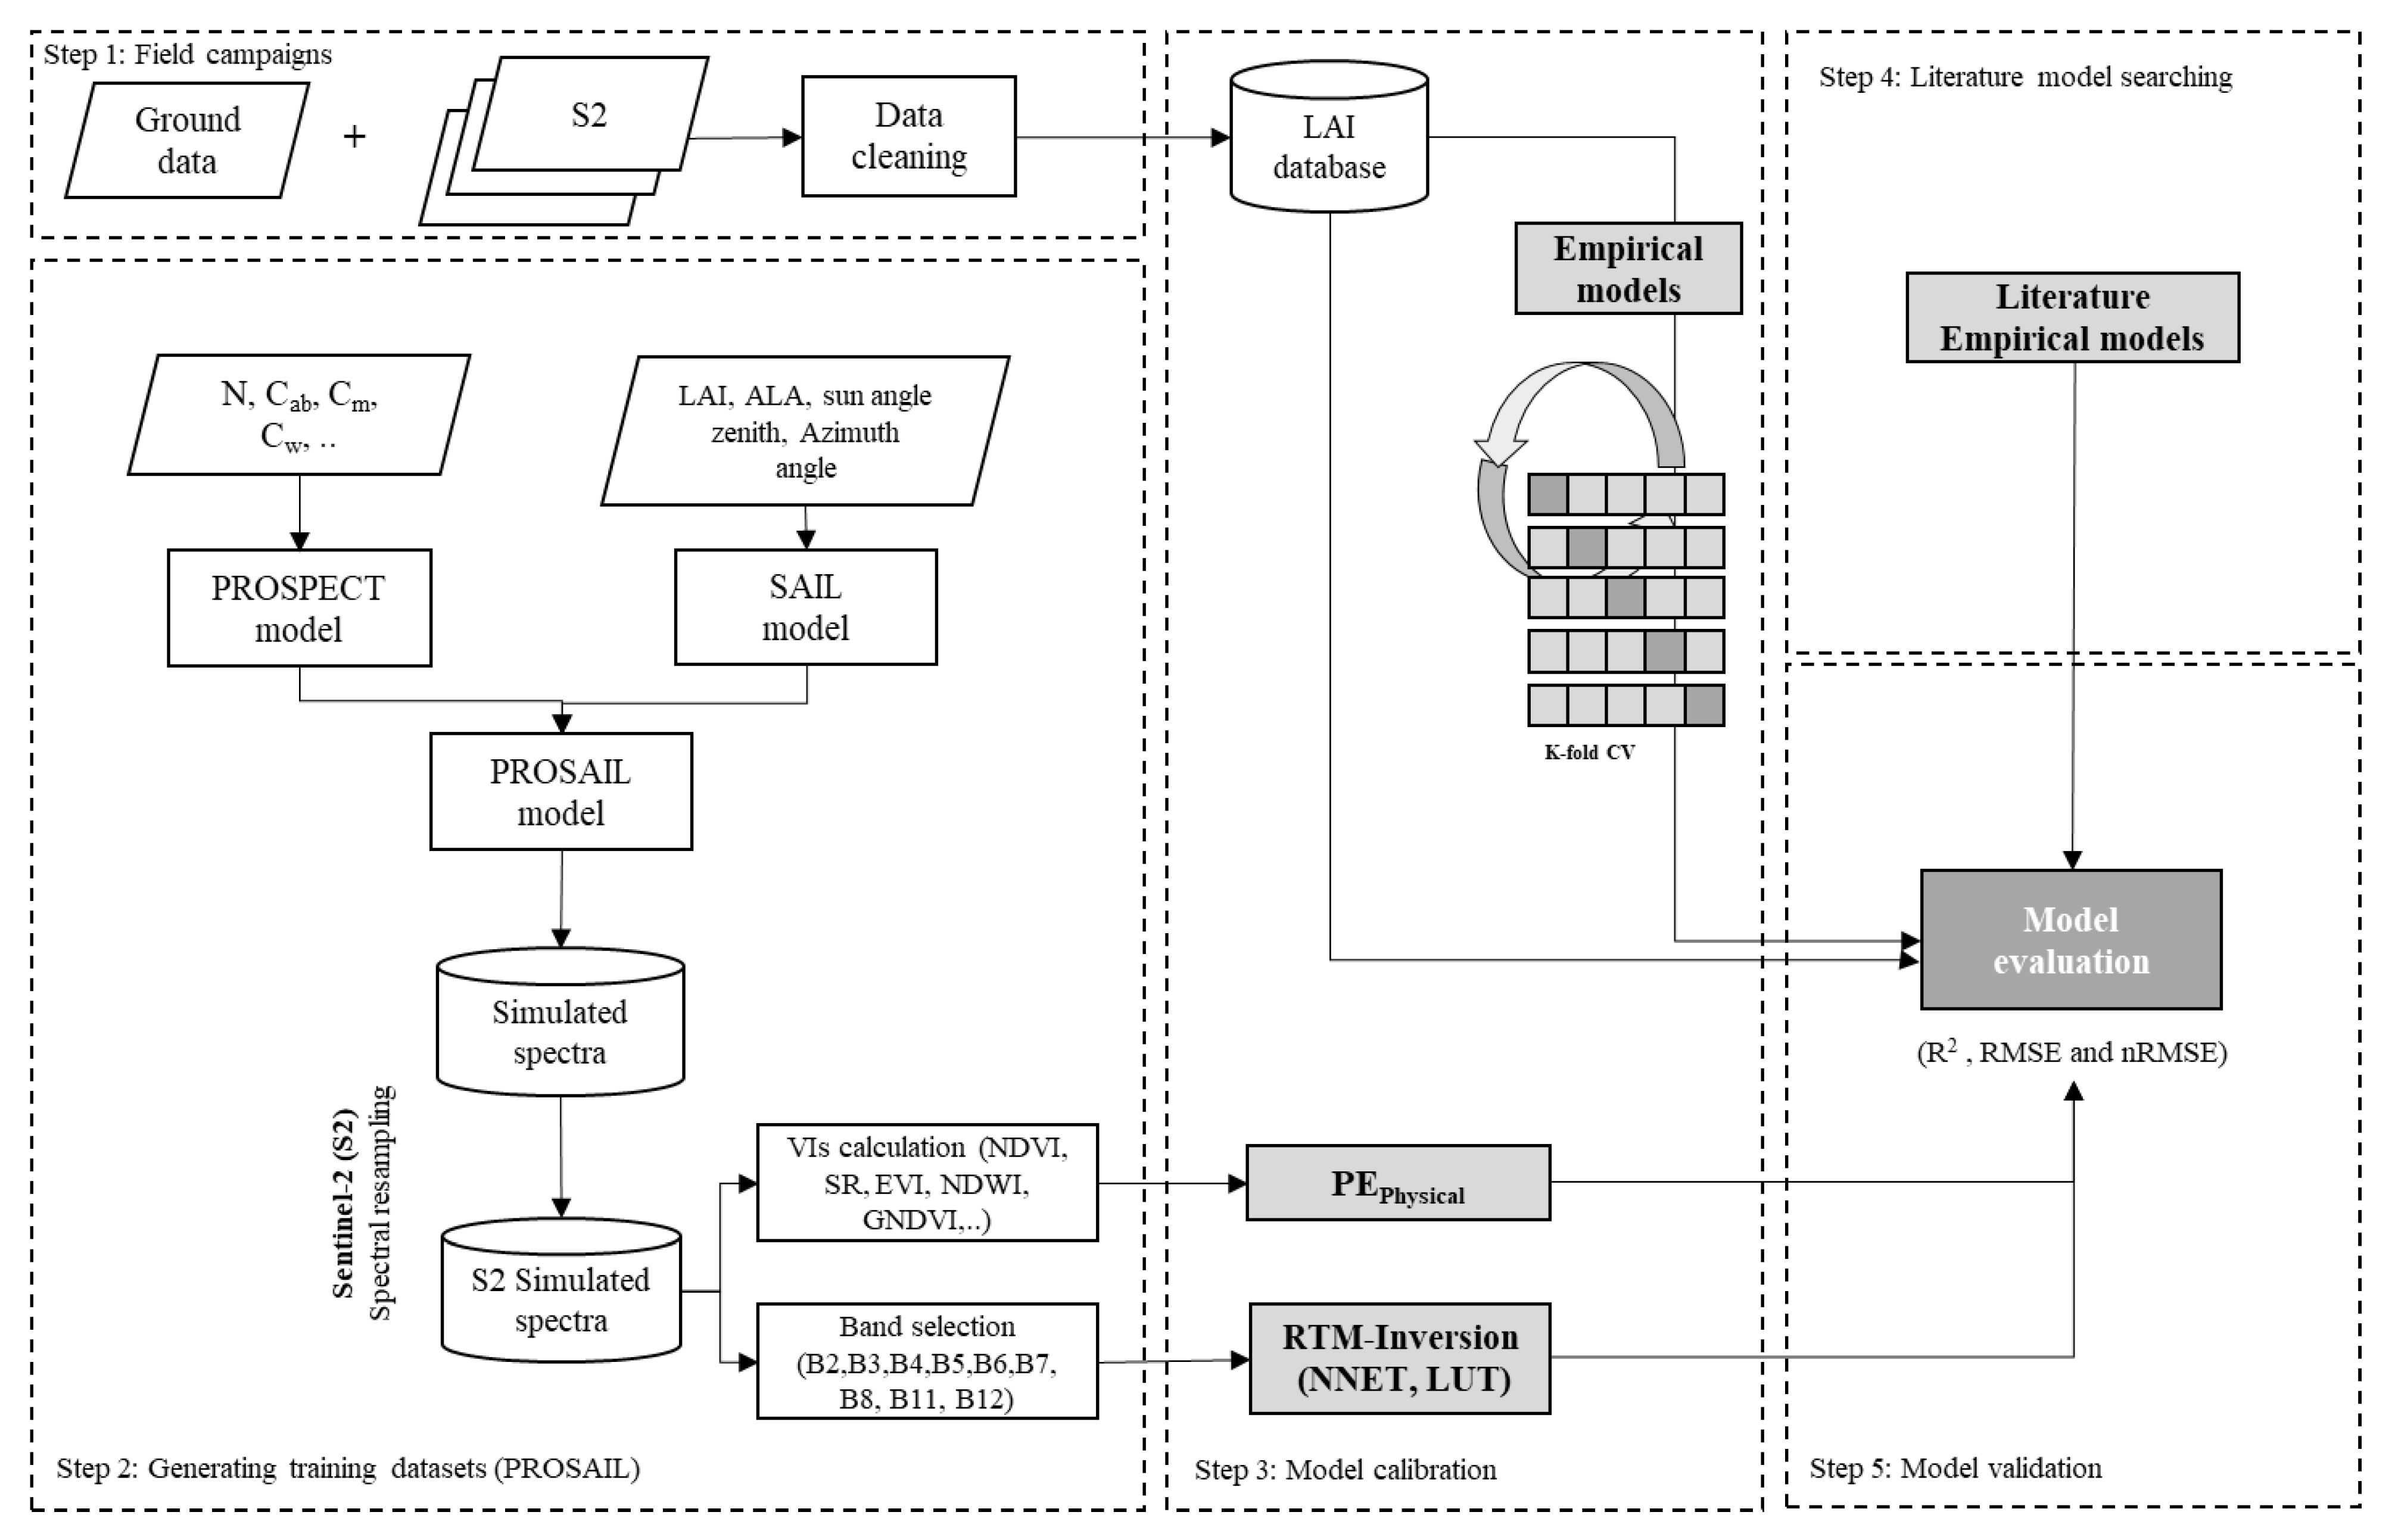
To evaluate the performance of PEphysical in LAI retrieval, its accuracy was compared with the performances achieved by four others LAI retrieval methods (Figure 3): two RTM inversion methods (one based on a LUT and the other on an NNET) and two statistical modelling methods (one based on in situ data and the other based on empirical models found in scientific literature). These methods were chosen since they are the most widely used by the remote sensing community, and a detailed description of each method is provided in the following sections. For PEphysical and empirical models (in situ data), both linear and 2nd-order polynomial regression for VIs-LAI relation were tested. The VIs evaluated numbered 21: CIgreen, CIre, EVI, EVI2, GNDVI, greenWDRVI, MSAVI, MTVI2, NDGI43, NDRE, NDVI, NDWI, OSAVI, RDVI, rededgeWDRVI, RI, SR, TRBI, TVI, VARIrededge, and WDRVI3. Table 2 displays the equations of each tested VI.

3.1. Empirical and Empirical Literature Models

In situ LAI data (n = 106) were sequentially regressed (linearly and polynomially) against 21 VIs to determine which achieved the best performance. A cross-validation strategy based on the k-fold technique was used to ensure more robust results [53] and the available dataset was divided into k = 5 subsets. From these k subsets, one subset was selected as the calibration dataset (n ≃ 21), and the remaining k-1 subsets were used for model validation (n ≃ 85). The cross-validation process was then repeated k times, with each k subsets used as the calibration dataset. Thus, all the in-situ data were used for both calibration and validation.
In addition to statistical approaches based on empirical models calibrated to in situ data, relationships found in scientific literature were evaluated. The relationships evaluated were taken from the leading scientific articles studying the relationship between vegetation indices and LAI. Table S1 displays the equation for estimating LAI found in scientific literature [36,39,48,52,54,55,56,57,58,59,60,61].

3.2. PROSAIL Model

The PROSAIL radiative transfer model [62] was selected for the physically based canopy parameter retrieval methods. The PROSAIL is a coupled model of the leaf model PROSPECT-5 [63] and the canopy model SAILH [27] that simulates the top of canopy bidirectional reflectance from 400 to 2500 nm. The leaf model simulates leaf reflectance and transmittance considering the mesophyll structural parameter (N), leaf chlorophyll (Cab), dry matter (Cm), and water (Cw) contents. Cw is tied to the dry matter content (Cw = Cm × CwREL/(1 − CwREL)), assuming that green leaves have a relative water content (CwREL) varying within a relatively small range [64]. The SAILH model is characterised by the Average Leaf Inclination Angle (ALIA), the Leaf Area Index (LAI) and the hot-spot parameter (hspot). Additionally, information about viewing geometries, i.e., sun and sensor (observer) zenith angles (SZA and OZA, respectively) as well as the relative azimuth angle between both (rAA), must be provided by the users. The values of the input parameters (Cab, LAI, etc.) were selected based on existing literature focused on the studied crops [65] The PROSAIL inputs (parameter combinations) and outputs (spectral reflectance) were used to generate a synthetic database. The synthetic database generated included 278,400 parameter combinations following the ranges (minimum and maximum) and the step of the parameters summarised in Table 3. PROSAIL model as implemented in the “hsdar” R package [66] was used to simulate the canopy reflectance. This study tested three inversion approaches (LUT, NNET and PEphysical). All PROSAIL inversion methods use the same input combination to ensure perfect comparability. In both cases, the synthetic dataset generated via PROSAIL was spectrally resampled according to the Sentinel-2 response functions [67,68]. For LUT and NNET inversion, all the spectral bands at 10 m and at 20 m of spatial resolutions (except for B8a spectral band) were used, while for PEphysical, 21 VIs (from one to one) were calculated on a synthetic dataset.

3.2.1. PROSAIL Inversion Using Predictive Equations (PEphysical)

Predictive equations (PEphysical) inversion method [14,35,69,70] were fitted using the LAI values of the synthetic database (a small part of the synthetic database was used) and each VI by linear and second-order polynomial regressions. The same 21 VIs used in the empirical models were used for PEphysical modelling.

3.2.2. The Look-Up Table Inversion Method

The look-up table (LUT) was sorted using the cost function based on root mean square error (RMSE) to find the solution to the inverse problem for the measured canopy reflectance [30,71]. The RMSEr cost function (Equation (1)), between the measured reflectance and the simulated reflectance found in the LUT, was calculated as follows:
R M S E r = i = 1 n ( R m e a s u r e d i R s i m u l a t e d i ) 2 n
where n is the number of spectral bands used in the present work, R m e a s u r e d i is the reflectance at spectral band i measured by the Sentinel-2, and R s i m u l a t e d i is the simulated reflectance at spectral band i in the LUT. The solution was determined using the mean value of LAI corresponding to the best 100 solutions (i.e., having the smallest sorted RMSEr).

3.2.3. PROSAIL Inversion Using NNET

A simple “feed-forward” neural network (NNET) with a single hidden layer (input layer, one hidden layer, and one output layer) was used to invert the PROSAIL database. Part of the parameter combinations and the simulated spectral reflectance of the synthetic database were used to train the NNET for LAI retrieval. The NNET was trained using the “caret” R package [72]. There are two steps to train the Neural Network: (i) a feed-forward iteration to compute the network’s output; (ii) a back-propagation learning rule to minimise the error between predicted outputs and input training values. The training dataset was used to optimise the number of units in the hidden layer (size) and decay of the NNET, while the error of the test dataset was monitored during the training process. To optimise the hyper-parameters of the NNET, a searching grid was applied. The number of hidden units was tuned for each value between 1 and 50 [72]. Weight decay was tuned between 0.1 and 10 with step of 1 increment.

3.3. Model Evaluation

The performance of the LAI retrieval methods was evaluated using the coefficient of determination (R2)—(2), Root Mean Square Error (RMSE)—(3) and normalised RMSE (nRMSE)—(4), which is the RMSE divided by the range of the reference measurements between the in situ data values.
R 2 = ( i = 1 n ( y i y ¯ i ) ( f i f ¯ i ) ) 2 i = 1 n ( y i y ¯ i ) 2   i = 1 n ( f i f ¯ i ) 2
R M S E = 1 n   i = 1 n ( y i f i ) 2
n R M S E = R M S E y i , m a x y i , m i n
where n (i = 1, 2, …, n) is the number of samples used to test each Leaf Area Index (LAI) technique, y i is the observed LAI, y ¯ i is the corresponding mean value, f i is the predicted LAI and f ¯ i is the corresponding mean value. The closer R2 is to 1, the higher the retrieval performance of the model is. Small nRMSE (%) and RMSE values indicate less discrepancy within observed and predicted measurement.

4. Results

4.1. PEphysical vs. RTM-Inversion Methods

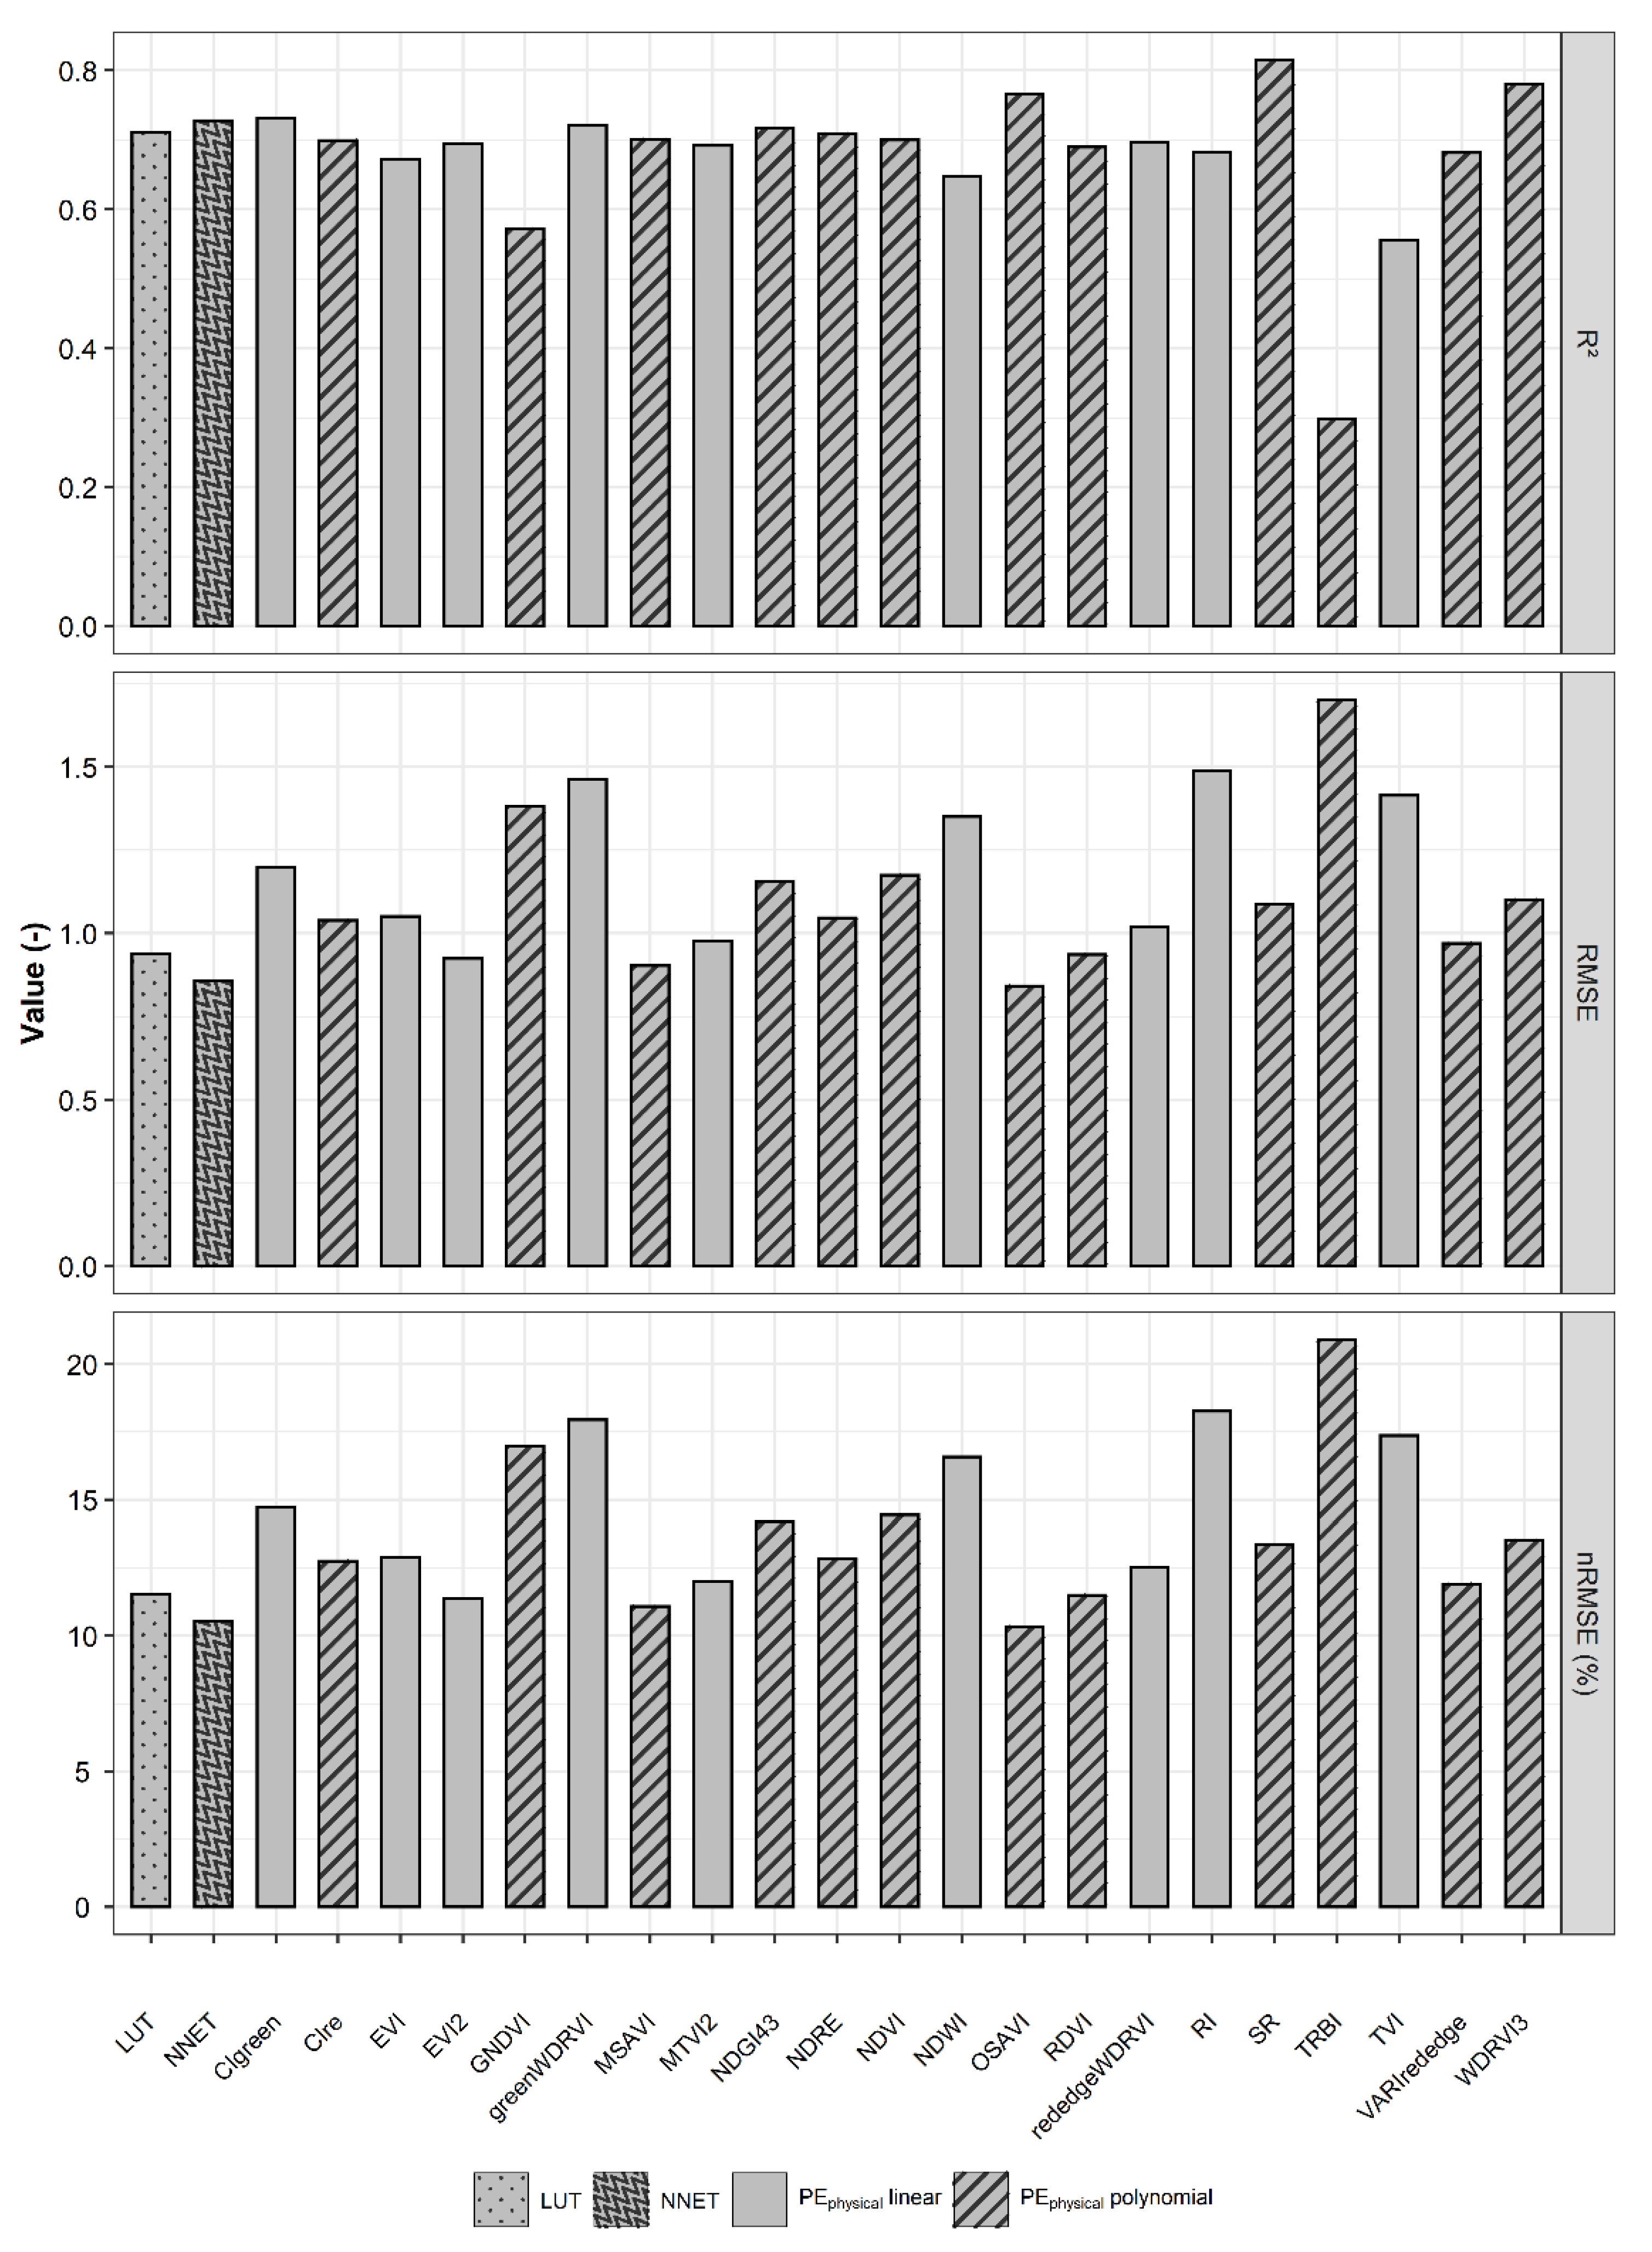
Results obtained with the physical approaches are summarised in Figure 4 and Table S2. The performance of the predictive equation (PEphysical) was compared against the other two inversion methods (NNET and LUT) based on a PROSAIL synthetic database. Inversion by NNET gave good accuracy for the estimation of LAI (R2 = 0.73, RMSE = 0.86 m2 m−2 and nRMSE = 10.53 %). In the PEphysical, the best performing VI for LAI retrieval was the OSAVI (R2 = 0.77, RMSE = 0.84 m2 m−2 and nRMSE = 10.34 %), followed by MSAVI and EVI2. The best PEphysical (the one based on OSAVI) was more accurate than both RTM inversion based on NNET and LUT (Figure 4) with an RMSE of 0.84 m2 m−2 (PEphysical) vs. 0.86 m2 m−2 and 0.94 m2 m−2 (NNET and LUT, respectively).

4.2. PEphysical vs. Empirical and Empirical Literature Models

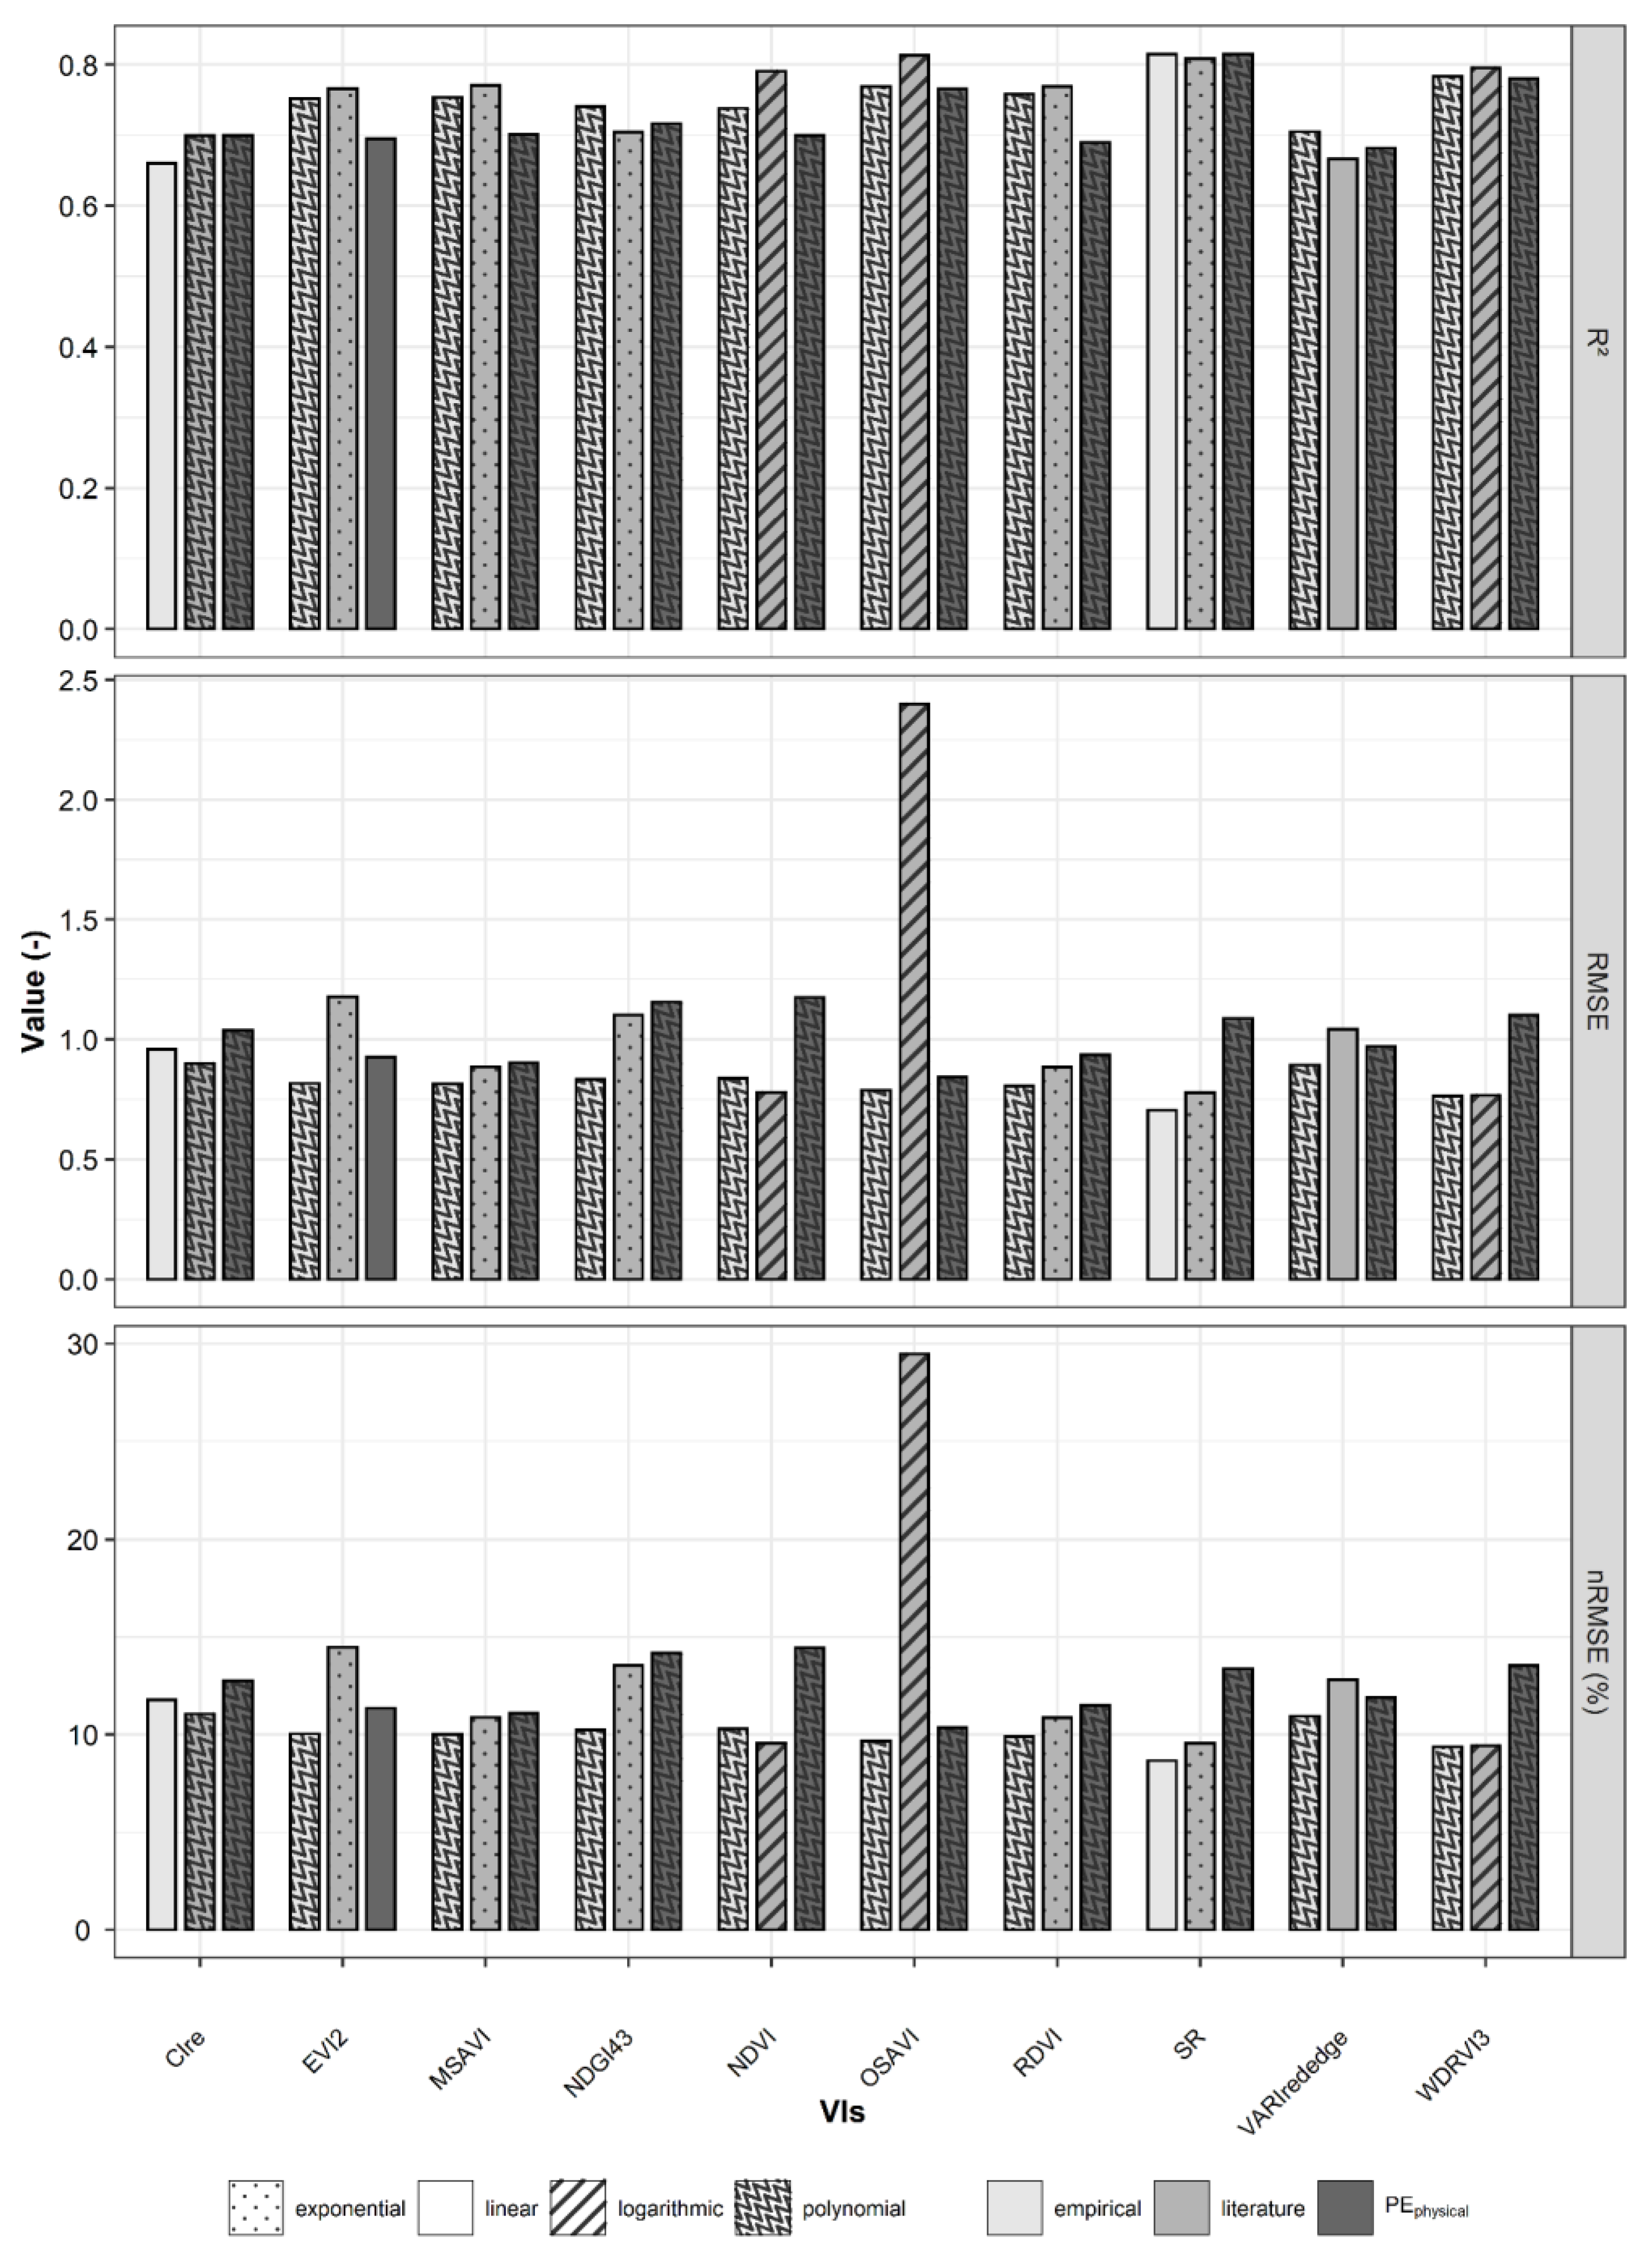
The best-performing VIs of PEphysical were compared (Figure 5 and Table S3) to the values of R2, RMSE and nRMSE (%) achieved by the same VIs for empirical and literature models (for this method only the best performance of the VIs between several literature models evaluated was reported). The accuracy achieved by the OSAVI polynomial of the PE (RMSE = 0.84 m2 m−2) was similar to the OSAVI polynomial of the empirical (RMSE = 0.79 m2 m−2) while the OSAVI of the literature achieved the worst performance (RMSE = 2.40 m2 m−2). The SR and WDRVI3 displayed higher performance with an RMSE of 0.71 m2 m−2 and 0.78 m2 m−2 for SR and with an RMSE of 0.76 m2 m−2 and 0.77 m2 m−2 for WDRVI3 for empirical and literature models, respectively.

4.3. Crop Specific Differences

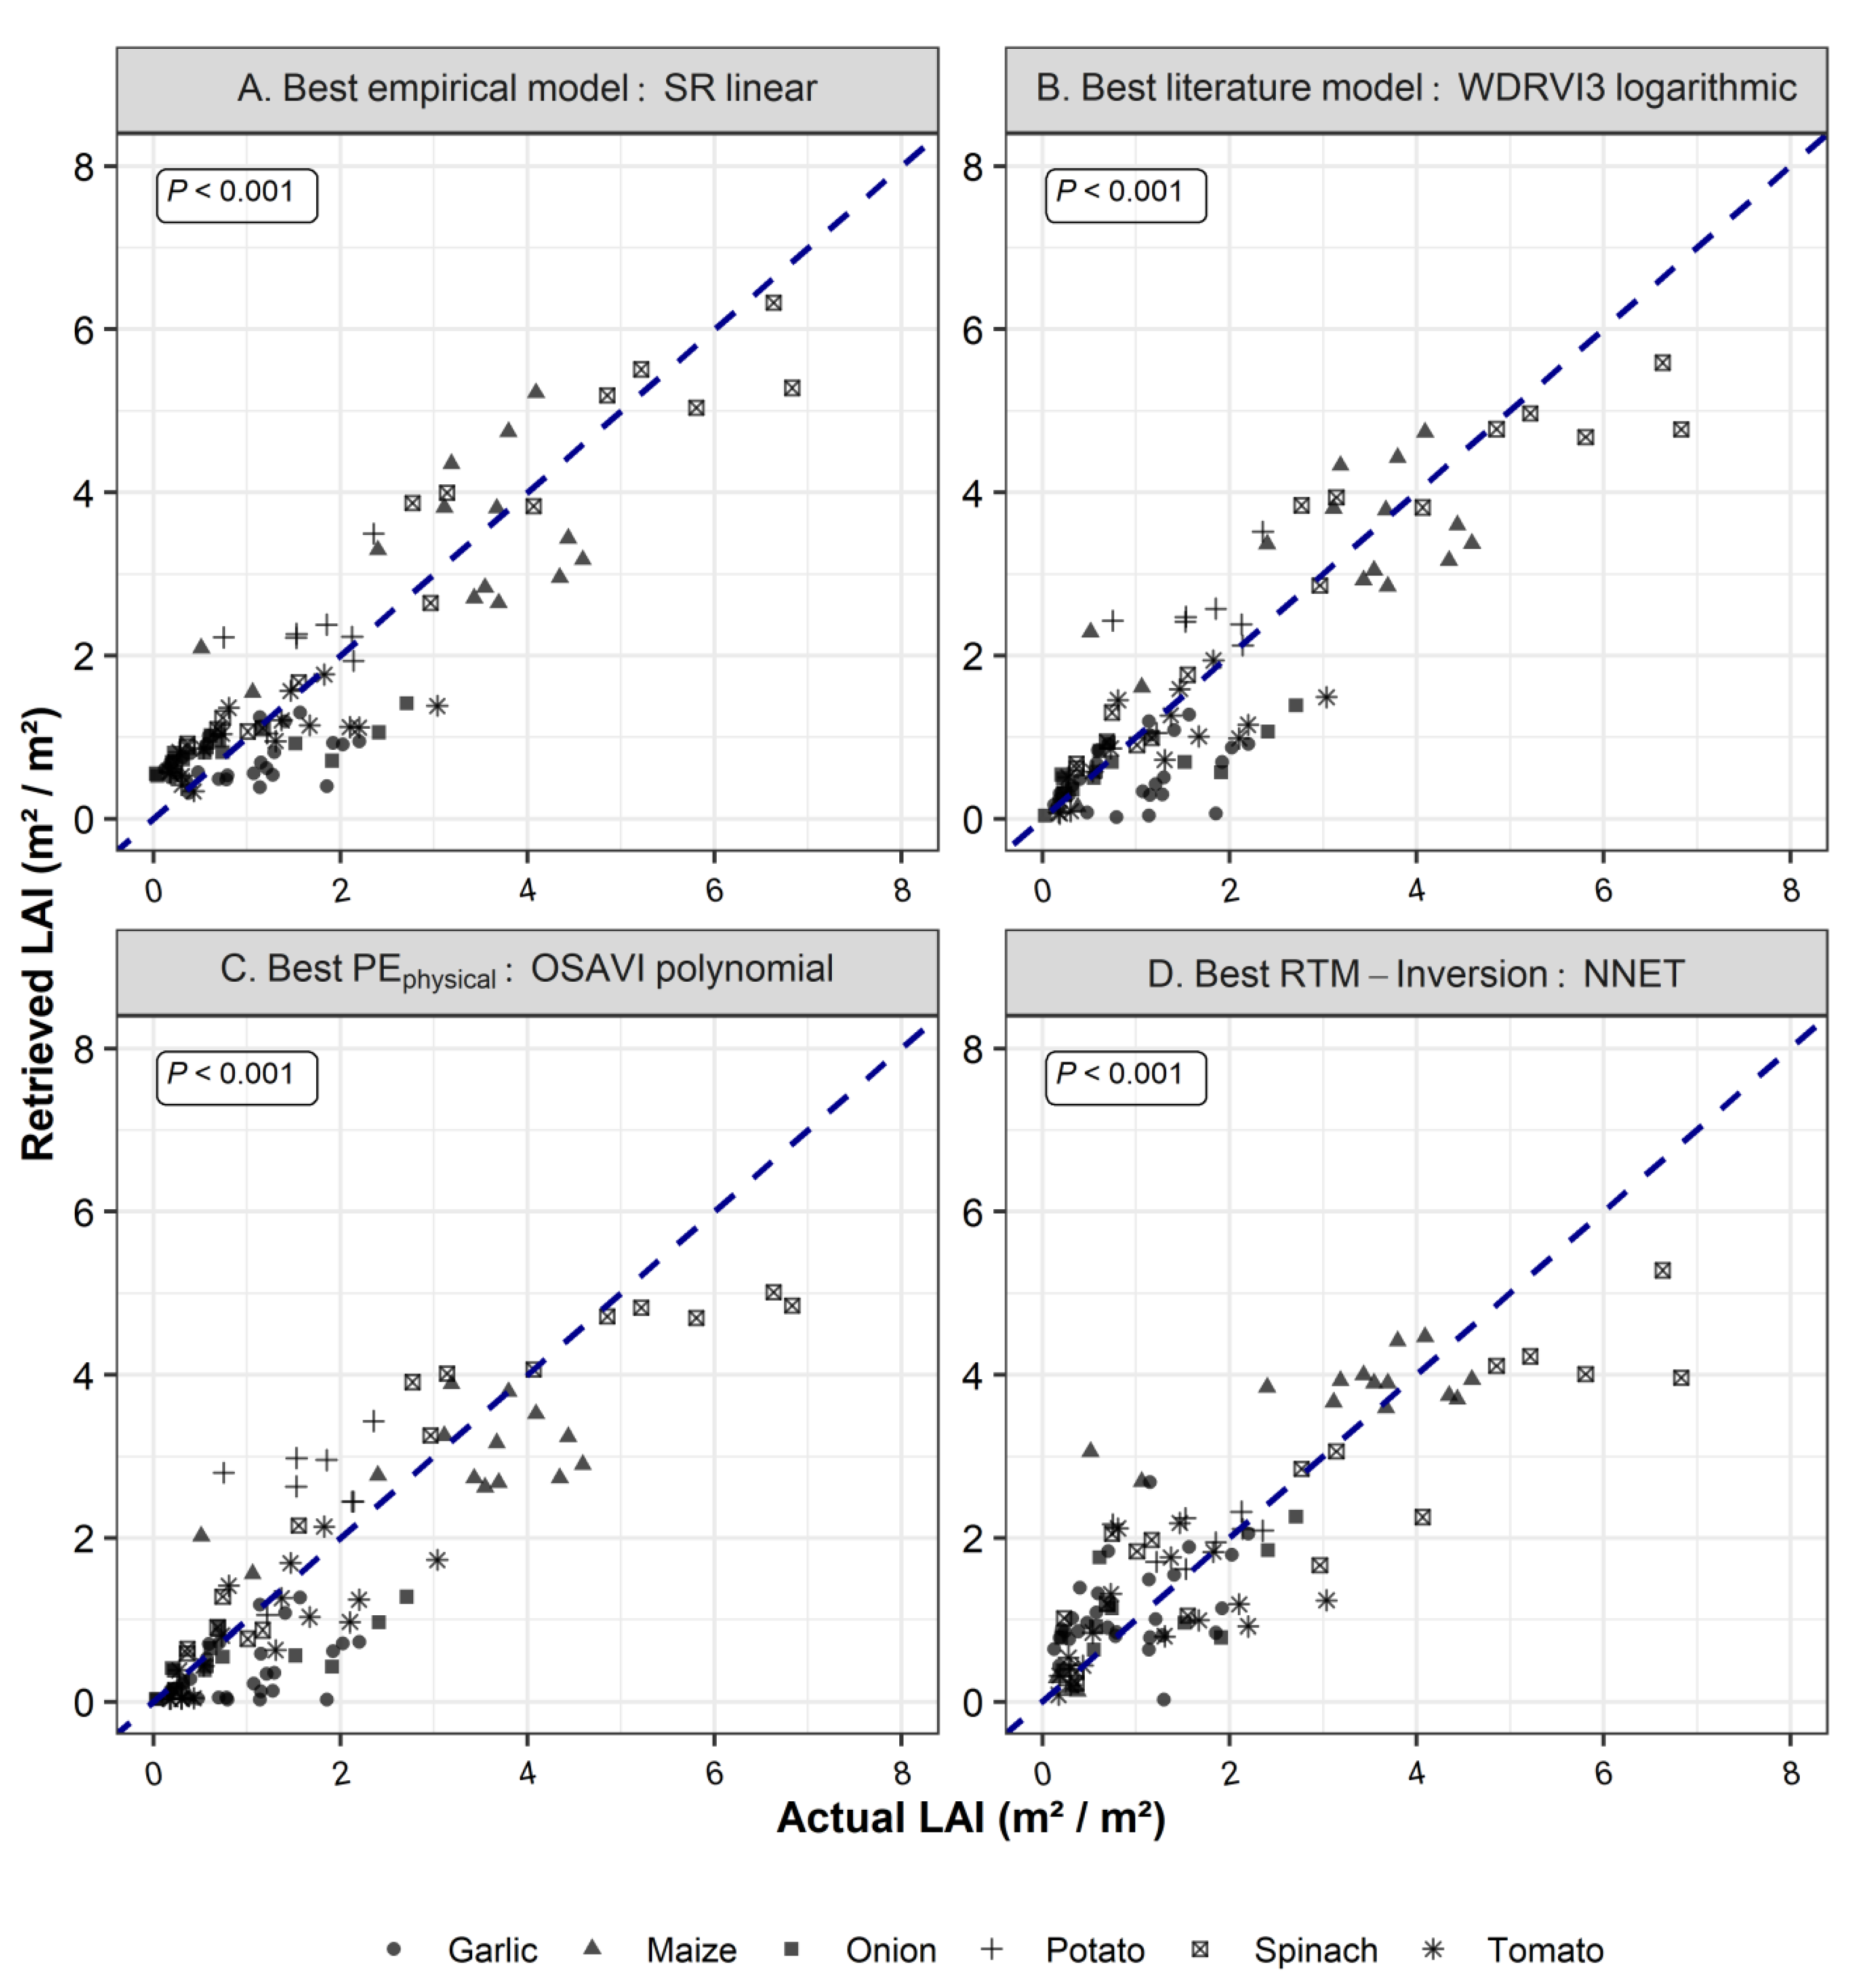
Overall, the method based on linear empirical models (i.e., SR) provided the lowest values of RMSE (0.71 m2 m−2) and the highest value of R2 (0.81). Moreover, it provided the best performance in terms of nRMSE (8.66%). In contrast, the RTM-inversion method based on NNET obtained the lowest performance with 0.86 m2 m−2, 10.53%, and 0.73 of RMSE, nRMSE, and R², respectively. However, by analysing the scatterplots between the measured and retrieved LAI (Figure 6) of the best models for each evaluated method (i.e., empirical, literature, RTM-inversion and PEphysical), the retrieval performance appeared to vary among different crops (Figure 6), which exhibited different canopy structures.
In general, the methods for LAI retrieval showed the best performance for spinach with nRMSE ranging from 8.36% (Empirical model SR Linear) to 16.13% (NNET-inversion) and the worst performance for potato with nRMSE ranging from 37.58% (NNET-inversion) to 70.17% (PEphysical OSAVI polynomial). When compared to the other three methods, PEphysical (OSAVI) achieved a similar accuracy in LAI retrieval for spinach, maize, and tomato, but instead, its accuracy was low concerning the potato (Figure 7).

5. Discussion

In this study, the predictive equations (PEphysical) method were compared with different methodologies (empirical models, empirical literature models, and RTM inversion based on NNET and LUT) to evaluate the accuracy and transferability in Leaf Area Index (LAI) retrieval on six of the main irrigated crops in Northern Italy (i.e., garlic, maize, onion, potato, spinach, tomato). The results were analysed by computing R2, RMSE, and nRMSE (%) values considering all crops together and for each specific crop. PEphysical is an interesting RTM inversion alternative to traditional techniques such as LUT and machine learning algorithms (e.g., NNET) for LAI retrieval because of its ability to combine a physical approach and ease of use. PEphysical is calibrated on synthetically generated databases where VIs are calculated and fitted with LAI by linear or polynomial models. This method produced models with similar accuracy using OSAVI, MSAVI, and EVI2 than the inversion methods based on NNET and LUT. In particular, in this study PEphysical with OSAVI, MSAVI, and EVI2 was more accurate than LUT, while PEphysical with OSAVI alone was more accurate than NNET. These results do not confirm what has been reported in previous studies. In fact, applying PEphysical to HyMap hyperspectral data over grasslands produced models with significantly lower accuracy than inversion with LUT [35]. In general, RTM inversion based on NNET and LUT provided acceptable results overall, demonstrating that radiative transfer model inversion can achieve comparable performance to statistical approaches, which are generally always better performing, as reported in previous studies [35,66,67,73,74,75]). However, RTM approaches require a fine parameterisation process that is quite complex and labour intensive, especially if several crops are being studied. An important difference between the RTM inversion based on NNET and LUT and the other methods used in this work consists in the number of spectral bands involved in LAI retrieval. RTM inversion based on NNET and LUT considers the entire spectral signature of each pixel, while the other methods rely on only two or more spectral bands. This implies a reduction in the computing resources required paired with a reduction in noise sensitivity, ensuring greater robustness, generalisation, and reproducibility. In the context of RTM inversion approaches, the results achieved by PEphysical, which partially uses physical knowledge incorporated in the RTM, encourage the use of this method. This is due to its high accuracy and extremely fast and straightforward inversion after calibration thanks to the use of VIs from the straightforward synthetic database.
Overall, without analysing the results for individual crops, the best linear empirical model achieved the highest performance for LAI retrieval. Among the statistical approaches, models derived from the literature [36,49,59] have also demonstrated satisfactory performance. Most notably, the models published by Nguy-Robertson et al. [52] achieved very high levels of accuracy and only slightly lower compared with the empirical models developed in this study. However, the models from literature were only validated on the dataset collected at the test sites adding confidence compared to the empirical models, for which part of the dataset had to be used for calibration. The SR and WDRVI3 showed the highest performance both for empirical and literature models. The SR and WDRVI3 vegetation indices equation uses only NIR and red bands. These bands are also used for calculating OSAVI, MSAVI, and EVI2 which showed the highest performance in the PEphysical method. The use of these bands only for accurate LAI retrieval contrasts claims reported in previous studies where vegetation indices that do not include the red-edge band are more crop specific [36]. In fact, it has been reported in other studies [49,66] that Sentinel-2 bands located in the red-edge region are key bands for LAI retrieval [66,76,77,78].
When analysing the performance of the methods for individual crops, it was observed that the best (low nRMSE) and worst (high nRMSE) performances were achieved for spinach and potato, respectively. All methods achieved excellent performance for spinach while NNET-based RTM inversion achieved higher performance for potato than other methods. PEphysical (OSAVI) in comparison with other methods achieved a good accuracy in LAI retrieval for spinach, maize, and tomato, while low accuracy for potato. This was probably due to the smaller dimension of the dataset related to potato, but generally the accuracy of LAI retrieval was lower for all row crops (potato, garlic, onion and tomato) compared with maize or spinach. This could also be related to soil effect that could affect the spectral data.

6. Conclusions

The aim of this study was to apply a cost-effective strategy for local validation of different LAI retrieval methods in a specific area. The predictive equations’ (PEphysical) accuracy for LAI retrieval was evaluated in this study by comparison of empirical models, empirical literature models, and two RTM inversions based on NNET and LUT, respectively. LAI data of six irrigated crops in Northern Italy (i.e., Garlic, Maize, Onion, Potato, Spinach, and Tomato) were collected in different years and locations in order to compare the transferability of these methods. The results obtained suggested that PEphysical accurately retrieved the LAI of the crops evaluated (except for the potato). The best performance of PEphysical was achieved by the OSAVI index (RMSE = 0.84 m2 m−2), and this method was more accurate than NNET and LUT inversion methods for LAI retrieval. LAI retrieval through PEphysical enabled achieving excellent results using even two spectral bands (i.e., NIR and red) compared with RTM inversion based on NNET and LUT, which use more spectral bands. PEphysical methods also achieved performance akin to that of empirical and empirical literature models, indicating that PEphysical could be employed for the retrieval ofto retrieve LAI to monitor crop growth and improve efficiency in agricultural practices. In fact, the use of PEphysical enables to combine of the merits of statistical and physical approaches by integrating the simplicity of use and ease of implementation of the empirical models with the ability to use (even if partially) the physical knowledge and transferability typical of radiative transfer models.

Supplementary Materials

The following supporting information can be downloaded at: https://www.mdpi.com/article/10.3390/agronomy12112835/s1, Supplementary Material Table S1. Literature relationships evaluated for LAI retrieval. Equation and reference are presented; Supplementary Material Table S2. R2, RMSE and nRMSE (%) obtained between field measured and retrieved LAI from physical approaches (LUT, NNET and PEphysical); Supplementary Material Table S3. R2, RMSE and nRMSE (%) obtained between field measured and retrieved LAI from empirical, empirical literature models compared to PEphysical.

Author Contributions

M.C. (Michele Croci): conceptualisation, data curation, methodology, investigation, formal analysis, writing—original draft. G.I.: data curation, investigation. G.A.: investigation, editing. T.L.: data curation, investigation. A.M.: investigation. F.V.: investigation. M.V.: investigation. M.C. (Michele Colauzzi): investigation. S.A. (Stefano Anconelli): funding acquisition, project administration. S.A. (Stefano Amaducci): conceptualisation, funding acquisition, supervision, review and editing. All authors have read and agreed to the published version of the manuscript.

Funding

The authors would like to acknowledge the support of Project “Protocolli Operativi Scalabili per l’agricoltura di precisione-POSITIVE”-CUP: D41F18000080009. One of the authors (MC) would like to acknowledge support from the Emilia-Romagna Region DGR n. 769 del 21/05/2018 co-financed by the European Social Fund (ESF) POR-FESR 2014-2020.

Data Availability Statement

The data that support the findings of this work are available from the corresponding author upon reasonable request.

Conflicts of Interest

The authors declare no conflict of interest. The funders had no role in the design of the study, in the collection, analyses, or interpretation of data, in the writing of the manuscript, or in the decision to publish the result.

References

  1. Brisco, B.; Brown, R.J.; Hirose, T.; McNairn, H.; Staenz, K. Precision Agriculture and the Role of Remote Sensing: A Review. Can. J. Remote Sens. 1998, 24, 315–327. [Google Scholar] [CrossRef]
  2. Wang, K.; Franklin, S.E.; Guo, X.; Cattet, M. Remote Sensing of Ecology, Biodiversity and Conservation: A Review from the Perspective of Remote Sensing Specialists. Sensors 2010, 10, 9647–9667. [Google Scholar] [CrossRef] [PubMed]
  3. Peng, Y.; Zhu, T.; Li, Y.; Dai, C.; Fang, S.; Gong, Y.; Wu, X.; Zhu, R.; Liu, K. Remote Prediction of Yield Based on LAI Estimation in Oilseed Rape under Different Planting Methods and Nitrogen Fertilizer Applications. Agric. For. Meteorol. 2019, 271, 116–125. [Google Scholar] [CrossRef]
  4. Defourny, P.; Bontemps, S.; Bellemans, N.; Cara, C.; Dedieu, G.; Guzzonato, E.; Hagolle, O.; Inglada, J.; Nicola, L.; Rabaute, T.; et al. Near Real-Time Agriculture Monitoring at National Scale at Parcel Resolution: Performance Assessment of the Sen2-Agri Automated System in Various Cropping Systems around the World. Remote Sens. Environ. 2019, 221, 551–568. [Google Scholar] [CrossRef]
  5. Xie, Y.; Sha, Z.; Yu, M. Remote Sensing Imagery in Vegetation Mapping: A Review. J. Plant Ecol. 2008, 1, 9–23. [Google Scholar] [CrossRef]
  6. Pu, R.; Gong, P.; Biging, G.S.; Larrieu, M.R. Extraction of Red Edge Optical Parameters from Hyperion Data for Estimation of Forest Leaf Area Index. IEEE Trans. Geosci. Remote Sens. 2003, 41, 916–921. [Google Scholar]
  7. Turner, D.P.; Cohen, W.B.; Kennedy, R.E.; Fassnacht, K.S.; Briggs, J.M. Relationships between Leaf Area Index and Landsat TM Spectral Vegetation Indices across Three Temperate Zone Sites. Remote Sens. Environ. 1999, 70, 52–68. [Google Scholar] [CrossRef]
  8. Jégo, G.; Pattey, E.; Liu, J. Using Leaf Area Index, Retrieved from Optical Imagery, in the STICS Crop Model for Predicting Yield and Biomass of Field Crops. Field Crop. Res. 2012, 131, 63–74. [Google Scholar] [CrossRef]
  9. Gilardelli, C.; Stella, T.; Confalonieri, R.; Ranghetti, L.; Campos-Taberner, M.; García-Haro, F.J.; Boschetti, M. Downscaling Rice Yield Simulation at Sub-Field Scale Using Remotely Sensed LAI Data. Eur. J. Agron. 2019, 103, 108–116. [Google Scholar] [CrossRef]
  10. Houlès, V.; Guérif, M.; Mary, B. Elaboration of a Nitrogen Nutrition Indicator for Winter Wheat Based on Leaf Area Index and Chlorophyll Content for Making Nitrogen Recommendations. Eur. J. Agron. 2007, 27, 1–11. [Google Scholar] [CrossRef]
  11. Bréda, N.J.J. Ground-Based Measurements of Leaf Area Index: A Review of Methods, Instruments, and Current Controversies. J. Exp. Bot. 2003, 54, 2403–2417. [Google Scholar] [CrossRef] [PubMed] [Green Version]
  12. Immitzer, M.; Vuolo, F.; Atzberger, C. First Experience with Sentinel-2 Data for Crop and Tree Species Classifications in Central Europe. Remote Sens. 2016, 8, 166. [Google Scholar] [CrossRef]
  13. Baret, F.; Buis, S. Estimating Canopy Characteristics from Remote Sensing Observations: Review of Methods and Associated Problems. In Advances in Land Remote Sensing; Springer: Dordrecht, The Netherlands, 2008; pp. 173–201. [Google Scholar]
  14. Rivera, J.; Verrelst, J.; Delegido, J.; Veroustraete, F.; Moreno, J. On the Semi-Automatic Retrieval of Biophysical Parameters Based on Spectral Index Optimization. Remote Sens. 2014, 6, 4927–4951. [Google Scholar] [CrossRef] [Green Version]
  15. Houborg, R.; Boegh, E. Mapping Leaf Chlorophyll and Leaf Area Index Using Inverse and Forward Canopy Reflectance Modeling and SPOT Reflectance Data. Remote Sens. Environ. 2008, 112, 186–202. [Google Scholar] [CrossRef]
  16. Jacquemoud, S.; Baret, F.; Andrieu, B.; Danson, F.M.; Jaggard, K.; Danson, M.; Jaggard, K. Extraction of Vegetation Biophysical Parameters by Inversion of the PROSPECT+SAIL Model on Sugar Beet Canopy Reflectance Data: Application to TM and AVIRIS Sensors. Remote Sens. Environ. 1995, 52, 163–172. [Google Scholar] [CrossRef]
  17. Verrelst, J.; Camps-Valls, G.; Muñoz-Marí, J.; Rivera, J.P.; Veroustraete, F.; Clevers, J.G.P.W.; Moreno, J. Optical Remote Sensing and the Retrieval of Terrestrial Vegetation Bio-Geophysical Properties—A Review. ISPRS J. Photogramm. Remote Sens. 2015, 108, 273–290. [Google Scholar] [CrossRef]
  18. Haboudane, D.; Miller, J.R.; Pattey, E.; Zarco-Tejada, P.J.; Strachan, I.B. Hyperspectral Vegetation Indices and Novel Algorithms for Predicting Green LAI of Crop Canopies: Modeling and Validation in the Context of Precision Agriculture. Remote Sens. Environ. 2004, 90, 337–352. [Google Scholar] [CrossRef]
  19. Khanna, S.; Palacios-Orueta, A.; Whiting, M.L.; Ustin, S.L.; Riaño, D.; Litago, J. Development of Angle Indexes for Soil Moisture Estimation, Dry Matter Detection and Land-Cover Discrimination. Remote Sens. Environ. 2007, 109, 154–165. [Google Scholar] [CrossRef]
  20. Mutanga Correspond, O.; Skidmore, A.K. Narrow Band Vegetation Indices Overcome the Saturation Problem in Biomass Estimation. Int. J. Remote Sens. 2004, 25, 3999–4014. [Google Scholar] [CrossRef]
  21. Yu, K.; Li, F.; Gnyp, M.L.; Miao, Y.; Bareth, G.; Chen, X. Remotely Detecting Canopy Nitrogen Concentration and Uptake of Paddy Rice in the Northeast China Plain. ISPRS J. Photogramm. Remote Sens. 2013, 78, 102–115. [Google Scholar] [CrossRef]
  22. Glenn, E.P.; Huete, A.R.; Nagler, P.L.; Nelson, S.G. Relationship between Remotely-Sensed Vegetation Indices, Canopy Attributes and Plant Physiological Processes: What Vegetation Indices Can and Cannot Tell Us about the Landscape. Sensors 2008, 8, 2136–2160. [Google Scholar] [CrossRef] [PubMed]
  23. Baret, F.; Guyot, G. Potentials and Limits of Vegetation Indices for LAI and APAR Assessment. Remote Sens. Environ. 1991, 35, 161–173. [Google Scholar] [CrossRef]
  24. Vuolo, F.; Neugebauer, N.; Bolognesi, S.F.; Atzberger, C.; D’Urso, G. Estimation of Leaf Area Index Using DEIMOS-1 Data: Application and Transferability of a Semi-Empirical Relationship between Two Agricultural Areas. Remote Sens. 2013, 5, 1274–1291. [Google Scholar] [CrossRef] [Green Version]
  25. Atzberger, C.; Darvishzadeh, R.; Schlerf, M.; le Maire, G. Suitability and Adaptation of PROSAIL Radiative Transfer Model for Hyperspectral Grassland Studies. Remote Sens. Lett. 2013, 4, 55–64. [Google Scholar] [CrossRef]
  26. Jacquemoud, S.; Baret, F. PROSPECT: A Model of Leaf Optical Properties Spectra. Remote Sens. Remote Sens. Environ. 1990, 34, 75–91. [Google Scholar] [CrossRef]
  27. Verhoef, W. Light Scattering by Leaf Layers with Application to Canopy Reflectance Modeling: The SAIL Model. Remote Sens. Environ. 1984, 16, 125–141. [Google Scholar] [CrossRef] [Green Version]
  28. Kimes, D.S.; Knyazikhin, Y.; Privette, J.L.; Abuelgasim, A.A.; Gao, F. Inversion Methods for Physically-based Models. Remote Sens. Rev. 2000, 18, 381–439. [Google Scholar] [CrossRef]
  29. Weiss, M.; Baret, F. Evaluation of Canopy Biophysical Variable Retrieval Performances from the Accumulation of Large Swath Satellite Data. Remote Sens. Environ. 1999, 70, 293–306. [Google Scholar] [CrossRef]
  30. Darvishzadeh, R.; Skidmore, A.; Schlerf, M.; Atzberger, C. Inversion of a Radiative Transfer Model for Estimating Vegetation LAI and Chlorophyll in a Heterogeneous Grassland. Remote Sens. Environ. 2008, 112, 2592–2604. [Google Scholar] [CrossRef]
  31. Rivera, J.P.; Verrelst, J.; Leonenko, G.; Moreno, J. Multiple Cost Functions and Regularization Options for Improved Retrieval of Leaf Chlorophyll Content and LAI through Inversion of the PROSAIL Model. Remote Sens. 2013, 5, 3280–3304. [Google Scholar] [CrossRef] [Green Version]
  32. Weiss, M.; Baret, F.; Myneni, R.B.; Pragnère, A.; Knyazikhin, Y. Investigation of a Model Inversion Technique to Estimate Canopy Biophysical Variables from Spectral and Directional Reflectance Data. Agronomie 2000, 20, 3–22. [Google Scholar] [CrossRef]
  33. Schlerf, M.; Atzberger, C. Inversion of a Forest Reflectance Model to Estimate Structural Canopy Variables from Hyperspectral Remote Sensing Data. Remote Sens. Environ. 2006, 100, 281–294. [Google Scholar] [CrossRef]
  34. Verger, A.; Baret, F.; Camacho, F. Optimal Modalities for Radiative Transfer-Neural Network Estimation of Canopy Biophysical Characteristics: Evaluation over an Agricultural Area with CHRIS/PROBA Observations. Remote Sens. Environ. 2011, 115, 415–426. [Google Scholar] [CrossRef]
  35. Atzberger, C.; Darvishzadeh, R.; Immitzer, M.; Schlerf, M.; Skidmore, A.; le Maire, G. Comparative Analysis of Different Retrieval Methods for Mapping Grassland Leaf Area Index Using Airborne Imaging Spectroscopy. Int. J. Appl. Earth Obs. Geoinf. 2015, 43, 19–31. [Google Scholar] [CrossRef] [Green Version]
  36. Nguy-Robertson, A.L.; Peng, Y.; Gitelson, A.A.; Arkebauer, T.J.; Pimstein, A.; Herrmann, I.; Karnieli, A.; Rundquist, D.C.; Bonfil, D.J. Estimating Green LAI in Four Crops: Potential of Determining Optimal Spectral Bands for a Universal Algorithm. Agric. For. Meteorol. 2014, 192–193, 140–148. [Google Scholar] [CrossRef]
  37. Peel, M.C.; Finlayson, B.L.; McMahon, T.A. Updated World Map of the Köppen-Geiger Climate Classification. Hydrol. Earth Syst. Sci. Discuss. 2007, 4, 439–473. [Google Scholar] [CrossRef] [Green Version]
  38. Drusch, M.; del Bello, U.; Carlier, S.; Colin, O.; Fernandez, V.; Gascon, F.; Hoersch, B.; Isola, C.; Laberinti, P.; Martimort, P.; et al. Sentinel-2: ESA’s Optical High-Resolution Mission for GMES Operational Services. Remote Sens. Environ. 2012, 120, 25–36. [Google Scholar] [CrossRef]
  39. Gitelson, A.A.; Viña, A.; Arkebauer, T.J.; Rundquist, D.C.; Keydan, G.; Leavitt, B. Remote Estimation of Leaf Area Index and Green Leaf Biomass in Maize Canopies. Geophys. Res. Lett. 2003, 30, 52. [Google Scholar] [CrossRef] [Green Version]
  40. Huete, A.; Didan, K.; Miura, T.; Rodriguez, E.P.; Gao, X.; Ferreira, L.G. Overview of the Radiometric and Biophysical Performance of the MODIS Vegetation Indices. Remote Sens. Environ. 2002, 83, 195–213. [Google Scholar] [CrossRef]
  41. Jiang, Z.; Huete, A.; Didan, K.; Miura, T. Development of a Two-Band Enhanced Vegetation Index without a Blue Band. Remote Sens. Environ. 2008, 112, 3833–3845. [Google Scholar] [CrossRef]
  42. Gitelson, A.; Merzlyak, M.N. Quantitative Estimation of Chlorophyll-a Using Reflectance Spectra: Experiments with Autumn Chestnut and Maple Leaves. J. Photochem. Photobiol. B 1994, 22, 247–252. [Google Scholar] [CrossRef]
  43. Gitelson, A.A. Wide Dynamic Range Vegetation Index for Remote Quantification of Biophysical Characteristics of Vegetation. J. Plant Physiol. 2004, 161, 165–173. [Google Scholar] [CrossRef] [PubMed] [Green Version]
  44. Qi, J.; Chehbouni, A.; Huete, A.R.; Kerr, Y.H.; Sorooshian, S. A Modified Soil Adjusted Vegetation Index. Remote Sens. Environ. 1994, 48, 119–126. [Google Scholar] [CrossRef]
  45. Rouse, J.W.; Haas, R.H.; Schell, J.A.; Deering, D.W. Monitoring Vegetation Systems in the Great Plains with ERTS. In Proceedings of the 3rd ERTS Symposium, Washington, DC, USA, 10–14 December 1973; NASA SP-351. Nasa Special Publication: Washington, DC, USA, 1973; pp. 309–317. [Google Scholar]
  46. Gao, B.-C. NDWI—A Normalized Difference Water Index for Remote Sensing of Vegetation Liquid Water from Space. Remote Sens. Environ. 1996, 58, 257–266. [Google Scholar] [CrossRef]
  47. Rondeaux, G.; Steven, M.; Baret, F. Optimization of Soil-Adjusted Vegetation Indices. Remote Sens. Environ. 1996, 55, 95–107. [Google Scholar] [CrossRef]
  48. Broge, N.H.; Leblanc, E. Comparing Prediction Power and Stability of Broadband and Hyperspectral Vegetation Indices for Estimation of Green Leaf Area Index and Canopy Chlorophyll Density. Remote Sens. Environ. 2001, 76, 156–172. [Google Scholar] [CrossRef]
  49. Pasqualotto, N.; Delegido, J.; van Wittenberghe, S.; Rinaldi, M.; Moreno, J. Multi-Crop Green LAI Estimation with a New Simple Sentinel-2 LAI Index (SeLI). Sensors 2019, 19, 904. [Google Scholar] [CrossRef] [Green Version]
  50. Birth, G.S.; McVey, G.R. Measuring the Color of Growing Turf with a Reflectance Spectrophotometer 1. Agron. J. 1968, 60, 640–643. [Google Scholar] [CrossRef]
  51. Vincini, M.; Frazzi, E.; D’Alessio, P. A Broad-Band Leaf Chlorophyll Vegetation Index at the Canopy Scale. Precis. Agric. 2008, 9, 303–319. [Google Scholar] [CrossRef]
  52. Nguy-Robertson, A.; Gitelson, A.; Peng, Y.; Viña, A.; Arkebauer, T.; Rundquist, D. Green Leaf Area Index Estimation in Maize and Soybean: Combining Vegetation Indices to Achieve Maximal Sensitivity. Agron. J. 2012, 104, 1336–1347. [Google Scholar] [CrossRef] [Green Version]
  53. Snee, R.D. Validation of Regression Models: Methods and Examples. Technometrics 1977, 19, 415–428. [Google Scholar] [CrossRef]
  54. Clevers, J.G.P.W.; Kooistra, L.; van den Brande, M.M.M. Using Sentinel-2 Data for Retrieving LAI and Leaf and Canopy Chlorophyll Content of a Potato Crop. Remote Sens. 2017, 9, 405. [Google Scholar] [CrossRef] [Green Version]
  55. Kang, Y.; Özdoğan, M.; Zipper, S.C.; Román, M.O.; Walker, J.; Hong, S.Y.; Marshall, M.; Magliulo, V.; Moreno, J.; Alonso, L.; et al. How Universal Is the Relationship between Remotely Sensed Vegetation Indices and Crop Leaf Area Index? A Global Assessment. Remote Sens. 2016, 8, 597. [Google Scholar] [CrossRef] [PubMed] [Green Version]
  56. Delegido, J.; Verrelst, J.; Rivera, J.P.; Ruiz-Verdú, A.; Moreno, J. Brown and Green LAI Mapping through Spectral Indices. ITC J. 2015, 35, 350–358. [Google Scholar] [CrossRef]
  57. Rinaldi, M.; Ruggieri, S.; Garofalo, P.; Vonella, A.V.; Satalino, G.; Soldo, P. Leaf Area Index Retrieval Using High Resolution Remote Sensing Data. Ital. J. Agron. 2010, 5, 155–166. [Google Scholar] [CrossRef]
  58. Papadavid, G. Mapping Potato Crop Height and Leaf Area Index through Vegetation Indices Using Remote Sensing in Cyprus. J. Appl. Remote Sens. 2011, 5, 53526. [Google Scholar] [CrossRef]
  59. Viña, A.; Gitelson, A.A.; Nguy-Robertson, A.L.; Peng, Y. Comparison of Different Vegetation Indices for the Remote Assessment of Green Leaf Area Index of Crops. Remote Sens. Environ. 2011, 115, 3468–3478. [Google Scholar] [CrossRef]
  60. Delegido, J.; Verrelst, J.; Meza, C.M.; Rivera, J.P.; Alonso, L.; Moreno, J. A Red-Edge Spectral Index for Remote Sensing Estimation of Green {LAI} over Agroecosystems. Eur. J. Agron. 2013, 46, 42–52. [Google Scholar] [CrossRef]
  61. Li, M.; Chu, R.; Yu, Q.; Islam, A.; Chou, S.; Shen, S. Evaluating Structural, Chlorophyll-Based and Photochemical Indices to Detect Summer Maize Responses to Continuous Water Stress. Water 2018, 10, 500. [Google Scholar] [CrossRef] [Green Version]
  62. Jacquemoud, S.; Verhoef, W.; Baret, F.; Bacour, C.; Zarco-Tejada, P.J.; Asner, G.P.; François, C.; Ustin, S.L. PROSPECT + SAIL Models: A Review of Use for Vegetation Characterization. Remote Sens. Environ. 2009, 113, S56–S66. [Google Scholar] [CrossRef]
  63. Feret, J.-B.; François, C.; Asner, G.P.; Gitelson, A.A.; Martin, R.E.; Bidel, L.P.R.; Ustin, S.L.; le Maire, G.; Jacquemoud, S. PROSPECT-4 and 5: Advances in the Leaf Optical Properties Model Separating Photosynthetic Pigments. Remote Sens. Environ. 2008, 112, 3030–3043. [Google Scholar] [CrossRef]
  64. Baret, F.; Hagolle, O.; Geiger, B.; Bicheron, P.; Miras, B.; Huc, M.; Berthelot, B.; Niño, F.; Weiss, M.; Samain, O.; et al. LAI, fAPAR and FCover CYCLOPES Global Products Derived from VEGETATION. Remote Sens. Environ. 2007, 110, 275–286. [Google Scholar] [CrossRef] [Green Version]
  65. Duveiller, G.; Weiss, M.; Baret, F.; Defourny, P. Retrieving Wheat Green Area Index during the Growing Season from Optical Time Series Measurements Based on Neural Network Radiative Transfer Inversion. Remote Sens. Environ. 2011, 115, 887–896. [Google Scholar] [CrossRef]
  66. Lehnert, L.W.; Meyer, H.; Obermeier, W.A.; Silva, B.; Regeling, B.; Bendix, J. Hyperspectral Data Analysis in R: The hsdar Package. J. Stat. Softw. 2019, 89, 1–23. [Google Scholar] [CrossRef] [Green Version]
  67. Squeri, C.; Gatti, M.; Garavani, A.; Vercesi, A.; Buzzi, M.; Croci, M.; Calegari, F.; Vincini, M.; Poni, S. Ground Truthing and Physiological Validation of Vis-NIR Spectral Indices for Early Diagnosis of Nitrogen Deficiency in Cv. Barbera (Vitis vinifera L.) Grapevines. Agronomy 2019, 9, 864. [Google Scholar] [CrossRef] [Green Version]
  68. Xie, Q.; Dash, J.; Huete, A.; Jiang, A.; Yin, G.; Ding, Y.; Peng, D.; Hall, C.C.; Brown, L.; Shi, Y.; et al. Retrieval of Crop Biophysical Parameters from Sentinel-2 Remote Sensing Imagery. Int. J. Appl. Earth Obs. Geoinf. 2019, 80, 187–195. [Google Scholar] [CrossRef]
  69. le Maire, G.; Marsden, C.; Nouvellon, Y.; Stape, J.-L.; Ponzoni, F. Calibration of a Species-Specific Spectral Vegetation Index for Leaf Area Index (LAI) Monitoring: Example with MODIS Reflectance Time-Series on Eucalyptus Plantations. Remote Sens. 2012, 4, 3766–3780. [Google Scholar] [CrossRef] [Green Version]
  70. le Maire, G.; François, C.; Soudani, K.; Berveiller, D.; Pontailler, J.Y.; Bréda, N.; Genet, H.; Davi, H.; Dufrêne, E.; Lemaire, G.; et al. Calibration and Validation of Hyperspectral Indices for the Estimation of Broadleaved Forest Leaf Chlorophyll Content, Leaf Mass per Area, Leaf Area Index and Leaf Canopy Biomass. Remote Sens. Environ. 2008, 112, 3846–3864. [Google Scholar] [CrossRef]
  71. Sehgal, V.K.; Chakraborty, D.; Sahoo, R.N. Inversion of Radiative Transfer Model for Retrieval of Wheat Biophysical Parameters from Broadband Reflectance Measurements. Inf. Process. Agric. 2016, 3, 107–118. [Google Scholar] [CrossRef] [Green Version]
  72. Kuhn, M.; Johnson, K. Applied Predictive Modeling, 1st ed.; Springer: New York, NY, USA, 2019. [Google Scholar]
  73. Gemmell, F.; Varjo, J.; Strandstrom, M.; Kuusk, A. Comparison of Measured Boreal Forest Characteristics with Estimates from TM Data and Limited Ancillary Information Using Reflectance Model Inversion. Remote Sens. Environ. 2002, 81, 365–377. [Google Scholar] [CrossRef]
  74. le Maire, G.; Marsden, C.; Verhoef, W.; Ponzoni, F.J.; lo Seen, D.; Bégué, A.; Stape, J.-L.; Nouvellon, Y. Leaf Area Index Estimation with MODIS Reflectance Time Series and Model Inversion during Full Rotations of Eucalyptus Plantations. Remote Sens. Environ. 2011, 115, 586–599. [Google Scholar] [CrossRef]
  75. Atzberger, C.; Guérif, M.; Baret, F.; Werner, W. Comparative Analysis of Three Chemometric Techniques for the Spectroradiometric Assessment of Canopy Chlorophyll Content in Winter Wheat. Comput. Electron. Agric. 2010, 73, 165–173. [Google Scholar] [CrossRef]
  76. Delegido, J.; Verrelst, J.; Alonso, L.; Moreno, J. Evaluation of Sentinel-2 Red-Edge Bands for Empirical Estimation of Green LAI and Chlorophyll Content. Sensors 2011, 11, 7063–7081. [Google Scholar] [CrossRef] [PubMed] [Green Version]
  77. Clevers, J.G.P.W.; Gitelson, A.A. Remote Estimation of Crop and Grass Chlorophyll and Nitrogen Content Using Red-Edge Bands on Sentinel-2 and -3. ITC J. 2013, 23, 344–351. [Google Scholar] [CrossRef]
  78. Cui, Z.; Kerekes, J.P. Potential of Red Edge Spectral Bands in Future Landsat Satellites on Agroecosystem Canopy Green Leaf Area Index Retrieval. Remote Sens. 2018, 10, 1458. [Google Scholar] [CrossRef]
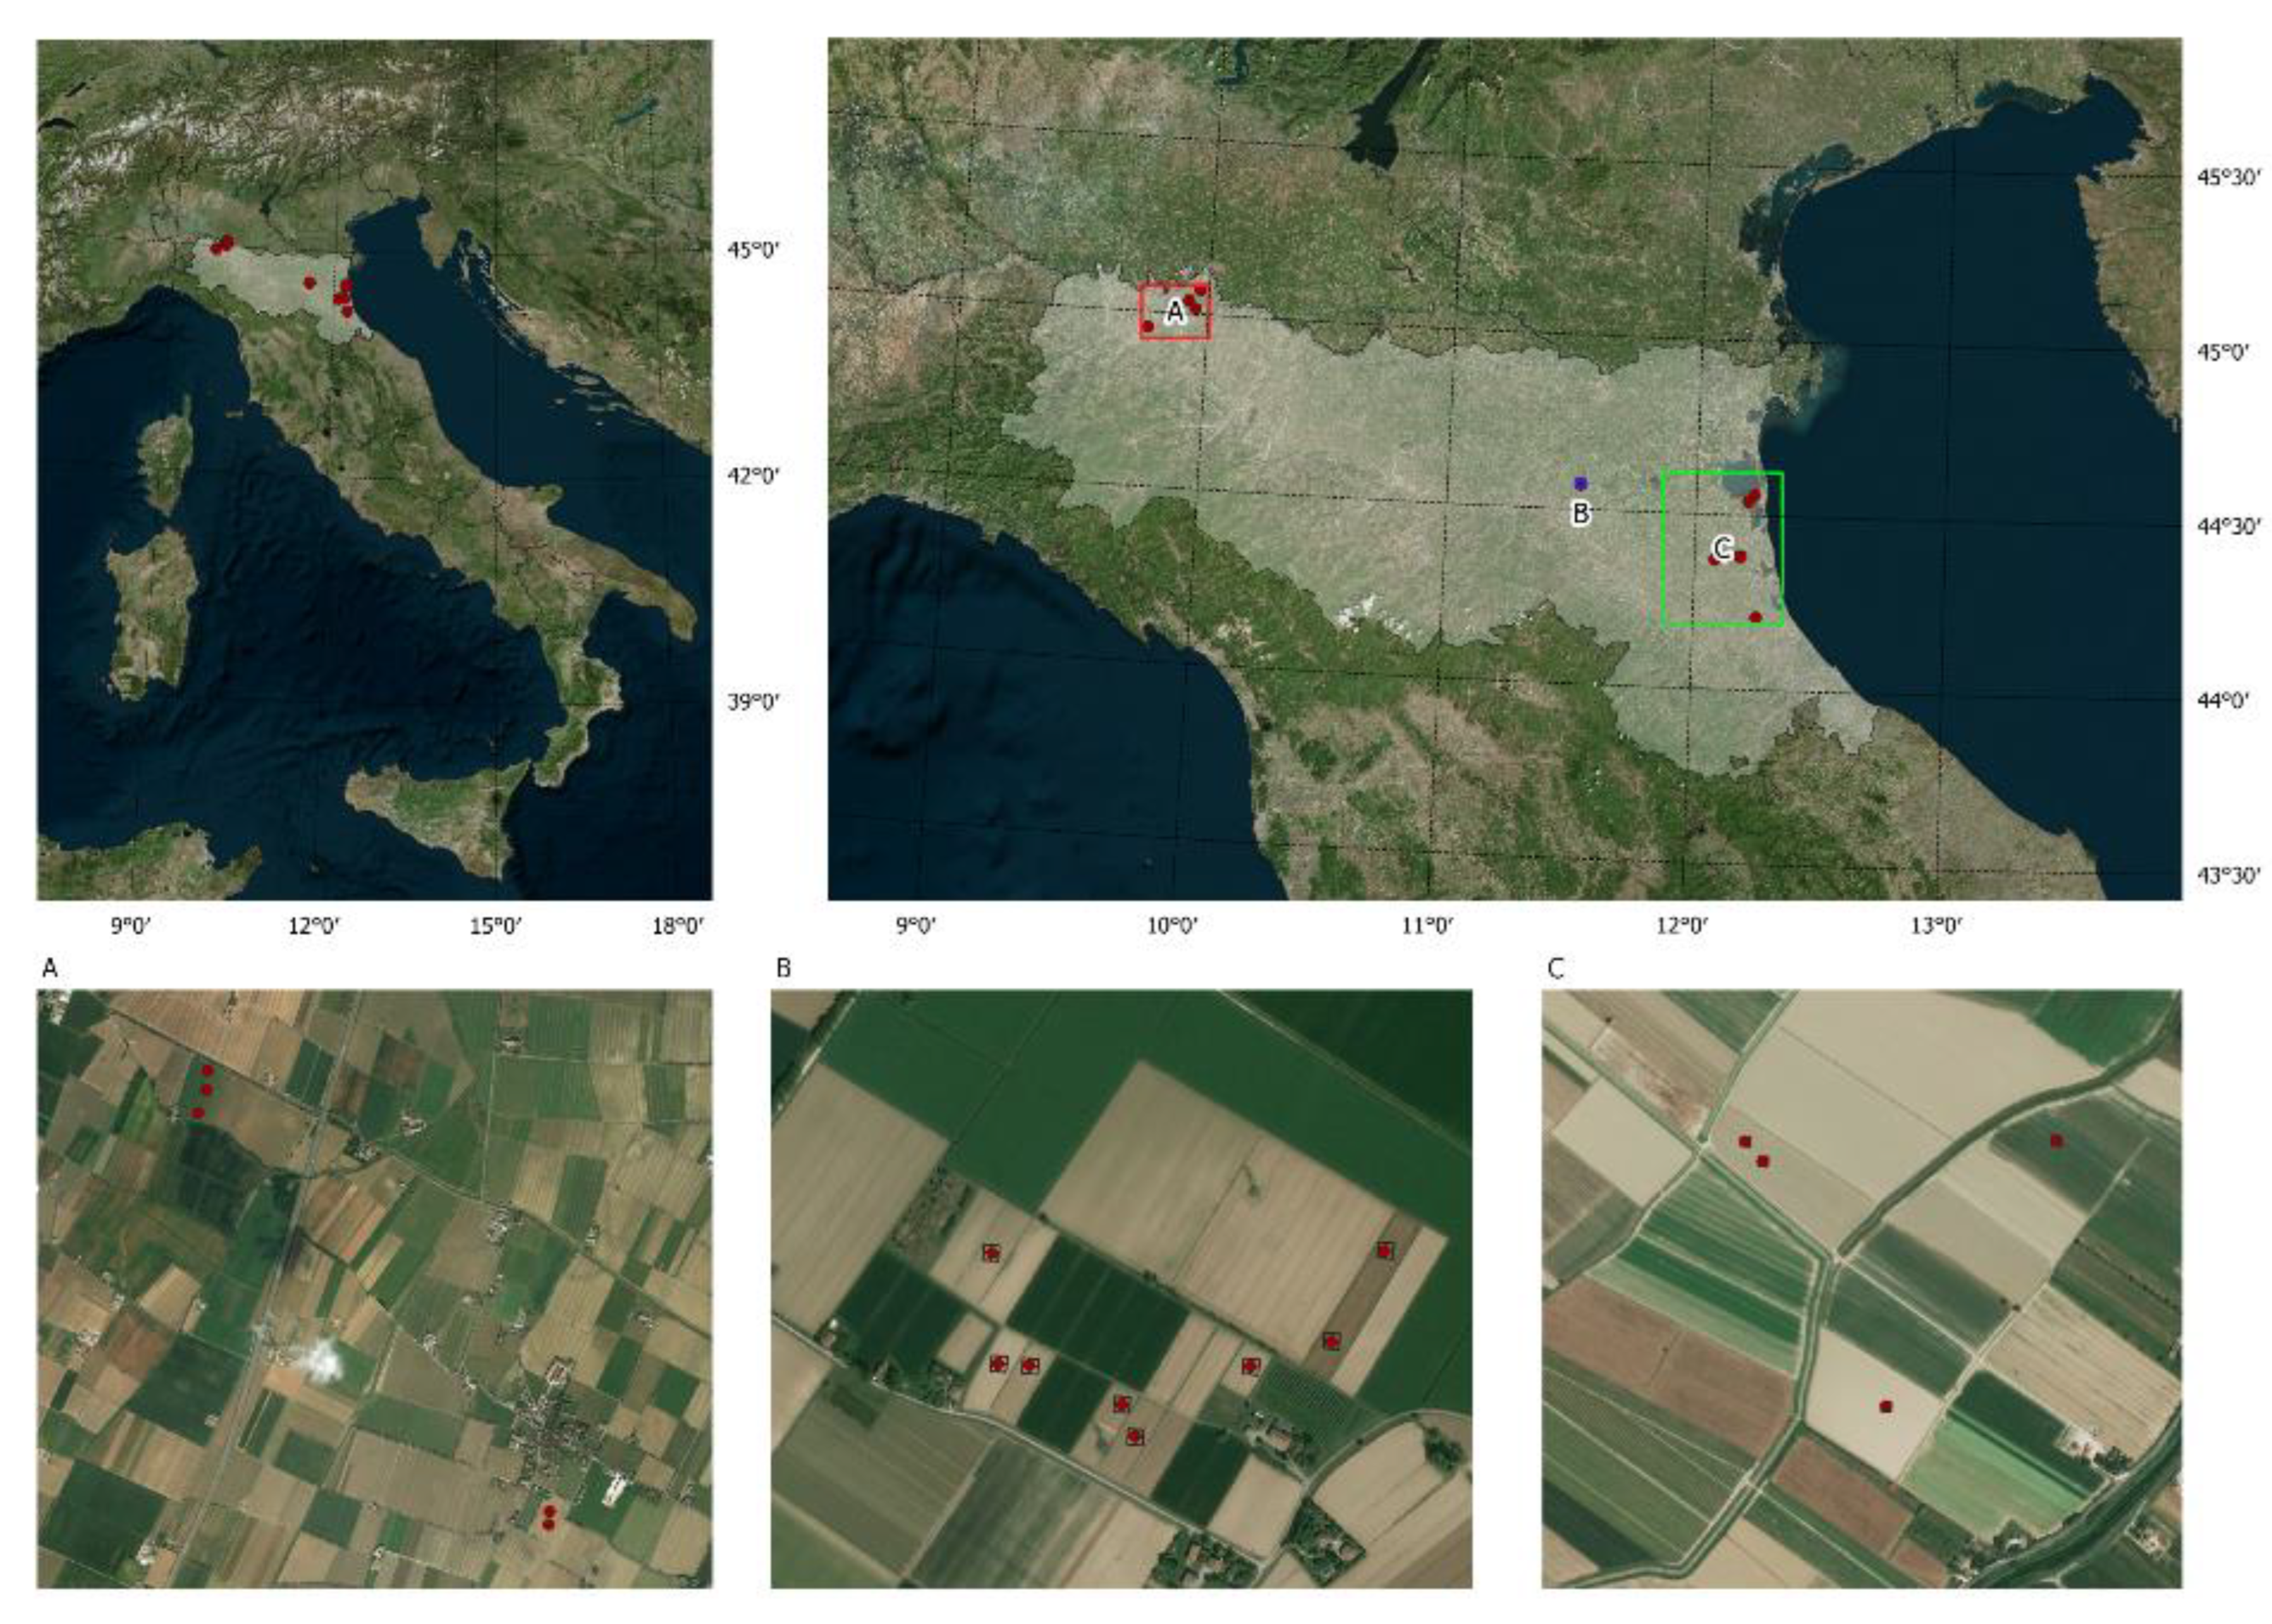
Figure 1. Study area. The study was carried out in an agricultural region located in the North of Italy: (A) Piacenza test site (B); Budrio test site; and (C) Ravenna test site. All the test sites are in the Emilia-Romagna region (grey shading in the top-right image).
Agronomy 12 02835 g001
Figure 2. Field measurement protocol for each Elementary Sampling Unit (ESU).
Agronomy 12 02835 g002
Figure 3. The general framework of the work: Step 1: field campaigns; Step 2: generating training datasets using PROSAIL; Step 3: model calibration (for the empirical model); Step 4: literature model searching, and Step 5: model accuracy assessment.
Agronomy 12 02835 g003
Figure 4. R2, RMSE and nRMSE (%) obtained between field measured and retrieved LAI from physical approaches (LUT, NNET, and PEphysical).
Agronomy 12 02835 g004
Figure 5. R2, RMSE and nRMSE (%) obtained between field measured and retrieved LAI from empirical, empirical literature models compared to PEphysical.
Agronomy 12 02835 g005
Figure 6. Retrieved versus measured LAI using the best statistical approaches and physical approaches (A) best empirical model: linear regression between LAI and SR; (B) best literature model: WDRVI3 (i.e., [52]); (C) Best PEphysical model: based on OSAVI-second-order polynomial fitting; (D) best RTM-inversion using PROSAIL: NNET.
Agronomy 12 02835 g006
Figure 7. R2, RMSE, and nRMSE (%) of the best model one for each LAI retrieval method according to different crops (Garlic, Maize, Onion, Potato, Spinach, and Tomato). Best empirical model: linear regression between LAI and SR; best RTM-inversion: NNET; best literature model: WDRVI3-based model provided by [52]; best PEphysical model: based on OSAVI-second-order polynomial fitting.
Agronomy 12 02835 g007
Table 1. Characteristics of the three datasets used in this study.
Test SiteCrop TypesYearN° ESUsN° LAIN° ImagesImage Acquisition DatesField Measurement Dates
AGarlic (Allium sativum L.)202173072021 (19 March,
23 April, 3 May, 28 May, 17 June, 25 June, 7 July)
2021 (22 March, 19 April, 5 May, 28 May, 17 June, 25 June, 7 July)
Tomato (Solanum lycopersicum L.)36
BTomato (Solanum lycopersicum L.)20192642019 (24 May, 18 June, 8 July, 23 July)2019 (24 May, 18 June, 8 July, 23 July)
Potato (Solanum tuberosum L.)24
Maize (Zea mays L.)28
Onion (Allium cepa L.)28
Tomato (Solanum lycopersicum L.)20202642020 (28 May, 22 June, 22 July, 11 August)2020 (28 May, 22 June, 22 July, 11 August)
Potato (Solanum tuberosum L.)24
Maize (Zea mays L.)28
Onion (Allium cepa L.)26
CSpinach (Spinacia oleracea L.)20206822020 (10 October, 22 October)2020 (9 October, 19 October)
202181242021 (20 April, 3 May, 10 May, 18 May)2021 (20 April, 4 May, 10 May, 18 May)
Table 2. List of the vegetation indices evaluated for the retrieval of Leaf Area Index. Sentinel-2 bands used are the blue (B2), green (B3), red (B4), red-edge 1 (B5), red-edge 3 (B7), NIR (B8), and SWIR (B11).
VIsEquationReference
CIgreen B 8 B 3 1 [39]
CIre B 8 B 5 1 [39]
EVI 2.5 ( ( B 8 B 4 ) 1 + B 8 + 6 B 4 7.5 B 2 ) [40]
EVI2 2.4 ( B 8 B 4 1 + B 8 + B 4 ) [41]
GNDVI ( B 8 B 3 ) ( B 8 + B 3 ) [42]
greenWDRVI ( 0.1 B 8 B 3 ) ( 0.1 B 8 + B 3 ) + ( 1 0.1 ) ( 1 + 0.1 ) [43]
MSAVI ( 2 B 8 + 1 ( 2 B 8 + 1 ) 2 ( 8 ( B 8 B 4 ) ) 2 [44]
MTVI2 1.5 ( ( 1.2 ( B 8 B 3 ) 2.5 ( B 4 B 3 ) ) ( ( 2 B 8 + 1 ) 2 ( ( 6 B 8 5 B 4 0.5 ) ) ) ) [18]
NDRE ( B 8 B 5 ) ( B 8 + B 5 ) [42]
NDVI ( B 8 B 4 ) ( B 8 + B 4 ) [45]
NDWI ( B 8 B 11 ) ( B 8 + B 11 ) [46]
OSAVI ( 1 + 0.16 ) ( B 8 B 4 ) ( B 8 + B 4 + 0.16 ) [47]
RDVI ( B 8 B 4 ) ( B 8 + B 4 ) 0.5 [48]
rededgeWDRVI ( 0.1 B 8 B 5 ) ( 0.1 B 8 + B 5 ) + ( 1 0.1 ) ( 1 + 0.1 ) [43]
RI ( B 4 B 3 ) ( B 4 + B 3 ) [49]
SR B 8 B 4 [50]
TRBI ( B 3 + B 4 ) B 8 [51]
WDRVI3 ( 0.2 B 8 B 4 ) ( 0.2 B 8 + B 4 ) + ( 1 0.2 ) ( 1 + 0.2 ) [52]
NDGI43 ( B 7 B 4 ) ( B 7 + B 4 ) [49]
TVI 0.5 ( 120 ( B 6 B 3 ) 200 ( B 4 B 3 ) ) [48]
VARIrededge ( B 5 B 4 ) ( B 5 + B 4 ) [39]
Table 3. Ranges of input parameters for the PROSAIL model.
ParameterAbbreviationUnitDistributionMin ValueMax ValueStep
Leaf parameters
Leaf structure parameterN--1.5
Dry matter contentCmg cm−2Uniform0.0010.020.005
Relative water contentCwREL%Uniform70905
Leaf chlorophyll contentCabµg cm−2Uniform408010
Canopy parameters
Leaf Area IndexLAIm2 m−2Uniform070.25
Average leaf inclination angleALIADegUniform407010
Hot spot parameterhotm m−1-0.5
Sun zenith angleSZA/θsdegAccording to actual conditions during data/image acquisition
Observer zenith angleOZA/θvdeg
Relative azimuth anglerAA/øSVdeg
Soil parameter
Soil brightnessScale--0.51.50.5
Publisher’s Note: MDPI stays neutral with regard to jurisdictional claims in published maps and institutional affiliations.