Article

Effect of Tillage and Sowing Technologies Nexus on Winter Wheat Production in Terms of Yield, Energy, and Environment Impact

by
Lina Saldukaitė-Sribikė
1,*,
Egidijus Šarauskis
1,
Sidona Buragienė
1,
Aida Adamavičienė
2,
Rimantas Velička
2,
Zita Kriaučiūnienė
2 and
Dainius Savickas
1
1
Department of Agricultural Engineering and Safety, Vytautas Magnus University, 46299 Kaunas, Lithuania
2
Institute of Agroecosystems and Soil Science, Agriculture Academy, Vytautas Magnus University, 44248 Kaunas, Lithuania
*
Author to whom correspondence should be addressed.
Agronomy 2022, 12(11), 2713; https://doi.org/10.3390/agronomy12112713
Submission received: 6 October 2022 / Revised: 23 October 2022 / Accepted: 26 October 2022 / Published: 1 November 2022
(This article belongs to the Special Issue Agricultural Automation and Innovative Agricultural Systems)

Abstract

:
Crop production is considered one of the most important agricultural areas in the world, supplying humanity with raw food materials. However, intensive farming very often has a detrimental effect on the environment. The aim of this study was to investigate and assess the efficiency of strip tillage and a sowing machine as well as a direct sowing machine in differently prepared soils in terms of yield, energy, and environmental impact. The experiments were performed with winter wheat (Triticum aestivum L.) grown using three different tillage techniques and two sowing machines. The results show that the inputs of diesel fuel, energy, and time are directly affected by the number and complexity of technological operations throughout the production chain. The highest inputs of diesel fuel, working time, and energy consumption were needed using conventional tillage technology with strip tillage and a sowing machine (CT–STS), amounting to 130.2 l ha−1, 6.65 h ha−1, and 18,349 MJ ha−1, respectively. The best yields were obtained using no tillage–direct sowing technology (NT–DS), where were reached 7.54 t ha−1. The lowest environmental impact was achieved in the winter wheat production system using NT–DS, where the CO2 emissions were as high as 15%, lower than those under conventional tillage–direct sowing (CT–DS) and CT–STS. The costs of winter wheat production can be reduced by up to 23.6%. The main conclusion regarding the use of strip tillage and sowing and direct sowing machines in traditional tillage technology is that energy and environmental indicators have deteriorated compared to no tillage, but no significant difference in winter wheat yields has been identified.

1. Introduction

Consumers in developed countries not only demand food of the highest safety and quality, but there is a growing focus on minimizing the negative impact on the environment from the “field to table” production–supply chain [1]. The most important goal of agriculture was and continues to be sustainable food security. According to Martin et al. [2], land use needs to be developed in the context of a wide range of food security and environmental sustainability issues, including the ever-growing world population, production demand, climate change affected by temperature and humidity changes, greenhouse gases (GHG) emissions to the environment (GHG—gases that trap heat in the atmosphere), and soil quality. GHG usually indicates according to CO2 equivalents. Global temperatures are projected to rise by a further 2–4 °C by the end of the 21st century [3]. When assessing the impact on the environment, GHG emissions are considered to be the most dangerous for the environment and the economy [4].
By 2050, the world’s population is projected to grow significantly, resulting in a sizeable increase in demand for food production [4]. The growing population and dwindling land resources and other resources are imposing pressure to meet growing food production needs. Traditional agriculture is facing an increasing demand for crop products, high-energy consumption, and declining income due to high production costs [5]. In this context, sustainable crop production technologies are needed, as traditional agriculture is unable to meet these challenges [6]. Rice, wheat, and corn are major components of the human diet [7]. Climatic factors, temperature, precipitation, and CO2 vary due to environmental conditions and are major components influencing plant fertility [8]. Wheat (Triticum aestivum L. and Triticum durum L.) is the second most important food crop and can be grown in most regions of the world. In 2017, 771 million tons of wheat were grown on 218 million hectares of arable land, and in 2019, the winter wheat harvest was 768.5 million metric tons worldwide [9]. According to 2017 data, the EU was the largest wheat producer in the world [9]. Meanwhile, in Lithuania, 6380 thousand metric tons of wheat were grown in 2020 [10].
Tillage and sowing technological operations are the main energy-intensive sources in crop production [11] and also have a very important impact on GHG emissions [12]. Tillage stimulates aerobic soil respiration and can result in the loss of about 50% of organic carbon [13]. Sustainable tillage has primarily been developed as an alternative to traditional tillage to reduce soil erosion and the associated soil deterioration of soil, water, and air quality [14]. Sustainable tillage and sowing technologies also reduce costs such as the diesel, working time and energy required for different technological operations, as well as reducing GHG emissions to the environment [15]. Another advantage of sustainable tillage and sowing technologies is that they promote soil conservation [16] and are necessary to avoid the loss of soil fertility while taking measures to increase crop yields [17].
The most widely used tillage technology in the world, and especially in Europe, is conventional tillage, but the principles of sustainable farming, which include reduced or minimal tillage and no tillage technology, are increasingly being used to reduce the environmental impact of agriculture and reduce energy consumption [18]. Technological operations such as ploughing and deep tillage are known to consume a lot of energy and diesel fuel [19]. In many cases, conventional tillage using deep ploughing technology consumes between 29% and 59% of the total amount of diesel fuel required for the technology [17] while creating very high GHG emissions [19]. Tillage is one of the technological operations that consume 55 to 65% of direct energy [17]. Reducing the number of tillage operations has the potential to reduce production inputs and production costs [20].
Recently, the growing use of sustainable tillage and sowing technologies on farms raises the question of whether to switch to sustainable farming, abandoning traditional deep tillage altogether, or even to use mixed tillage, with only a few years of deep tillage. In the latter case, it is necessary to have all the equipment needed for different technologies. The question, therefore, arises as to whether the use of sustainable strip till and direct sowing machines in cultivated soils will not reduce the yields of winter wheat production. This is a new approach in terms of the prospects for modernizing the farm machinery fleet.
The main reason for the application of these technologies is the fact that many farmers are increasingly using non-ploughing tillage technologies on their farms. According to the data provided by the Ministry of Agriculture of the Republic of Lithuania, in 2021, these technologies were applied in 25–30% of the total cultivated land area in Lithuania, while, in 2010, they accounted for only 10–15% [21] The reasons forcing farmers to return to deep tillage with ploughs or deep cultivators may include the risk of pest and disease spreading, as well as soil compaction problems. So far, there is no research and no clear analysis of whether, under conventional tillage, strip tillage and direct sowing machines can be used and are recommended to be used for ploughed soils, or whether such mixed technological operations have the potential to achieve good crop productivity results. The aim of this study was to investigate and assess the efficiency of the use of strip tillage and a sowing machine as well as a direct sowing machine in soils cultivated at different intensities in terms of winter wheat yield, fuel, energy inputs, working time, and environmental impact.

2. Materials and Methods

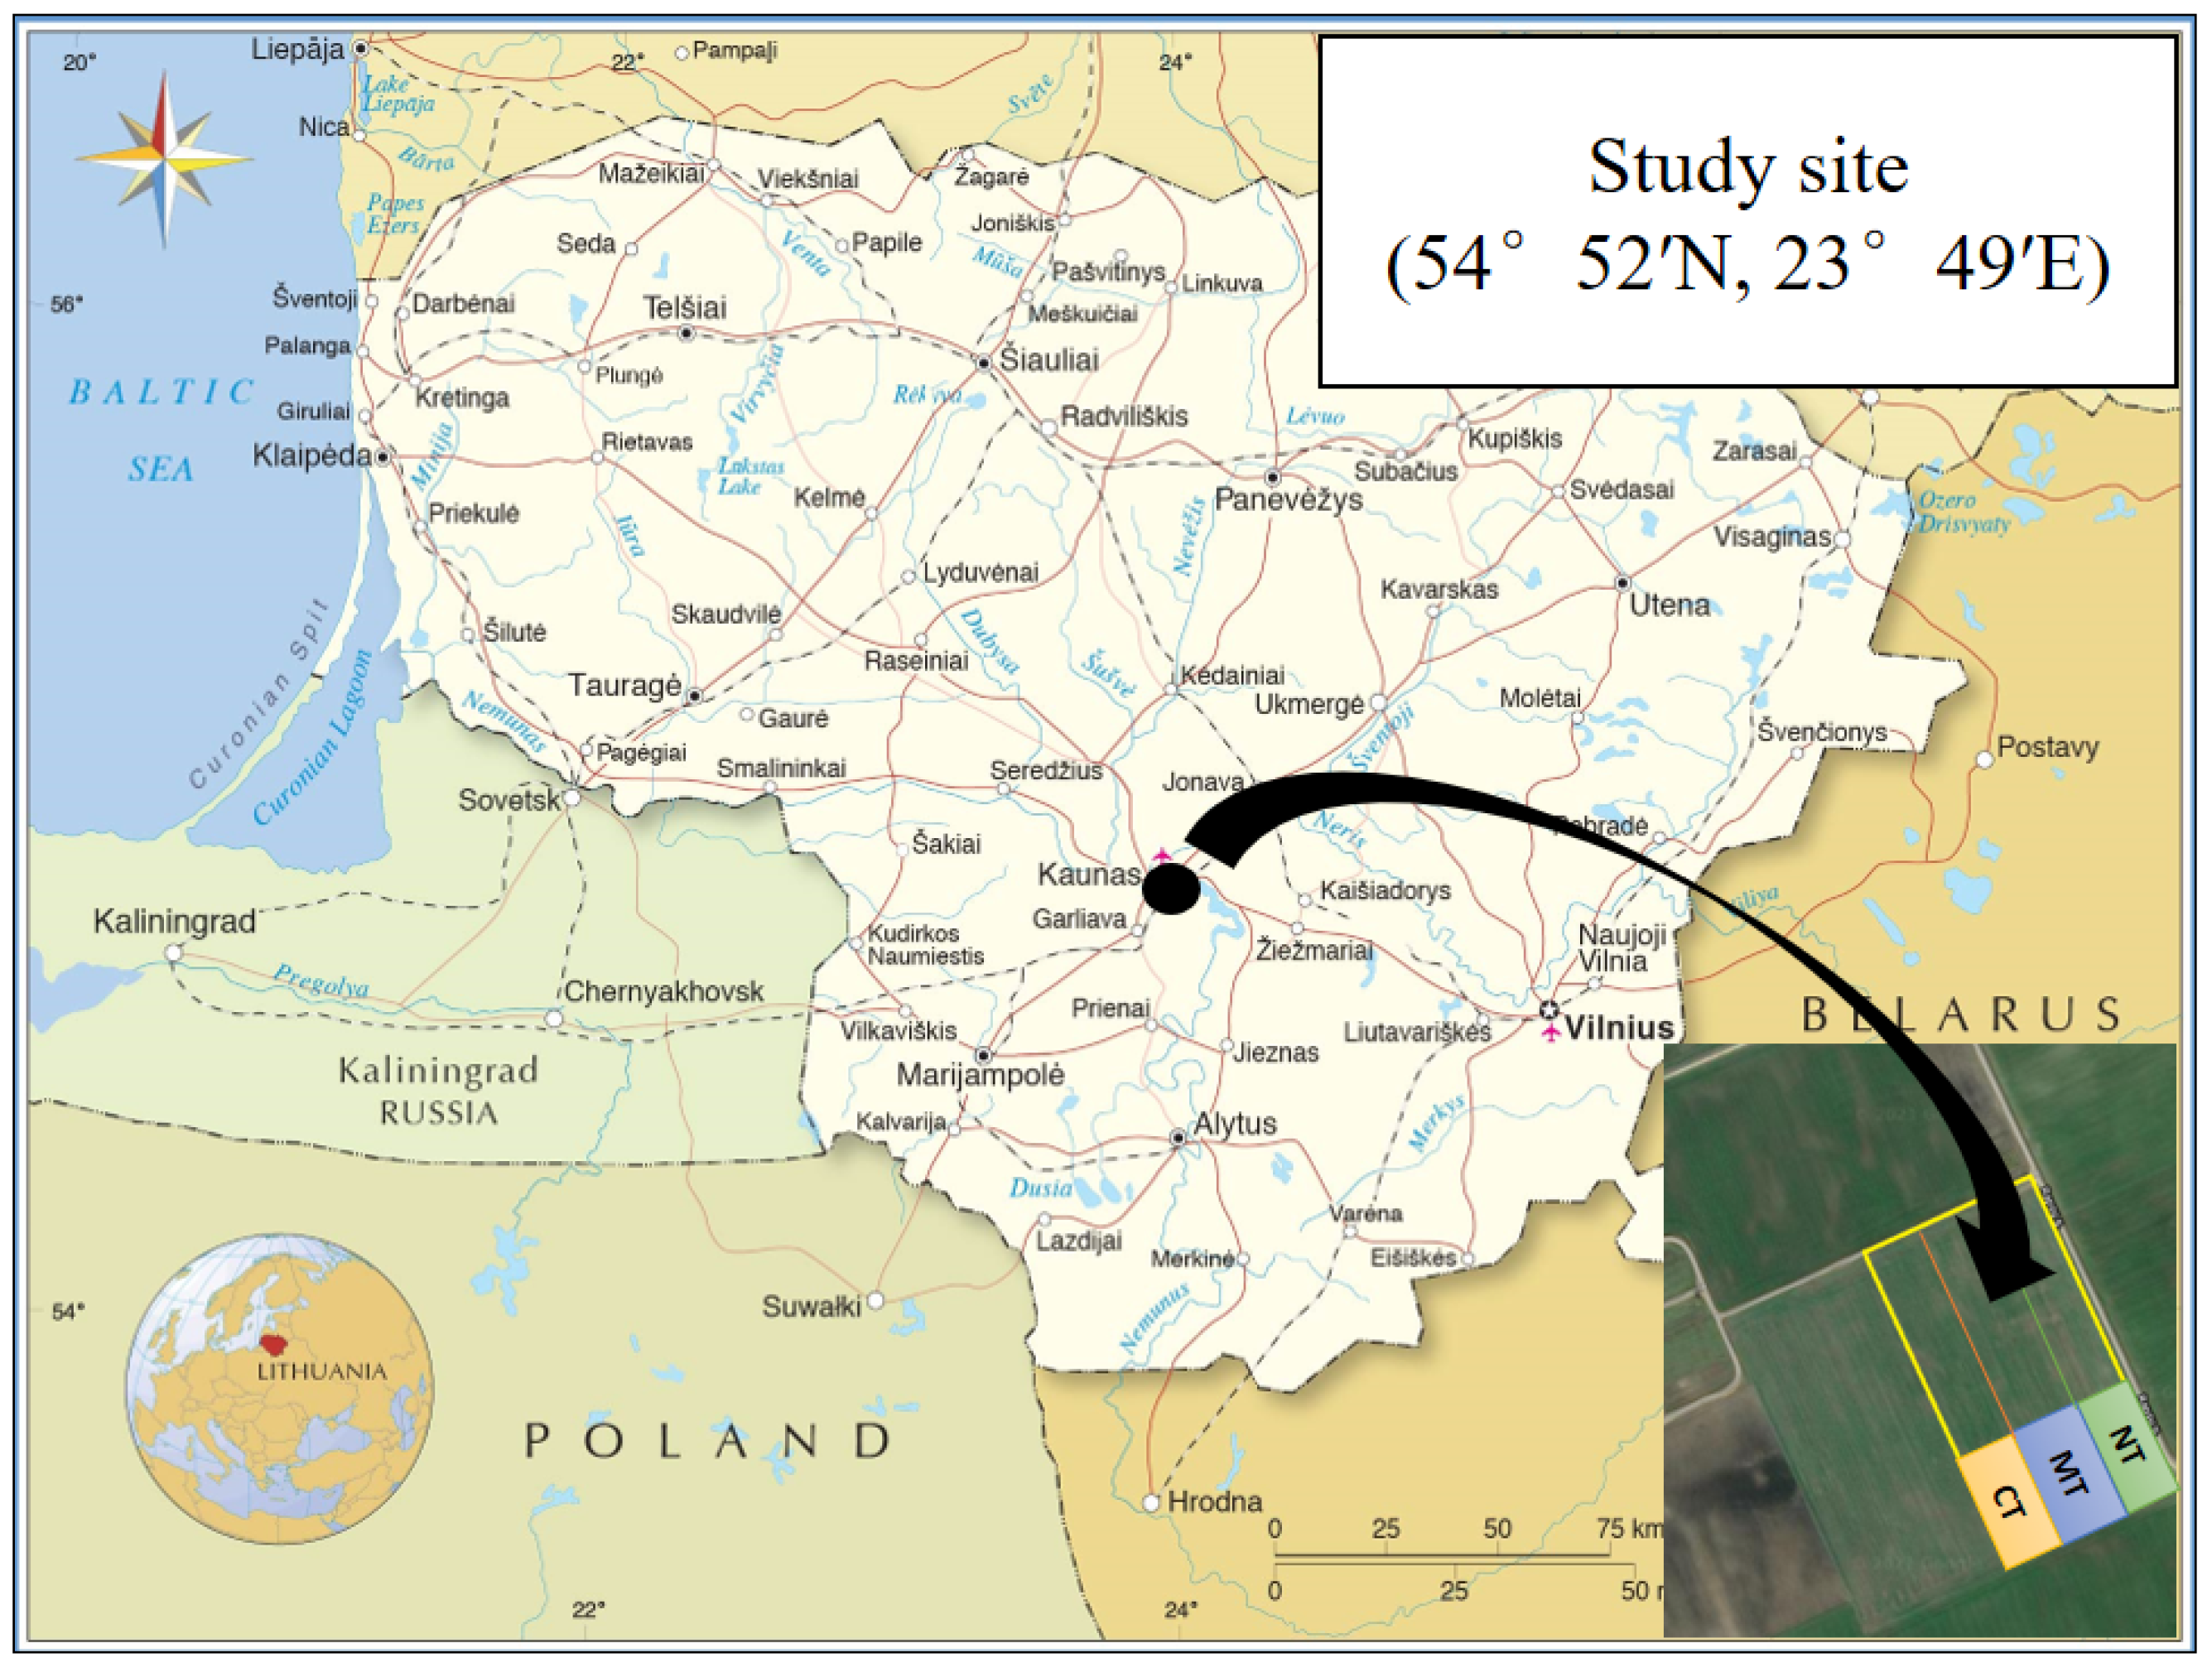
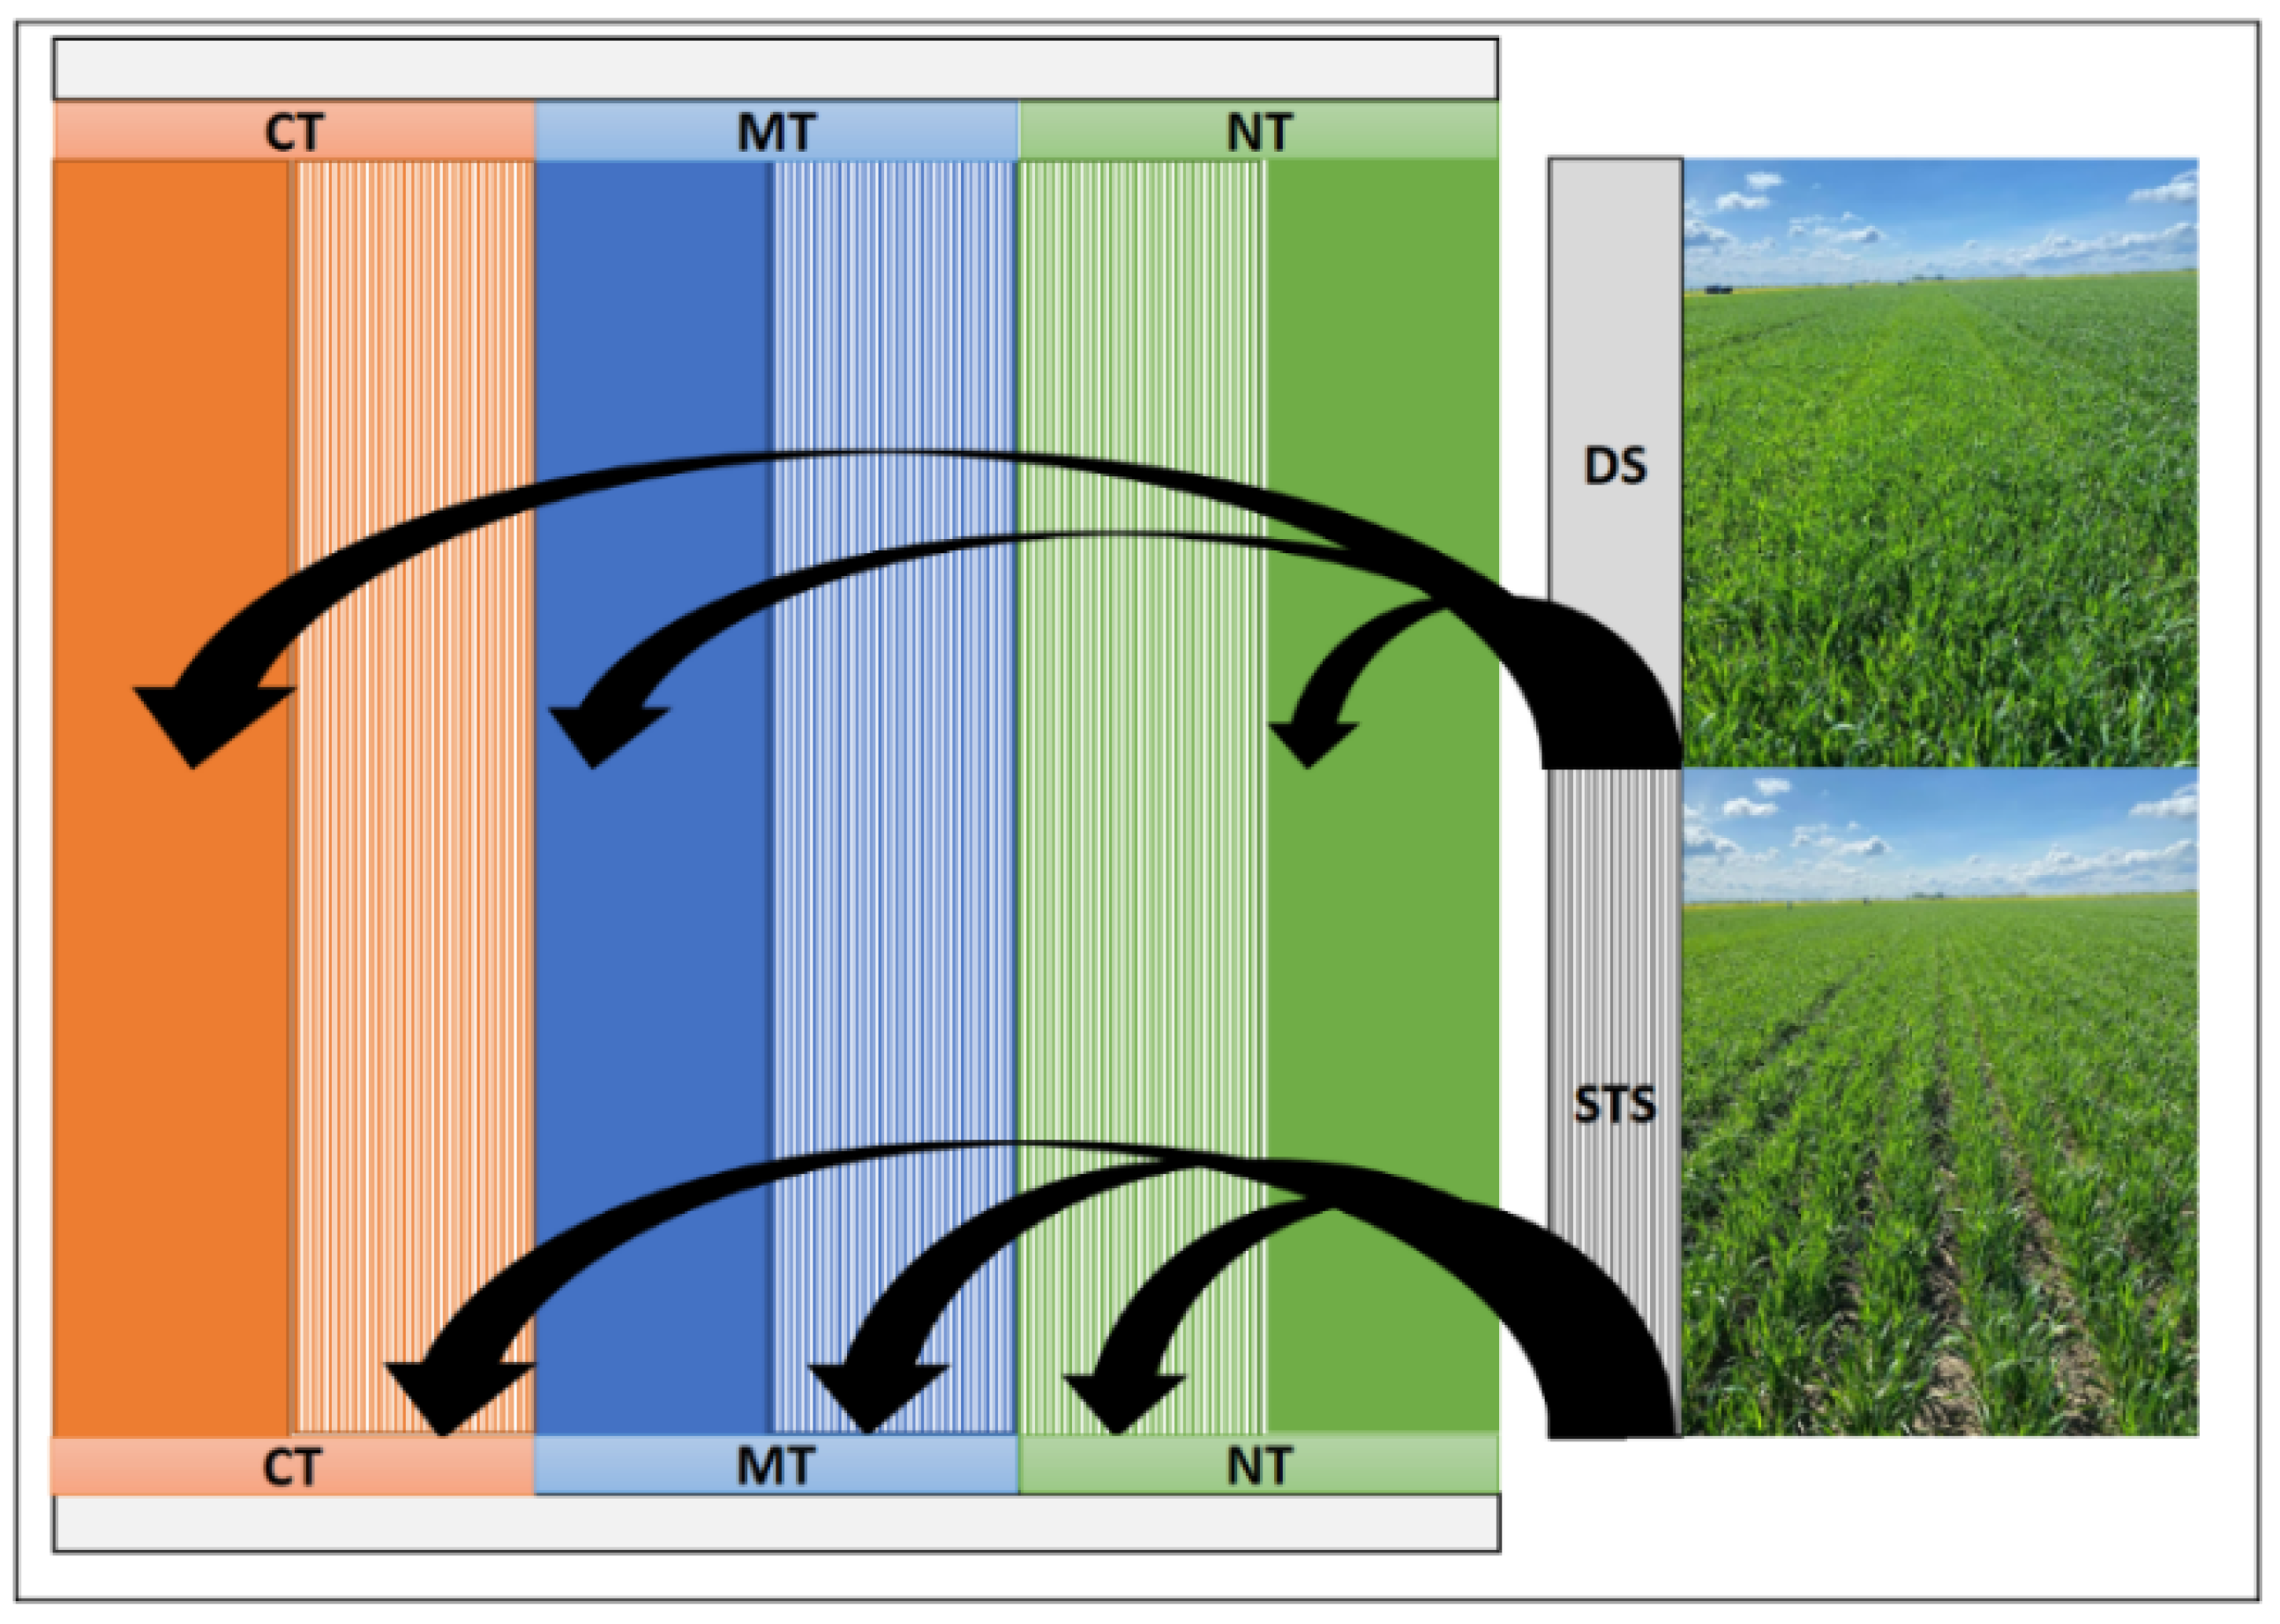
2.1. Study Site and Experimental Design

Experimental research was carried out at the Test Station of Vytautas Magnus University Agriculture Academy (54°52′ N, 23°49′ E) in 2019–2020 (Figure 1). Lithuania has a moderately cold climate. During the period of experimental research, the average annual precipitation was 600 mm, and the average annual temperature was 9 °C.
A complex tillage and sowing field experiment was performed using three tillage technologies and two types of sowing machines. The field area of the experimental research was 0.960 ha and was divided into three equal plots of 0.320 ha. Three tillage technologies have been used in these areas: traditional tillage (CT), minimal tillage with shallow cultivation (MT), and no tillage (NT). Using the split-plot method, each tillage area was divided into two additional 0.160 ha plots, in which two different sowing machines were used: direct sowing (DS) and strip tillage and sowing (STS). In total, six different tillage and sowing technologies were applied in the field experimental studies, the scheme of which is shown in Figure 2.
The research was carried out in the cultivation of winter wheat (Triticum aestivum L.), of which the pre-crop was winter rapeseed. The accounting area of each of the six fields was 240 m2 (40 m × 6 m). All mechanized technological operations of crop care and harvesting were identical in all variants during the experiment (Table 1). Six different research options are presented here. Technological operations, which were applied to each variant of the study, are visible horizontally. First, soil preparation was carried out, followed by sowing (direct or strip sowing and sowing rate), spraying, and fertilization. Common to all technologies was the harvesting and transportation of the crop. Winter wheat was sown on 15 September at a sowing rate of 180 kg ha−1. Strip tillage Mzuri Pro-till 4T (made in the United Kingdom) and direct sowing Väderstad Rapid 300 C (made in Sweden) machines were used for sowing. Winter wheat was harvested on 26 July.

2.2. Energy Assessment Indicators

All inputs and outputs of agricultural products can be expressed in terms of energy. An analysis of energy consumption and production is used to determine the energy use efficiency of crops and, accordingly, the potential impact on the environment. Such an analysis is important for the development of crop production technologies and the development of more efficient and environmentally friendly crop production systems [22]. The inputs consisted of agricultural machinery, fertilizers, pesticides, seeds, diesel fuel, and human labor, and the outputs consisted of the winter wheat yield determined during the experiment. The energy outputs were calculated with the winter wheat grain yield (kg ha−1) and the energy equivalent (MJ kg−1) [23,24]. The energy efficiency ratio (EER) was calculated as a ratio of energy outputs (MJ ha−1) to energy inputs (MJ ha−1) [25]. For calculation of the specific energy (MJ kg−1), energy inputs (MJ ha−1) were divided by winter wheat grain yield (kg ha−1) [24]. Energy productivity (kg MJ−1) was determined by dividing winter wheat yield (kg ha−1) by energy inputs (MJ ha−1). NET energy (MJ ha−1) was calculated as a difference between energy outputs (MJ ha−1) and energy inputs (MJ ha−1) [24].
All major inputs and outputs in winter wheat production were assessed during the energy assessment. The energy use efficiency of production was determined by the ratio of energy inputs and outputs. Values of 357.2 and 39.6 MJ kg−1 were used to estimate the energy of agriculture machinery and diesel fuel, respectively, and the values used for other inputs are presented in Table 2. The energy use efficiency of the agricultural system was assessed in terms of the ratio of energy to production costs. Based on energy equivalents (Table 2), the following were calculated: energy use efficiency, energy productivity, specific energy, NET energy, and energy intensity.
The main technological indicators of agricultural machinery and the operations performed with them are presented in Table 3. According to the data of the Lithuanian Institute of Agrarian Economics [21], the table below shows the indicators of machine power, working width, field capacity, working time, and diesel fuel inputs, which were used to calculate the energy inputs required for winter wheat cultivation. All parameters are focused on the farm with an area of 100 ha of arable land because, based on the previous data analysis, it was found that it is at this size that farms tend to abandon traditional farming technologies and adopt more sustainable tillage and sowing technologies [31].

2.3. Environmental Impact Assessment

Carbon dioxide, which is considered to be the initiator of global climate change, is an important compound influencing the processes of global warming [32]. The fossil fuels used in tillage, sowing, and plant care technologies are a major contributor to CO2 emissions [33]. Koga et al. [34] have found that the usage of tractors accounts for as much as 45% of the total CO2 emissions from the technological operations of wheat cultivation. GHG emissions that formed during the experimental studies of winter wheat in different tillage and sowing technologies were calculated by estimating the amounts of diesel fuel, fertilizers, pesticides, and other substances used in the winter wheat production technology and the carbon dioxide equivalents used by other researchers (Table 4). In this way, the environmental impact of a particular tillage and sowing technology has been assessed.

2.4. Statistical Analysis

To obtain accurate results, four iterations were performed during the field experimental studies, and the energy use efficiency, specific energy, and NET energy were analyzed. The data collected in the experimental studies were statistically processed by one–way analysis of variance (ANOVA) using ANOVA software from the statistical analysis package SELEKCIJA’1 [43]. The significant differences in the obtained data were estimated by calculating the least significant difference LSD0.05, with a 95% level of confidence (p < 0.05).

3. Results

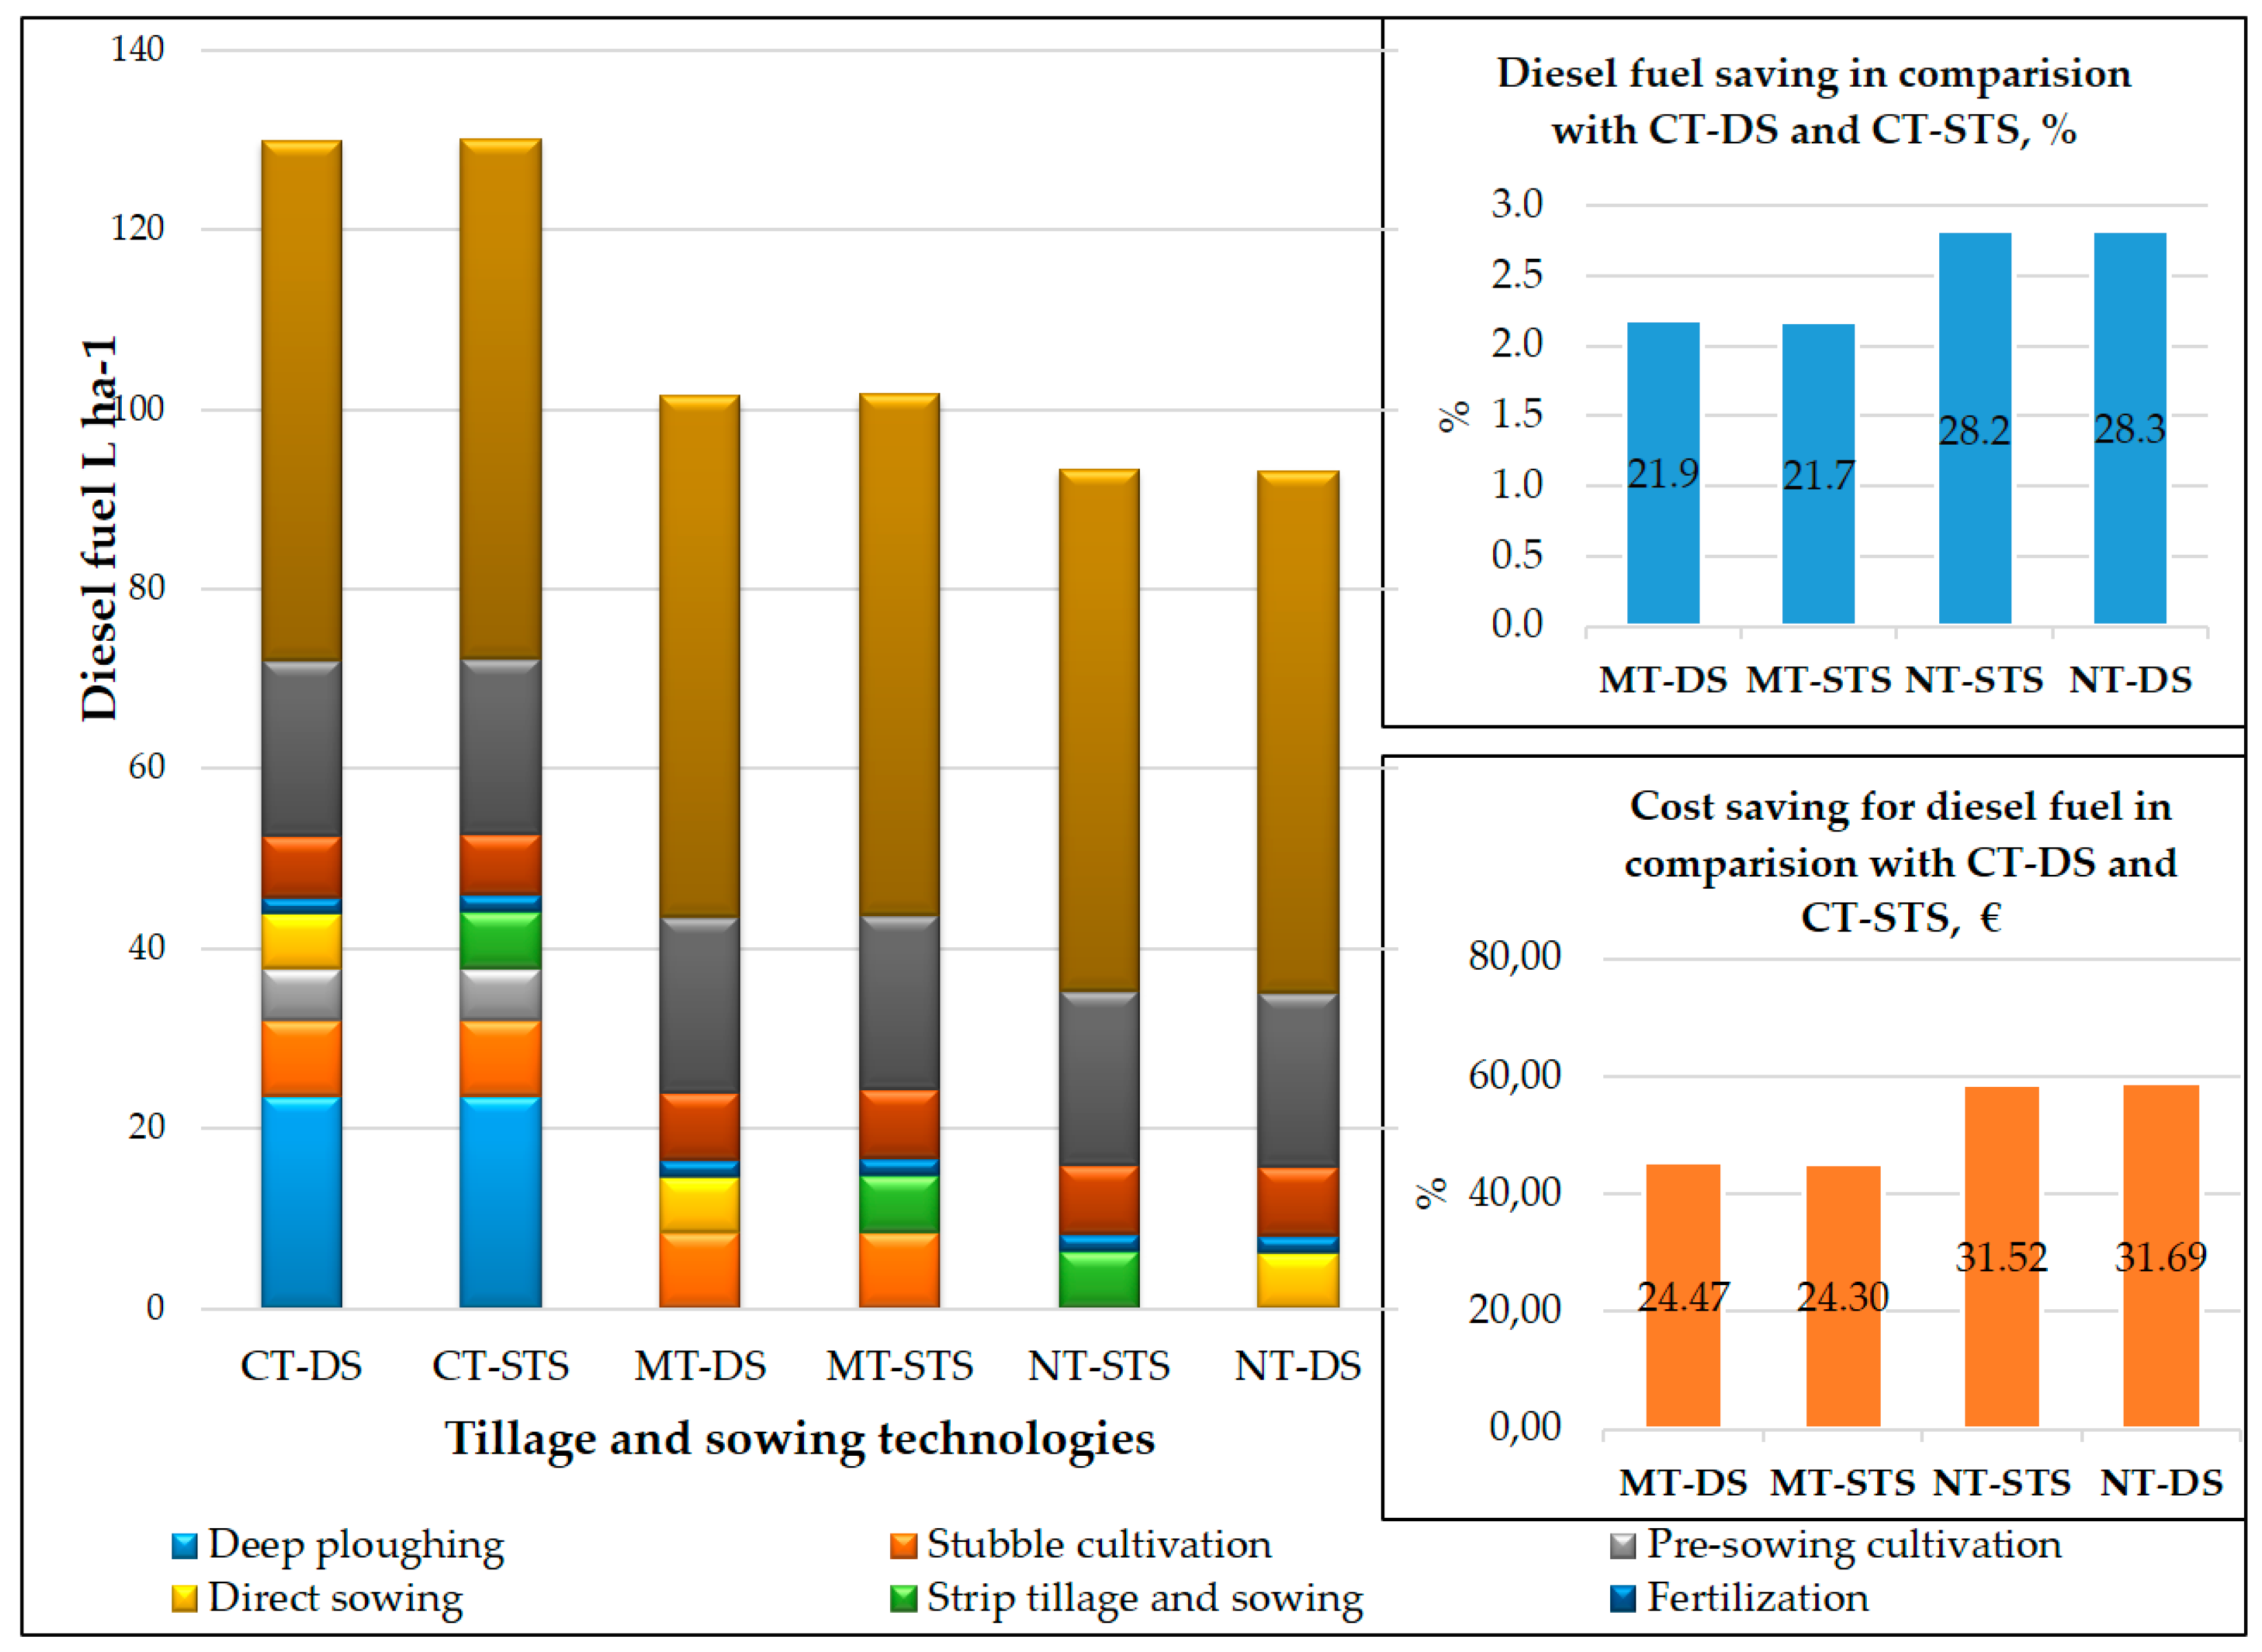
3.1. Fuel Consumption of Tillage and Sowing Technologies

According to Gong, Guan, Montanha et al. [44,45,46], diesel fuel for agricultural tractors and machinery is one of the largest inputs required for agricultural production. After analyzing the fuel inputs (Figure 3) required for winter wheat cultivation, it was found that traditional tillage and sowing requires 130 l ha−1 of diesel fuel for the entire winter wheat cultivation technology, while MT—101 l ha−1 and NT—93 l ha−1. The highest amount of fuel is required by traditional tillage and sowing technologies, which apply deep tillage (cultivation requires as much as 23.6 l ha−1 of diesel fuel). Only stubble cultivation is performed in MT technology (requiring 8.4 l ha−1 of diesel fuel), while in NT technology, we are not carrying out basic tillage and preparation for sowing. In this case, NT technology, regardless of the sowing method, can save up to 28.3% of diesel fuel (about 36.7–36.9 l ha−1).
Martins et al. [47] state that the highest hourly consumption of diesel fuel was determined using conventional tillage. Our study analyzed how much fuel can be saved by applying MT and NT technologies and how much more expensive CT technology is when accepting the average price of diesel fuel for farmers in Lithuania (10 October 2021, according to the data of diesel fuel suppliers for farmers). Calculations have shown that the application of MT technology would save about EUR 24.5 ha−1, and NT technology would save up to EUR 31.5 ha−1.

3.2. Working Time of Tillage and Sowing Technologies

Not only do different tillage technologies require different amounts of diesel fuel, but they also have different labor costs. An analysis of all variants (Figure 4) showed that the highest amount of working time in hours is needed in CT technology, which is distinguished by the number of technological operations performed. CT requires 6.63 h of working time to grow an average of 1 ha of winter wheat, while NT technology requires 5.08 h of working time.
By analyzing the losses caused by the use of the most fuel-intensive technology—CT—and the amount of time and money that can be saved by using MT and NT technologies, the average salary in Lithuania was estimated (it was equal to EUR 6.21 (USD 6.04) per working hour on 10 October 2021). MT and NT can save up to 1.23 and 1.57 h ha−1 in winter wheat production technology, respectively. The monetary assessment of the labor costs showed that the application of sustainable technologies saves EUR 9.76 (USD 9.50) (when applying NT technology) and EUR 7.65 (7.44 USD) (when applying MT technology).

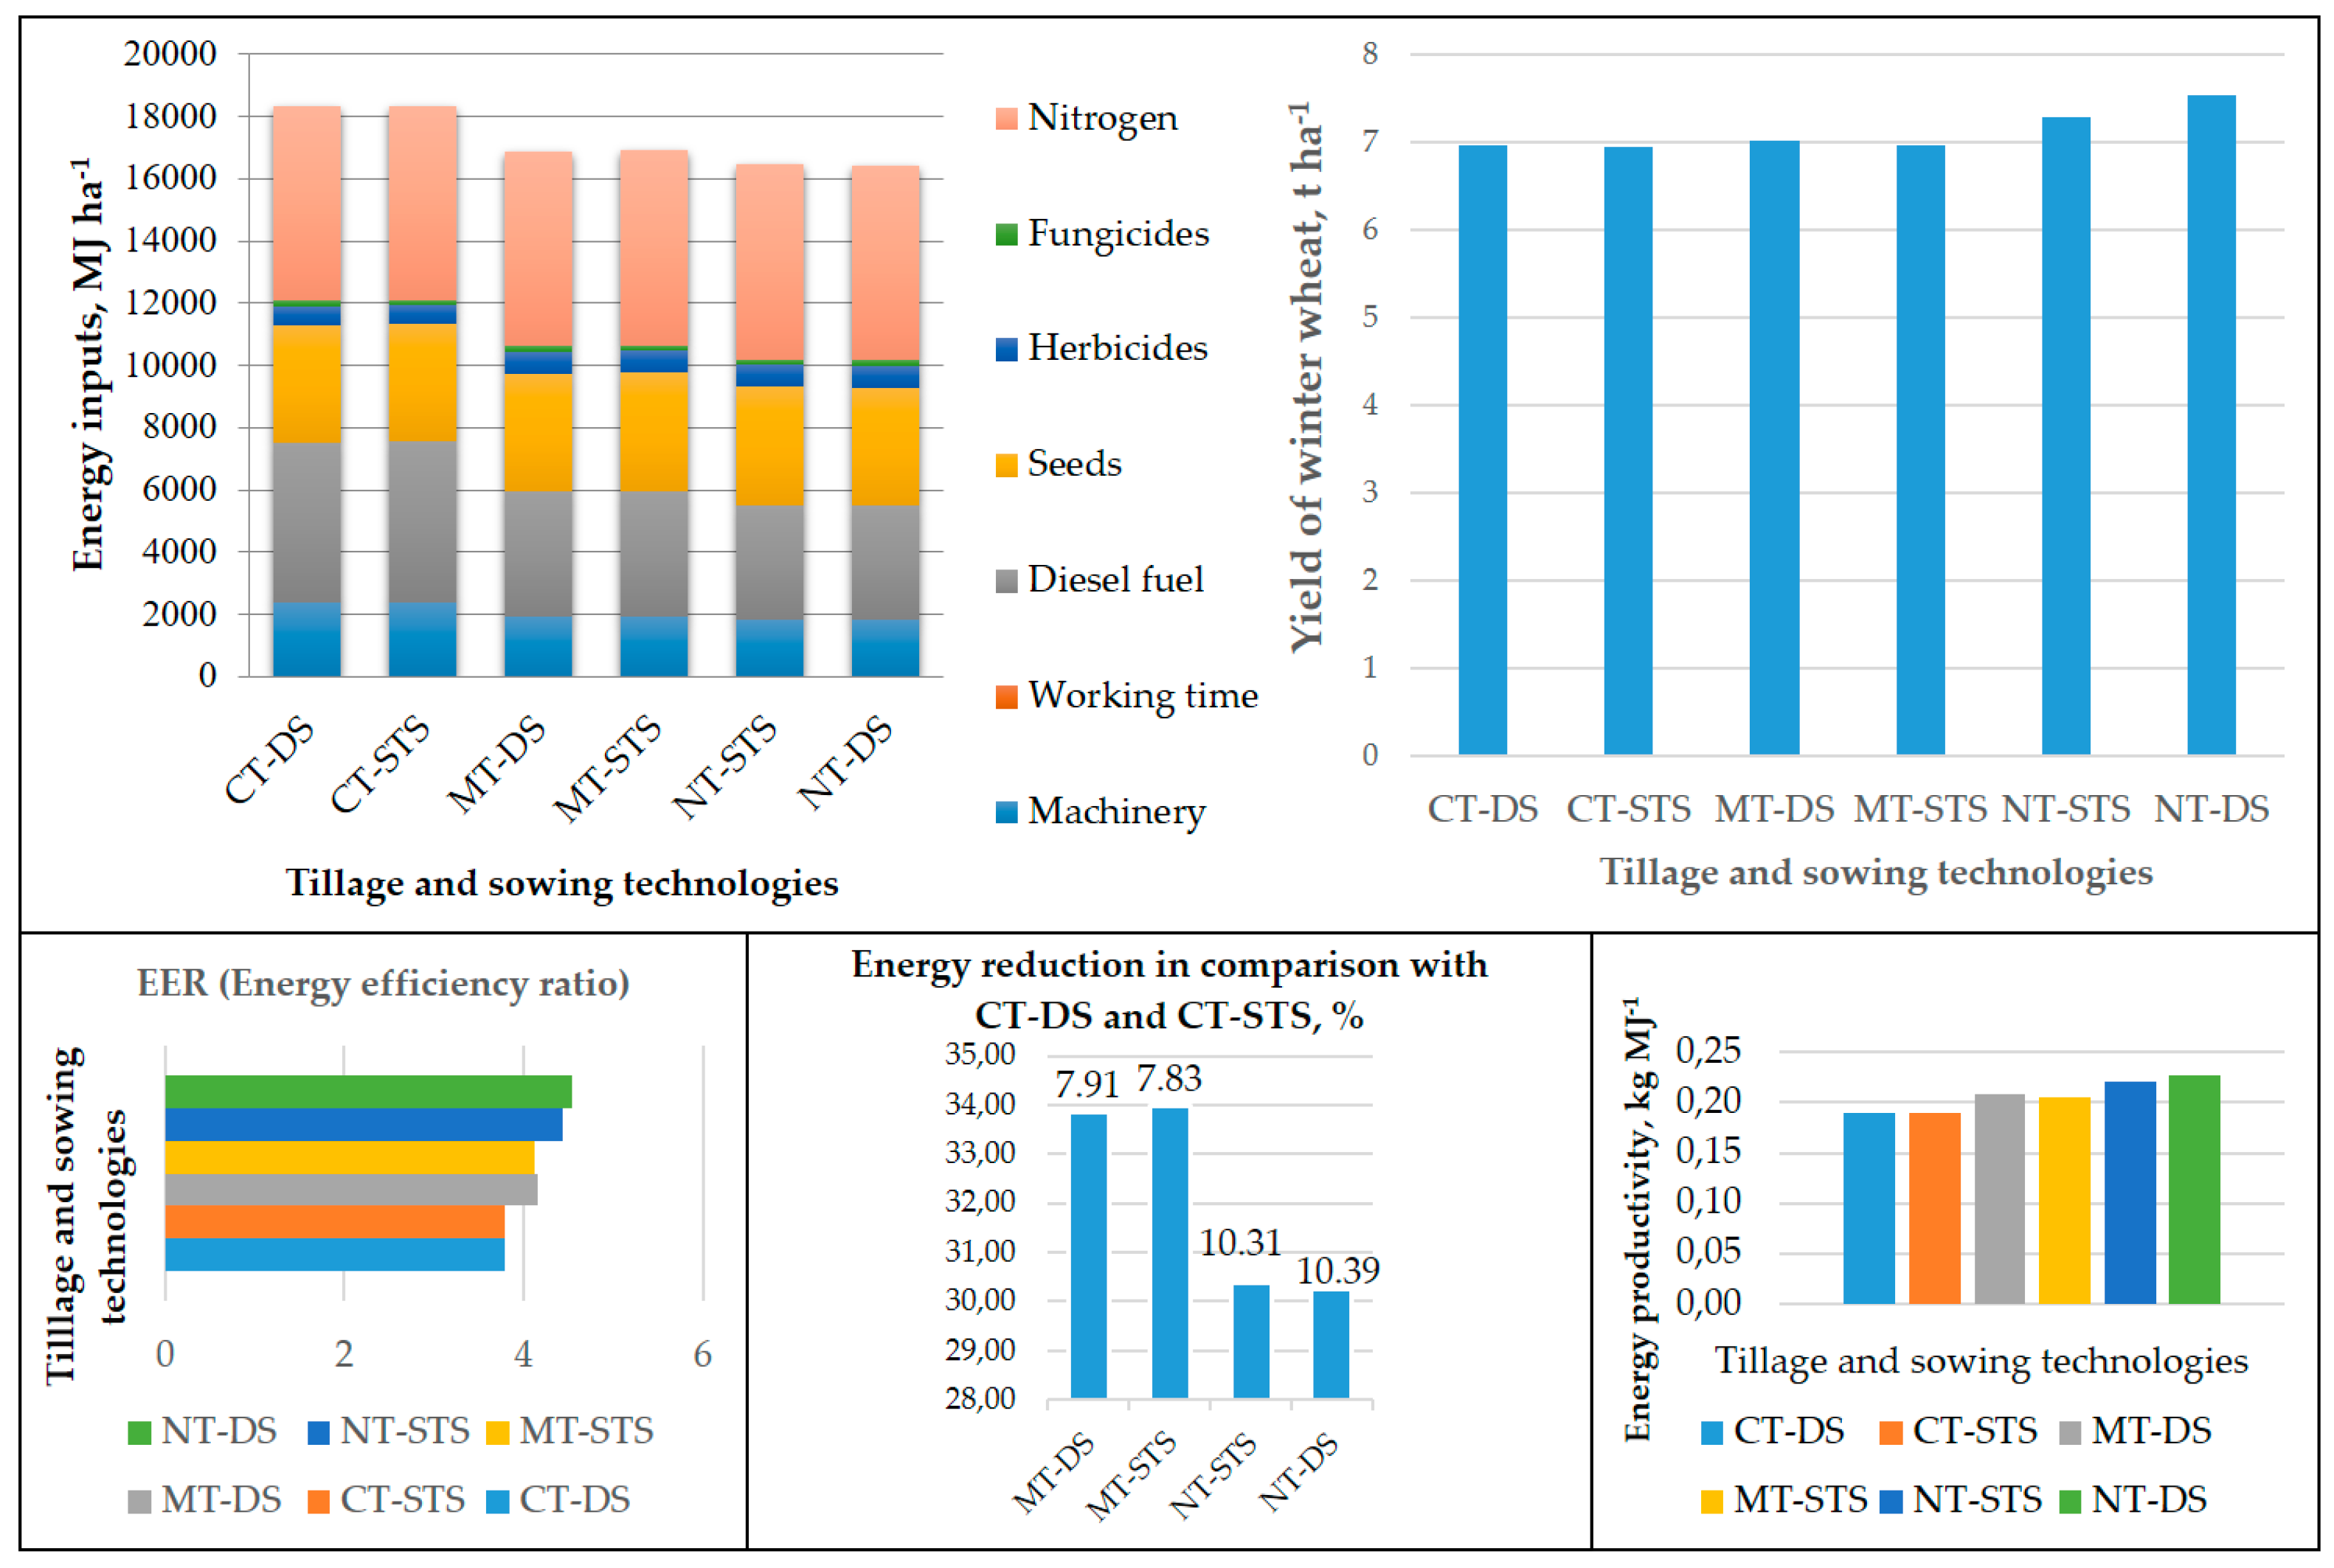
3.3. Energy Consumption Analysis in Winter Wheat Production

The energy analysis (Figure 5) showed that the highest energy inputs were required for CT–DS and CT–STS, and the lowest were required for NT–DS and NT–STS tillage and sowing technologies when cultivating winter wheat. CT technology and DS sowing resulted in an energy consumption of 18,333 MJ ha−1, and NT–DS resulted in an energy consumption of 16,428 MJ ha−1, which was as much as 33.97% lower than that of the CT technology.
The energy efficiency ratio (EER) was calculated to assess the efficiency and effectiveness of winter wheat production (Table 5). The highest EER was obtained with NT–DS tillage and sowing technology and was equal to 9.185, while the lowest was obtained with CT–STS tillage and sowing technology, which was equal to 7.576. These results were mainly influenced by the choice of tillage technology.
Based on the evaluation of specific energy, it was found that the highest amount of energy was required when using CT–DS technology (up to 2.652 MJ kg−1) in winter wheat production. The energy productivity results show that the highest yields of winter wheat per MJ of energy could be obtained when using NT–DS tillage and sowing technology. The NET energy analysis showed that the largest difference between the obtained and consumed energy was formed when applying NT–DS (134,471.660 MJ ha−1).

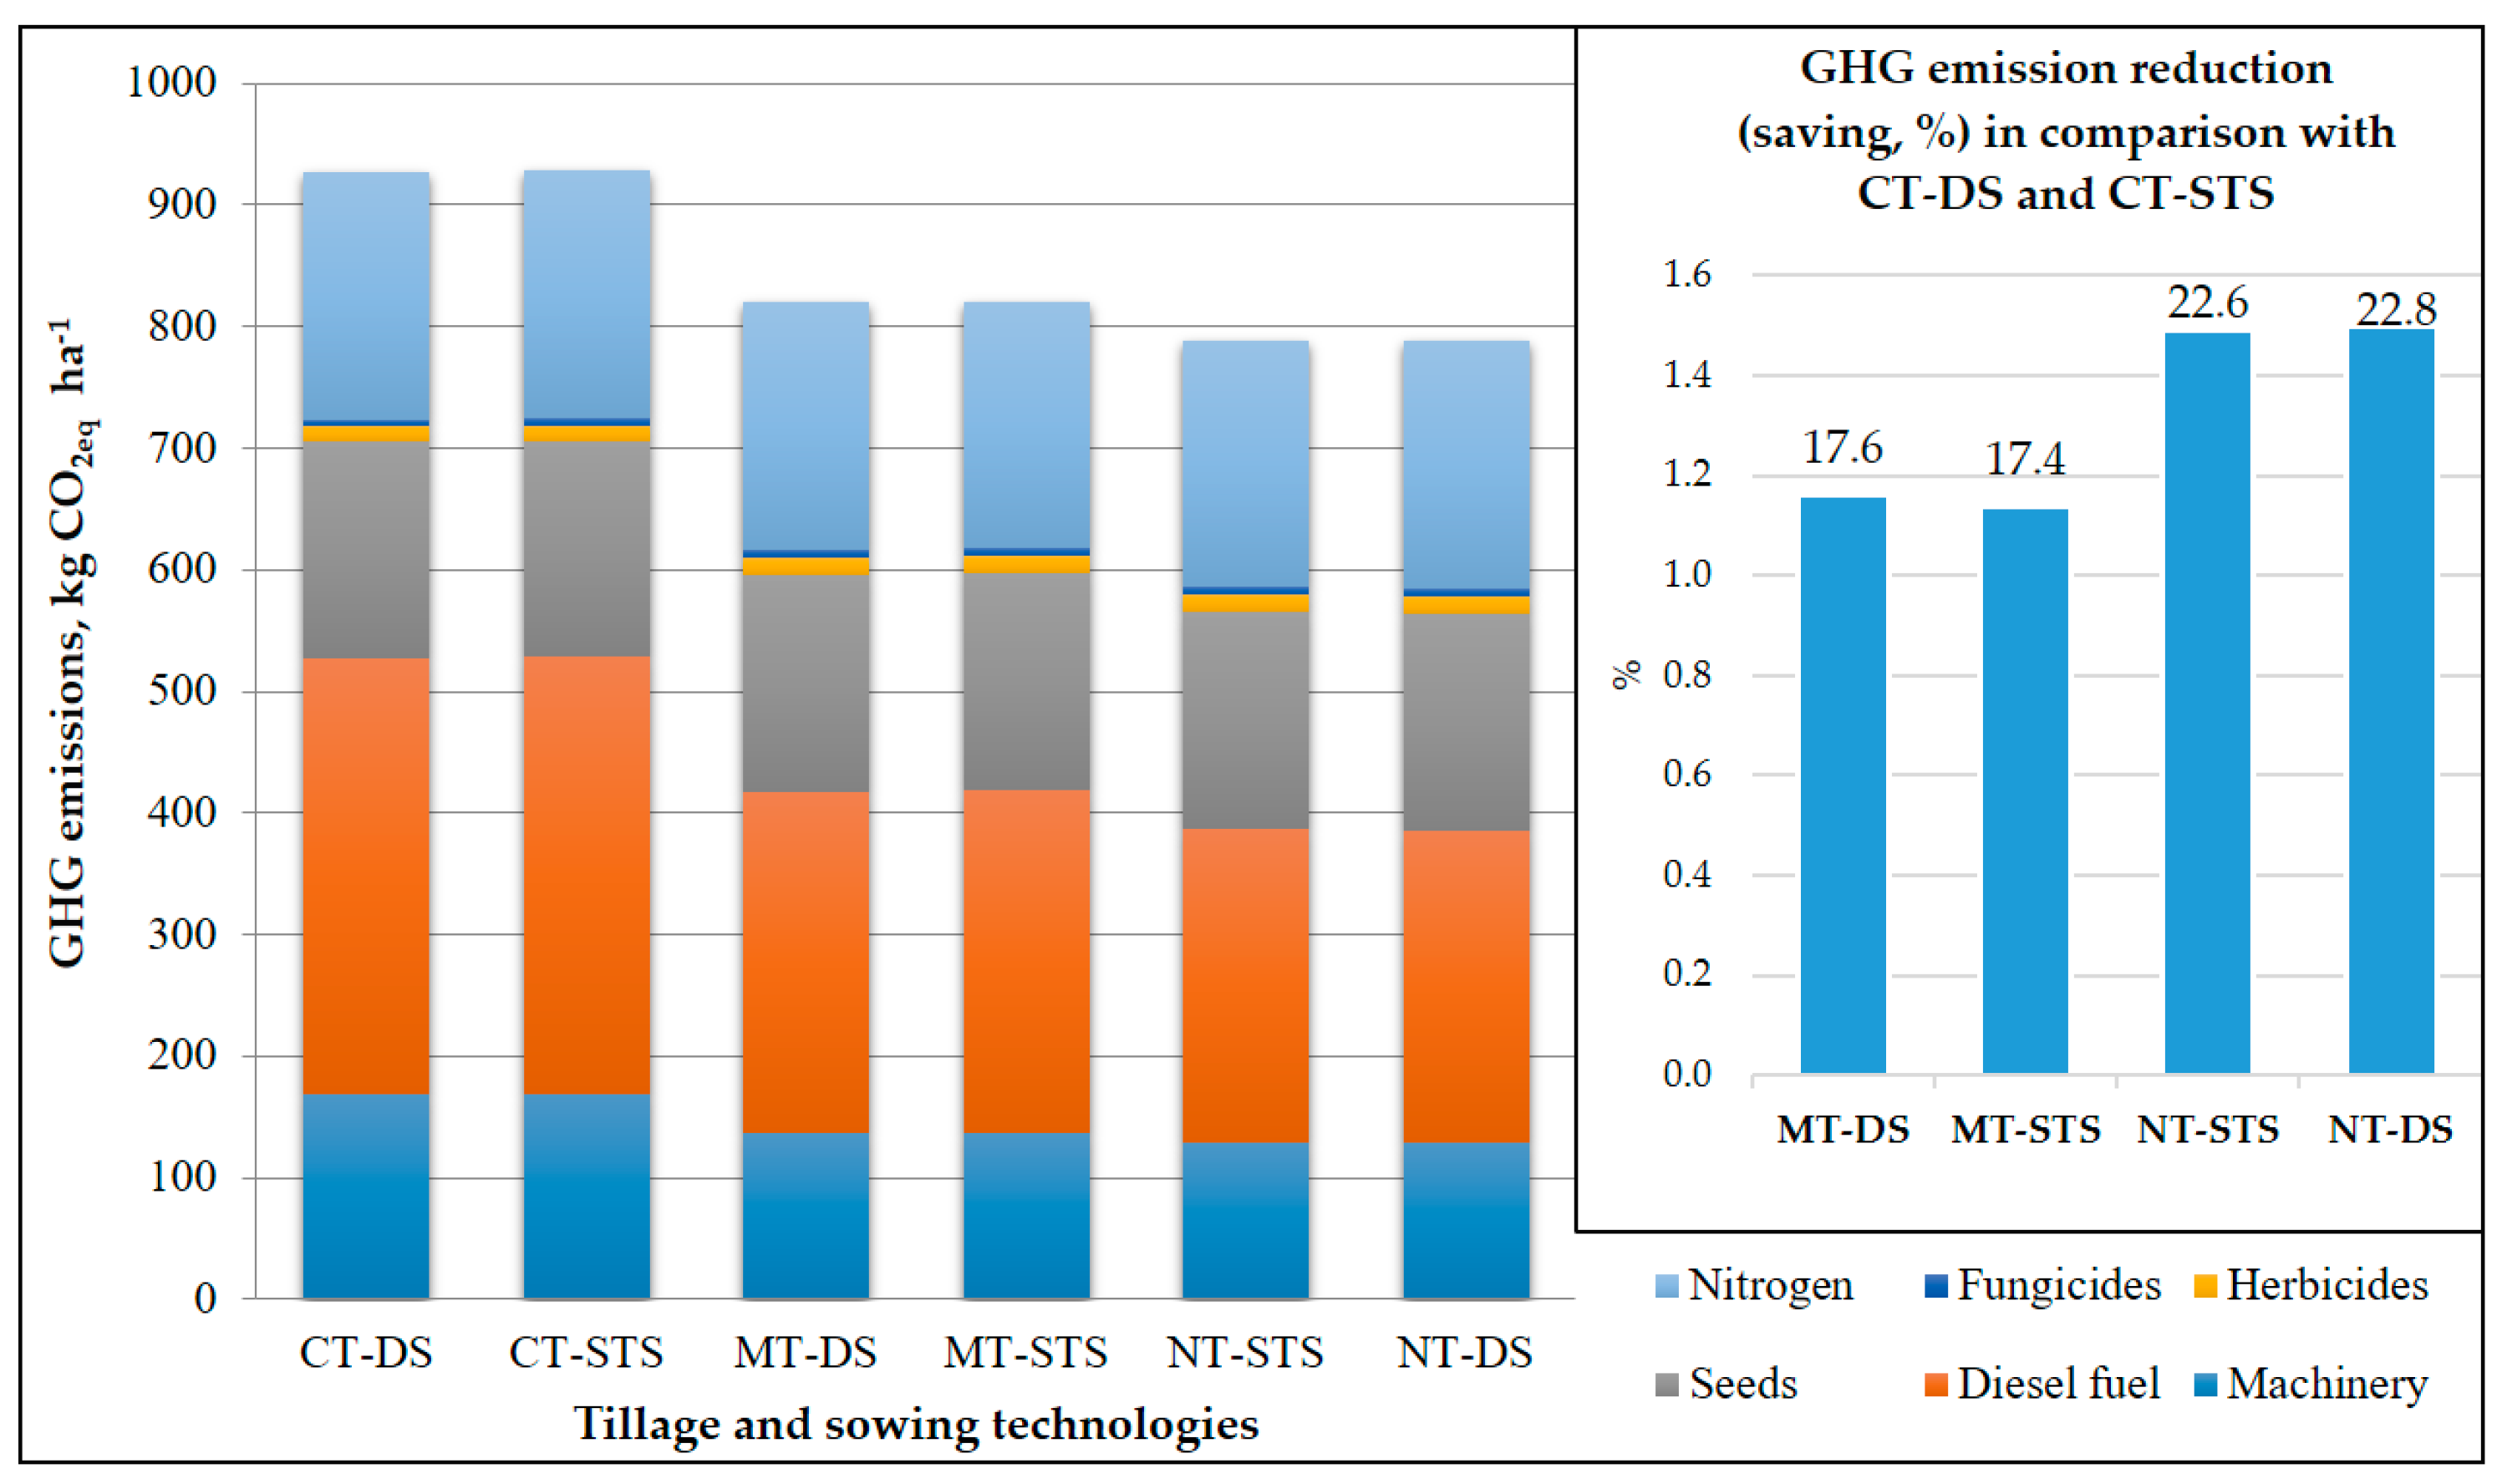
3.4. CO2eq Emissions Analysis and Its Cost in Winter Wheat Production

The assessment of CO2eq emissions (Figure 6) for each tillage and sowing technology revealed that the highest emissions to the environment were achieved when applying CT, at around 928 kg CO2eq ha−1 (irrespective of the sowing method). Machinery, diesel fuel, and fungicides account for the bulk of CO2 emissions. The lowest CO2eq emissions per hectare of winter wheat were achieved when applying NT technology and were equal to 788 kg CO2eq ha−1. The MT technology emitted 821 kg CO2eq ha−1.
When analyzing which technology (CT, MT, or NT) to use to reduce the environmental impact the most, an essential difference can be seen between CT and sustainable tillage and sowing technologies. The study found that the highest reduction in CO2 emissions is possible under NT technology and reaches up to 22.8%, while under MT technology, it reaches up to 17.6%.

4. Discussion

4.1. Fuel Consumption for Different Tillage and Sowing Technologies

Selected tillage technologies have a direct impact on diesel fuel consumption [23]. Gozubuyuk et al. [48] showed that conventional tillage uses the most diesel fuel (from 52.2 to 53.2 l ha−1), and NT technology uses the least (from 16.4 to 16.6 l ha−1). These results are confirmed by our research, where the highest amount of diesel fuel was required for CT technology and was equal to 130 l ha−1. When not taking into consideration the diesel fuel required for the transportation of winter wheat to the storage or point of sale (30 km), this amount was equal to 72.0 l ha−1. The lowest amount of diesel fuel in our experiment was needed when using NT technology. Regardless of the sowing method, it was 93.15 l ha−1, and when excluding fuel for transportation, it was 35.15 l ha−1. According to Šarauskis et al. [49], an estimation of the diesel fuel consumption under DP, DC, SC, and NT revealed that the most diesel fuel is consumed under traditional technology where deep ploughing (67.2 l ha−1) is applied, while simplified land tillage systems require 12 to 58% less fuel.
Moitzi et al. [25] found that the amount of diesel fuel needed for the cultivation of winter wheat when applying CT technology was 48.5 l ha−1, and when applying NT technology, it was 36.0 l ha−1. The least diesel fuel was needed for sowing under NT technology with a universal pneumatic sowing machine without a pre-implemented short disc harrow. Akbarnia and Farhani (2014) analyzed the impact of different intensities of soil preparation for sowing on diesel fuel inputs and found that CT required 59.3 l ha−1, MT required 29.7 l ha−1, and NT required 4.3 l ha−1. Filipovic et al. [50] compared RT (reduced tillage) and NT technologies with CT and found that, under RT technology, fuel consumption decreased from 35.3 to 42.9%, and under NT technology, it decreased from 87.8 to 88.1%. Similar research findings are provided by Calcante and Oberti [51], who state that simplified tillage requires 48 to 63% less diesel fuel than CT, while Uzun et al. [52] reported an even greater reduction in diesel fuel consumption—89.5% compared to CT. By analyzing the percentage of diesel fuel savings due to the abandonment of CT technology and the application of NT, it was found that savings can range from 21.9 to 28.3% (or from 28.3 to 36.9 l ha−1). In financial terms, the cultivation of winter wheat, when calculating diesel fuel (for 1 ha) in Lithuania (the price of diesel fuel for farmers is about EUR 0.86 (USD 0.84), as of 7 October 2021), using CT technology and DS or STS tillage and sowing technology, costs up to EUR 112 (109 USD); using MT technology and DS or STS, it costs EUR 88 (USD 85.6); and using NT and STS or DS, it costs EUR 80 (USD 78). Based on these calculations, it has been established that, in the case of the application of NT technology, up to EUR 32.0–30.0 ha−1 (or USD 31.1–29.2) can be saved compared to DS, and when applying MT, EUR 22–24 ha−1 can be saved compared to DS (USD 21.4–23.4). An analysis of the essential components of diesel fuel and which technological operations require the highest amount of diesel fuel in wheat production revealed that the main operations are transportation, harvesting, deep ploughing, and stubble cultivation. In the analysis of transportation, we assumed that, depending on the location of the winter wheat growing fields, the method of realization, the distance from the farm to the place of harvest, and the available means of transportation, the amount of diesel fuel required may be significantly lower. However, operations such as deep ploughing and stubble cultivation are particularly susceptible to diesel, and the best way to reduce diesel fuel consumption is to eliminate these technologies, i.e., to replace CT technology (which includes deep ploughing and stubble cultivation) with other, less fuel-intensive technologies—MT or NT. Stubble cultivation and deep ploughing, together, account for about 18.2% of all diesel fuel used in winter wheat cultivation. Filipovic et al. [48] note that the fuel consumption under CT is highly dependent on the type of crop grown.

4.2. Time Consumption Analysis

An analysis of the working time inputs showed a significant difference between the application of CT and NT technologies. CT (and DS or STS) requires 6.6 h ha−1 for 1 ha of winter wheat, MT requires 5.40 and 5.42 h ha−1, and NT requires 5.08 and 5.06 h ha−1. According to Šarauskis et al. [53], when estimating the labor time costs in different tillage and sowing systems, sowing into uncultivated soil consumes about 0.4 h ha−1 (when sown up to 2 ha) and 0.6 h ha−1 (when the area sown reaches 20 ha). They argue that traditional tillage and sowing technologies (regardless of farm size) require the highest labor costs. Researchers in other countries also report very similar research results. Yalcin et al. [54] note that the application of simplified tillage and sowing technologies can reduce labor costs by up to 50%, and the development of NT technology on farms can reduce the total working time by 4 to 5 times compared to CT.
In analyzing how much winter wheat cultivation costs when taking into consideration the employee’s salary, the salary taken was the prevailing average salary in Lithuania, which equaled EUR 6.21 h−1 at the time (USD 6.04). Calculations show that the hourly wage, depending on the number of technological operations, ranges from EUR 41.21 to EUR 31.45 ha−1 (or from USD 40.10 to USD 30.60 in CT and NT technologies). This means that we can reduce the costs of growing winter wheat by up to 23.6% or save up to EUR 9.76 (USD 9.50) per hectare by using NT technology. The application of MT technology can save up to EUR 7.65 (USD 7.44) ha−1 compared to CT technology. Houshyar and Grundmann [55] state that an economic analysis shows that the costs of growing wheat under different tillage systems (CT, MT, NT) range from USD 800 to USD 1100 ha−1, with the highest costs being for human labor, the usage of agricultural machinery, and the supply of water for irrigation.

4.3. Energy and Grain Yield Parameters

Improving energy use efficiency in tillage is a key process in developing sustainable agriculture and reducing fuel-related GHG emissions [56]. From an energy point of view, the efficient application of agricultural technologies is when the energy of the outputs is higher than that of the inputs, and the output–input ratio is expected to be more than 1 [55]. Energy inputs in agriculture can be divided into two components: direct energy (diesel fuel, electricity, water, and human energy required for different technological operations) and indirect energy that is required for production [57]. Burt et al. [58] found that strip tillage in wheat stubble cultivation required about 50% less energy than conventional tillage technologies involving disking, field cultivating, subsoiling, and sowing.
In our study, the highest energy inputs were needed under CT technology with DS or STS, reaching 18,349 MJ ha−1. The results of the research conducted by Sørensen et al. [59] showed that the total energy demand is the highest in the traditional tillage, amounting to 11,827.4 MJ ha−1. In our research, the least energy was consumed by NT technology, amounting to 16,443 MJ ha−1. This result differed from CT technology by 10%. Such energy costs and their reduction in NT technology were mainly influenced by the abandonment of energy-intensive technological operations. Sorensen and Nielsen [30] found that direct tillage and sowing can reduce energy consumption by 75 to 83%. Moitzi et al. [25] found that the total energy inputs in winter wheat cultivation ranged from 8900 (NT) to 9400 (CT) MJ ha−1. Sørensen et al. [60] state that NT technology can reduce energy consumption by up to 41% compared to traditional (CT) tillage systems. Šarauskis et al. [48] found that the lowest energy inputs were determined during the application of NT technology and amounted to 16.2 GJ ha−1. Zugec et al. [61] emphasize that CT with deep ploughing is one of the most expensive, most complex, and organizationally slowest technologies, requiring high energy and diesel fuel inputs.
An analysis of the components of energy inputs revealed that diesel fuels, nitrogen, and machinery, which account for 28, 34, and 13% of the total energy consumed under CT technology, respectively, can be identified as the main inputs. Given that MT and NT technologies do not involve deep tillage and other highly energy-intensive technological operations, diesel fuel accounted for up to 21% and machinery accounted for up to 10% of energy inputs. Other researchers have found that tillage is the most energy-intensive operation in all cultivation technologies for other crops (such as millet) as well and accounts for about 40% of the total energy inputs [19]. According to Moitzi et al. [25], fertilizers account for the largest share of energy in winter wheat production (research found it to be from 42 to 44%). Fuel energy inputs ranged from 412 to 740 MJ ha−1 under conventional tillage and from 80 to 284 MJ ha−1 under no till technology (Mileusnic et al., 2010). Mileusnić et al. [62] state that the energy inputs from diesel fuel depend on the sowing technology, farm size, soil conditions, and tillage technology. Based on these criteria, the researchers argue that diesel fuel energy inputs under CT technology range from 412 to 740 MJ ha−1, while under NT technology, they range from 80 to 284 MJ ha−1.
Energy use efficiency can be increased by reducing the amount of energy used by raw materials such as fertilizers or by increasing productivity [26]. Cavalaris and Gemtos [22] assessed the tillage efficiency and energy required for five different soil preparation methods in sugar beet cultivation and found that the simplification of tillage reduced the energy consumption from 18 to 53% compared to conventional tillage. Research conducted by Stajnko et al. [21] in maize cultivation showed that the highest energy efficiency (8.78) was obtained using minimal tillage technology. The results of research conducted by Gozubuyuk et al. (2020) [56] showed that the energy ratio was the lowest under CT, ranging from 4.41 to 3.87. Tabatabaeefar et al. [63] found that NT technology requires 8.81 MJ kg−1 of energy for growing winter wheat.
An analysis of other energy parameters showed that the highest EER was obtained using NT–DS and NT–STS technologies—it was equal to 9.18 and 8.85, respectively. Energy productivity in winter wheat cultivation ranged from 0.38 (CT technology) to 0.42 (MT technology) and 0.46 (NT technology). From these results, it can be concluded that, after consuming 1.0 MJ of energy, the highest yield is obtained under NT technology. Specific energy calculations showed that the most energy required to produce 1 kg of winter wheat was required for the application of CT technology and amounted to about 2.6 MJ kg−1 (DS and STS). The difference between the received and consumed energy or NET energy ranged from 120,867 MJ ha−1 (CT technology) to 134,372 MJ ha−1 (NT technology). The NET energy obtained under CT technology was 11% lower than that obtained when applying NT technology. A study by Moitzi et al. (2019) found that NET energy in winter wheat cultivation ranged from 51.0 (NT) to 75.1 (CT) GJ ha−1.
The best yield results were obtained under NT technology using DS sowing. Here, the yield was 7.54 t ha−1, while under NT–STS technology, the yield was almost 5% lower and amounted to 7.28 t ha−1. When comparing NT technology with MT and CT, the lowest yields were obtained under CT–STS and MT–STS. It was about 8% lower than that under NT–DS technology. No significant difference was found between the yield results. Stošić et al. [64] found that the lowest yields (6.92 t ha−1) and the lowest GHG emissions (2685.94 kg CO2eq ha−1) from winter wheat production were achieved by applying NT technology. According to the results of researchers [65], the highest yields of winter wheat were obtained in 2004 and equaled 6486 kg ha−1 (or 101.2 GJ ha−1), while they were 2243 kg ha−1 (or 33.3 GJ ha−1) in 2012.

4.4. CO2eq Emissions Analysis and Its Cost in Winter Wheat Production

Many of the studies examined report a positive effect of NT technology on reducing GHG emissions and energy inputs in winter wheat cultivation [51,52] According to Šarauskis et al. [49], lower fuel inputs reduce the costs of technological operations as well as the CO2 emissions that are related to the greenhouse effect.
In our study, the highest CO2 emissions to the environment were obtained when applying CT tillage technology. In the case of winter wheat, they amounted to 928.0 kg CO2eq ha−1 (DS and STS). Researchers [65] found that the total GHG emissions were 915 kg CO2eq ha−1 under MT and 855 CO2eq ha−1 under NT technology. The application of sustainable tillage and sowing technologies can reduce CO2 emissions from 12% (with MT and DS or STS) to 15% (with NT and DS or STS), and Sørensen et al. [60] found that, under NT, compared to CT, GHGs were reduced to 11%, and under minimum tillage (MT), they were reduced to 7%. Analyzing the GHG emissions from winter wheat cultivation, Stošić et al. [64] reported that only NT technology has significantly lower GHG emissions compared to CT and reduction tillage (RT). In our study, a significant 9% reduction in GHG emissions was observed under NT technology compared to those under CT technology. The results of Gozubuyuk et al. [48] showed that, under MT technology, the emissions were, on average, 42.2 to 68.7% lower compared to those under conventional tillage (151.1 kg CO2eq ha−1). From these results, it can be concluded that the application of NT technology is particularly conducive to greater energy efficiency and lower GHG emissions.
Claus et al. [66], Abdalla et al. [67], Feng et al. [68] also confirm a reduction in CO2 under NT technology by 21%. The study combined all technological operations used in winter wheat cultivation (tillage, sowing, harvesting), and under NT technology, harvesting accounted for as much as 32% of the total cost of diesel fuel. Feng et al. [69] also confirm that the application of NT technology reduces GHG emissions. In our study, diesel fuel, agricultural machinery, and fertilizers accounted for the largest share of CO2 emissions during winter wheat cultivation. In our experiment, diesel fuel accounted for as much as 38.7% of the total CO2 emissions under CT technology, 30.2% under MT technology, and 27.7% under NT technology. Fertilizers accounted for 21.8% of the total CO2 emissions, and machinery accounted for 18 to 13%. There is a significant trend that, as with the analysis of other parameters, the analysis of CO2 emissions results in the highest CO2 emissions when applying CT technology (irrespective of the method of sowing) and when using energy-, diesel-, and pollution-intensive technological operations.
However, some cases contradict the aforementioned research results, when higher CO2 emissions are recorded under NT technology. For example, Plaza-Bonilla et al. [70] and Ye et al. [71] hypothesize that higher CO2 emissions were recorded under NT technology due to increased microbial activity or the decomposition of crop residues. Kostyanovsky et al. [72] name a higher amount of organic matter in the soil for which NT technology was applied as a possible reason for the increase in CO2. Malobane et al. [73] argue that CO2 fluxes can vary significantly depending on the measurement time and environmental conditions. Stošić et al. [64] argue that simplified tillage systems can significantly reduce GHG emissions from diesel fuel without affecting winter wheat yields. Reductions in agricultural GHG emissions can be achieved through the introduction of different tillage systems, which can have a positive impact on soil fertility, fuel consumption, and production efficiency [74]. Martin-Gorriza et al. [75] emphasize that a reduction of “one out of three tillage per year involves a reduction of 20% of GHG emissions”. Corrochano-Monsalve et al. [76] prioritize NT technology over CT technology in terms of reducing CO2 emissions. Gozubuyuk et al. and Omara et al. [48,75] argue that sustainable tillage systematically reduces GHG emissions into the environment.

5. Conclusions

This study evaluated energy indicators, diesel fuel, time inputs, and energy and yield parameters using different tillage and sowing technologies in central Lithuania. The use of inefficient technologies that are both energy- and diesel-intensive not only increases the costs of production but also harms the environment. We can reduce the costs of growing winter wheat by up to 23.6% or save up to EUR 9.76 (USD 9.50) per ha by applying NT technology. The lowest energy consumption in our study was found under NT technology. It amounted to 16,443 MJ ha−1 and was 10% lower than that under CT technology. The highest EER was obtained using NT–DS and NT–STS technologies—it was equal to 9.18 and 8.85. NET energy ranged from 120,867 MJ ha−1 (CT technology) to 134,372 MJ ha−1 (NT technology). The least diesel fuel in our experiment was needed under NT technology, regardless of the sowing method, and amounted to 93.15 l ha−1. CO2 calculations were based on the inputs and outputs multiplied by the energy, diesel, and CO2 equivalents. The highest CO2 emissions to the environment were obtained when applying CT tillage technology. In the case of winter wheat, they amounted to 928.0 kg CO2eq ha−1 (DS and STS). The use of sustainable tillage and sowing technologies can reduce CO2 emissions by 12 to 15%. The application of CT technology was the most susceptible in terms of diesel fuel, working time, and energy. Deep ploughing was found to have the greatest impact on the amount of diesel fuel. An analysis showed that tillage and fertilizers account for a significant share of energy in wheat production. CO2 analysis showed that the application of CT–STS technology is the most polluting, and NT–DS technology has the lowest environmental impact.
In response to the hypothesis of whether the machines dedicated to sustainable tillage and sowing can be used in traditional tillage technologies, it can be argued that a strip tillage and sowing machine and a direct sowing machine can be used, resulting in no significant difference in winter wheat yields. Scientific research in the future should aim to determine and evaluate the possibilities of applying strip tillage and direct sowing technologies together with variable rate sowing and fertilizing and spraying technologies in practical field conditions. Combining smart spreading precision technologies with tillage and sowing processes is very important from the point of view of environmental and economic efficiency.

Author Contributions

Conceptualization—L.S.-S. and E.Š.; methodology—L.S.-S., E.Š. and R.V.; writing—L.S.-S. and E.Š.; writing—review and editing—L.S.-S., E.Š. and Z.K.; investigation—L.S.-S., S.B., A.A., Z.K. and R.V.; data curation—L.S.-S., S.B., A.A., Z.K. and R.V.; validation—D.S.; formal analysis—L.S.-S. and D.S.; supervision—E.Š. All authors have read and agreed to the published version of the manuscript.

Funding

This research received no external funding.

Institutional Review Board Statement

Not applicable.

Informed Consent Statement

Informed consent was obtained from all subjects involved in the study.

Data Availability Statement

The data obtained during the study are freely available in the article.

Acknowledgments

The VDU Agriculture Academy Research station community is acknowledged for its assistance in the research.

Conflicts of Interest

The authors declare no conflict of interest.

References

  1. Rebolledo-Leiva, R.; Angulo-Meza, L.; Iriarte, A.; González-Araya, M.C. Joint carbon footprint assessment and data envelopment analysis for the reduction of greenhouse gas emissions in agriculture production. Sci. Total Environ. 2017, 593, 36–46. [Google Scholar] [CrossRef] [PubMed]
  2. Martin, N.P.; Russelle, M.P.; Powell, J.M.; Sniffen, C.J.; Smith, S.I.; Tricarico, J.M.; Grant, R.J. Invited review: Sustainable forage and grain crop production for the US dairy industry. J. Dairy Sci. 2017, 100, 9479–9494. [Google Scholar] [CrossRef] [PubMed] [Green Version]
  3. Akhtar, K.; Wang, W.; Ren, G.; Khan, A.; Nie, E.; Khan, A.; Feng, Y.; Yang, G.; Wang, H. Straw mulching with inorganic nitrogen fertilizer reduces soil CO2 and N2O emissions and improves wheat yield. Sci. Total Environ. 2020, 741, 140488. [Google Scholar] [CrossRef] [PubMed]
  4. Change, I.C. Mitigation of Climate Change. Contribution of Working Group III to the Fifth Assessment Report of the Intergovernmental Panel on Climate Change; Cambridge University Press: Cambridge, UK, 2014; p. 1454. [Google Scholar]
  5. Stocker, T.F.; Qin, D.; Plattner, G.K.; Tignor, M.; Allen, S.K.; Boschung, J.; Nauels, A.; Xia, Y.; Bex, V.; Midgley, P.M. Climate Change 2013: The Physical Science Basis: Working Group I Contribution to the Fifth Assessment Report of the Intergovernmental Panel on Climate Change; Cambridge University Press: Cambridge, UK, 2013. [Google Scholar]
  6. Fedoroff, N.V. Food in a future of 10 billion. Agric. Food Secur. 2015, 4, 11. [Google Scholar] [CrossRef] [Green Version]
  7. Uphoff, N.; Ball, A.; Fernandes, E.; Herren, H.; Husson, O.; Palm, C.; Pretty, J.; Sanginga, N.; Thies, J. Understanding the Functioning and Management of Soil Systems; CRC Press: Boca Raton, FL, USA, 2006. [Google Scholar]
  8. Shah, F.; Wu, W. Soil and crop management strategies to ensure higher crop productivity within sustainable environments. Sustainability 2019, 11, 1485. [Google Scholar] [CrossRef] [Green Version]
  9. Godfray, H.C.J.; Beddington, J.R.; Crute, I.R.; Haddad, L.; Lawrence, D.; Muir, J.F.; Pretty, J.; Robinson, S.; Thomas, S.M.; Toulmin, C. Food security: The challenge of feeding 9 billion people. Science 2010, 327, 812–818. [Google Scholar] [CrossRef] [Green Version]
  10. Wu, W.; Ma, B.L.; Whalen, J.K. Enhancing rapeseed tolerance to heat and drought stresses in a changing climate: Perspectives for stress adaptation from root system architecture. Adv. Agron. 2018, 151, 87–157. [Google Scholar] [CrossRef]
  11. FAO. FAOSTAT Statistics Database. 2017. Available online: http://www.fao.org/faostat/ (accessed on 10 September 2022).
  12. Agricultural Information and Rural Business Center. Available online: https://www.vic.lt/ (accessed on 26 September 2021).
  13. Lal, R.; Eckert, D.J.; Fausey, N.R.; Edwards, W.M. Conservation tillage in sustainable agriculture. In Sustainable Agricultural Systems; CRC Press: Boca Raton, FL, USA, 2020; pp. 203–225. [Google Scholar]
  14. Jarecki, M.K.; Lal, R. Compost and mulch effects on gaseous flux from an alfisol in Ohio. Soil Sci. 2006, 171, 249–260. [Google Scholar] [CrossRef]
  15. Birkás, M. Environmentally-Sound Adaptable Tillage–Solutions from Hungary; Akademiai Kiado: Budapest, Hungary, 2008; pp. 191–194. [Google Scholar] [CrossRef]
  16. Drury, C.F.; Yang, X.M.; Reynolds, W.D.; McLaughlin, N.B. Nitrous oxide and carbon dioxide emissions from monoculture and rotational cropping of corn, soybean, and winter wheat. Can. J. Soil Sci. 2008, 88, 163–174. [Google Scholar] [CrossRef]
  17. Drury, C.F.; Reynolds, W.D.; Tan, C.S.; Welacky, T.W.; Calder, W.; McLaughlin, N.B. Emissions of nitrous oxide and carbon dioxide: Influence of tillage type and nitrogen placement depth. Soil Sci. Soc. Am. J. 2006, 70, 570–581. [Google Scholar] [CrossRef]
  18. Castrignanò, A.; Maiorana, M.; Fornaro, F. Using regionalised variables to assess field-scale spatiotemporal variability of soil impedance for different tillage management. Biosyst. Eng. 2003, 85, 381–392. [Google Scholar] [CrossRef]
  19. Barut, Z.B.; Ertekin, C.; Karaagac, H.A. Tillage effects on energy use for corn silage in Mediterranean Coastal of Turkey. Energy 2011, 36, 5466–5475. [Google Scholar] [CrossRef]
  20. Jaskulska, I.; Jaskulski, D.; Różniak, M.; Radziemska, M.; Gałęzewski, L. Zonal tillage as innovative element of the technology of growing winter wheat: A field experiment under low rainfall conditions. Agriculture 2020, 10, 105. [Google Scholar] [CrossRef] [Green Version]
  21. Stajnko, D.; Lakota, M.; Vučajnk, F.; Bernik, R. Effects of Different Tillage Systems Fuel Savings and Reduction of CO-Emissions Production of Silage Corn in Eastern Slovenia. Pol. J. Environ. Stud. 2009, 18, 711–716. [Google Scholar]
  22. Cavalaris, C.C.; Gemtos, T.A. Evaluation of tillage efficiency and energy requirements for five methods of soil preparation in the sugar beet crop. In Proceedings of the Conference Book of Energy Efficiency and Agricultural Engineering, Rousse, Bulgaria, 3–5 June 2004; pp. 110–116. [Google Scholar]
  23. Lithuanian Institute of Agrarian Economics. Available online: https://www.laei.lt/?mt=mokslo-publikacijos&straipsnis=162&metai=2004 (accessed on 20 September 2022).
  24. Mobtaker, H.G.; Keyhani, A.; Mohammadi, A.; Rafiee, S.; Akram, A. Sensitivity analysis of energy inputs for barley production in Hamedan Province of Iran. Agric. Ecosyst. Environ. 2010, 137, 367–372. [Google Scholar] [CrossRef]
  25. Moitzi, G.; Neugschwandtner, R.W.; Kaul, H.P.; Wagentristl, H. Energy efficiency of winter wheat in a long-term tillage experiment under Pannonian climate conditions. Eur. J. Agron. 2019, 103, 24–31. [Google Scholar] [CrossRef]
  26. Swanton, C.J.; Murphy, S.D.; Hume, D.J.; Clements, D.R. Recent improvements in the energy efficiency of agriculture: Case studies from Ontario, Canada. Agric. Syst. 1996, 52, 399–418. [Google Scholar] [CrossRef]
  27. Tabar, I.B.; Keyhani, A.; Rafiee, S. Energy balance in Iran’s agronomy (1990–2006). Renew. Sustain. Energy Rev. 2010, 14, 849–855. Available online: https://www.sciencedirect.com/science/article/pii/S136403210900255X?casa_token=lq_A2IoNSWoAAAAA:b5llYodT9JNXNl-zrki5t-c032X0LwsYU6SmaLjgM8U9mf55O4Vs7bNDbf3wIGbzwfaZ0rNMqA (accessed on 20 September 2022). [CrossRef]
  28. Reineke, H.; Stockfisch, N.; Märländer, B. Analysing the energy balances of sugar beet cultivation in commercial farms in Germany. Eur. J. Agron. 2013, 45, 27–38. [Google Scholar] [CrossRef]
  29. Rabiee, M.; Majidian, M.; Alizadeh, M.R.; Kavoosi, M. Evaluation of energy use efficiency and greenhouse gas emission in rapeseed (Brassica napus L.) production in paddy fields of Guilan province of Iran. Energy 2021, 217, 119411. [Google Scholar] [CrossRef]
  30. Sørensen, C.G.; Nielsen, V. Operational analyses and model comparison of machinery systems for reduced tillage. Biosyst. Eng. 2005, 92, 143–155. [Google Scholar] [CrossRef]
  31. Tzilivakis, J.; Warner, D.J.; May, M.; Lewis, K.A.; Jaggard, K. An assessment of the energy inputs and greenhouse gas emissions in sugar beet (Beta vulgaris) production in the UK. Agric. Syst. 2005, 85, 101.e119. [Google Scholar] [CrossRef] [Green Version]
  32. Ozkan, B.; Akcaoz, H.; Fert, C. Energy input–output analysis in Turkish agriculture. Renew. Energy 2004, 29, 39–51. [Google Scholar] [CrossRef]
  33. Saldukaitė, L.; Šarauskis, E.; Lekavičienė, K.; Savickas, D. Predicting energy efficiency and greenhouse gases reduction potential under different tillage management and farm size scenarios for winter wheat production. Sustain. Energy Technol. Assess. 2020, 42, 100841. [Google Scholar] [CrossRef]
  34. Różewicz, M. Review of current knowledge on strip-till cultivation and possibilities of its popularization in Poland. Pol. J. Agron. 2022, 49, 20–30. [Google Scholar]
  35. Liu, C.; Cutforth, H.; Chai, Q.; Gan, Y. Farming tactics to reduce the carbon footprint of crop cultivation in semiarid areas. A review. Agron. Sustain. Dev. 2016, 36, 69. [Google Scholar] [CrossRef] [Green Version]
  36. Koga, N.; Tsuruta, H.; Tsuji, H.; Nakano, H. Fuel consumption-derived CO2 emissions under conventional and reduced tillage cropping systems in northern Japan. Agric. Ecosyst. Environ. 2003, 99, 213–219. [Google Scholar] [CrossRef]
  37. Moghimi, M.R.; Alasti, B.M.; Drafshi, M.A.H.; Ghadim, M.A.; Taki, M. Energy consumption and assessment of econometric model between input and output for wheat production in Gorve country, Kordestan Province of Iran. Int. J. Agric. Crop Sci. (IJACS) 2013, 5, 2342–2348. [Google Scholar]
  38. Pishgar-Komleh, S.H.; Sefeedpari, P.; Ghahderijani, M. Exploring energy consumption and CO2 emission of cotton production in Iran. J. Renew. Sustain. Energy 2012, 4, 033115. [Google Scholar] [CrossRef]
  39. Gan, Y.; Liang, C.; Hamel, C.; Cutforth, H.; Wang, H. Strategies for reducing the carbon footprint of field crops for semiarid areas. A review. Agron. Sustain. Dev. 2011, 31, 643–656. [Google Scholar] [CrossRef] [Green Version]
  40. Khoshnevisan, B.; Rafiee, S.; Omid, M.; Mousazadeh, H. Reduction of CO2 emission by improving energy use efficiency of greenhouse cucumber production using DEA approach. Energy 2013, 55, 676–682. [Google Scholar] [CrossRef]
  41. Lal, R. Carbon emission from farm operations. Environ. Int. 2004, 30, 981–990. [Google Scholar] [CrossRef] [PubMed]
  42. Rajaeifar, M.A.; Akram, A.; Ghobadian, B.; Rafiee, S.; Heidari, M.D. Energy-economic life cycle assessment (LCA) and greenhouse gas emissions analysis of olive oil production in Iran. Energy 2014, 66, 139–149. [Google Scholar] [CrossRef]
  43. Tarakanovas, P.; Raudonius, S. The Program Package “Selekcija” for Processing Statistical Data. Programų paketas “Selekcija” Statistiniams Duomenims Tvarkyti Akademija, Kėdainiai; Kaunas, Lithuania, 2003; p. 56. (In Lithuanian) [Google Scholar]
  44. Gong, H.; Li, J.; Sun, M.; Xu, X.; Ouyang, Z. Lowering carbon footprint of wheat-maize cropping system in North China Plain: Through microbial fertilizer application with adaptive tillage. J. Clean. Prod. 2020, 268, 122255. [Google Scholar] [CrossRef]
  45. Guan, D.; Zhang, Y.; Al-Kaisi, M.M.; Wang, Q.; Zhang, M.; Li, Z. Tillage practices effect on root distribution and water use efficiency of winter wheat under rain-fed condition in the North China Plain. Soil Tillage Res. 2015, 146, 286–295. [Google Scholar] [CrossRef]
  46. Montanha, G.K.; Guerra, S.P.S.; Sanchez, P.A.; Campos, F.H.; Lanças, K.P. Consumo de combustível de um trator agrícola no preparo do solo para a cultura do algodão irrigado em função da pressão de inflação nos pneus. Rev. Energ. Agric. 2011, 26, 39–51. [Google Scholar] [CrossRef] [Green Version]
  47. Martins, M.B.; Bortolheiro, F.P.D.A.P.; Testa, J.V.P.; Sartori, M.M.P.; Crusciol, C.A.C.; Lanças, K.P. Fuel consumption between two soil tillage systems for planting sugarcane. Sugar Tech 2021, 23, 219–224. [Google Scholar] [CrossRef]
  48. Gozubuyuk, Z.; Sahin, U.; Celik, A. Tillage and irrigation impacts on the efficiency of fossil fuel utilization for Hungarian vetch production and fuel-related CO2 emissions. Environ. Eng. Sci. 2020, 37, 201–213. [Google Scholar] [CrossRef]
  49. Šarauskis, E.; Buragienė, S.; Masilionytė, L.; Romaneckas, K.; Avižienytė, D.; Sakalauskas, A. Energy balance, costs, and CO2 analysis of tillage technologies in maize cultivation. Energy 2014, 69, 227–235. [Google Scholar] [CrossRef]
  50. Filipovic, D.; Kosutic, S.; Gospodaric, Z.; Zimmer, R.; Banaj, Đ. The possibilities of fuel savings and the reduction of CO2 emissions in the soil tillage in Croatia. Agric. Ecosyst. Environ. 2005, 115, 290–294. [Google Scholar] [CrossRef]
  51. Calcante, A.; Oberti, R. A technical-economic comparison between conventional tillage and conservative techniques in paddy-rice production practice in northern Italy. Agronomy 2019, 9, 886. [Google Scholar] [CrossRef] [Green Version]
  52. Uzun, B.; Yol, E.; Furat, Ş.; TopakcI, M.; Canakci, M.; Karayel, D. The effects of different tillage methods on the post-wheat second crop sesame: Seed yield, energy budget, and economic return. Turk. J. Agric. For. 2012, 36, 399–407. [Google Scholar] [CrossRef]
  53. Šarauskis, E.; Buragiene, S.; Romaneckas, K.; Sakalauskas, A.; Jasinskas, A.; Vaiciukevicius, E.; Karayel, D. Working time, fuel consumption, and economic analysis of different tillage and sowing systems in Lithuania. Eng. Rural. Dev. 2012, 11, 52–59. [Google Scholar]
  54. Yalcin, H.; Cakir, E.; Aykas, E. Tillage parameters and economic analysis of direct seeding, minimum and conventional tillage in wheat. J. Agron. 2005, 4, 329–332. [Google Scholar] [CrossRef] [Green Version]
  55. Houshyar, E.; Grundmann, P. Environmental impacts of energy use in wheat tillage systems: A comparative life cycle assessment (LCA) study in Iran. Energy 2017, 122, 11–24. [Google Scholar] [CrossRef]
  56. Gozubuyuk, Z.; Sahin, U.; Celik, A. Operational and yield performances and fuel-related CO2 emissions under different tillage-sowing practices in a rainfed crop rotation. Int. J. Environ. Sci. Technol. 2020, 17, 4563–4576. [Google Scholar] [CrossRef]
  57. Mohammadi, A.; Tabatabaeefar, A.; Shahin, S.; Rafiee, S.; Keyhani, A. Energy use and economical analysis of potato production in Iran a case study: Ardabil province. Energy Convers. Manag. 2008, 49, 3566–3570. [Google Scholar] [CrossRef]
  58. Burt, E.C.; Reeves, D.W.; Raper, R.L. Energy utilization as affected by traffic in a conventional and conservation tillage system. Trans. ASAE 1994, 37, 759–762. [Google Scholar] [CrossRef]
  59. Sørensen, C.G.; Halberg, N.; Oudshoorn, F.W.; Petersen, B.M.; Dalgaard, R. Energy inputs and GHG emissions of tillage systems. Biosyst. Eng. 2014, 120, 2–14. [Google Scholar] [CrossRef]
  60. Zugec, I.; Stipesevic, B.; Kelava, I. Rational soil tillage for cereals (Winter wheat-Triticum aestivum L. and Spring barley-Hordeum vulgare L.) in eastern Croatia. In Proceedings of the 15th ISTRO Conference, Fort Worth, TX, USA, 2–7 July 2000. [Google Scholar]
  61. Mileusnić, Z.I.; Petrović, D.V.; Đević, M.S. Comparison of tillage systems according to fuel consumption. Energy 2010, 35, 221–228. [Google Scholar] [CrossRef]
  62. Tabatabaeefar, A.; Emamzadeh, H.; Varnamkhasti, M.G.; Rahimizadeh, R.; Karimi, M. Comparison of energy of tillage systems in wheat production. Energy 2009, 34, 41–45. [Google Scholar] [CrossRef]
  63. Stošić, M.; Ivezić, V.; Tadić, V. Tillage systems as a function of greenhouse gas (GHG) emission and fuel consumption mitigation. Environ. Sci. Pollut. Res. 2021, 28, 16492–16503. [Google Scholar] [CrossRef]
  64. Moitzi, G.; Haas, M.; Wagentristl, H.; Boxberger, J.; Gronauer, A. Energy consumption in cultivating and ploughing with traction improvement system and consideration of the rear furrow wheel-load in ploughing. Soil Tillage Res. 2013, 134, 56–60. [Google Scholar] [CrossRef]
  65. Huang, Y.; Ren, W.; Wang, L.; Hui, D.; Grove, J.H.; Yang, X.; Tao, B.; Goff, B. Greenhouse gas emissions and crop yield in no-tillage systems: A meta-analysis. Agric. Ecosyst. Environ. 2018, 268, 144–153. [Google Scholar] [CrossRef]
  66. Claus, S.; Wienforth, B.; Sieling, K.; Kage, H.; Senbayram, M.; Dittert, K.; Taube, F.; Herrmann, A. Greenhouse gas balance of bioenergy cropping systems under the environmental conditions of Schleswig-Holstein. Grassl.-A Eur. Resour. 2012, 17, 601. [Google Scholar]
  67. Abdalla, K.; Chivenge, P.; Ciais, P.; Chaplot, V. No-tillage lessens soil CO2 emissions the most under arid and sandy soil conditions: Results from a meta-analysis. Biogeoscience 2016, 13, 3619–3633. [Google Scholar] [CrossRef] [Green Version]
  68. Feng, J.; Li, F.; Zhou, X.; Xu, C.; Ji, L.; Chen, Z.; Fang, F. Impact of agronomy practices on the effects of reduced tillage systems on CH4 and N2O emissions from agricultural fields: A global meta-analysis. PLoS ONE 2018, 13, e0196703. [Google Scholar] [CrossRef] [Green Version]
  69. Plaza-Bonilla, D.; Álvaro-Fuentes, J.; Arrúe, J.L.; Cantero-Martínez, C. Tillage and nitrogen fertilization effects on nitrous oxide yield-scaled emissions in a rainfed Mediterranean area. Agric. Ecosyst. Environ. 2014, 189, 43–52. [Google Scholar] [CrossRef] [Green Version]
  70. Ye, X.; Wang, B.; Liu, S.; Ma, C.; Li, J.; Chai, R.; Xiong, Q.; Li, H.; Gao, H. Influence of tillage and straw retention on soil carbon pool and maize-wheat yield in Shajiang black soil. Trans. CSAE 2019, 35, 112–118. [Google Scholar]
  71. Kostyanovsky, K.I.; Huggins, D.R.; Stockle, C.O.; Morrow, J.G.; Madsen, I.J. Emissions of N2O and CO2 following short-term water and N fertilization events in wheat-based cropping systems. Front. Ecol. Evol. 2019, 7, 1–10. [Google Scholar] [CrossRef] [Green Version]
  72. Malobane, M.E.; Nciizah, A.D.; Wakindiki, I.I.C.; Mudau, F.N. Sustainable production of sweet sorghum for biofuel production through conservation agriculture in South Africa. Food Energy Secur. 2018, 7, e00129. [Google Scholar] [CrossRef] [Green Version]
  73. Clark, M.; Tilman, D. Comparative analysis of environmental impacts of agricultural production systems agricultural input efficiency and food choice. Environ. Res. Lett. 2017, 12, 064016. [Google Scholar] [CrossRef]
  74. Martin-Gorriza, B.; Maestre-Valero, J.F.; Almagro, M.; Boix-Fayos, C.; Martínez-Mena, M. Carbon emissions and economic assessment of farm operations under different tillage practices in organic rainfed almond orchards in semiarid Mediterranean conditions. Sci. Hortic. 2020, 261, 108978. [Google Scholar] [CrossRef]
  75. Corrochano-Monsalve, M.; Huérfano, X.; Menéndez, S.; Torralbo, F.; Fuertes-Mendizábal, T.; Estavillo, J.M.; González-Murua, C. Relationship between tillage management and DMPSA nitrification inhibitor efficiency. Sci. Total Environ. 2020, 718, 134748. [Google Scholar] [CrossRef] [PubMed]
  76. Omara, P.; Aula, L.; Eickhoff, E.M.; Dhillon, J.S.; Lynch, T.; Wehmeyer, G.B.; Raun, W. Influence of no-tillage on soil organic carbon, total soil nitrogen, and winter wheat (Triticum aestivum L.) grain yield. Int. J. Agron. 2019, 2019, 9632969. [Google Scholar] [CrossRef]
Figure 1. Study site.
Agronomy 12 02713 g001
Figure 2. Scheme of tillage and sowing technological operations: CT—conventional tillage; MT—minimal tillage; NT—no tillage; DS—direct sowing; STS—strip tillage and sowing.
Agronomy 12 02713 g002
Figure 3. Contribution of different inputs to diesel fuel consumption and saving compared to CT technology.
Agronomy 12 02713 g003
Figure 4. Time inputs in different tillage and sowing technologies.
Agronomy 12 02713 g004
Figure 5. Total energy input in winter rape production for different tillage and sowing technologies and EER, energy productivity, and energy reduction.
Agronomy 12 02713 g005
Figure 6. Contribution of different inputs in CO2eq for winter wheat production.
Agronomy 12 02713 g006
Table 1. Description of winter wheat cultivation technologies using different tillage and sowing methods.
Technological OperationsTreatment
CT–DSCT–STSMT–DSMT–STSNT–STSNT–DS
Soil preparationStubble cultivation
(10–12 cm)
-
Deep ploughing
(22–25 cm)
Spraying herbicide
(2.0 l ha−1)
-
Pre-sowing cultivation
(3–5 cm)
Stubble cultivation (10–12 cm)Spraying herbicide
(2.0 l ha−1)
SowingDirect sowing
(180 kg ha−1)
Strip tillage and sowing (180 kg ha−1)Direct sowing
(180 kg ha−1)
Strip tillage and sowing (180 kg ha−1)Strip tillage and sowing
(180 kg ha−1)
Direct sowing
(180 kg ha−1)
Spraying and
fertilization
Spraying (herbicide 0.4 l ha−1)
Fertilization (ammonium nitrate 2 × 180 kg ha−1)
Spraying (growth regulator 1.2 l ha−1)
Spraying (amino acids 1.0 l ha−1)
Spraying (growth regulator 1.2 l ha−1)
Spraying (fungicide 1 × 0.5 l ha−1, 1 × 0.25 l ha−1, 1 × 0.8 l ha−1)
Spraying (growth regulator 0.7 l ha−1)
Fertilization (ammonium nitrate 100 kg ha−1)
Harvesting
Transportation of winter wheat (distance 30 km)
Table 2. Values of energy equivalents for different agricultural components.
Energy Inputs and OutputsEnergy Equivalent/UnitReferences
Human labor
Diesel fuel
1.96 MJ h–1
39.6 MJ L–1
[25]
[26]
Agricultural machinery
Seed of winter wheat
Herbicides
Fungicides
Nitrogen
Winter wheat yield
357.2 MJ kg–1
14.7 MJ kg–1
295.0 MJ kg–1
115.0 MJ kg–1
40.0 MJ kg–1
14.7 MJ kg–1
[25]
[27]
[28]
[29]
[26]
[30]
Table 3. Agricultural machinery operations and indicators for winter wheat production.
Technological
Operations
Power
(kW)
Working Width (m)Capacity
(ha h−1)
Time
(h ha−1)
Fuel
(L ha−1)
Deep ploughing
Stubble cultivation
Pre-sowing cultivation
Direct sowing
Strip tillage and sowing
Fertilization
Spraying
Harvesting
Transportation (30 km)
102
102
83
83
83
67
67
161
102
1.75
4.00
6.00
4.00
4.00
24.00
24.00
5.00
24.00 * t
0.94
2.90
4.00
3.10
2.98
14.99
12.18
1.23
-
1.06
0.34
0.25
0.32
0.34
0.07
0.08
0.81
3.00
23.60
8.40
5.70
6.20
6.40
0.60
0.85
19.50
58.00
* Harvest is transported by a trailer with a capacity of 24.00 t.
Table 4. CO2 values for different agricultural components.
Inputs and OutputsCO2 Equivalent/UnitReferences
Diesel fuel2.76 kg CO2eq MJ−1[35]
Agricultural machinery0.071 kg CO2eq L−1[36]
Seed of winter wheat0.58 kg CO2eq kg−1[37]
Herbicides6.3 kg CO2eq kg−1[38]
Fungicides3.9 kg CO2eq kg−1[38]
Insecticides5.1 kg CO2eq kg−1[38]
Nitrogen1.3 kg CO2eq kg−1[39]
Sulfur0.072 kg CO2eq kg−1[40]
Biopreparation4.3 kg CO2eq kg−1[41]
Wheat production0.58 kg CO2eq kg−1[42]
Table 5. Yield and energy efficiency indicators of winter wheat production.
Tillage
and
Sowing Technology
Average Yield
t ha−1
Energy Outputs MJ ha−1Energy Efficiency RatioSpecific Energy MJ kg−1Energy Productivity kg MJ−1Net
Energy
MJ ha−1
CT–DS
CT–STS
MT–DS
MT–STS
NT–STS
NT–DS
LSD0.05
6.965 a
6.950 a
7.015 a
6.963 a
7.278 a
7.545 a
1.026
139,300.000 a
139,000.000 a
140,300.000 a
139,250.000 a
145,550.000 a
150,900.000 a
20,529.459
7.598 a
7.576 a
8.310 ab
8.241 ab
8.852 b
9.185 b
1.207
2.652 a
2.650 a
2.432 ab
2.445 ab
2.276 b
2.195 b
0.367
0.380 a
0.379 a
0.416 ab
0.412 ab
0.443 b
0.459 b
0.060
120,966.520 a
120,651.420 a
123,416.910 a
122,351.810 a
129,106.550 a
134,471.660 a
20,529.459
Note: The same letters (a, b) do not indicate significant difference between technologies.
Publisher’s Note: MDPI stays neutral with regard to jurisdictional claims in published maps and institutional affiliations.

