Article

Legume Overseeding along with P Fertilization Increase Forage Production of Temperate Natural Grasslands

1
Departamento de Sistemas Ambientales, Facultad de Agronomía, Universidad de la República, Av. Gral. Eugenio Garzón 780, Montevideo 12900, Uruguay
2
IFEVA, Facultad de Agronomía, Universidad de Buenos Aires, CONICET, Av. San Martin 4453, Buenos Aires C1417DSE, Argentina
3
Instituto Nacional de Investigación Agropecuaria, Ruta 8 km 281, Treinta y Tres 33000, Uruguay
*
Author to whom correspondence should be addressed.
Agronomy 2022, 12(10), 2507; https://doi.org/10.3390/agronomy12102507
Submission received: 8 September 2022 / Revised: 6 October 2022 / Accepted: 8 October 2022 / Published: 14 October 2022
(This article belongs to the Special Issue Advance in Grassland Productivity and Sustainability)

Abstract

:
Legume overseeding along with P fertilization is a common practice used in natural temperate and subtropical grasslands to increase forage production. This practice has been evaluated at experimental plots but not at the paddocks level of commercial farms. The latter are realistic evaluation units to generate knowledge for livestock management. In this study, the enhanced vegetation index (EVI), a proxy of forage production, was used to evaluate the effect of this practice on grazed paddocks in Uruguay. Twenty paired paddocks under similar grazing conditions were selected with natural grassland (NG) and natural grassland with legume overseeding and P fertilization (NG-LP). Paired paddocks were compared in terms of EVI mean and its temporal variability. After nine years of the intensification practice, mean annual EVI of NG-LP was 4% higher than that of NG, while the mean winter–spring EVI of NG-LP was 7.5% higher. EVI intra- and inter-annual variability of NG-LP was 8–11% higher than that of NG. Additionally, forage production was estimated using a radiative transfer model. Differences between NG-LP and NG were amplified six to seven times. Legume overseeding along with P fertilization increased forage production in pastoral livestock paddocks, particularly in the period of forage deficit, while it also increased intra and inter-annual variability of forage production.

1. Introduction

Forage production is one of the factors that most affects the efficiency of pastoral livestock farms [1,2]. It is a determinant of stocking rates at the intra-regional resolution, and it is a key variable in implementing the sustainable management of livestock systems [3,4]. In the past, forage production data were very scarce on pastoral livestock farms due to the difficulty of its estimation [5]. Currently, forage production can be estimated with high spatial and temporal resolution based on remotely sensed vegetation indexes [6,7,8]. These advances have consolidated forage monitoring systems on pastoral livestock farms [2]. Consequently, it is now possible to analyze the effects of management practices on the quantity and variability of forage production [9].
In Uruguay, pastoral livestock farms are mainly based on the forage production of natural grasslands [10]. Natural grassland is a forage resource characterized by a high diversity of species, a marked forage production seasonality and a moderate or low nutritional value [11,12,13]. Natural grassland areas have been declining in recent decades, mainly being replaced by agriculture in most productive soils and by afforestation in less productive ones [14,15,16]. The decrease in natural grassland areas has occurred without a national herd reduction [17]. Consequently, grazing pressure has increased on the remaining natural grassland area. On the one hand, a higher grazing pressure may cause degradation, mainly due to a decrease both in canopy leaf area index, thus vegetation cover, and a replacement by less productive species [18,19,20]. On the other hand, there is a growing international food demand for human consumption, particularly animal protein, linked to a 30% increase in the global population over the last 20 years [21,22]. Therefore, to compete with other land use activities, such as annual crops and afforestation, and to supply the growing protein demand, it is necessary to increase the productivity of livestock farms.
One way to increase the productivity of pastoral livestock farms is through intensification practices to raise forage production. Intensification practices, also called input-based technologies, are extensively used in the world and are frequently used in Uruguay. Their objective is to augment productivity by increasing forage production and/or forage nutritive value. In addition, these practices are carried out with the objective of minimizing the possible negative effects of climatic events such as drought [23,24]. Overseeding natural grasslands with exotic leguminous species, generally in the winter–spring cycle, coupled with P fertilization (hereafter NG-LP), is an intensification practice applied in the rangelands of Oceania, Africa, Asia, and South America [25,26,27]. In Uruguay, P fertilization is performed with different doses and applications according to legume persistence from over-seeding. NG-LP occupies more than 40% of the Uruguayan intensified livestock area (4.1% of Uruguay’s productive area, [10]). NG-LP has been recommended by public and private institutions as an alternative practice to sowing grass pastures and/or exotic legumes, due to its short-term benefits and because it avoids the total replacement of the original natural grassland cover (hereafter NG; [28]).
NG-LP generally increases short-term forage production, although it may cause negative impacts by ecosystem structure degradation. Knowledge about the long-term effects of NG-LP on forage production is very scarce. On the one hand, a decrease in forage production of NG-LP through time has been reported in a few studies, as a consequence of an important loss of stability [28,29,30,31]. On the other hand, NG-LP has generated degradation through a decrease in species diversity, a loss of high-value forage species [32,33] and an increase of exotic plant species of low productive value [33,34,35]. In other contexts, declines in species diversity of NG have been associated with decreases in forage production stability [36,37] and system resilience to stressful conditions [38,39,40,41].
NG-LP practice has been evaluated at experimental plots over short terms but not at the managerial unit level, as paddocks, over longer terms. The latter are realistic evaluation units used to generate knowledge for livestock management. Furthermore, this contrasts with the current need for public policy definitions and research trends toward the use of large spatial and temporal scales [42]. In the context of global change and increased climate variability, where extreme weather events are identified as one of the main hazards for South American and, particularly, for Uruguayan production systems [43,44], it is especially relevant to provide inputs for adaptation to future scenarios. In this sense, moving from punctual controlled experiments to real commercial situations under different environmental conditions becomes particularly appropriate. For example, the positive effects of NG-LP on C, N, P soil retention reported in experimental conditions [45] are under discussion in real commercial farms [46]. Large-scale unreplicated natural experiments allow researchers to use real situations to describe and analyze processes occurring at larger spatial and temporal scales [47]. This type of experiment has been used to evaluate anthropogenic activities at larger spatial scales, generating unique complementary findings with classical or lab studies [48]. In this study, the medium-term effects of NG-LP on the magnitude and variability of a proxy of forage production was assessed in a large set of paddocks in commercial pastoral livestock farms using a vegetation index time series from satellite imagery.

2. Materials and Methods

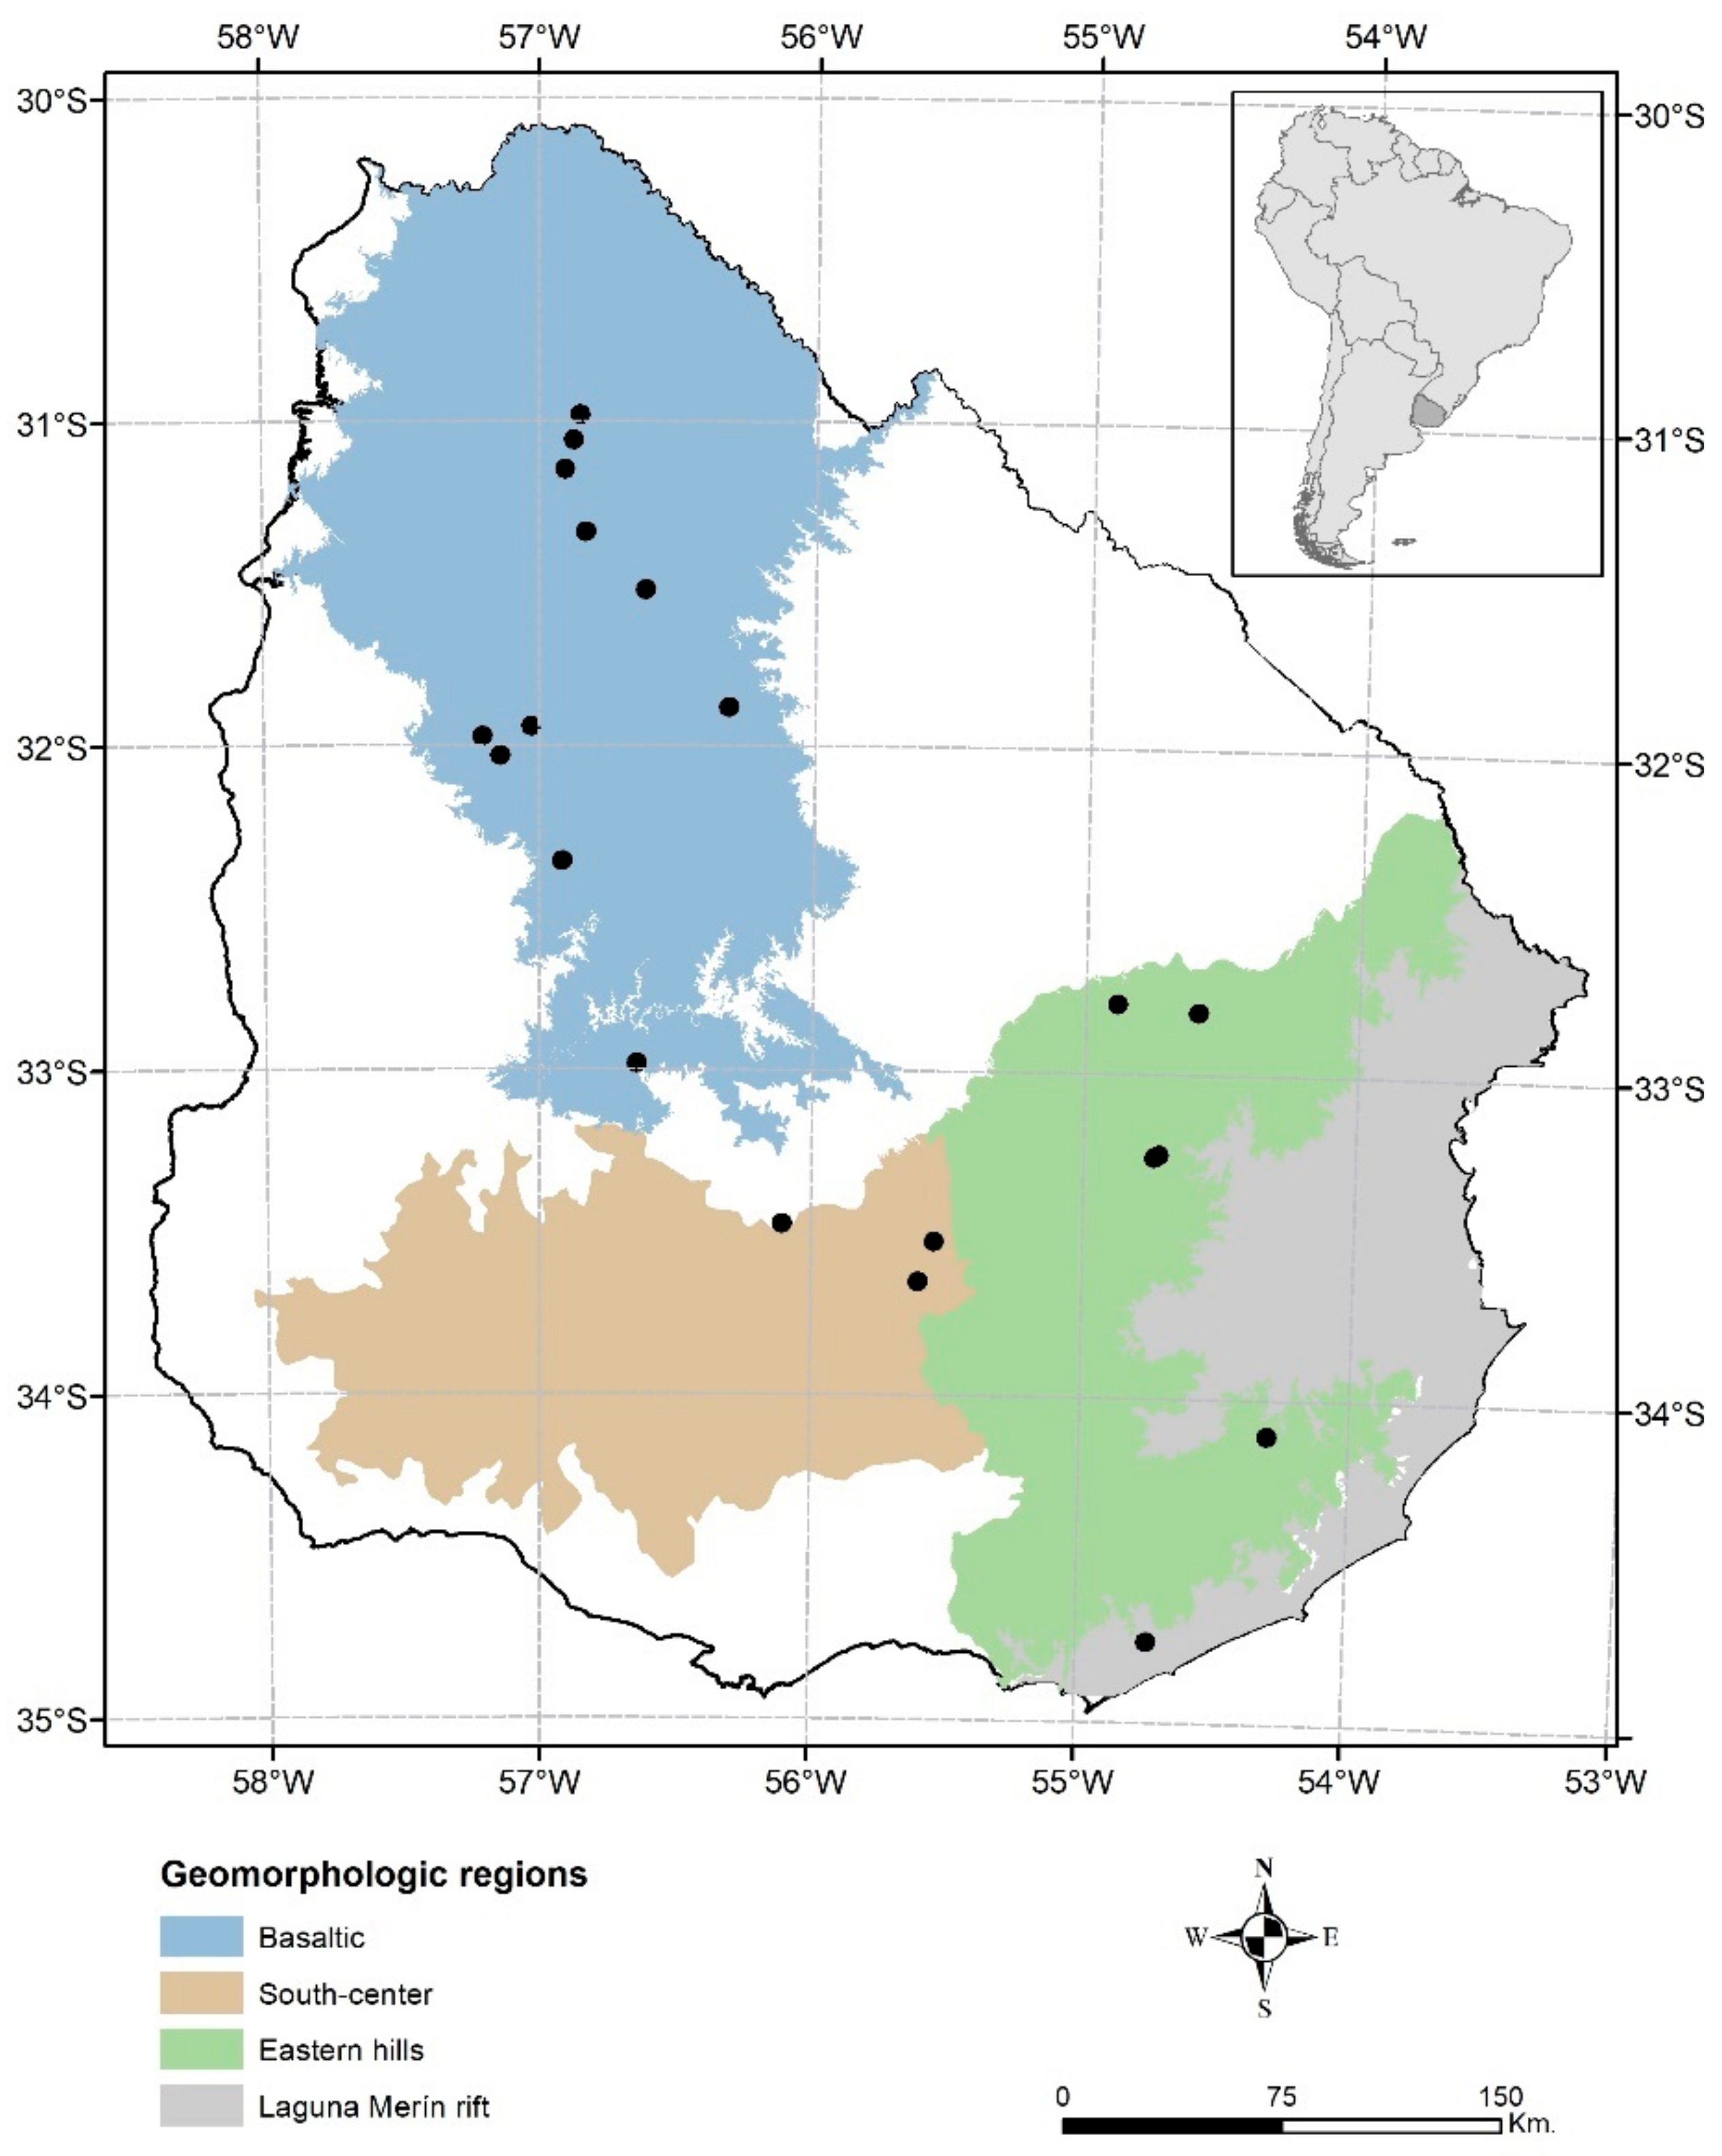
The study was carried out on natural and semi-natural grasslands of four geomorphological regions of Uruguay where domestic cattle grazing is a main disturbance: Cuesta Basáltica, Sierras y Colinas del Este, Escudo Cristalino, and Graven de la Laguna Merin [49] (Figure 1). Uruguayan grasslands are characterized by different combinations of C3 and C4 grasses and a broad assemblage of herbs [11]. The grassland’s structure differs among geomorphological regions. Within each geomorphological region, the grassland’s structure is fundamentally driven by macro topographic features and edaphic factors operating at the landscape scale. In terms of functioning, these grasslands also differ among regions [50]. Although the seasonal dynamics are similar, forage production differs between geomorphological regions and grassland communities of each unit [51,52,53,54]. Currently, virtually all of Uruguay’s natural grasslands are under grazing, and represent the forage base of pastoral livestock systems [10].

2.1. Paddocks

The experiment was performed in private commercial cattle farms linked to projects for monitoring the impact of natural grassland management on productivity and sustainability, whereby a detailed and reliable information of farms management were available. The farms were located on natural grassland with grazing mostly by cattle and, to a lesser extent, mixed cattle-sheep. In each farm, a pair of paddocks were selected. One paddock was intensified for the first time with input-based technology. The intensification practice used as treatment was overseeding legume species in the natural grassland coupled with phosphorus fertilization. The legume species included were Lotus Rincon (Lotus subbiflorus), Lotus Maku (Lotus pedunculatus), and Lotus angustissimus or white clover (Trifolium repens). In most of the paddocks, sowing was broadcast according to recommendations using a seed concentration between 3–12 kg/ha depending on the type of legume [29,33]. The fertilization applied was phosphorite, ammonium phosphate and superphosphate + phosphorite, separately or in combination (Table A1). Another paddock, adjacent or nearby (see below), was covered by a natural grassland, without the intensification practice, of an equal soil type and landscape position and with similar grazing management.

2.2. Experiment and Database Design

Twenty pairs of paddocks were selected. In each pair, one paddock was intensified by seeding legumes and phosphorus fertilization (NG-LP), and another adjacent or nearby paddock with non-intensified natural grassland (NG) as a control. This design aimed to exclude local environmental conditions effects (precipitation, temperature, soil type, etc.). Paddocks were intensified in the 2004–2013 period. Limits of paddocks were digitized and added to a Geographic Information System and overlaid on the MODIS Enhanced Vegetation Index data (EVI, MOD13Q1.006 Terra Vegetation Indices product). The EVI MODIS images have a spatial resolution of 250 m and a temporal resolution of 16 days. MODIS pixels were selected if they were completely included inside the paddock, avoiding wet lowlands, presence of trees, roads, etc. High resolution images available on Google Earth Engine platform were used for pixel selection [55].
Each of the 12 NG paddocks were selected inside the same farm when the NG-LP paddocks were established. The remaining eight NG paddocks were selected within a radius of 3000 m close to each NG-LP paddock, using EVI time series of pixels prior to intensification practice data as reference. Based on this time series, the NG pixels with the highest similarity or smallest Euclidean distance [56] and no change in cover/land use were selected.
The database was generated with MODIS EVI time series data of each selected pixel. Quality and cloud cover filter were applied to images, and missing data were interpolated by immediate before and after date EVI average in the Google Earth Engine platform. The data time range was from 18 February 2000 to 30 September 2021. A new time called “Year to intensification practice” was created since the intensification practice of NG-LP paddocks was not carried out in the same year. This variable relates the date of the EVI value to the year in which the intensification practice was carried out and was calculated as follows:
Year to intensification practice = EVI data year − Paddock intensification year
For example, if the paddock intensification practice was in 2013, for EVI values during 2020 the “Year to intensification practice” was 7. In contrast, if the paddock intensification practice was in 2016, for EVI values during 2020 the “Year to intensification practice” was 4.

2.3. Data Analysis

The effect of the intensification practice on inter- and intra-annual EVI magnitude and variability was performed by two-way repeated measures ANOVA, using treatment (NG and NG-LP) as an independent factor in all cases. Mean EVI for magnitude and Coefficient of Variation (CV) for variability analysis were used as dependent variables. Inter-annual and intra-annual analysis was performed using month and year to intensification practices as independent factors, respectively. When a statistically significant interaction between factors was found, Sidak’s post hoc test for multiple comparisons was used, with a 95% confidence interval. In all cases, two separate data sets were analyzed, corresponding to the period before and after intensification practice was performed. A set of four years prior to intensification practice (from −4 to −1) and a set along nine years since intensification practice (Year 0 inclusive) were considered. Data analysis was performed in R Studio 4.2.0 (PBC) and GraphPad Prism 8.0.2 (Dotmatics software corporation).

3. Results

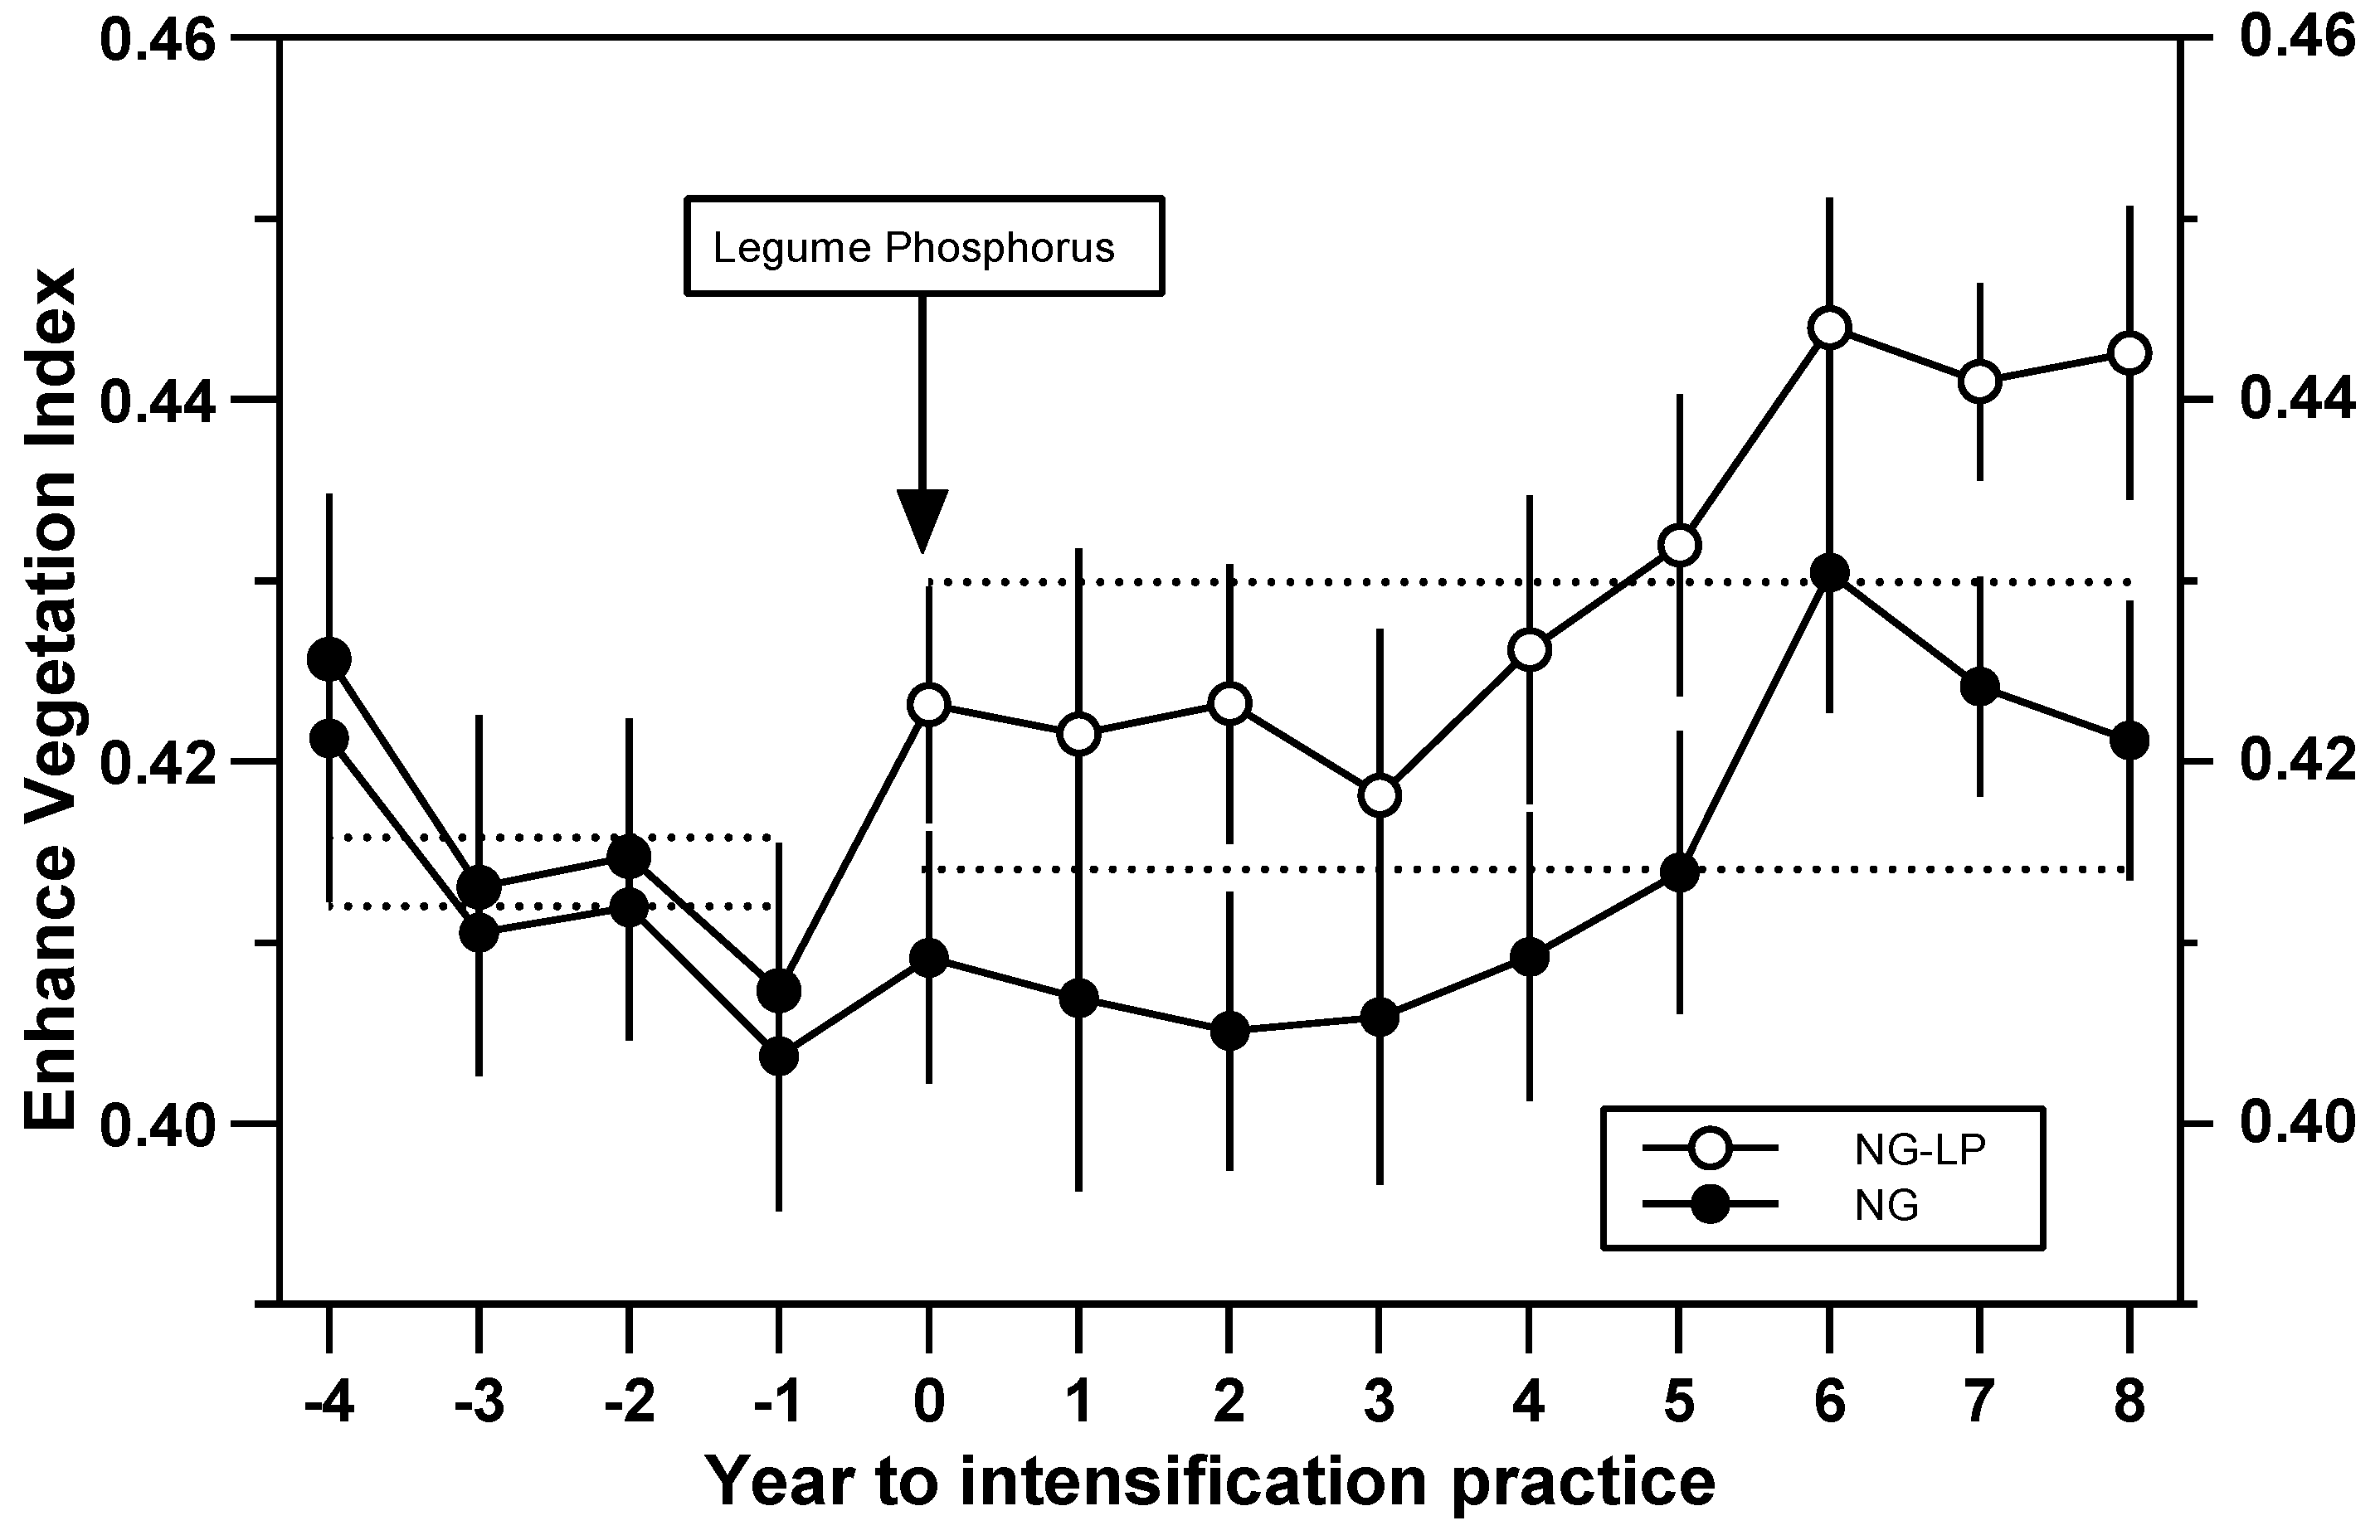
During the four years before the intensification practice, mean EVI was similar among each pair of paddocks (F = 0.6, p value = 0.45), with no change between years (F = 1.5, p value = 0.21, Table A2). In contrast, over nine years since the intensification practice, the mean annual EVI of NG-LP was 4% higher than that of NG (F = 18.9; p value < 0.05), with similar inter-annual variations for both treatments (non-significant interaction; F = 0.5, p value = 0.85; Figure 2; Table A3). Table A4 shows the inter-annual EVI mean for Treatment × Year to intensification. These differences were time and space variables, and the maximum mean annual EVI between NG-LP and NG was 27.6% in Cuesta Basáltica region five years after intensification practice, while there were no differences in South-Central’s region three years after the intensification practice.
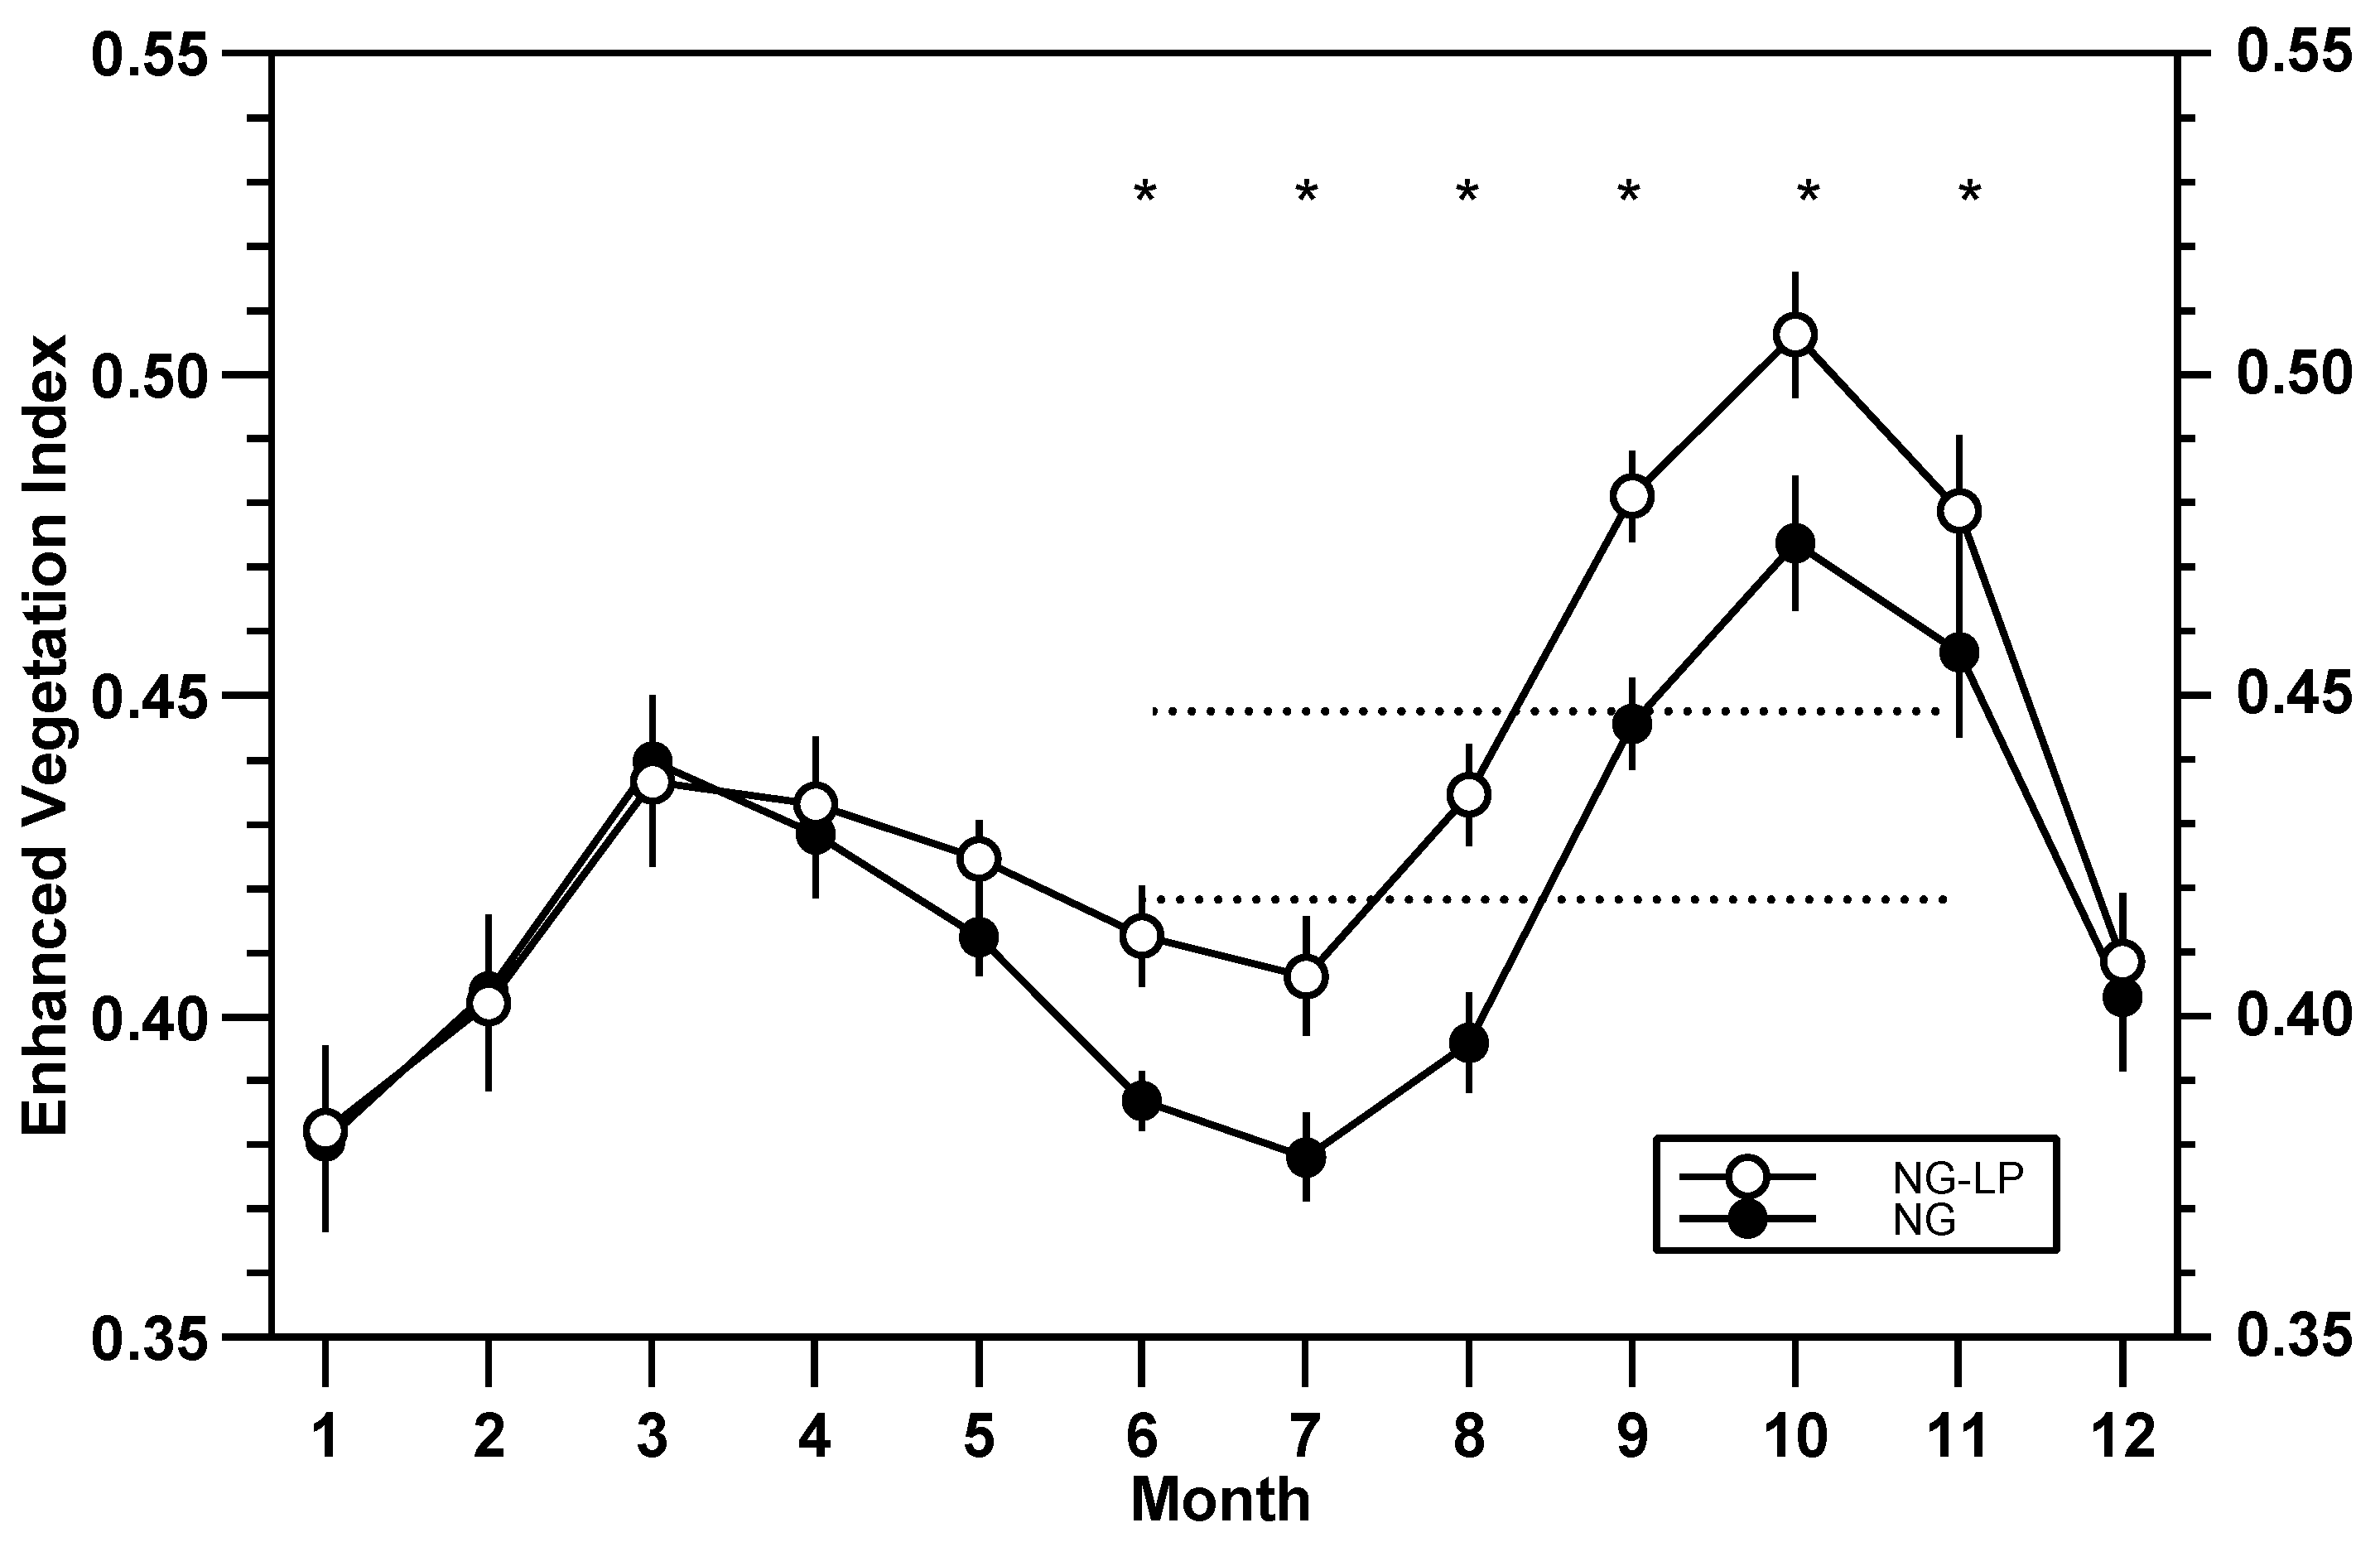
The intra-annual EVI mean was similar between paddocks before intensification practice (F = 0.75, p value = 0.40), showing a seasonal pattern (F = 12.4, p value < 0.0001) that was not affected by intensification practice (F = 0.85, p value = 0.59, Table A5). In contrast, over nine years of the intensification practice, mean winter–spring EVI of NG-LP was 7.5% higher than that of NG (significant interaction; T = 4.2, p value < 0.05), while the maximum difference was 9.7% in August, and null difference was in January and February (Figure 3; Table A6).
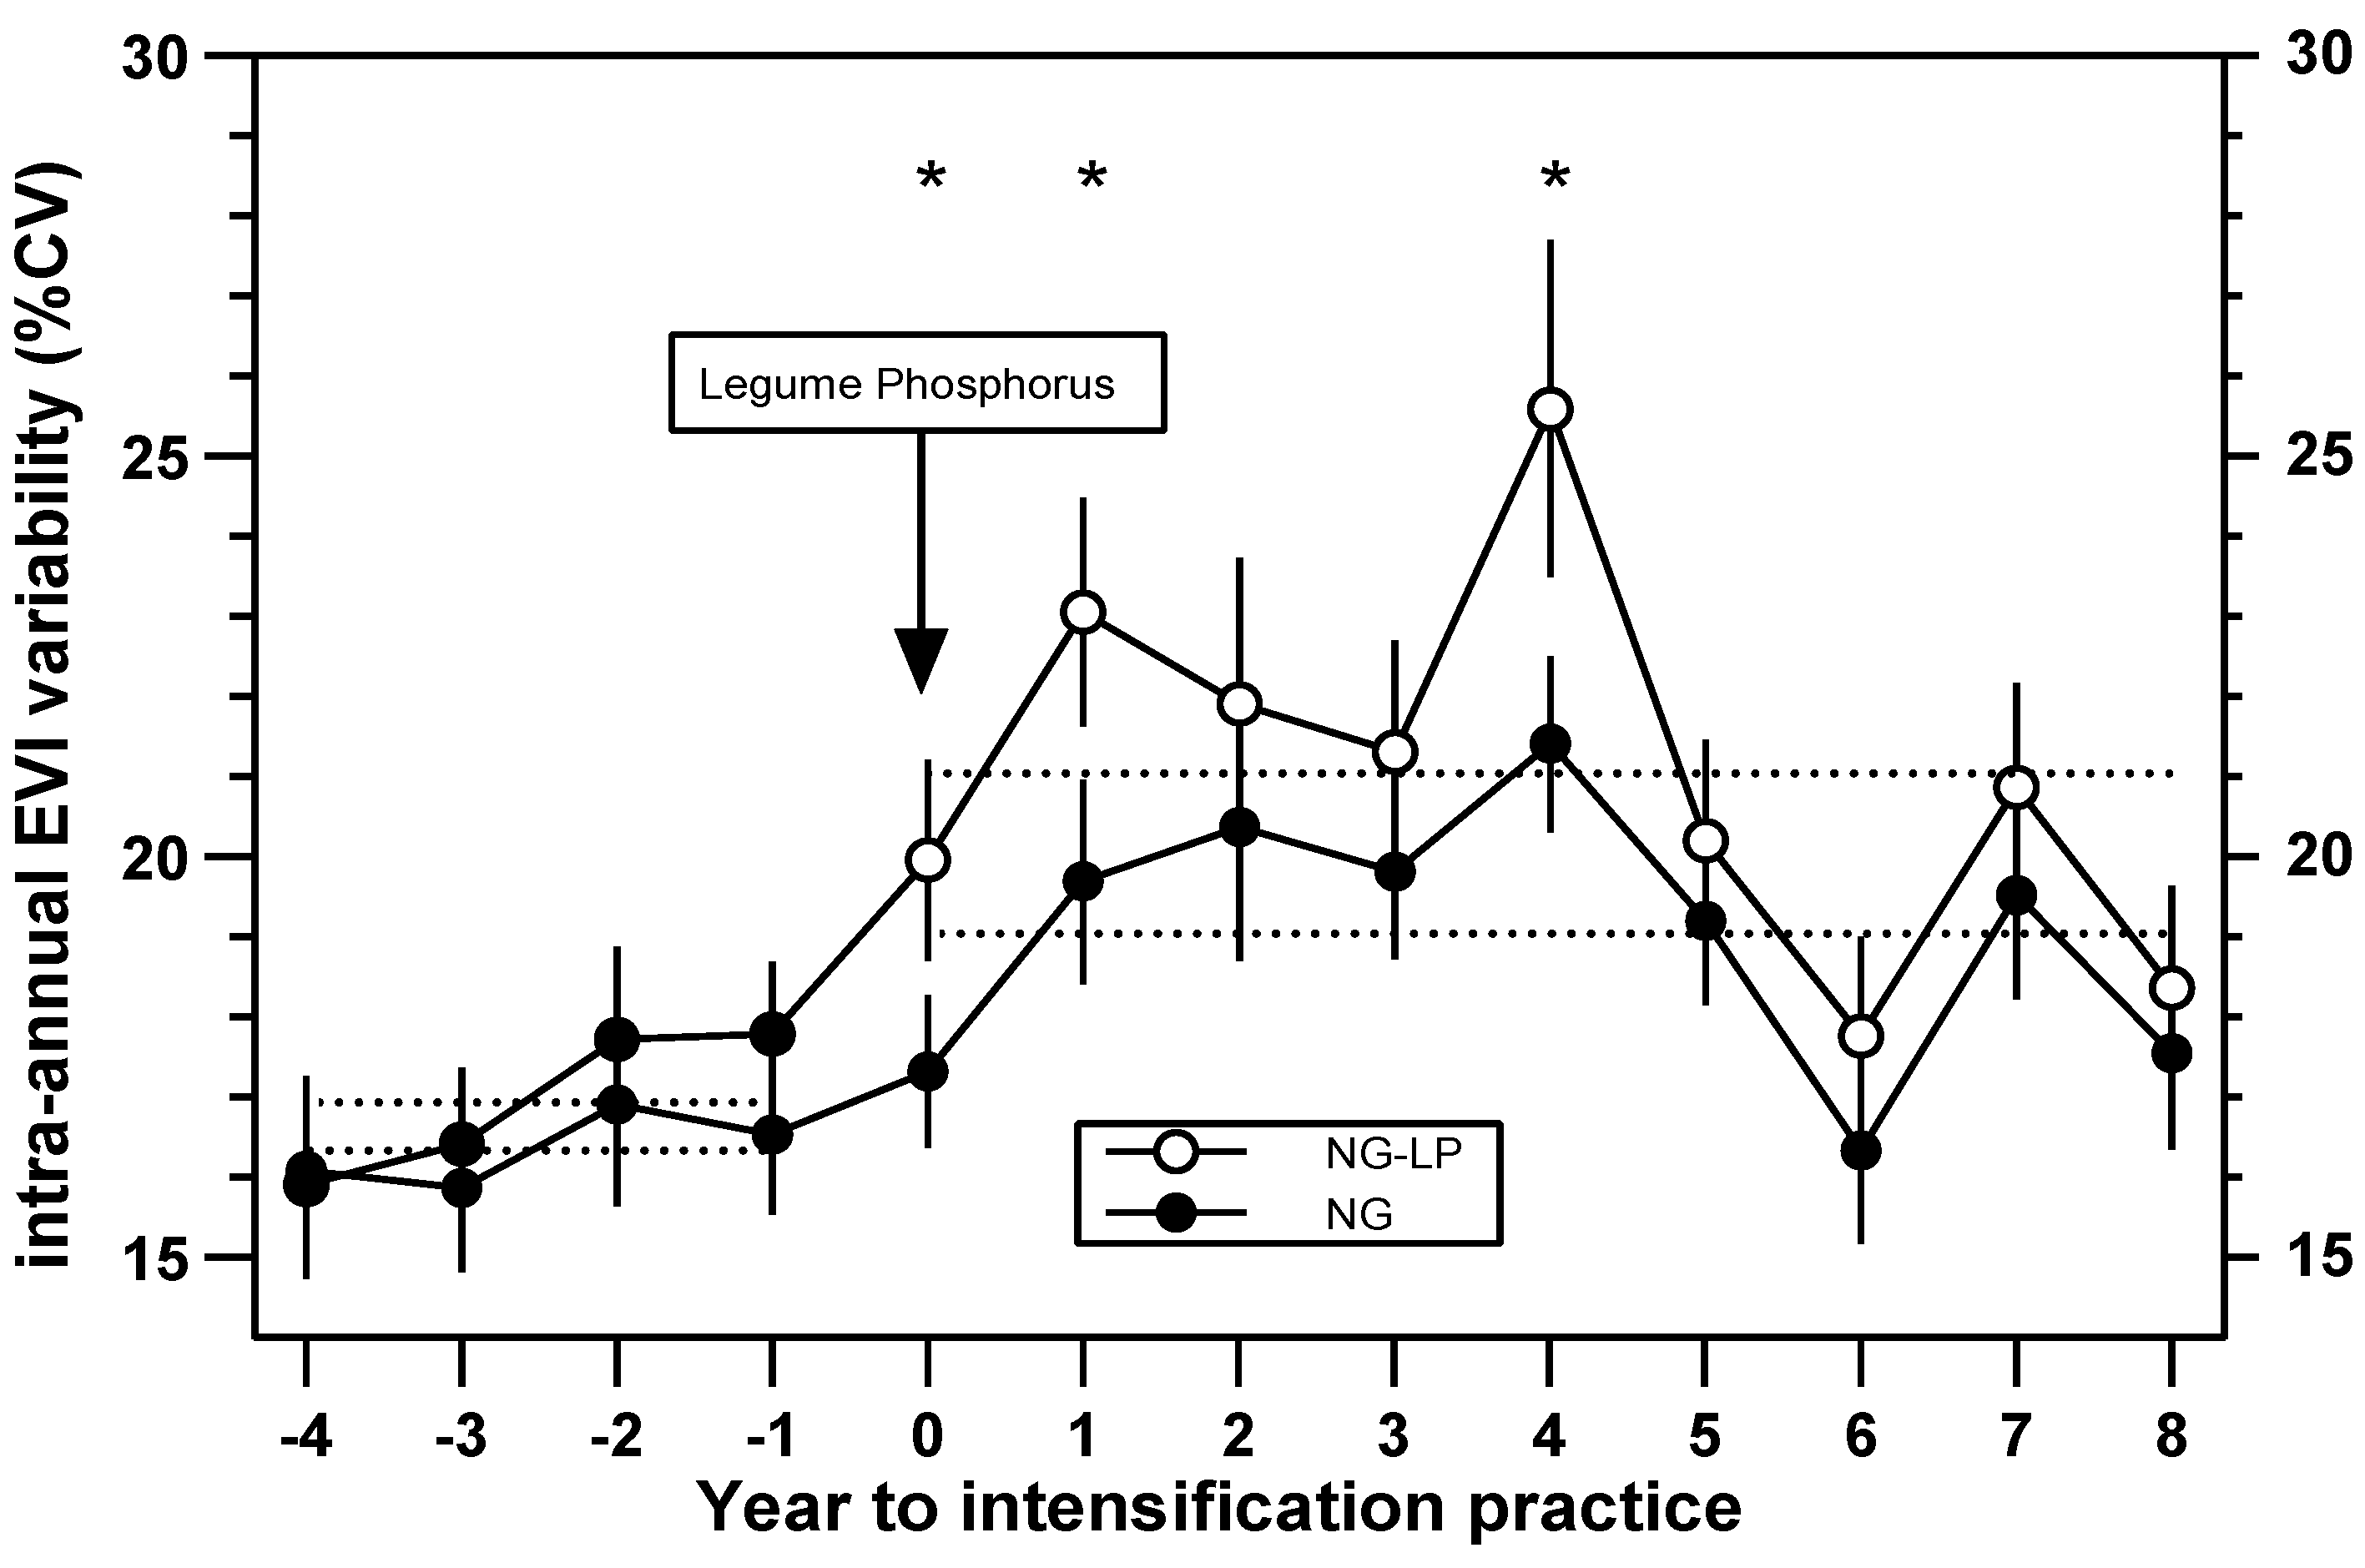
Before the intensification practice, intra-annual EVI variability was similar between NG and NG-LP (F = 4, p value = 0.06), with no year effect (F = 1.5, p value = 0.21) and no significant interaction Year × Treatment effect (F = 1.6, p value = 0.21, Table A7). In contrast, intra-annual EVI variability of NG-LP was 10% higher than NG during the nine years of the intensification practice (F = 24.1, p value < 0.0001, Figure 4). It also presented changes over time, with significant interaction Year × Treatment effect (F = 2, p value < 0.05): only three of the first five years after intensification were different between NG and NG-LP (T ≥ 3.2, p value p ≤ 0.05; Figure 4; Table A8). The maximum difference between NG and NG-LP was observed in year 4 (19.5%), while no differences were recorded in subsequent years (years 5 to 8; Figure 4).
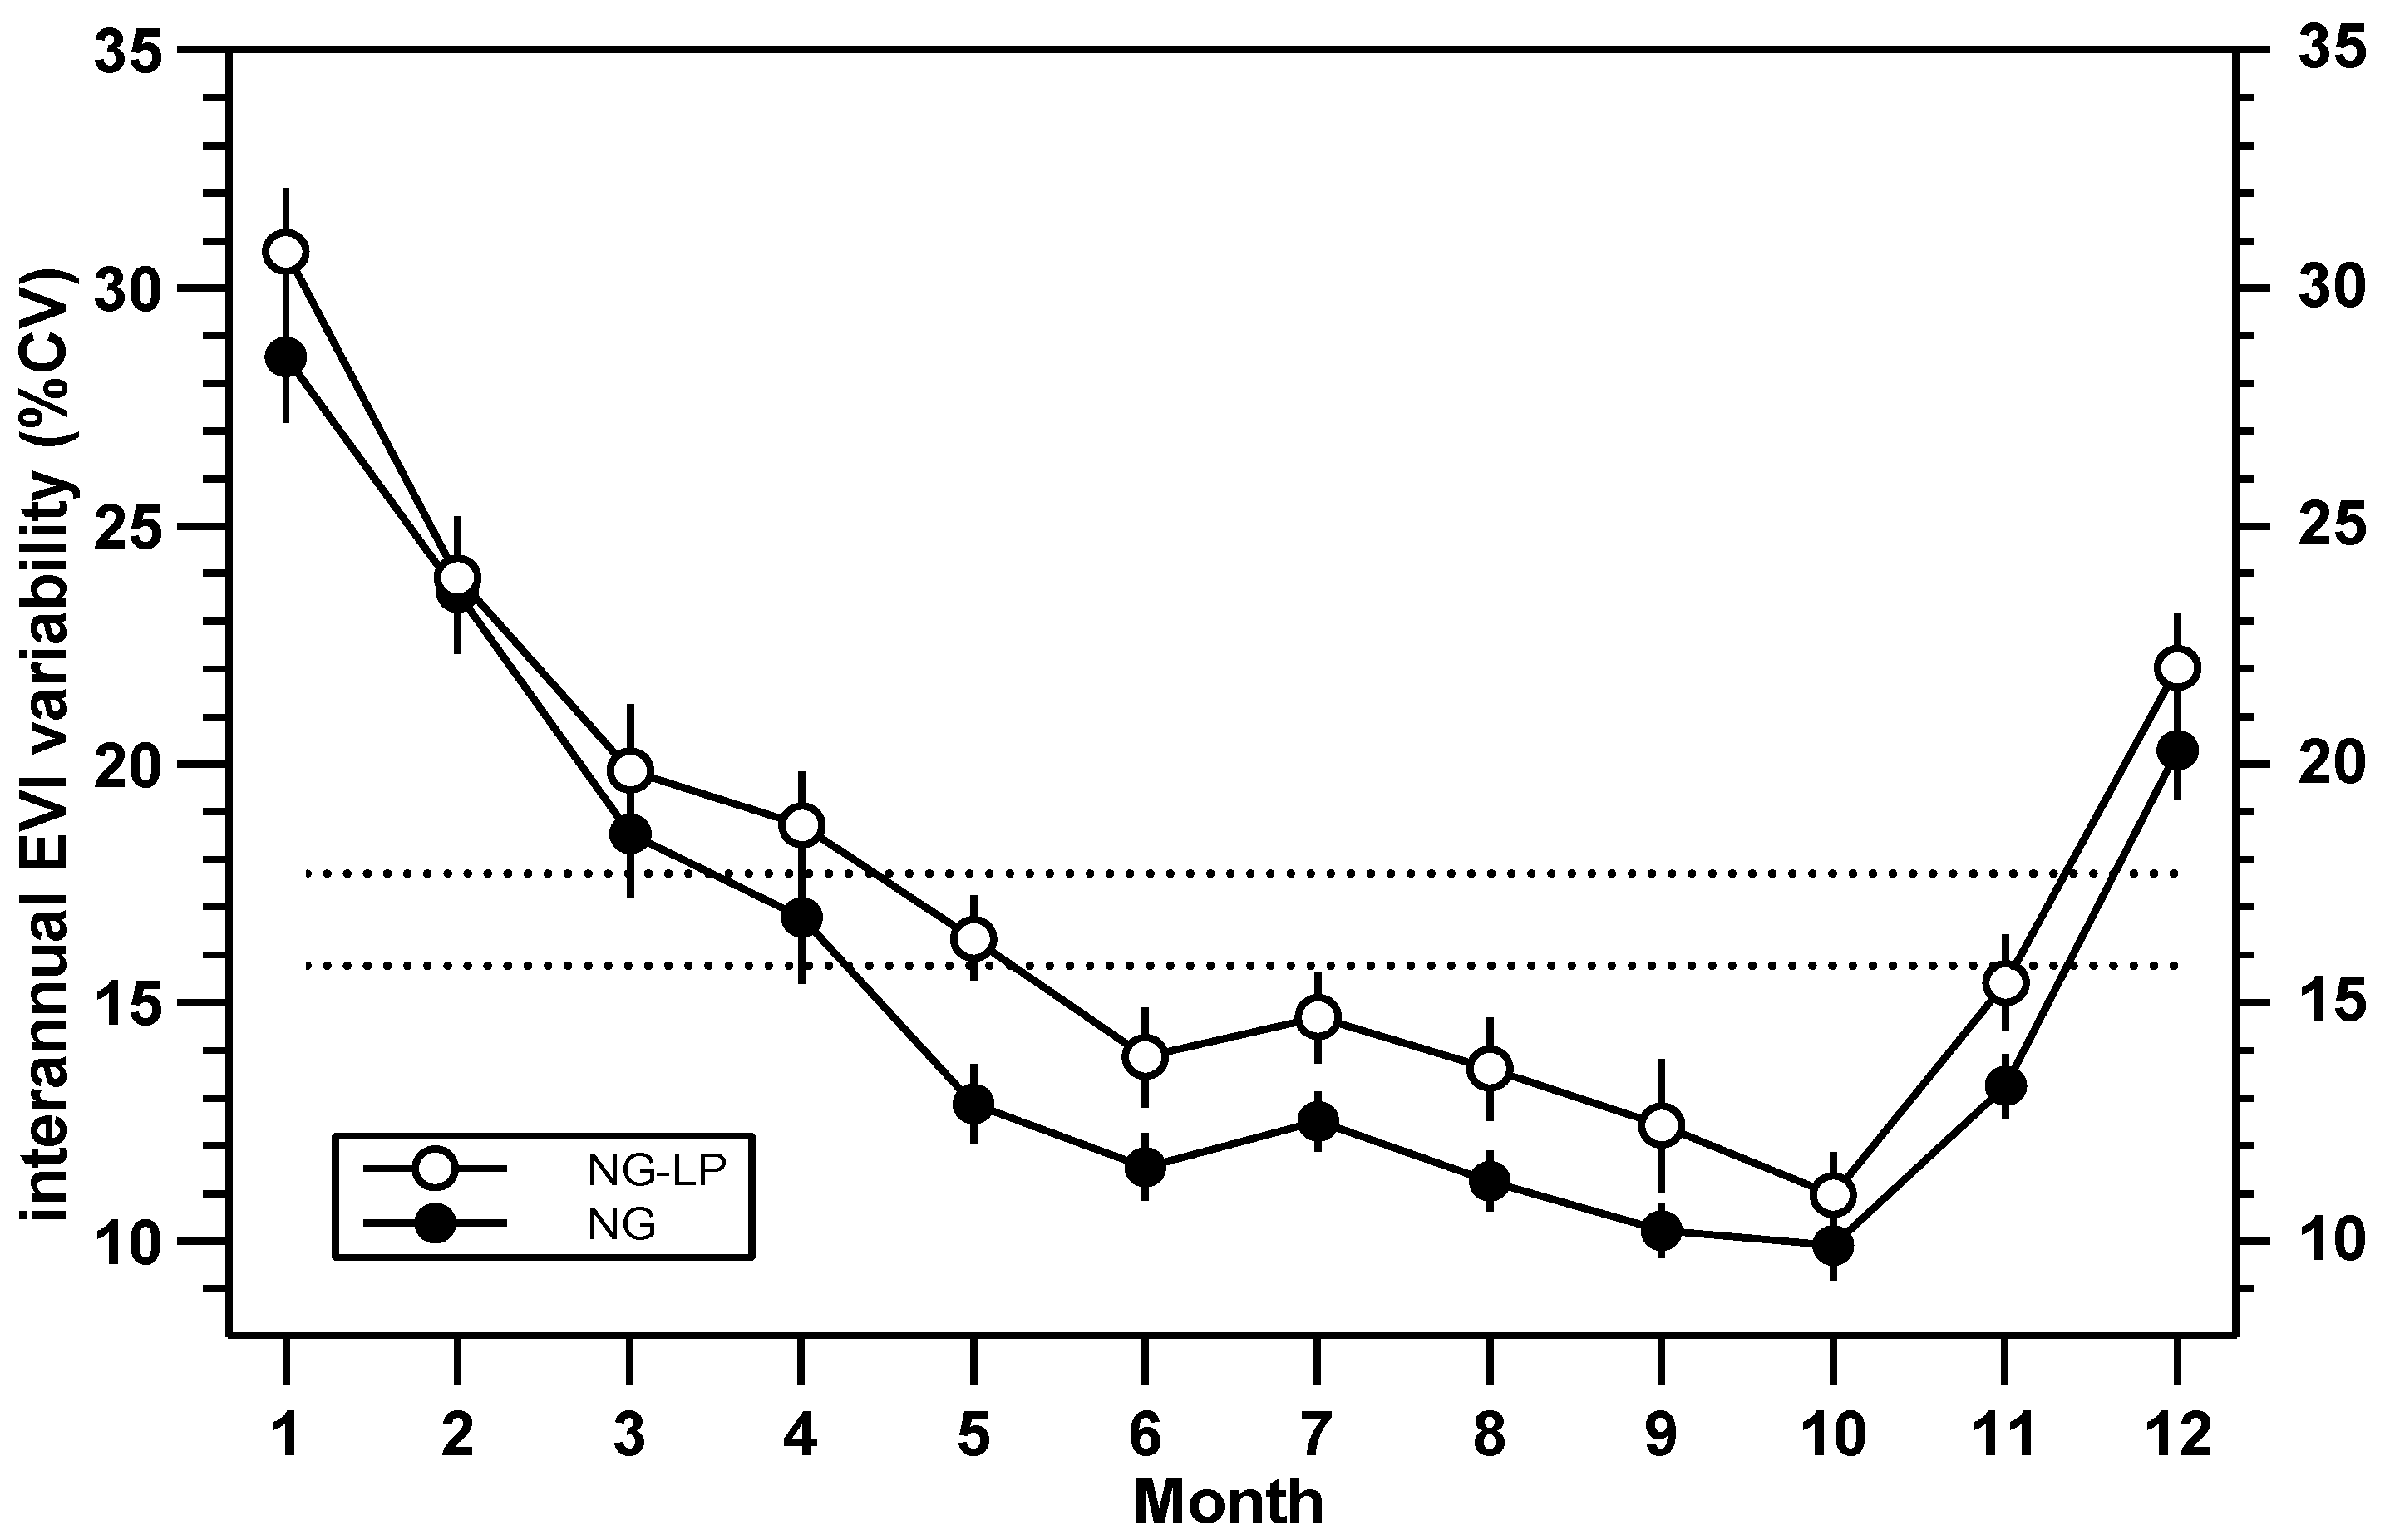
Before the intensification practice, interannual EVI mean variability of NG-LP was similar to that of NG (F = 0.1, p value = 0.797), but differed between months (F = 10.6, p value < 0.0001; Table A9). In contrast, along 9 years since intensification practice, NG-LP interannual EVI mean variability was 12% higher than that of NG (F = 14.8, p value < 0.05, Figure 5). Interannual EVI variability presented, similarly in NG and NG-LP treatments (F = 1.2, p value = 0.29; Table A10), a marked seasonal pattern, with maximum interannual variability values in summer and minimum in winter–spring (F = 49.9, p value < 0.0001).

4. Discussion

This study shows, for the first time at the paddock level, that legume overseeding along with P fertilization increased forage production and its temporal variability of temperate natural grasslands. Medium-term forage production of NG-LP and its temporal variability has been scarcely evaluated beyond a few controlled experiments. Here, a database was carefully curated to use commercial farms as natural experiments. In this sense, each intensified paddock (NG-LP) was matched with a control paddock (NG) under same environmental and management conditions. In this way, potential covariables that could confound the effect generated by intensification on forage production were controlled. In addition, differences were evaluated also for four years before intensification practice, that allowed for the linking of forage production effects with the intensification practice.

4.1. Increase of Forage Production

These results showed that forage production of NG-LP was higher than that of NG, both at annual and seasonal resolutions. The forage production increase generated by this intensification practice has been reported in previous studies, mainly under experimental conditions and by repeated biomass harvests. In Uruguay, del Pino et al. [31] found a forage production increase of 25% and 35%, eight years after an intensification practice with two levels of phosphorus fertilization, respectively. Also in Uruguay, Pañella et al. [35], analyzed NG-LP with different phosphorus doses over three years at two sites, reporting forage production increases of approximately 90% and 130% for two fertilization levels in the first year and exclusively for one site. In Brazil, Ferreira et al. [57] found even greater differences after one year of the intensification practice, with a forage production increase of 150%. As in this study, differences are concentrated in winter and spring, while in summer and autumn differences were not recorded [57].
Some remote sensing studies that used vegetation indexes to estimate forage production agreed with the forage production increase of NG-LP found in these results. Baeza et al. [52] estimated Radiation Use Efficiency (RUE) and grasslands forage production in the Eastern Hills region of Uruguay and report higher average values in NG-LP than in NG. They report that maximum of forage production of NG in November was doubled for NG-LP. In another study, Pagnanini et al. [58] report higher forage production values in NG-LP than in NG, analyzing commercial farms in four geomorphological regions of Uruguay, but they did not perform the paired situations analysis used in this study.
Although EVI difference between NG and NG-LP obtained in this study is relatively small (4–7.5%), differences were amplified when models were used to estimate forage production. Using published national average values of incoming photosynthetically active radiation [59], and radiation use efficiency calculated for NG and NG-LP for Uruguayan grasslands [52], the 4% EVI difference between treatments amplified to 28% in terms of forage production (12,800 Kg DM ha−1 y−1 NG-LP vs. 7100 Kg DM ha−1 y−1 NG). If the June-November period is considered, difference is amplified to 33.8% (13,400 Kg DM ha−1 y−1 NG-LP vs. 7300 Kg DM ha y−1 NG). These differences between treatments acquire similar values to the literature cited above.
The smaller difference in EVI found, a proxy of forage production, may be related to the differences in the situations analyzed. These results were obtained through a “natural experiment” in commercial farms and not in controlled experimental conditions as in previous references. The existence of covariates over which no control is available, are common in natural conditions experiments [60]. Grazing management is potentially one of these uncontrolled variables. Grazing management recommendations in NG-LP include raising the stocking rate to control the legume cover dominance in the growing season and then remove livestock for approximately 40 days to promote seed development [61]. Similar results were found by De keesmaecker et al. [62], in a natural experiment in the Netherlands. These authors compare intensified pastures (with fertilization, sown pastures and irrigation) vs. semi-natural grasslands both under grazing and report an average increase of 10% in the Normalized Difference Vegetation Index (NDVI), accordingly with these results (considering the differences in intensification practices).
The persistence of the forage production increase caused by legume and P fertilization (NG-LP) is under discussion and there is not enough information on this issue. Del Pino et al. [31], found increase in forage production in the first and last two measures of a total of six over eight years, only during intensification. In a more recent study, del Pino et al. [45] found no differences after 12 years from the end of the intensification practice. This differs compared to these results, where the forage production increase remained in the medium-term, or during the nine years analyzed at least. A similar result was found by Jaurena et al. [33], who reported a forage production average increase of 60% after 12 years of NG-LP under experimental conditions.
The forage production increase due to intensification practice can be explained by two reasons. One is the introduction of highly productive leguminous species, with rapid growth and winter cycle, the season with the lowest forage production in Uruguayan natural grasslands [51,52,53]. Previous experimental studies reported a higher forage production of NG-LP that NG according to the season: 150% in winter and 100% in spring [63,64]. These results confirmed that the difference between NG and NG-LP is concentrated in June-November period, including the winter months when the higher forage production of NG-LP offsets the winter forage deficiency generally found in these systems. The second reason is higher plant availability of macronutrients which limit the NG forage production, particularly nitrogen fixed by legumes, and phosphorus by fertilization [65]. It should be considered that NG-LP practice aims, besides increasing forage production, to improve its quality by increasing the amount of biomass N and P concentrations [31]. Del Pino et al. [45] reported quality improvement remains in NG-LP plots after 12 years of intensification practice, even though they did not detect forage production differences.
Some studies reported forage production increases in NG using different intensification input-based technologies. A medium-term experiment (seven years) showed an average increase of 29% with nitrogen plus phosphorus fertilization [66], coinciding with these results. In a short-term experiment, Jaurena et al. [67] observed a 50 % increase in forage production of NG with nitrogen plus phosphorus fertilization, and a 100% increase when fertilization was combined with irrigation. The differences can be explained by the addition of nitrogen, which becomes rapidly available and generates an increase of forage production of grasses, which are dominant in natural grassland [67]. In addition, irrigation eliminates another of the main limiting factors of growth in temperate grasslands [68], so a greater increase was observed. Some short-term experiments in the region observed increases similar to these. Rodríguez et al. [69], observed increases of 40% and 100% in annual forage production through two levels of phosphorus fertilization in NG of Argentina’s Pampa region. Ferreira et al. [57] found increases of 130% with combined nitrogen and phosphorus fertilization in southern Brazil grasslands.

4.2. Increase of Forage Production Variability

These results showed intra- and inter-annual increase of ecosystem functioning variability by NG-LP. The effect of NG-LP on temporal variability was scarcely addressed by the literature. Baeza et al. [52] suggested the existence of greater inter-annual and intra-annual variation of forage production in NG-LP than in NG. Variability analysis of other intensification input-based technologies is a little more studied. A review of Jaurena et al. [28] suggested that, after the fourth year of sowed pastures of Uruguay and Argentina, variability of forage production is three times higher than NG. Durante et al. [70] analyzed the difference in forage production variability of sown pastures and NG in the Argentina’s Pampa region over a period of eight years and found greater intra- and inter-annual variability in sown pastures. This agreed with Paruelo et al. [71], although they did not perform a comparative analysis, their results suggest greater interannual variation of forage production in sown pastures than NG in commercial farms of Uruguay.
An important part of the rise in intra-annual variability of NG-LP productivity is partially explained by the increase in the EVI range. Specifically, NG-LP minimum was equal to NG, but maximum values was higher mainly from September to November. The remaining variability could be explained by diversity loss and/or the change in species composition. Although it is generally accepted that NG-LP is an alternative option to preserve NG biodiversity, in comparison with high-level intensification input-based technologies such as sowing pastures, some local studies reported short-term loss of diversity. Jaurena et al. [33], observed loss of total diversity, richness and increase frequency of exotics species in NG-LP versus NG. The higher-level of phosphorus fertilization used in this practice would generate a greater decrease in species, mainly native ones. Pañella et al. [35] reported a decrease in the richness of native species and an increase in exotic species, in addition, native species loss was greater with higher fertilization levels. Del Pino et al. [31] quantified the response of NG to phosphorus (P) fertilization and legume introduction, by measuring herbage yield of legumes and native species separately. Their results suggest the installation of legumes trigger a process of replacement of native species given by their greater competitive ability in situations of high resource availability. However, there is no consensus on long-term effects of NG-LP. Del Pino et al. [45] found no changes in diversity or presence of exotic species in 12 years after the end of the intensification practice. In a 21 years-long experiment in Rio Grande do Sul (Brazil), which analyzed only phosphorus fertilization, Somavilla et al. [72] reported changes in botanical composition, although not always with a decrease in species richness. In other regions of the world, numerous studies reported a decrease in NG diversity due exclusively to fertilization. Seabloom et al. [73] analyzed the chronic effect of phosphorus and nitrogen fertilization in species diversity, in experiments lasting five to 11 years, at 47 grasslands sites in 12 countries in North and South America, Europe, Australia, Africa and Asia. In all cases, they reported a decrease in species diversity and richness by fertilization. Several studies found strong negative correlation between diversity and nitrogen enrichment by intensification [74,75,76,77]. Riesch et al. [78], reported inverse relationship between species richness and soil phosphorus enrichment in intensified semi-natural grasslands in Germany [78].
Positive correlations between diversity and stability have been reported for grassland systems globally. It is argued that species diversity increases ecosystem stability and resilience to major disturbances [79] and it has been described that higher species richness is associated with increased biomass production and decreases temporal variability of forage production of grassland communities [80]. Less diverse intensified grasslands were less resilient to drought than NG under controlled conditions [81] and in natural experiments using vegetation indices [62].
Several mechanisms may explain how species diversity mediate temporal variability of forage production in NG. The presence of higher species richness with a high functional diversity probably has a complementary effect stabilizing biomass production in the long term [82]. Besides, heterogeneity associated with niche complementarity could result in better community performance compared to the expected individual species performance [83]. In this sense, it has been described phenological diversity stabilized forage production at the community level [84].
Another mechanism that may explain the temporal stability reduction is the substitution of native perennial species for annuals, as part of medium-term species alternation induced by intensification. Some studies report this effect after NG-LP in Uruguayan grasslands. Carámbula et al. [61], found a higher frequency of winter annual grasses after intensification, including one exotic species. NG-LP Increased annual species cover and frequency of opportunistic species in two regions of Uruguay (Centro sur and Sierras del Este; Lezama, 2019, Comm Pers). Some studies report increases in annual species biomass by phosphorus fertilization in Rio de la Plata Grasslands. Rodríguez et al. [69] analyzed the effect of fertilization in Pampean region (Argentina) and reported an increase in the productivity of annual C3 grasses and legumes in both seasons, suggesting a stability decrease of the natural community with the replacement of perennial species by annuals. Oliveira et al. [85] reported an increase in annual species biomass with phosphorus fertilization in grasslands of southern Brazil. In this sense, they found that a change in functional groups in a grassland dominated by perennial species was the main driver of declining stability, even more important than diversity [86]. In any case, links between both mechanisms, changes in diversity and functional groups caused by intensification practice and their consequences in functional stability of pastoral livestock systems remains to be elucidated.

4.3. Limitations

This natural experiment with commercial farms constitutes a challenge that presented at least two disadvantages and three advantages respect to field experiments under controlled conditions. Many disadvantages are related to the limited control associated with the wide diversity of management taken by each farmer. Firstly, the absence of grazing control is a key factor that affects the forage production for which there is not enough information. Secondly, the intensification treatment was considered as one factor, but it involved different legume species, types and doses of fertilization that will be examined in greater detail. Firstly, the most important advantage was the achievement of a large number of replications using case studies under a wide variety of local conditions. Secondly, the farms’ geographical dispersion in different grassland communities strengthened the results, finding intensification practice effects in spite of the great variation of environmental conditions (edaphic and climatic). Thirdly, control paddock use and pre-post intensification practice analysis allowed for the attribution of inputs on the effects of forage production exclusively, in spite of the different conditions.
This study was limited by the sensor spatial resolution. The MODIS sensor is robust and presents an adequate temporal resolution for this study, but its spatial resolution of 250 m limiting at the paddock scale. Recent studies have used harmonized time series of vegetation indices with higher spatial resolution sensors such as LANDSAT and SENTINEL [87,88,89]. With a higher spatial resolution, the number of cases could be increased, even to databases of controlled plot-scale experiments, analyzing possible nested or treatment-specific effects, such as the differing legume species seeded (summer or winter cycle), fertilizer load or the community grassland location.
5. Conclusions

This study shows that the NG-LP generated an increase in EVI that was maintained over nine years. The EVI is a proxy of radiation absorption and forage production. This increase was concentrated in the June-November period, including the winter months where a forage deficit generally occurs in grassland-based livestock production systems in southern South America. This increase in forage production also implied an increase in temporal variability, which suggests that further studies are needed to evaluate the effect of intensification practices on resilience to severe climatic events and their relationships with other aspects, such as floristic diversity, invasion of exotic species, and nutrient cycling.

Author Contributions

Conceptualization, methodology, validation, formal analysis: G.R., S.B. and M.O.; methodology, software, investigation, data curation, writing—original draft preparation: G.R.; resources: F.L. and G.C.; writing—review and editing: G.R., M.O., F.L., G.C. and S.B.; supervision: S.B. and M.O.; project administration: S.B.; funding acquisition: S.B. All authors have read and agreed to the published version of the manuscript.

Funding

This research has been partially funded by Agencia Nacional de Investigación e Innovación (ANII, Fondo INNOVAGRO: Ciencia y Tecnología, projects FSA_PI_2018_1_149022, FSA_PI_2018_1_148811) and Comisión Sectorial de Investigación Científica, Universidad de la República (project CSIC I+D 2020_358) and by a doctoral fellowship of ANII.

Data Availability Statement

Data will be made available on request.

Acknowledgments

We would like to thank all farmers who provided paddock information.

Conflicts of Interest

The authors declare no conflict of interest. The funders had no role in the design of the study; in the collection, analyses, or interpretation of data; in the writing of the manuscript; or in the decision to publish the results.

Appendix A

Table A1. Technological information of intensification practice of each pair.
Nº PairType of LegumeType of P-FertilizerTime of Application
1Lotus subbiflorusphosphoritebiennial
2Lotus pedunculatusphosphoritesporadic
3Trifolium repensphosphoritecontinuous
4Lotus angustissimusN/AN/A
5Lotus subbiflorusN/AN/A
6Lotus subbiflorusphosphoriteN/A
7Lotus pedunculatusN/AN/A
8Lotus subbiflorusphosphoritesporadic
9Lotus subbiflorusphosphoritecontinuous
10Lotus subbiflorussuperphosphate + phosphoritebiennial
11Trifolium repenssuperphosphate + phosphoritecontinuous
12Lotus subbiflorusphosphoritesporadic
13Lotus subbiflorusphosphoritebiennial
14Lotus subbiflorusphosphoriteanual
15Lotus subbiflorussuperphosphate + phosphoritesporadic
16Lotus subbiflorussuperphosphate + phosphoritesporadic
17Lotus subbiflorussuperphosphate + phosphoriteanual
18Lotus subbiflorussuperphosphate + phosphoriteanual
19Lotus subbiflorussuperphosphate + phosphoriteannual/sporadic
20Lotus subbiflorussuperphosphate + phosphoriteannual
Table A2. Enhanced Vegetation Index (EVI) two-way repeated measure ANOVA of natural grassland, 4 years before to intensification practice (n = 20).
Source on VariationSum of SquaresDfMean SquareF (DFn, DFd)p Value
Year0.006630.0022F (3, 57) = 1.552p = 0.2111
Treatment0.000410.0004F (1, 19) = 0.5877p = 0.4527
Year × Treatment2.1 × 10−537.0 × 10⁻⁶F (3, 57) = 0.0438p = 0.9877
Year × Paddock0.0813570.0014
Treatment × Paddock0.0144190.0008
Paddock0.1125190.0059
Error0.0091570.0002
Total0.01627
Table A3. Enhanced Vegetation Index (EVI) two-way repeated measure ANOVA of Natural Grassland (NG) and Natural Grasslands overseed with Legumes with Phosphorus fertilization (NG-LP), during 9 years after intensification practice (n = 20).
Source on VariationSum of SquaresDfMean SquareF (DFn, DFd)p Value
Year0.028680.0036F (8, 152) = 3.25p = 0.0019
Treatment0.023610.0236F (1, 19) = 18.88p = 0.0003
Year × Treatment0.000788.17 × 10−5F (8, 152) = 0.5p = 0.8546
Year × Paddock0.16741520.0011
Treatment × Paddock0.0238190.0013
Paddock0.2285190.012
Error0.02481520.0002
Total0.077717
Table A4. Interannual EVI mean for Treatment × Year to intensification.
Year to IntensificationNG-LP EVI MeanNG EVI Mean
−40.42570.4213
−30.41310.4106
−20.41480.4119
−10.40730.4037
00.42320.4092
10.42150.4069
20.42320.4051
30.41810.4059
40.42620.4092
50.43200.4139
60.44400.4304
70.44100.4241
80.44260.4212
Table A5. Enhanced Vegetation Index (EVI) two-way repeated measure ANOVA of natural grassland, 4 years before to intensification practice, between January and December (n = 20).
Source on VariationSum of SquaresDfMean SquareF (DFn, DFd)p Value
Month0.2991110.0272F (2.71, 51.48) = 12.4p < 0.0001
Treatment0.001810.0018F (1, 19) = 0.747p = 0.398
Month × Treatment0.0016110.0001F (4.06, 77.19) = 0.846p = 0.501
Month × Paddock0.45782090.0022
Treatment × Paddock0.0464190.0024
Paddock0.3513190.0185
Error0.03602090.0002
Total0.338523
Table A6. Enhanced Vegetation Index (EVI) two-way repeated measure ANOVA of Natural Grassland (NG) and Natural Grasslands overseed with Legumes with Phosphorus fertilization (NG-LP), during 9 years after intensification practice, between January and December (n = 20).
Source on VariationSum of SquaresDfMean SquareF (DFn, DFd)p Value
Month0.4932110.0448F (11, 209) = 18.19p < 0.0001
Treatment0.033710.0337F (1, 19) = 19.14p = 0.0003
Month × Treatment0.0258110.0023F (11, 209) = 8.48p < 0.0001
Month × Paddock0.51522090.0025
Treatment × Paddock0.0334190.0018
Paddock0.3336190.0176
Error0.05772090.0003
Total0.610423
Table A7. Intra-annual Enhanced Vegetation Index (EVI) Variability two-way repeated measure ANOVA of natural grassland, 4 years before to intensification practice (n = 20).
Source on VariationSum of SquaresDfMean SquareF (DFn, DFd)p Value
Year55.9318.64F (3, 57) = 0.5724p = 0.6355
Treatment14.8114.84F (1, 19) = 4.000p = 0.06
Year × Treatment10.633.54F (3, 57) = 1.557p = 0.2099
Year × Paddock18565732.55
Treatment × Paddock70.5193.71
Paddock15901983.7
Error129.8572.28
Total2117
Table A8. Intra-annual Enhanced Vegetation Index (EVI) Variability two-way repeated measure ANOVA of natural grassland and Natural Grasslands overseed with Legumes with Phosphorus fertilization (NG-LP), during 9 years after intensification practice (n = 20).
Source on VariationSum of SquaresDfMean SquareF (DFn, DFd)p Value
Year12268153.3F (8, 152) = 2.872p = 0.0053
Treatment3531353.3F (1, 19) = 24.14p < 0.0001
Year × Treatment106.5813.32F (8, 152) = 2.015p = 0.0482
Year × Paddock811115253.36
Treatment × Paddock2781914.63
Paddock314619165.6
Error10051526.61
Total269117
Table A9. Interannual Enhanced Vegetation Index (EVI) Variability two-way repeated measure ANOVA of natural grassland, 4 years before to intensification practice, between January and December (n = 20).
Source on VariationSum of SquaresDfMean SquareF (DFn, DFd)p Value
Month892311811.2F (11, 209) = 10.57p < 0.0001
Treatment1.811.8F (1, 19) = 0.06803p = 0.797
Month × Treatment107119.75F (11, 209) = 1.273p = 0.2419
Month × Paddock16,04020976.75
Treatment × Paddock5031926.48
Paddock635519334.5
Error16022097.66
Total12,43423
Table A10. Interannual Enhanced Vegetation Index (EVI) Variability two-way repeated measure ANOVA of natural grassland and Natural Grasslands overseed with Legumes with Phosphorus fertilization (NG-LP), during 9 years after intensification practice, between January and December (n = 20).
Source on VariationSum of SquaresDfMean SquareF (DFn, DFd)p Value
Month14,671111334F (11, 209) = 49.95p < 0.0001
Treatment449.91449.9F (1, 19) = 14.80p = 0.0011
Month × Treatment67.16116.1F (11, 209) = 1.197p = 0.2909
Month × Paddock558020926.7
Treatment × Paddock577.71930.41
Paddock317119166.9
Error10662095.1
Total16,25423

References

  1. Golluscio, R.A.; Deregibus, V.A.; Paruelo, J.M. Sustainability and range management in the Patagonian steppes. Ecol. Austral 1998, 8, 265–284. [Google Scholar]
  2. Grigera, G.; Oesterheld, M.; Pacín, F. Monitoring forage production with MODIS data for farmers’ decision making. Agric. Syst. 2007, 94, 637–648. [Google Scholar] [CrossRef]
  3. Oesterheld, M.; DiBella, C.M.; Kerdiles, H. Relation between NOAA AVHRR satellite data and stocking rate of rangelands. Ecol. Appl. 1998, 8, 207–212. [Google Scholar] [CrossRef]
  4. Catorci, A.; Lulli, R.; Malatesta, L.; Tavoloni, M.; Tardella, F.M. How the interplay between management and interannual climatic variability influences the NDVI variation in a sub-Mediterranean pastoral system: Insight into sustainable grassland use under climate change. Agric. Ecosyst. Environ. 2021, 314, 107372. [Google Scholar] [CrossRef]
  5. Scurlock, J.M.O.; Johnson, K.; Olson, R.J. Estimating net primary productivity from grassland biomass dynamics measurements. Glob. Chang. Biol. 2002, 8, 736–753. [Google Scholar] [CrossRef] [Green Version]
  6. Monteith, J.L. Solar radiation and productivity in tropical ecosystems. J. Appl. Ecol. 1972, 9, 747–766. [Google Scholar] [CrossRef] [Green Version]
  7. Piñeiro, G.; Oesterheld, M.; Paruelo, J.M. Seasonal variation in aboveground production and radiation use efficiency of temperate rangelands estimated through remote sensing. Ecosystems 2006, 9, 357–373. [Google Scholar] [CrossRef]
  8. Pellegrini, P.; Cossani, C.M.; Bella, C.M.D.; Piñeiro, G.; Sadras, V.O.; Oesterheld, M. Simple regression models to estimate light interception in wheat crops with Sentinel-2 and a handheld sensor. Crop Sci. 2020, 60, 1607–1616. [Google Scholar] [CrossRef]
  9. Jansen, V.S.; Kolden, C.A.; Schmalz, H.J.; Karl, J.W.; Taylor, R.V. Using Satellite-Based Vegetation Data for Short-Term Grazing Monitoring to Inform Adaptive Management. Rangel. Ecol. Manag. 2021, 79, 30–42. [Google Scholar] [CrossRef]
  10. MGAP. DIEA. Anuario Estadístico Agropecuario; Ministerio de Ganadería Agricultura y Pesca: Montevideo, Uruguay, 2021; p. 215. [Google Scholar]
  11. Lezama, F.; Pereira, M.; Altesor, A.; Paruelo, J.M. Grasslands of Uruguay: Classification based on vegetation plots. Phytocoenologia 2019, 49, 211–229. [Google Scholar] [CrossRef]
  12. Berretta, E.J.; Risso, D.F.; Montossi, F.; Pigurina, G. “Campos in Uruguay”. In Grassland Ecophysiology and Grazing Ecology; Lemaire, G., Hodgson, J., Moraes, A., Carvalho, P.C.F., Nabinger, C., Eds.; CABI: Wallingford, UK, 2000; pp. 377–394. [Google Scholar]
  13. Royo Pallares, O.; Berretta, E.J.; Maraschin, G.E. The South American campos ecosystem. In Grasslands of the World; Suttie, J.M., Reynolds, S.G., Batello, C., Eds.; Food and Agriculture Organization of the United Nations (FAO): Rome, Italy, 2005; pp. 171–220. Available online: http://elgateado.free.fr/mesdocuments/y8344e05.pdf.
  14. Rama, G.; Lezama, F.; Baeza, S. Cambios recientes del uso del suelo de la región cuesta basáltica del Uruguay. Oecologia Aust. 2018, 22, 210–223. [Google Scholar] [CrossRef]
  15. Baeza, S.; Paruelo, J. Land use/land cover change (2000–2014) in the rio de la plata grasslands: An analysis based on MODIS NDVI time series. Remote Sens. 2020, 12, 381. [Google Scholar] [CrossRef] [Green Version]
  16. Baeza, S.; Vélez-Martin, E.; De Abelleyra, D.; Banchero, S.; Gallego, F.; Schirmbeck, J.; Veron, S.; Vallejos, M.; Weber, E.; Oyarzabal, M.; et al. Two decades of land cover mapping in the Río de la Plata grassland region: The MapBiomas Pampa initiative. Remote Sens. Appl. Soc. Environ. 2022, 28, 100834. [Google Scholar] [CrossRef]
  17. Modernel, P.; Rossing, W.A.H.; Corbeels, M.; Dogliotti, S.; Picasso, V.; Tittonell, P. Land use change and ecosystem service provision in Pampas and Campos grasslands of southern South America. Environ. Res. Lett. 2016, 11, 113002. [Google Scholar] [CrossRef]
  18. Texeira, M.; Oyarzabal, M.; Piñeiro, G.; Baeza, S.; Paruelo, J.M. Land cover and precipitation controls over long-term trends in carbon gains in the grassland biome of South America. Ecosphere 2015, 6, 196. [Google Scholar] [CrossRef] [Green Version]
  19. Baeza, S.; Paruelo, J. Spatial and temporal variation of Human Appropriation of Net Primary Production in the Rio de la Plata Grasslands. ISPRS J. Photogramm. Remote Sens. 2018, 145, 238–249. [Google Scholar] [CrossRef]
  20. Tiscornia, G.; Jaurena, M.; Baethgen, W. Drivers, Process, and Consequences of Native Grassland Degradation: Insights from a Literature Review and a Survey in Río de la Plata Grasslands. Agronomy 2019, 9, 239. [Google Scholar] [CrossRef] [Green Version]
  21. FAOSTAT. Food and Agriculture Data, Food and Agriculture Organization of the United Nations (FAO). 2019. Available online: http://www.fao.org/faostat/en/#homen/#home (accessed on 30 August 2022).
  22. Thornton, P.K.; van de Steeg, J.; Notenbaert, A.; Herrero, M. The impacts of climate change on livestock and livestock systems in developing countries: A review of what we know and what we need to know. Agric. Syst. 2009, 101, 113–127. [Google Scholar] [CrossRef]
  23. Soussana, J.F.; Lemaire, G. Coupling carbon and nitrogen cycles for environmentally sustainable intensification of grasslands and crop-livestock systems. Agric. Ecosyst. Environ. 2014, 190, 9–17. [Google Scholar] [CrossRef]
  24. Gao, Q.; Wan, Y.; Xu, H.; Li, Y.; Jiangcun, W.; Borjigidai, A. Alpine grassland degradation index and its response to recent climate variability in Northern Tibet, China. Quat. Int. 2010, 226, 143–150. [Google Scholar] [CrossRef]
  25. Suttie, J.M.; Reynolds, S.G.; Batello, C. Grasslands of the World. Plant Production and Protection Series; Food and Agriculture Organization of the United Nations: Rome, Italy, 2005; p. 535. [Google Scholar]
  26. Keya, N.C.O.; van Eijnatten, C.L.M. Studies on Oversowing of Natural Grasslands in Kenya. East Afr. Agric. For. J. 1975, 40, 261–263. [Google Scholar] [CrossRef]
  27. Mannetje, T.; Jones, R.M. (Eds.) Plant Resources of South-East Asia; Forages, 4, 300; PUDOC: Wageningen, Holanda, 1992. [Google Scholar]
  28. Jaurena, M.; Durante, M.; Devincenzi, T.; Savian, J.V.; Bendersky, D.; Moojen, F.G.; Pereira, M.; Soca, P.; Quadros, F.L.F.; Pizzio, R.; et al. Native Grasslands at the Core: A New Paradigm of Intensification for the Campos of Southern South America to Increase Economic and Environmental Sustainability. Front. Sustain. Food Syst. 2021, 5, 547834. [Google Scholar] [CrossRef]
  29. Carámbula, M. Pasturas Naturales Mejoradas; Hemisferio Sur: Montevideo, Uruguay, 1996; p. 524. [Google Scholar]
  30. Isbell, F.; Reich, P.B.; Tilman, D.; Hobbie, S.E.; Polasky, S.; Binder, S. Nutrient enrichment, biodiversity loss and consequent declines in ecosystem productivity. Proc. Natl. Acad. Sci. USA 2013, 110, 11911–11916. [Google Scholar] [CrossRef] [Green Version]
  31. del Pino, A.; Rodríguez, T.; Andion, J. Production improvement through phosphorus fertilization and legume introduction in grazed native pastures of Uruguay. J. Agric. Sci. 2016, 154, 347–358. [Google Scholar] [CrossRef]
  32. Millot, J.C.; Risso, D.; Methol, R. Relevamiento de Pasturas Naturales y Mejoramientos Extensivos en Áreas Ganaderas del Uruguay; Informe técnico para la Comisión Honoraria del Plan Agropecuario: Montevideo, Uruguay, 1987. [Google Scholar]
  33. Jaurena, M.; Lezama, F.; Salvo, L.; Cardozo, G.; Ayala, W.; Terra, J.; Nabinger, C. The dilemma of improving native grasslands by overseeding legumes: Production intensification or diversity conservation. Rangel. Ecol. Manag. 2016, 69, 35–42. [Google Scholar] [CrossRef]
  34. Ceulemans, T.; Merckx, R.; Hens, M.; Honnay, O. A trait-based analysis of the role of phosphorus vs. nitrogen enrichment in plant species loss across North-west European grasslands. J. Appl. Ecol. 2011, 48, 1155–1163. [Google Scholar] [CrossRef]
  35. Pañella, P.; Cardozo, G.; Cuadro, R.; Reyno, R.; Lezama, F. La fertilización fosforada disminuye la riqueza y aumenta el número de especies exóticas de plantas en pastizales intersembrados con leguminosas. Ecol. Austral 2020, 30, 354–365. [Google Scholar] [CrossRef]
  36. Hector, A.; Hautier, Y.; Saner, P.; Wacker, L.; Bagchi, R.; Joshi, J.; Caldeira, M.C. General stabilizing effects of plant diversity on grassland productivity through population asynchrony and overyielding. Ecology 2010, 91, 2213–2220. [Google Scholar] [CrossRef]
  37. Hautier, Y.; Tilman, D.; Isbell, F.; Seabloom, E.W.; Borer, E.T.; Reich, P.B. Anthropogenic environmental changes affect ecosystem stability via biodiversity. Science 2015, 348, 336–340. [Google Scholar] [CrossRef] [PubMed] [Green Version]
  38. MacDougall, A.S.; McCann, K.S.; Gellner, G.; Turkington, R. Diversity loss with persistent human disturbance increases vulnerability to ecosystem collapse. Nature 2013, 494, 86–89. [Google Scholar] [CrossRef] [PubMed]
  39. Vogel, A.; Scherer-Lorenzen, M.; Weigelt, A. Grassland Resistance and Resilience after Drought Depends on Management Intensity and Species Richness. PLoS ONE 2012, 7, 36992. [Google Scholar] [CrossRef] [PubMed]
  40. Avolio, M.L.; Koerner, S.E.; La Pierre, K.J.; Wilcox, K.R.; Wilson, G.W.; Smith, M.D.; Collins, S.L. Changes in plant community composition, not diversity, during a decade of nitrogen and phosphorus additions drive above; ground productivity in a tall grass prairie. J. Ecol. 2014, 102, 1649–1660. [Google Scholar] [CrossRef] [Green Version]
  41. Wagg, C.; O’Brien, M.J.; Vogel, A.; Scherer-Lorenzen, M.; Eisenhauer, N.; Schmid, B.; Weigelt, A. Plant diversity maintains long-term ecosystem productivity under frequent drought by increasing short-term variation. Ecology 2017, 98, 2952–2961. [Google Scholar] [CrossRef]
  42. Nilsen, E.B.; Bowler, D.E.; Linnell, J.D. Exploratory and confirmatory research in the open science era. J. Appl. Ecol. 2020, 57, 842–847. [Google Scholar] [CrossRef] [Green Version]
  43. Taboada, M.; Costantini, A.; Busto, M.; Bonatti, M.; Sieber, S. Climate change adaptation and the agricultural sector in South American countries: Risk, vulnerabilities and opportunities. Rev. Bras. Ciência Solo 2021, 45, 20. [Google Scholar] [CrossRef]
  44. Naumann, G.; Podesta, G.; Marengo, J.; Luterbacher, J.; Bavera, D.; Arias Muñoz, C.; Barbosa, P.; Cammalleri, C.; Chamorro, L.; Cuartas, A.; et al. The 2019-2021 Extreme Drought Episode in la Plata Basin; Publications Office of the European Union: Luxembourg, 2021. [Google Scholar] [CrossRef]
  45. del Pino, A.; Lezama, F.; Pezzani, F.; Parodi, G. Persistencia de efectos a largo plazo de la fertilización fosfatada y la introducción de leguminosas en pastizales del Uruguay. Agriscienta 2021, 38, 99–109. [Google Scholar] [CrossRef]
  46. Bondaruck, V.; Lezama, F.; Del Pino, A.; Piñeiro, G. Overseeding legumes in natural grasslands: Impacts on root biomass and soil organic matter of commercial farms. Sci. Total Environ. 2020, 743, 140771. [Google Scholar] [CrossRef]
  47. Barley, S.C.; Meeuwig, J.J. The Power and the Pitfalls of Large-scale, Unreplicated Natural Experiments. Ecosystems 2016, 20, 331–339. [Google Scholar] [CrossRef]
  48. HilleRisLambers, J.; Ettinger, A.K.; Ford, K.R.; Haak, D.C.; Horwith, M.; Miner, B.E.; Rogers, H.S.; Sheldon, K.S.; Tewksbury, J.J.; Waters, S.M.; et al. Accidental experiments: Ecological and evolutionary insights and opportunities derived from global change. Oikos 2013, 122, 1649–1661. [Google Scholar] [CrossRef]
  49. Panario, D.; Gutiérrez, O.; Sánchez Bettucci, L.; Peel, E.; Oyhantçabal, P.; Rabassa, J. Ancient landscapes of Uruguay. In Gondwana Landscapes in Southern South America, 1st ed.; Rabassa, J., Ollier, C., Eds.; Springer: Dordrecht, The Netherlands, 2014; pp. 161–199. [Google Scholar] [CrossRef]
  50. Baeza, S.; Paruelo, J.M.; Altesor, A. Caracterización Funcional de la Vegetación de Uruguay Mediante el Uso de Sensores Remotos. Interciencia 2006, 31, 382–388. [Google Scholar]
  51. Baeza, S.; Lezama, F.; Piñeiro, G.; Altesor, A.; Paruelo, J.M. Spatial variability of above-ground net primary production in Uruguayan grasslands: A remote sensing approach. Appl. Veg. Sci. 2010, 13, 72–85. [Google Scholar] [CrossRef]
  52. Baeza, S.; Paruelo, J.; Ayala, W. Eficiencia en el uso de la radiación y productividad primaria en recursos forrajeros del este de Uruguay. Agrociencia 2011, 15, 48–59. [Google Scholar]
  53. Guido, A.; Varela, R.D.; Baldassini, P.; Paruelo, J.M. Spatial and Temporal Variability in Aboveground Net Primary Production of Uruguayan Grasslands. Rangel. Ecol. Manag. 2014, 67, 30–38. [Google Scholar] [CrossRef]
  54. Oyarzabal, M.; Paruelo, J.M. Dinámica de la Productividad Primaria de las comunidades de pastizal del Uruguay. In Bases Ecológicas y Tecnológicas para el Manejo de Pastizales II; Altesor, A., López-Marsico, M., Paruelo, J.M., Eds.; Instituto Nacional de Investigación Agropecuaria: Montevideo, Uruguay, 2019; pp. 111–122. [Google Scholar]
  55. Gorelick, N.; Hancher, M.; Dixon, M.; Ilyushchenko, S.; Thau, D.; Moore, R. Google Earth Engine: Planetary-scale geospatial analysis for everyone. Remote Sens. Environ. 2017, 202, 18–27. [Google Scholar] [CrossRef]
  56. Bautista-Thompson, E.; De La Cruz, S. Shape Similarity Index for Time Series based on Features of Euclidean Distances Histograms. In Proceedings of the 15th International Conference on Computing, Mexico city, Mexico, 21 November 2006; pp. 60–64. [Google Scholar] [CrossRef]
  57. Ferreira, E.T.; Nabinger, C.; Elejalde, D.A.G.; Freitas, A.K.; Carassai, I.J.; Schmitt, F. Fertilization and oversowing on natural grassland: Effects on pasture characteristics and yearling steers performance. Rev. Bras. Zootec. 2011, 40, 2039–2047. [Google Scholar] [CrossRef] [Green Version]
  58. Pagnanini, F.; Oyarzabal, M.; Paruelo, M.; Pereira, M. Productividad primaria neta aérea de pastizales de Uruguay: Variación entre años y entre sitios. In Bases Ecológicas y Tecnológicas Para el Manejo de Pastizales II, 1st ed.; Altesor, A., Lopez-Marsico, L., Paruelo, J.M., Eds.; INIA: Montevideo, Uruguay, 2019; Volume 69, pp. 139–153. [Google Scholar]
  59. Paruelo, J.M.; Piñeiro, G.; Baldi, G.; Baeza, S.; Lezama, F.; Altesor, A.; Oesterheld, M. Carbon stocks and fluxes in rangelands of the Rio de la Plata Basin. Rangel. Ecol. Manag. 2010, 63, 94–108. [Google Scholar] [CrossRef]
  60. Hansson, S.O. Farmers’ experiments and scientific methodology. Eur. J. Philos. Sci. 2019, 9, 23. [Google Scholar] [CrossRef] [Green Version]
  61. Carámbula, M.; Carriquiry, E.; Ayala, W. Mejoramientos de Campo con Lotus subifflorus cv El Rincón; INIA: Treinta y Tres, Uruguay, 1994; Volume 44, p. 21. Available online: http://www.ainfo.inia.uy/digital/bitstream/item/2743/1/111219240807155712.pdf (accessed on 10 October 2022).
  62. De Keersmaecker, W.; Van Rooijen, N.; Lhermitte, S.; Tits, L.; Schaminée, J.; Coppin, P.; Honnay, O.; Somers, B. Species rich seminatural grasslands have a higher resistance but a lower resilience than intensively managed agricultural grasslands in response to climate anomalies. J. Appl. Ecol. 2016, 53, 430–439. [Google Scholar] [CrossRef] [Green Version]
  63. Bemhaja, M. Sward improvement in deep basaltic soils: A. Evaluation of legumes (genera, species and cultivars). B. Management of legumes and C. Characterization of sward improvement under different carrying capacities with steers during three consecutive years. In Seminario de Actualización en Tecnologías Para Basalto (Serie Técnica); Berretta, E.J., Ed.; INIA: Tacuarembó, Uruguay, 1998; Volume 102, pp. 33–89. [Google Scholar]
  64. Ayala, W.; Bermudez, R.; Carámbula, M.; Risso, D.; Terra, J. Technologies for the improvement of forage production in the soils of Eastern Rolling Hills. In Forage Technologies for the Beef CATTLE systems, 2nd ed.; Risso, D.F., Berretta, E.J., Eds.; INIA: Tacuarembó, Uruguay, 2001; Serie Técnica, 76; pp. 69–108. [Google Scholar]
  65. Rebuffo, M.; Bemhaja, M.; Risso, D.F. Utilization of forage legumes in pastoral systems: State of art in Uruguay. Lotus Newsl. 2006, 36, 22–33. [Google Scholar]
  66. Rodríguez Palma, R.; Rodríguez, T. Fertilización de campo natural: Forraje crecido. Memorias del III Congreso de la Asociación Uruguaya de Producción Animal. Agrociencia Urug. 2010, 14, 133. [Google Scholar]
  67. Jaurena, M.; Giorello, D.; Pérez Gomar, E.; Do Carmo, M.; Cardozo, G. Efectos de corto plazo de la interacción riego-fertilización en la producción y composición de un campo natural de basalto en Uruguay. Congreso de Pastizales. Rev. De La Fac. De Agron. íA UNLPam 2013, 22, 2. [Google Scholar]
  68. Paruelo, J.M.; Lauenroth, W.K.; Burke, I.C.; Sala, O.E. Grassland precipitation-use efficiency varies across a resource gradient. Ecosystems 1999, 2, 64–68. [Google Scholar] [CrossRef]
  69. Rodríguez, A.M.; Jacobo, E.J.; Scardaoni, P.; Deregibus, V.A. Effect of phosphate fertilization on flooding Pampa grasslands (Argentina). Rangel. Ecol. Manag. 2007, 60, 471–478. [Google Scholar] [CrossRef]
  70. Durante, M.; Piñeiro, G.; Irisarri, J.G.N.; Oesterheld, M. Primary Production of Lowland Natural Grasslands and Upland Sown Pastures Across a Narrow Climatic Gradient. Ecosystems 2016, 20, 543–552. [Google Scholar] [CrossRef]
  71. Paruelo, J.M.; Oyarzabal, M.; Oesterheld, M. El Seguimiento de los recursos forrajeros mediante sensores remotos: Bases y aplicaciones. In Bases Ecológicas y Tecnológicas para el Manejo de Pastizales, 1st ed.; Altesor, A., Ayala, W., Paruelo, J.M., Eds.; INIA: Montevideo, Uruguay, 2011; Volume 26, pp. 135–145. [Google Scholar]
  72. Somavilla, A.; Ramos Marques, A.C.; Caner, L.; Bittencourt de Oliveira, L.; Ferreira de Quadros, F.L.; Chabbi, A.; Tiecher, T.; Rheinheimer dos Santos, D. Phosphate fertilization and liming in a trial conducted over 21 years: A survey for greater forage production and Pampa pasture conservation. Eur. J. Agron. 2021, 125, 126–259. [Google Scholar] [CrossRef]
  73. Seabloom, E.W.; Adler, P.B.; Alberti, J.; Biederman, L.; Buckley, Y.M.; Cadotte, M.W.; Collins, S.L.; Dee, L.; Fay, P.A.; Firn, J.; et al. Increasing effects of chronic nutrient enrichment on plant diversity loss and ecosystem productivity over time. Ecology 2020, 102, 29. [Google Scholar] [CrossRef]
  74. Bai, Y.; Wu, J.; Clark, C.M.; Naeem, S.; Pan, Q.; Huang, J.; Zhang, L.; Guohan, X. Tradeoffs and thresholds in the effects of nitrogen addition on biodiversity and ecosystem functioning: Evidence from inner Mongolia Grasslands. Glob. Chang. Biol. 2010, 16, 889. [Google Scholar] [CrossRef]
  75. Cleland, E.E.; Harpole, W.S. Nitrogen enrichment and plant communities. Ann. N. Y. Acad. Sci. 2010, 1195, 46–61. [Google Scholar] [CrossRef] [PubMed]
  76. Bobbink, R.; Hicks, K.; Galloway, J.; Spranger, T.; Alkemade, R.; Ashmore, M.; Bustamante, M.; Cinderby, S.; Davidson, E.; Dentener, F.; et al. Global assessment of nitrogen deposition effects on terrestrial plant diversity: A synthesis. Ecol. Appl. 2010, 20, 30–59. [Google Scholar] [CrossRef] [Green Version]
  77. Zhao, Y.; Yang, B.; Li, M.; Xiao, R.; Rao, K.; Wang, J.; Zhang, T.; Guo, J. Community composition, structure and productivity in response to nitrogen and phosphorus additions in a temperate meadow. Sci. Total Environ. 2019, 654, 863–871. [Google Scholar] [CrossRef] [PubMed]
  78. Riesch, F.; Stroh, H.G.; Tonn, B.; Isselstein, J. Soil pH and phosphorus drive species composition and richness in semi-natural heathlands and grasslands unaffected by twentieth-century agricultural intensification. Plant Ecol. Divers. 2018, 11, 239–253. [Google Scholar] [CrossRef]
  79. Cardinale, B.J.; Duffy, J.E.; Gonzalez, A.; Hooper, D.U.; Perrings, C.; Venail, P.; Narwani, A.; Mace, G.M.; Tilman, D.; Wardle, D.A.; et al. Biodiversity loss and its impact on humanity. Nature 2012, 486, 59–67. [Google Scholar] [CrossRef] [Green Version]
  80. Lehman, C.L.; Tilman, D. Biodiversity, Stability, and Productivity in Competitive Communities. Am. Nat. 2000, 156, 534–552. [Google Scholar] [CrossRef] [PubMed]
  81. Stampfli, A.; Bloor, J.M.G.; Fischer, M.; Zeiter, M. High land-use intensity exacerbates shifts in grassland vegetation composition after severe experimental drought. Glob. Chang. Biol. 2018, 24, 2021–2034. [Google Scholar] [CrossRef] [PubMed] [Green Version]
  82. Tilman, D.; Downing, J.A. Biodiversity and stability in grasslands. Nature 1994, 367, 363–365. [Google Scholar] [CrossRef]
  83. Loreau, M.; Hector, A. Partitioning selection and complementarity in biodiversity experiments. Nature 2001, 412, 72–76. [Google Scholar] [CrossRef] [PubMed]
  84. Aragón, R.; Oesterheld, M.; Irisarri, G.; Texeira, M. Stability of ecosystem functioning and diversity of grasslands at the landscape scale. Landsc. Ecol. 2011, 26, 1011–1022. [Google Scholar] [CrossRef]
  85. Oliveira, L.B.; Soares, E.M.; Jochims, F.; Tiecher, T.; Marques, A.R.; Kuinchtner, B.C.; Rheinheimer, D.D.S.; de Quadros, F.L.F. Long-Term Effects of Phosphorus on Dynamics of an Overseeded Natural Grassland in Brazil. Rangel. Ecol. Manag. 2015, 68, 445–452. [Google Scholar] [CrossRef]
  86. Chen, Z.; Xiong, P.; Zhou, J.; Lai, S.; Jian, C.; Xu, W.; Xu, B. Effects of plant diversity on semiarid grassland stability depends on functional group composition and dynamics under N and P addition. Sci. Total Environ. 2021, 799, 149–482. [Google Scholar] [CrossRef] [PubMed]
  87. Claverie, M.; Ju, J.; Masek, G.; Dungan, J.L.; Vermote, E.F.; Roger, J.C.; Skakun, S.V.; Justice, C. The Harmonized Landsat and Sentinel-2 Surface Reflectance Data Set. Remote Sens. Environ. 2018, 219, 141–161. [Google Scholar] [CrossRef]
  88. Peng, D.; Wang, Y.; Xian, G.; Huete, A.R.; Huang, W.; Shen, M.; Wang, F.; Yu, L.; Liu, L.; Xie, Q.; et al. Investigation of land surface phenology detections in shrublands using multiple scale satellite data. Remote Sens. Environ. 2021, 252, 112–133. [Google Scholar] [CrossRef]
  89. Shen, Y.; Zhang, X.; Yang, Z. Mapping corn and soybean phenometrics at field scales over the United States Corn Belt by fusing time series of Landsat 8 and Sentinel-2 data with VIIRS data. ISPRS J. Photogramm. Remote Sens. 2022, 186, 55–69. [Google Scholar] [CrossRef]
Figure 1. Location of studied commercial pastoral livestock farms in four geomorphologic regions of Uruguay.
Agronomy 12 02507 g001
Figure 2. Mean Enhanced Vegetation Index (EVI) of natural grassland four years before, and natural grassland (NG) and natural grassland overseed with legumes and fertilized with phosphorus (NG-LP), over nine years after intensification practice (year 0, arrow inside the panel). Each circle corresponds to mean annual EVI of 20 paddocks, error bars indicate one spatial standard error between paddocks, and dotted horizontal lines interannual EVI mean (before intensification practice, F = 0.6, p value = 0.45; after intensification practice, F = 18.9, p value < 0.05).
Agronomy 12 02507 g002
Figure 3. Mean Enhanced Vegetation Index (EVI) mean of natural grassland control (NG) and natural grassland overseed with legumes and fertilized with phosphorus (NG-LP), from January to December. Points corresponds to annual EVI mean of 20 paddocks (NG, n = 20; NG-LP, n = 20) during the nine years of the intensification practice. Error bars correspond to spatial standard error, horizontal dotted lines correspond to June to November mean value and asterisks above indicate months with significant differences between treatments (T ≥ 4.2, p value < 0.05).
Agronomy 12 02507 g003
Figure 4. Intra-annual Enhanced Vegetation Index (EVI) variability of natural grassland four years before, and of the natural grassland (NG) and natural grassland overseed with legumes and fertilized with phosphorus (NG-LP), over nine years of intensification (year 0, arrow inside the panel). Points correspond to intra-annual Coefficient of Variation (CV) mean of 20 paddocks (NG, n = 20, NG-LP, n = 20), error bars indicate spatial standard error, horizontal dotted lines intra-annual CV mean (before intensification practice, F = 4, p value = 0.06; after intensification practice, F = 24.1, p value < 0.0001). Asterisks above indicate significantly different years (T ≥ 3.2, p value p ≤ 0.05).
Agronomy 12 02507 g004
Figure 5. Interannual Enhanced Vegetation Index (EVI) variability of natural grassland (NG) and natural grassland overseed with legumes and fertilized with phosphorus (NG-LP), from January to December. Points corresponds to annual EVI mean of 20 paddocks (NG, n = 20; NG-LP, n = 20) during the nine years of the intensification practice. Error bars correspond to spatial standard error, horizontal dotted lines indicate the CV of the interannual EVI mean.
Agronomy 12 02507 g005
Publisher’s Note: MDPI stays neutral with regard to jurisdictional claims in published maps and institutional affiliations.