Article

Extreme Weather and Grazing Management Influence Soil Carbon and Compaction

1
Department of Crop & Soil Sciences, University of Georgia; Athens, GA 30605, USA
2
U.S. Dairy Forage Center, USDA ARS, Madison, WI 53706, USA
*
Author to whom correspondence should be addressed.
Agronomy 2022, 12(9), 2073; https://doi.org/10.3390/agronomy12092073
Submission received: 13 July 2022 / Revised: 10 August 2022 / Accepted: 16 August 2022 / Published: 30 August 2022
(This article belongs to the Special Issue Advance in Grassland Productivity and Sustainability)

Abstract

:
Understanding the influence of cattle grazing on soil carbon and bulk density during extreme dry to wet periods can help us design more resilient and sustainable grazing systems for low-input management scenarios. A study was conducted to evaluate changes in loss-on-ignition (LOI) carbon and bulk density (BD) in the top 20 cm soil layer when eight continuous grazing (CG) pastures were converted to either continuous grazing with hay distribution (CHD-4) or strategic grazing (STR-4). STR included lure management of cattle with movable-equipages, exclusion and over-seeding erosion-vulnerable areas, and a relaxed rotational grazing. Changes in relationships between cattle density (CD), LOI, and BD were evaluated for change in grazing management from 2015 to 2018. Reduction in LOI carbon (0–5, 5–10, 10–20 cm) and BD (5–10 cm) were observed in both CHD and STR pastures in 2018. CD in 2015 had either no relationship or a negative relationship on LOI while in 2018, CD positively influenced LOI in CHD (0–5 cm) and STR (0–5 and 5–10 cm) pastures. STR had lower BD with higher CD further away from concentrated flow paths mirroring cattle movement. Exclusions in the STR pastures had the greatest reduction in BD. Even with reduced carbon in the 0–5 cm soil layer the reduction in BD in the 5–10 cm soil layer helped build resilience in grazing systems that experience extreme weather events such as going from very dry to extensively wet.

1. Introduction

Managing beef grazing pastures to promote soil health and reduce soil and nutrient losses is a challenge that cattle farmers in the USA and around the world must address to be sustainable [1,2]. Pastures can become a source of deleterious nutrients to nearby streams if poorly managed, or if well managed they can capture and retain carbon and improve rainfall infiltration (capture) into the soil [1,3,4,5]. However additional research is needed to determine which grazing system is best for which ecosystem [5]. Beef cattle production depends upon forage quality and productivity. Managing soil fertility through regenerative grazing management actions may help improve forage quality and productivity through internal inputs such as hay (grown on-farm) and capturing nutrients in manure and urine, which is important due to the rising cost of external inputs of nitrogen (N) and phosphorus (P) mineral fertilizers, organic fertilizers, and outsourced supplemental hay needed to feed grazing animals during drier periods [6]. The role grazing management plays to retain or rebuild soil health and forage productivity is mixed depending on landscape position [7,8,9,10]. In Arkansas pastures, the authors of [10] reported improved soil quality indices in rotationally grazed pastures within un-grazed, unfertilized, and fenced riparian buffers owing to retention of nutrients and increases in available water content, phosphorus, and potassium. A study of Florida pastures reported similar concentrations of soil organic carbon at grazing zones and cattle congregation sites such as waterers, shaded areas, and mineral feeders [7]. NO3-N, total inorganic nitrogen, and total nitrogen is lowest at the bottom foot slope landscape position where cattle graze most frequently, although it was unclear how grazing density differed between landscape positions [8]. In 10 Georgia Piedmont continuously grazed pastures, significant differences in soil C and bulk density were reported depending on where cattle were fed hay [9]. Beef cattle are grown in all 159 Georgia counties [11]. In light of the prediction, a greater incidence of extreme dry periods followed by extreme wet periods [12] and the extent of grazing in Georgia and the world, better management of grazed landscapes may effectively retain and sequestrate C to rebuild more resilient and sustainable grazing systems.
Soil organic carbon is one of the major indicators of soil quality and soil health due to the physical, chemical, and biological functions it plays in provisioning plant available nutrients [13]. Grazing cattle can increase compaction and consequently reduce air-filled porosity and water infiltration rate of pasture soil [14]. The same study reported up to 58% reduction in yield of forage from treaded pastures compared to pastures untreaded by grazing animals. A study on New Zealand pastures reported 2.5% decline in production for each 0.01 cm3 cm−3 decrease in microporosity along with 51–84% increased N2O emissions [15]. Pastures in the Southern Piedmont region of the USA have considerable potential to sequester soil organic carbon [16] but cattle can influence soil compaction and distribution of nutrients especially particulate nitrogen, phosphorus, and potassium [17] as well as plant available nitrogen [18,19] depending on grazing management.
Excessive grazing pressure by cattle can cause decline in soil organic matter and thus decline in pasture productivity [20]. However, cattle can also have a significant positive impact on the soil organic carbon pool near permanent shades and water sources in pastures [21]. High organic matter inputs or retention in the system may maintain or enhance soil nutrient contents [13]. Thus, grazing management decisions to improve soil organic matter content through use of grazing animals can be very useful.
Soil properties and their distribution over landscapes near stream networks could be helpful in management of riparian zones and further prevent non-point source pollution [22]. Retention of soil C can be greatly influenced by natural or cultivated vegetation [23]. Nonpoint source pollution from livestock grazing may be reduced by implementing combinations of best management practices while considering geomorphic characteristics [24]. Cattle congregation around farm equipages such as shades, hay-feeding areas, and waterers, can cause elevated nitrogen, carbon, and bulk density [9,18]. If these areas of congregation are vulnerable to erosion, these nutrients will be lost. Strategic placement of farm equipage to distribute cattle could result in amelioration or regeneration of soil health throughout the pasture.
Extreme weather events such as drought and extreme precipitation events have been predicted to increase globally [25]. In addition, duration and severity of soil water stress are also projected to increase [26]. Extreme precipitation events (greater volume and rate) may result in greater soil erosion and losses of carbon (in both sediments and in dissolved forms) [27]. Extreme drought events can have both direct and prolonged influences on soil moisture, microbial communities associated with nutrient cycling, biomass productivity, and thus the soil carbon balance [27]. One of the key strategies for mitigating the impact of extreme weather events is soil carbon-friendly management, yet there is a paucity of information on effects of weather extremes on farm scale soil carbon and nutrient cycling for various soil types and ecosystems [28].
Two grazing systems were converted from continuously grazed (CG) to either: a continuous grazing with hay distribution (CHD), or a strategic grazing system with lure management of cattle and exclusion and over-seeding of areas vulnerable to erosion (STR). The objectives of this study were: (1) to evaluate changes in loss-on-ignition carbon (LOI) and bulk density (BD) in the top 20 cm layer of soil after 2 years of conversion from CG to CHD and from CG to STR; (2) compare the difference in change in soil carbon and bulk density between CHD and STR; (3) compare changes in relationships between cattle density (CD):LOI, CD:BD, and CD:BD:LOI; and (4) between grazing systems CG, CHD, and STR to determine the extent of change in CD, BD, and LOI within locations: nearness to concentrated flow paths (CFPs) and where cattle frequented in CG. In pastures experiencing an annual drought followed by two years of extreme rainfall we hypothesized that: (1) both CHD and STR grazing systems would increase LOI and reduce BD compared to CG; (2) BD will be reduced and LOI carbon will be increased more in STR than in CHD; (3) changes in LOI and BD will be influenced by changes in cattle density (CD) in STR more than in CHD; and (4) CD and BD will decrease in STR where during baseline cattle tended to congregate.

2. Materials and Methods

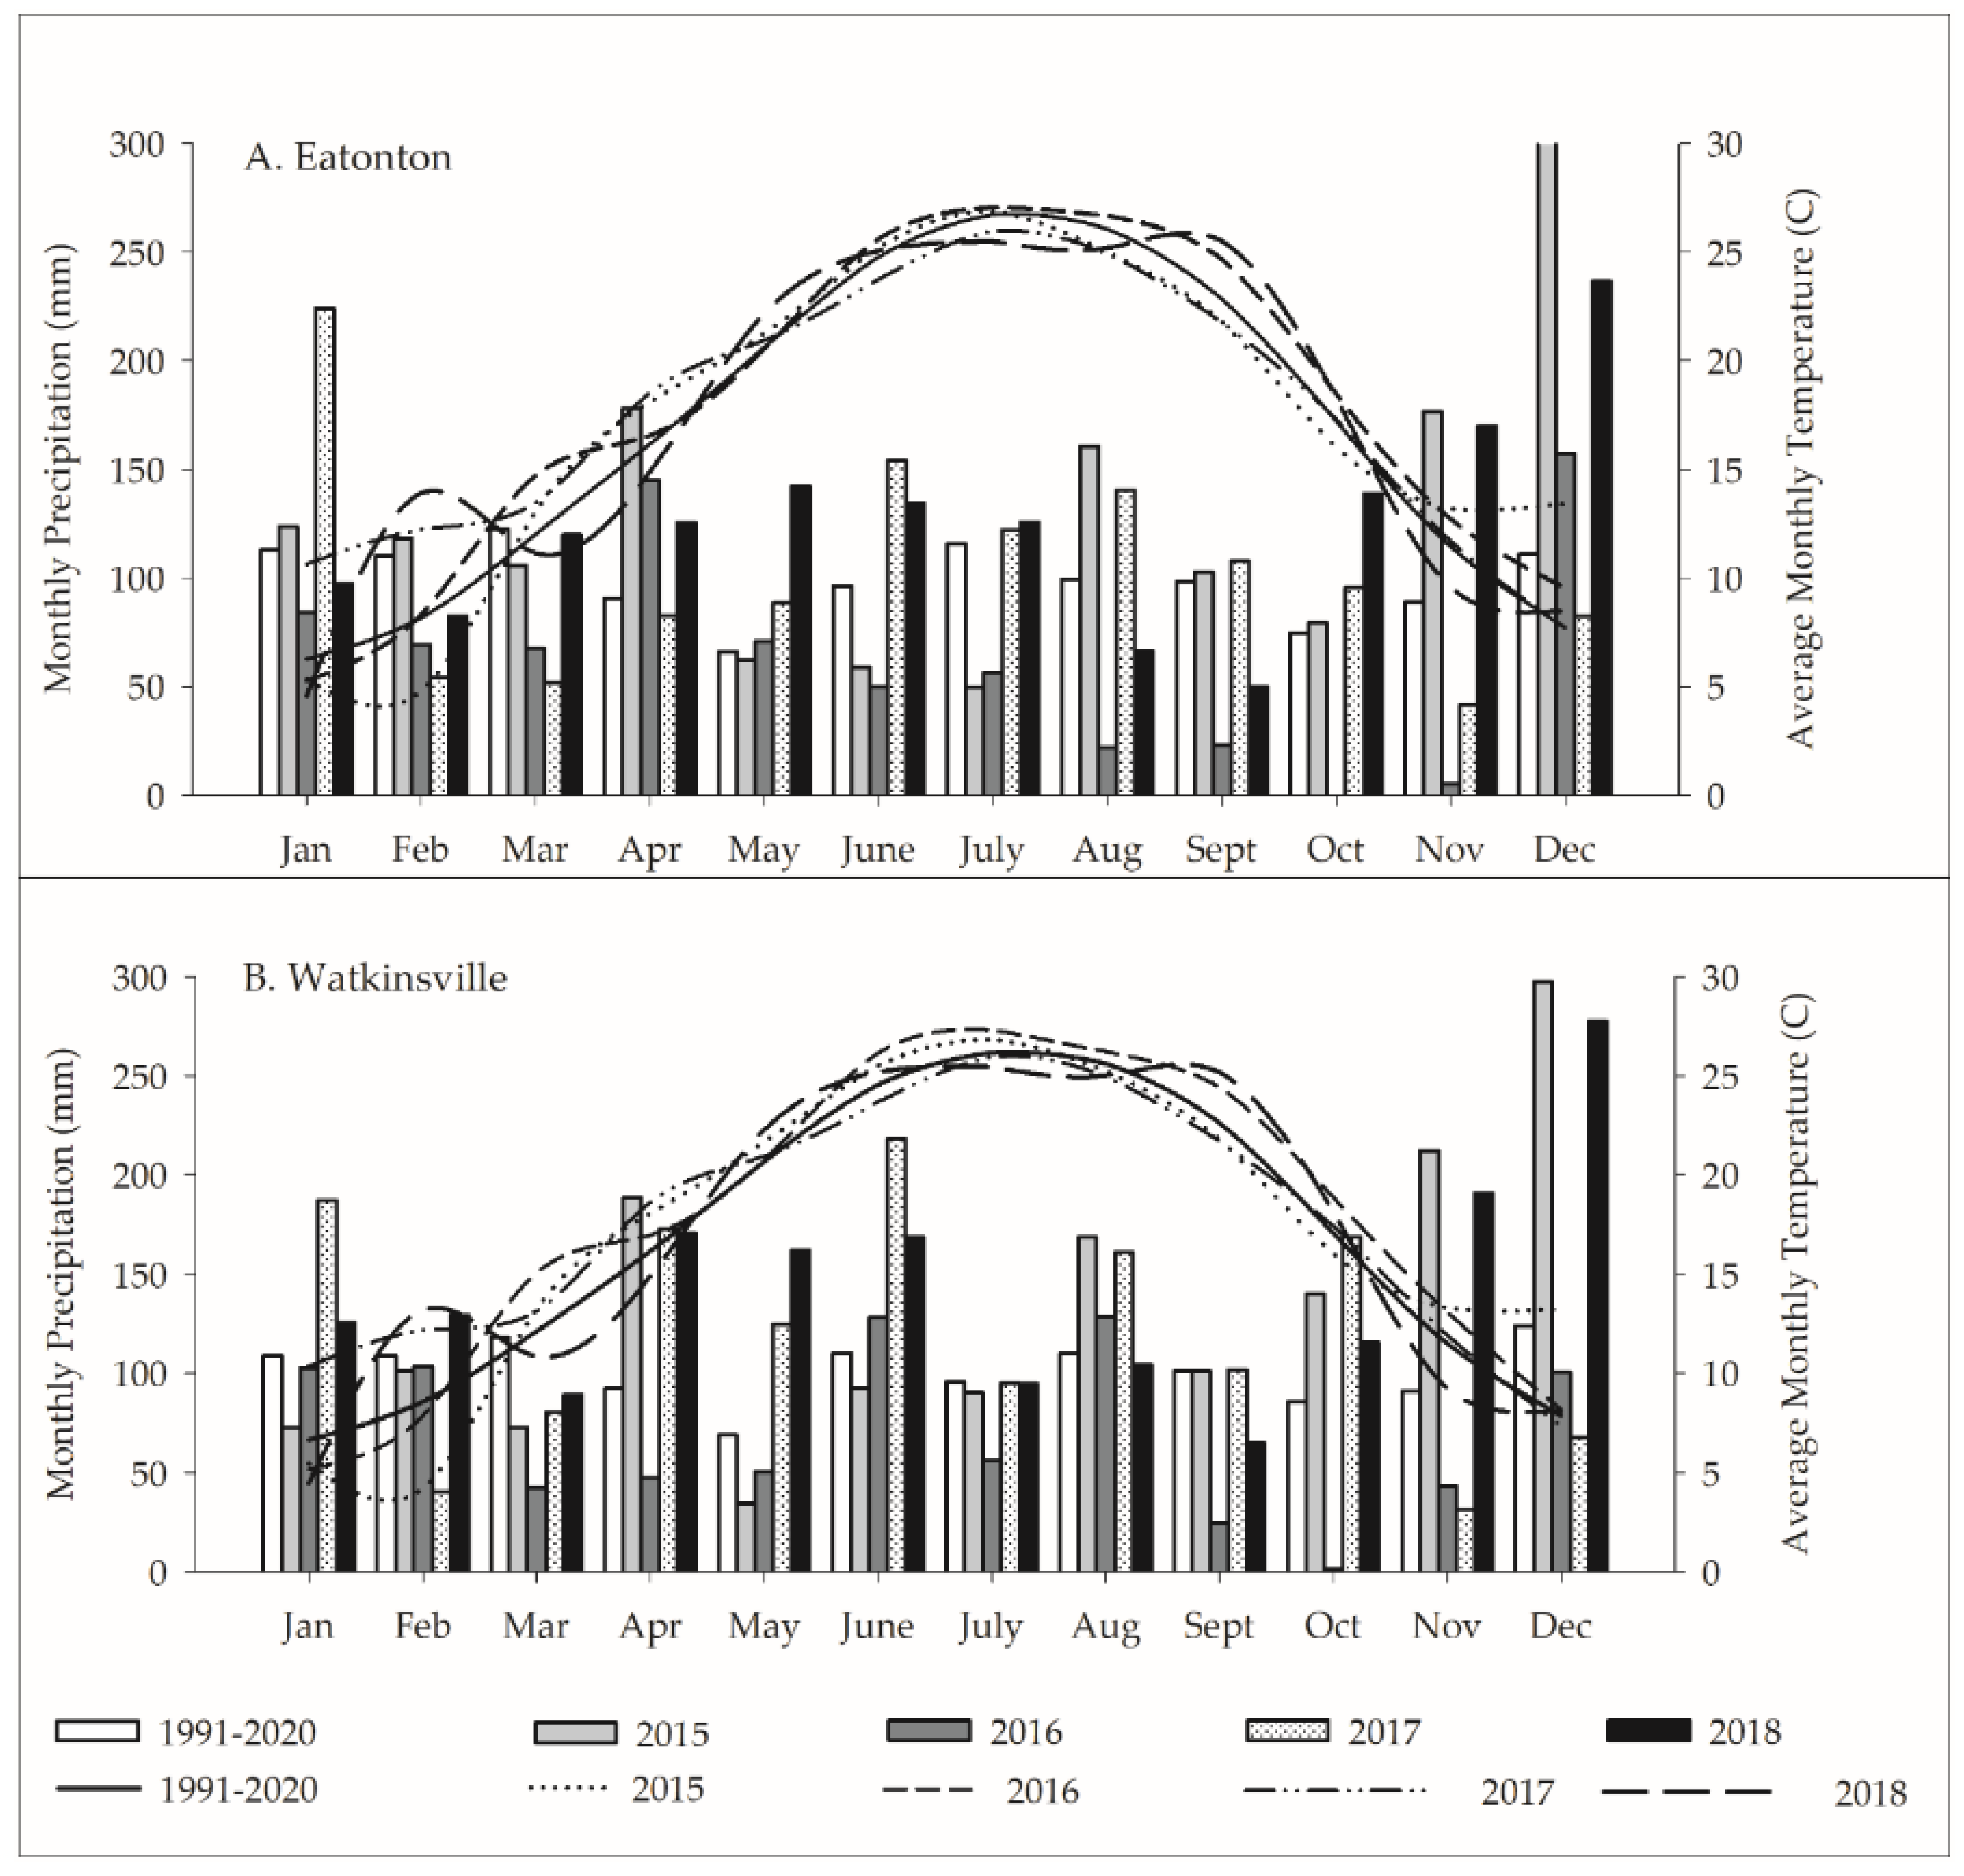
2.1. Characteristics of the Study Sites

Climate in the region of the study sites is characterized by moderate and wet winters and long and dry summers. The monthly precipitation and average monthly temperature in the study pastures from 2015 to 2018 were obtained from the Georgia Automated Environmental Monitoring Network managed by the College of Agricultural and Environmental Sciences, University of Georgia, and the 30-year normal monthly precipitation and average monthly temperature for the closest available stations were obtained from the National Oceanic and Atmospheric Administration website, presented in Figure 1.This study was conducted in eight pastures within the Georgia piedmont; four at J Phil Campbell (JPC) Sr. Research and Education Center (33.887487° N, 83.420966° W; elevation 213–259 m, Watkinsville) in Oconee County, Georgia, U.S., and in four pastures at the Eatonton Beef Research Unit (33.420759° N, 83.476555° W, elevation 152–177 m, Eatonton) in Putnam County, Georgia, U.S. (Figure 2).
Soil series in Eatonton pastures are predominantly Davidson (~60%; fine, kaolinitic, thermic Rhodic Kandiudults) loam (2–6% slope) to clay loam (6–10% slope) and Wilkes (17%; loam to sandy loam, mixed, active, thermic shallow Typic Hapludalfs). The associated soils, on side-slopes and toe-slopes are Iredell (12%; fine, mixed, active, thermic, Oxyaquic Vertic Hapludalfs) loam, and Enon (11%; fine, mixed, active, thermic Ultic Hapludalfs) [9]. Watkinsville soils are mapped as Cecil (60%; fine, kaolinitic, thermic Typic Kanhapludults) sandy loam (2–6% slope) and Pacolet (40%; fine, kaolinitic, thermic Typic Kanhapludults) sandy clay loam soils (6–10% slope) [9].

2.2. Experimental Design and Sampling

Prior to 2015, all pastures under study were grazed continuously with 1.7–2.2 cattle head ha−1 for >10 years. Cattle had access to all locations including areas with high compaction, reduced infiltration, and vulnerable to erosion. These vulnerable areas were generally those that provided shade to grazing animals and were often on lower edges of pastures that were in concentrated flow paths and/or steep slopes near riparian areas. The baseline period started in spring 2015 and ended spring 2016 and remained as continuously grazed with hay, water, and shade in static locations. Pasture identifications were: Eatonton; North East (ENE), North West (ENW), South East (ESE), and South West (ESW) and Watkinsville; North East (WNE), North West (WNW), South East (WSE), and South West (WSW) (Table 1).
In May 2016, two grazing system treatments were implemented: (1) strategic grazing (STR) and (2) continuous grazing with hay distribution (CHD). Each study site had two replications of CHD and STR treatments resulting in four replications for each treatment. During post-treatment, all pastures under study were managed with a cattle density of 1.1 cattle head ha−1. In CHD pastures, the management differed from baseline management only in that hay was distributed rather than static. In STR pastures hay, waterers, and shade and cattle were rotated every 7–10 days (relaxed rotational grazing). In addition, the vulnerable areas were excluded and over-seeded with winter and summer mixed forages (details below). Flash-grazing of the exclusions was completed based on forage availability in each of the exclusions approximately once a month during June, July, August, September, and March. Each flash-grazing lasted approximately four to eight hours as exclusions were opened for grazing in the morning and closed in the afternoon prior to the farm manager leaving for the evening. Cattle were allowed to flash graze when mixed forages were 15–25 cm tall. Exclusion areas in respective pastures are presented in Table 1. Use of movable farm equipages such as shades, waterers, and hay feeding rings were used to lure cattle to different locations.
Soil sampling was completed on a 50 m grid laid over the study pastures in March through June 2015 as a baseline and in April–June 2018 as post-treatment (Figure 2). Two core samples (5.5 cm inner diameter) were collected at each sampling point using a Giddings probe (Giddings Machine Company Inc., Windsor, CO, USA) mounted on a truck. Each sample core was then cut into sections of 0–5, 5–10, and 10–20 cm and stored separately. The soil samples were then air-dried (20 °C), weighed, ground, and sieved (2 mm).

2.3. Treatment Setup

Overseeded exclusions and movable-waterers, -hay-feeding-rings, and -shades were introduced in STR pastures in May 2016. In CHD pastures, hay was fed by distributing it to other locations in the pastures instead of conventional hay feeding at fixed locations in the pastures. In STR pastures, exclusions were over-seeded with pearl millet (Pennisetum glaucum), crabgrass (Digitaria spp.), and cow pea (Vigna unguiculata) in the spring and with crimson clover (Trifolium incarnatum), canola (Brassica napus), ryegrass (Lolium), and cereal rye (Secale cereale) in the fall.

2.4. Cattle Density Determination

Cattle density was determined using two to three cattle with GPS 3300LR livestock collars (Lotek Engineering, Newmarket, ON, Canada) within each pasture to record animal locations (±5 m) at 5 min intervals for 28 days. The collars were removed from cows every 28 days, data were downloaded, batteries recharged, and put back on cows for another 28 day cycle. Georeferenced data were processed, the location (point) data files were imported in ArcGIS, and projected to the NAD 1983, 17N UTM system for further analysis. The Point Density Tool was used to convert the location points into raster with point density as the number of fixes per area (m2) using a 5 × 5 m cell size for each collar and each month. Because there were 28-day intervals where a collar failed to collect all possible fixes, we normalized the data to correct for absence of data. The following equation was used to normalize the number of fixes (F) for number of fixes in a month and year, total number of cattle, and total area to come up with a standard density raster [18].
Standard density = (S × Cp × 365 × Ct)/(F × D × A)
where S = standard number of fixes = days in month the collar was deployed × possible fixes in a day (288),
  • Cp = number of cattle in the pasture,
  • Ct = total number of cattle (2015),
  • F = number of fixes per m2 determined using the Point Density Tool,
  • D = days in year the collars recorded locations, and
  • A = total area of all study pastures in each location (2015).
The standard densities for the replicate collars were averaged for each month period and then summed up for each month beginning in May 2016. Monthly average density was determined as the sum of standard densities for the months cattle were in the pastures and divided by the number of those months. To determine annual density, monthly average density was multiplied by 12 to convert it into hours spent by cattle at a particular location on an annual basis in terms of cow hour m−2 year−1. Cattle density raster was calculated for each watershed for the baseline and post-treatment for each CHD and STR and for exclusions in STR (2015 and 2018 only; Table 1).

2.5. Generating Concentrated Flow Paths (CFPs) and Buffers

Watershed delineation was completed using the ArcGIS (ESRI, Redlands, CA, USA) digital elevation model made from point files (4 cm resolution). The Flow Direction Tool was used with input from DEM to generate flow direction which was used as input in the Flow Accumulation Tool to generate the flow accumulation raster. Flow accumulation rasters were converted into polyline vectors to represent concentrated flow paths (CFPs) with the Stream to Feature Tool. The CFPs were used to create 20, 40, and 60 m buffers on both sides of the polylines. All points falling in 20 m buffers were labeled as 0–20 m points, 20.01–40 as 20–40 m points, 40.01–60 m as 40–60 m points, and points further away than 60.01 m were labeled as >60 m.

2.6. Analysis of Soil Samples

Loss-on-ignition carbon (LOI) was determined gravimetrically calculating the amount of mass lost while heating ~1 g soil (corrected for moisture content) for 8 h at 550 °C in a Thermolyne muffle furnace (model F6010, Thermo Fisher Scientific Inc., Asheville, NC, USA). SOC concentrations from the same pastures had a strong linear relation (R2 = 0.90) with LOI carbon where SOC was 0.47 times LOI [9]. Bulk density (BD) was calculated using 5.5 cm diameter cores after correcting the samples for moisture [29].

2.7. Statistical Analysis

Overall changes in BD and LOI from 2015 and 2018 in the CHD and STR treatments were compared using one-way Analysis of Variance (ANOVA) for each soil depth (0–5, 5–10, and 10–20 cm). The medians were compared (2015 versus 2018) using Wilcoxon’s Test due to non-normal data distribution for BD and LOI. Comparisons of LOI and BD between the sampling years in CHD and STR pastures at different distances from CFPs for each soil depth were completed using a one-way ANOVA and the median values were compared using Wilcoxon’s Test due to non-normal data distribution. Comparison of slopes of regression between sampling years for the relationships of CD with BD and LOI were made using simple linear regression with BD or LOI as the response variable and CD and sampling year as independent variables. Significance of the interaction term (CD*Year) denotes difference in slope of regression between 2015 and 2018. Test of significance was completed at the <0.1 level of significance. All statistical analyses were performed using JMP software package (JMP®, Version 14. SAS Institute Inc., Cary, NC, USA, 1989–2019).

3. Results and Discussion

3.1. Overall Soil LOI and BD Changes with Change in Grazing System

Overall reduction in LOI carbon was evident in 2018 in comparison to 2015 in both treatments and at all sampling depths (Table 2). The reduction in LOI carbon could in part be explained by increased inorganic N [19], and available P [30] in 2018 compared to 2015. We also found [19] that permanganate oxidizable carbon increased with depth in these same soils, which suggests increased biological activity and supports our assumption that LOI was decomposed releasing more plant available N and P. Mass calculations indicate that mineralization of N and P from LOI did not account for all the reduction in LOI in the three soil layers. Prolonged drought in 2016 (Figure 1) and subsequent rewetting of the pasture soils in early 2017 could release CO2 further explaining the reduction in LOI carbon in post-treatment samples. Higher soil respiration in the study pastures was reported in 2017 as compared to 2015, further supporting mineralization of fractions of organic soil carbon into more labile C, N, and P pools [19].
While overall population changes in LOI carbon showed a reduction, the location of high and low concentration areas (hot spots and cold spots) did change. Results from the Hot Spot Analysis tool (ESRI, Redlands, CA, USA) (Figures S1 and S3) showed positive increases in LOI in the upper elevations of each pasture for all soil depths sampled in 2018 for both CHD and STR pastures.
Lower median BD was evident at the 5–10 cm soil layer in 2018 compared to 2015 for both CHD and STR (Table 3). In 2015, median BD was >1.6 g cm−3 within the 5–10 cm soil layer in both treatments, whereas in 2018 median BD decreased to <1.5 g cm−3 in that same layer. In the 0–5 cm layer, BD slightly yet significantly increased in CHD pastures while in the 10–20 cm soil layer BD was significantly less in STR pastures in 2015 compared to 2018. Coldspots (significant reduction in BD) within the Hotspot analysis support these findings (Figures S2 and S4). We speculate that the reduction in BD and location of reductions were a consequence of better distribution of cattle to ameliorate BD at 5–10 cm and improved soil biological activity expressed as increased respiration, POXC, inorganic N [19], and plant available P [30].

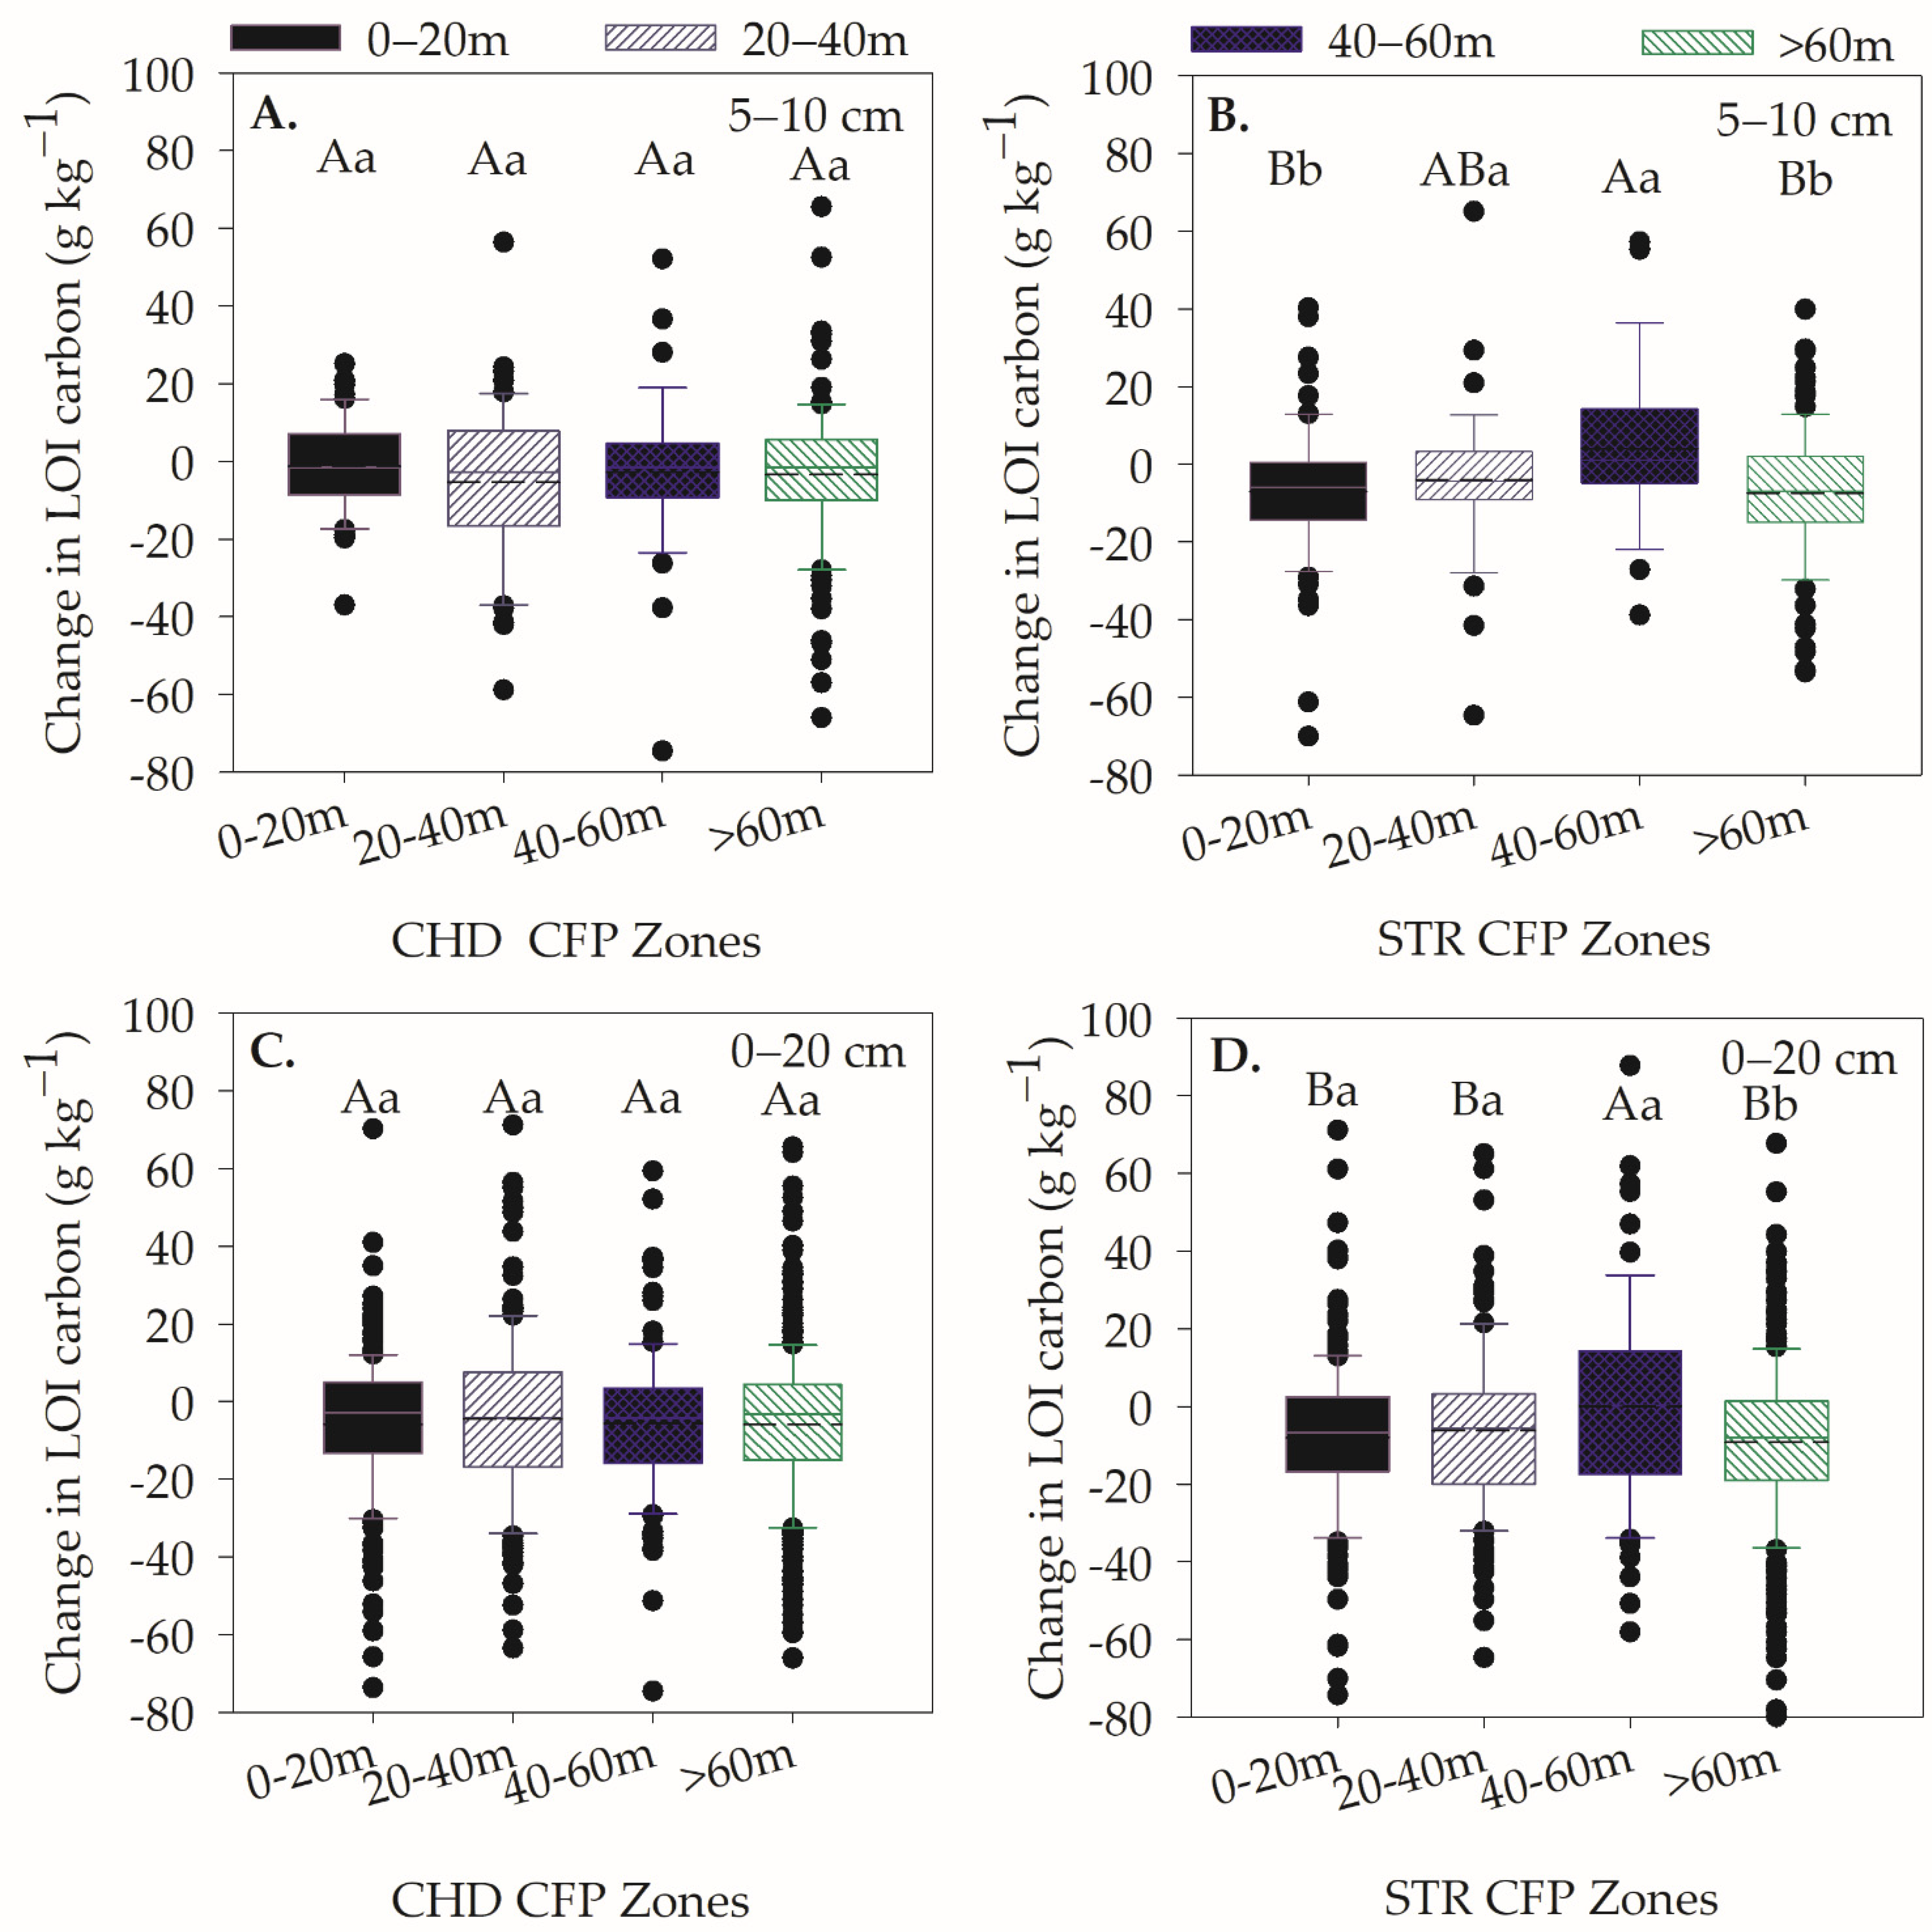
3.2. Changes in LOI and BD at Different Distances from CFPs

Hot Spot Analysis indicated that many of the hot spots (High LOI and High BD) in 2015 were in concentrated flow paths and cattle density analysis indicated that this was also the area where cattle frequented (see Section 3.4). Analysis of LOI by distance from CFPs (0–20, 20–40, 40–60, and >60 m from CFPs) identified no differences between CFP zones in the CHD or STR pastures for either 2015 or 2018. Changes or the difference in LOI between 2015 and 2018 were, however, significantly different when considering the CFP zone.
CFP zone 40–60 m had significantly greater positive change (2018–2015) in LOI than all CFP zones other than 20–40 m when across all soil depths (Figure 3A,B). Comparison of CFP zones between CHD and STR indicated greatest reduction in LOI carbon from the STR 0–20 m CFP zone. Although [19] found that permanganate oxidizable carbon increased with depth in these pastures, we must also consider that it could have been lost in runoff because CFP zone 20 m is vulnerable to erosive action. Two years of STR management may not have been sufficient to reverse the impact of legacy grazing practices in areas most vulnerable to erosive action.
The greatest increase in LOI (2018–2015) was in STR pastures in the 5–10 cm soil depth of the 40–60 m CFP zone (Figure 3D) which corresponds to the greatest reduction in BD in the same CFP zone and soil depth (Table 4). This greater LOI and reduced compaction could result in greater infiltration of rainfall in the upper portions of pastures and greater downward movement of solutes and labile forms of carbons. To further support this speculation, we found a stronger relationship of LOI in 5–10 and 10–20 cm soil depths in STR pastures with significantly greater slopes of the regression in 2018 compared to 2015 (Figure 4).

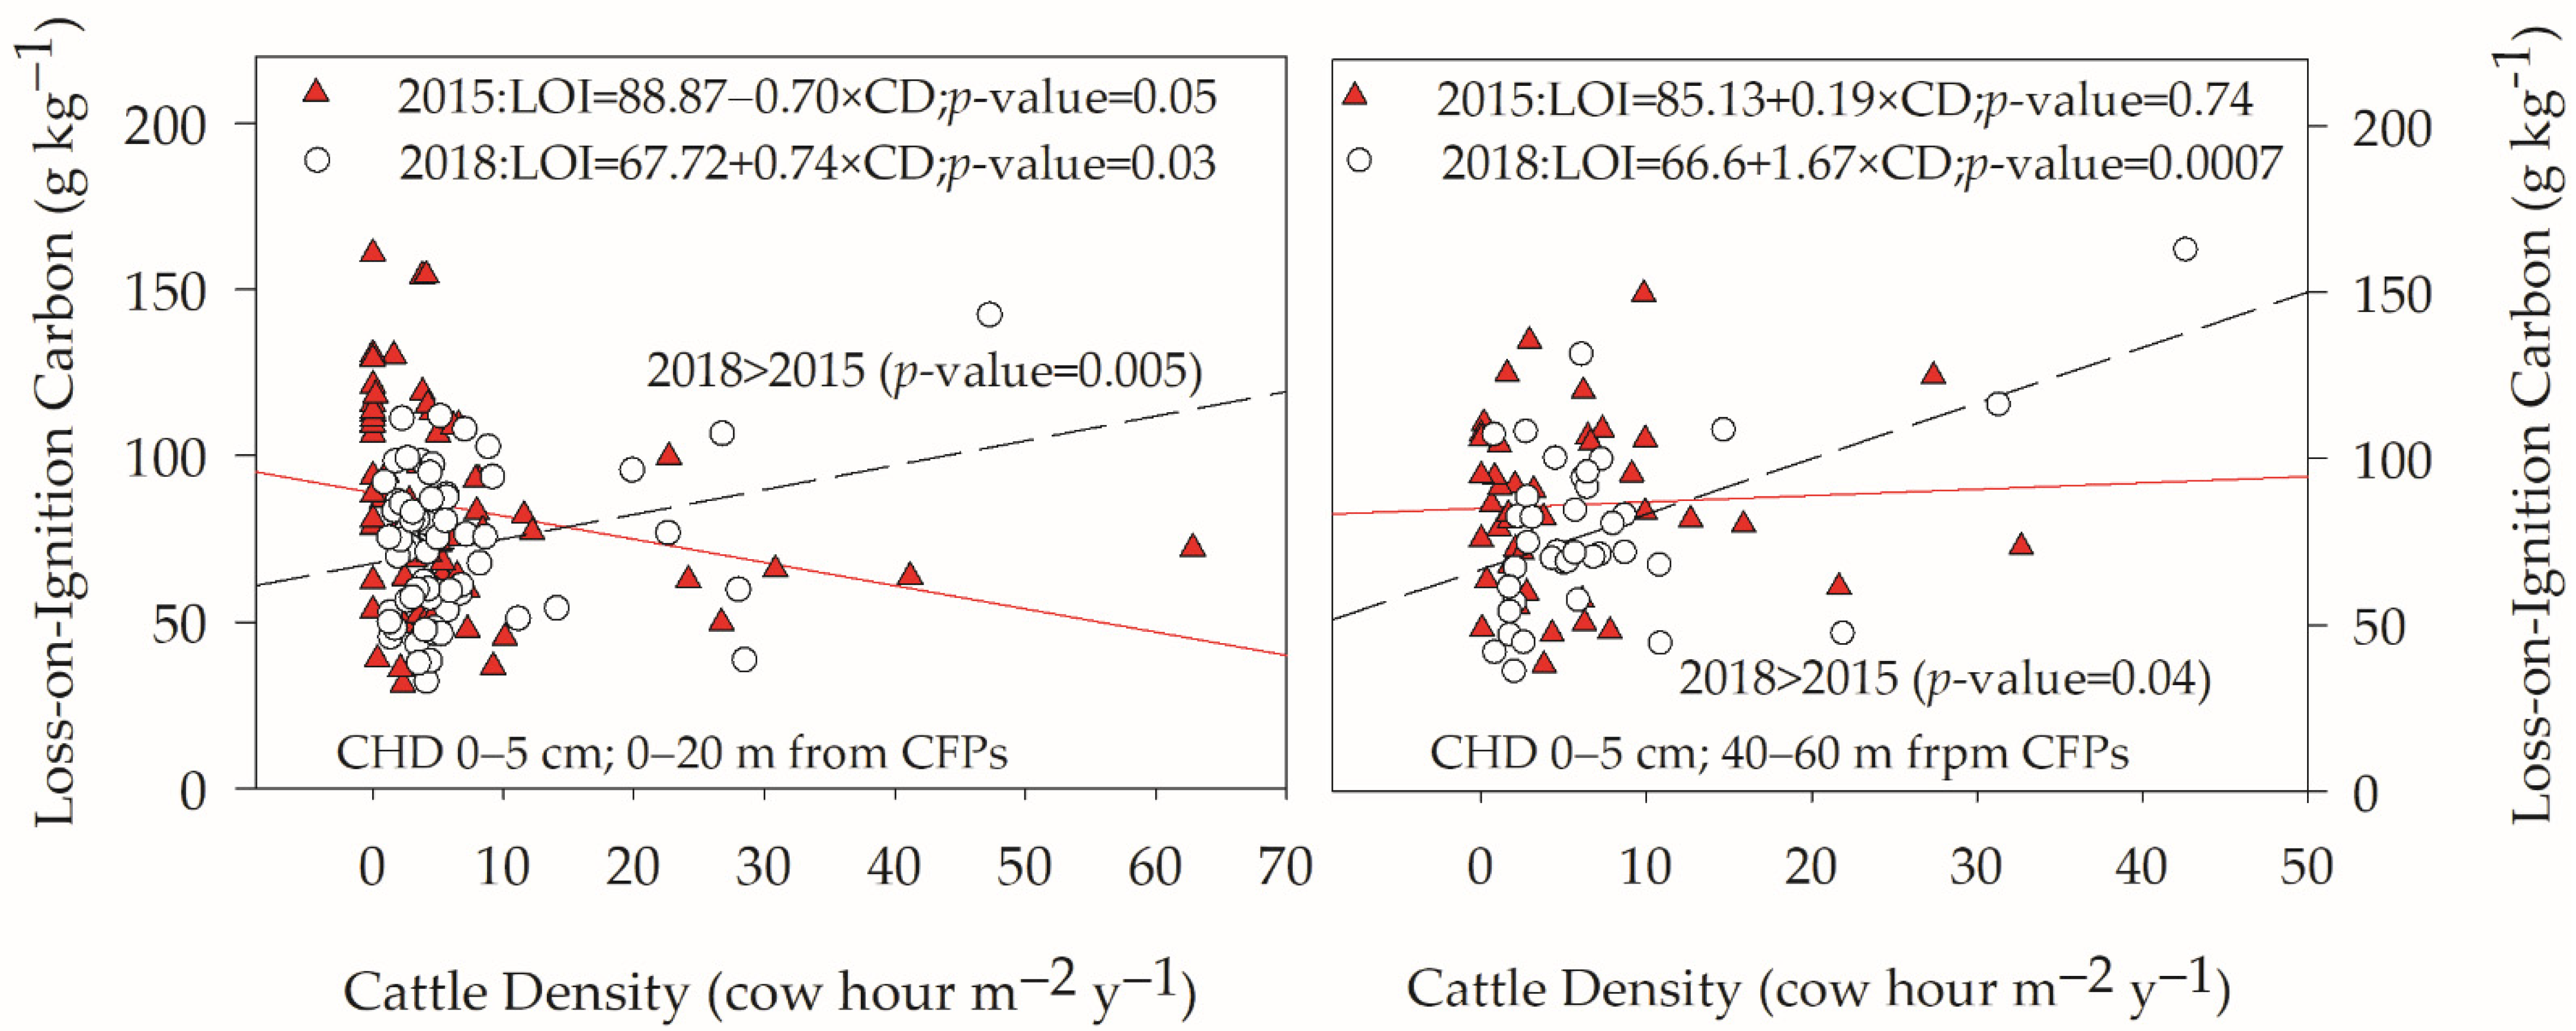
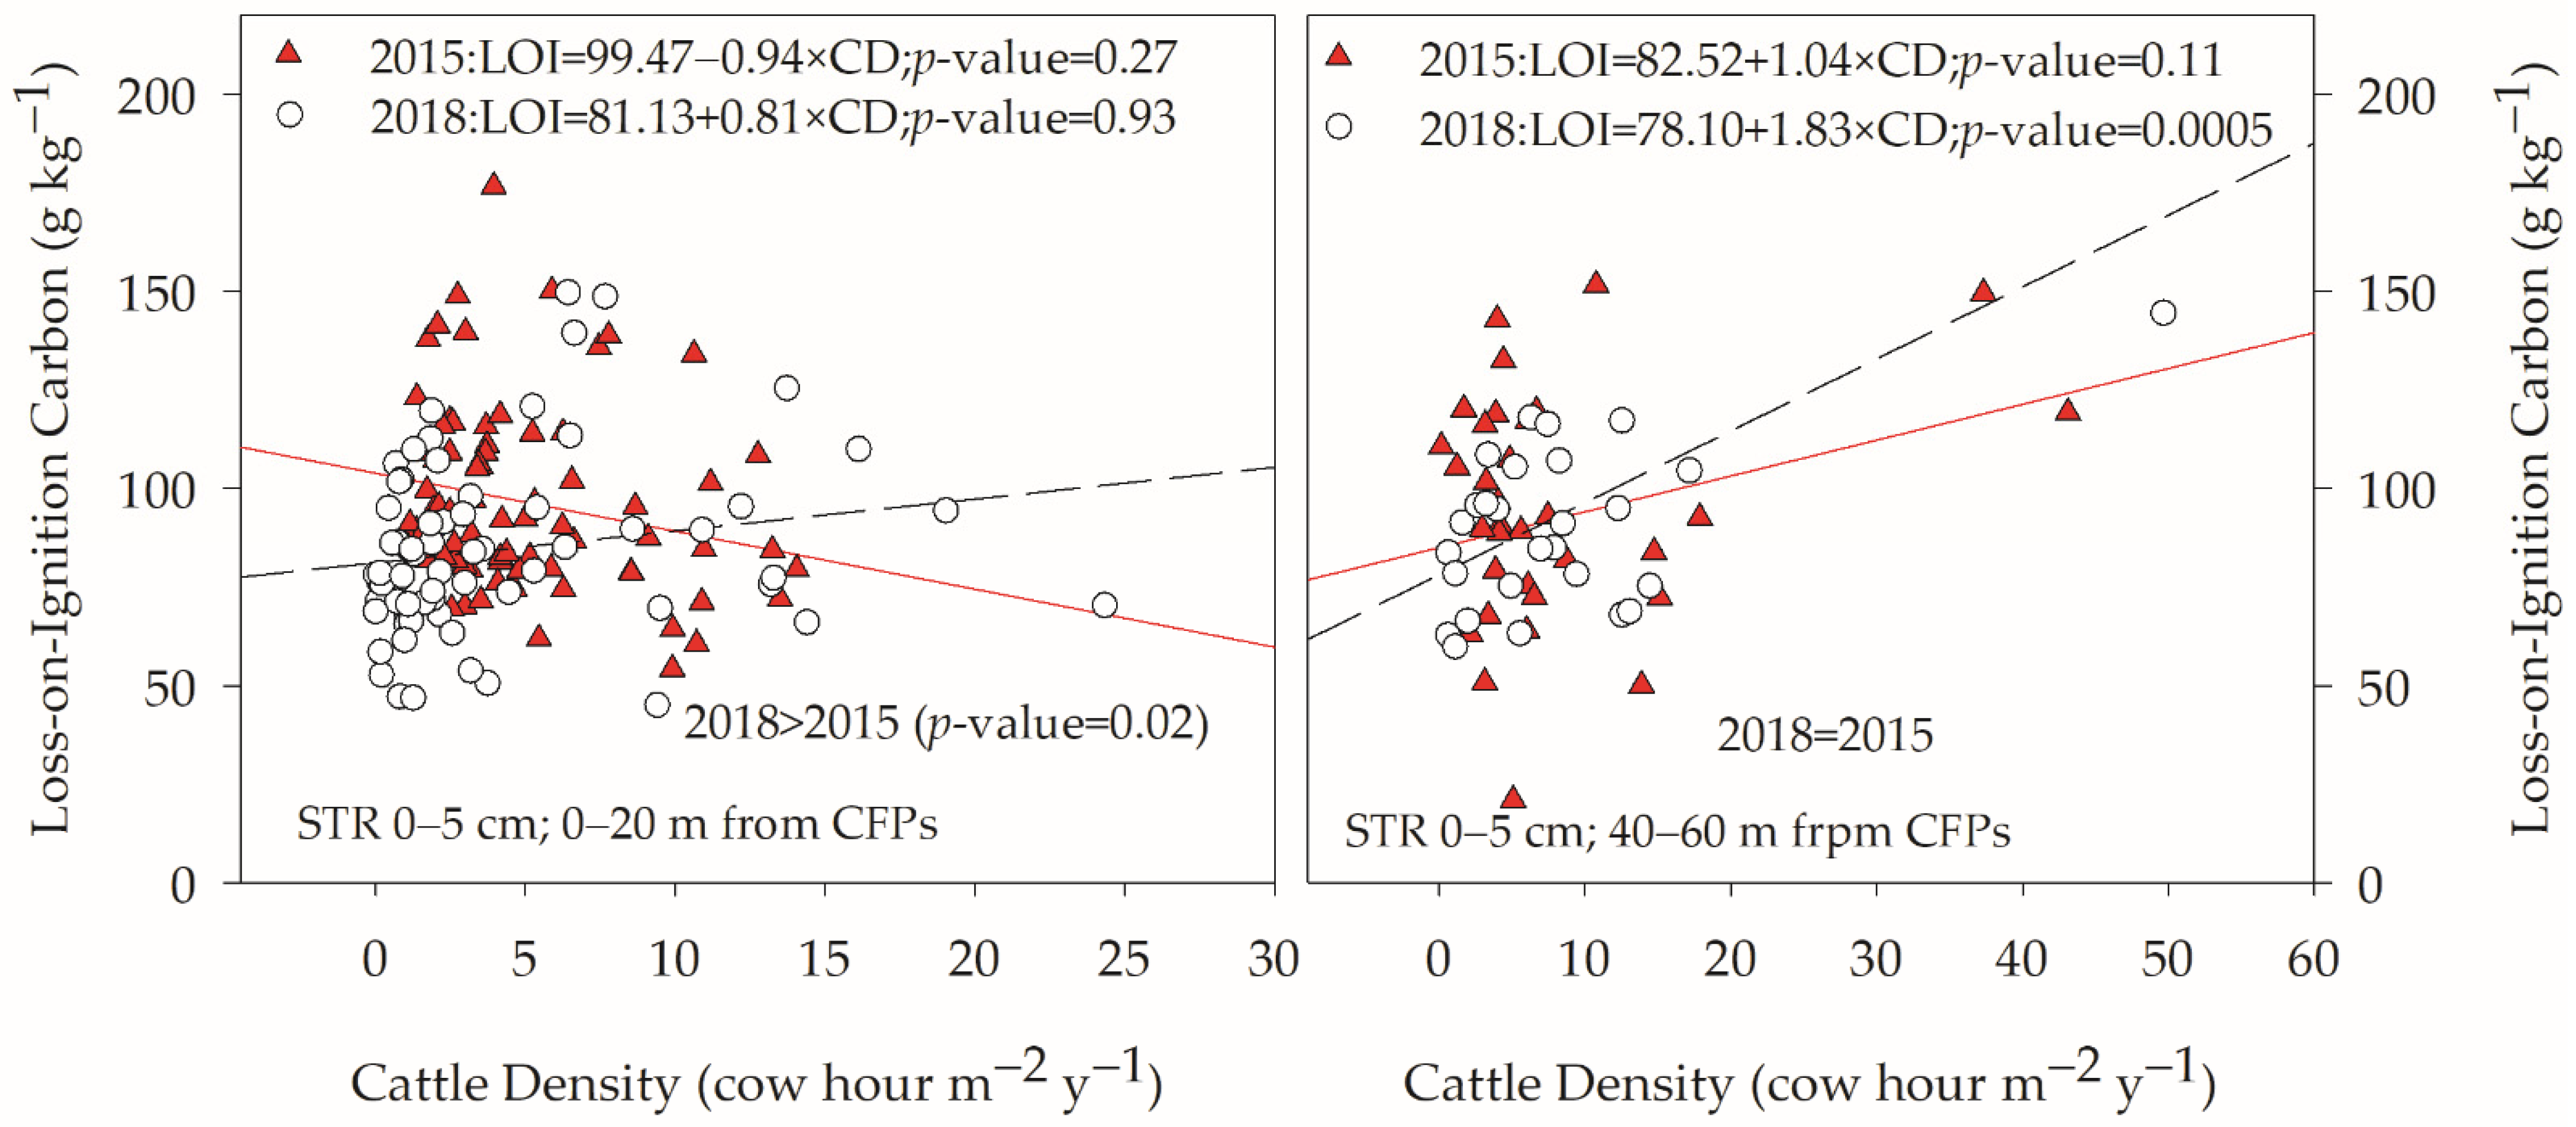
3.3. Influence of Cattle Density on LOI

The strongest significant relationships between CD and LOI for CHD pastures were found for the 0–5 cm soil layer within the 0–20 and 40–60 m CFP zones (Figure 5). The relationships were significantly and distinctly different in 2018 compared to 2015 in both zones. In 2018, CD had a positive relationship with LOI whereas in 2015 CD had a negative relationship with LOI. This could be due to hay-feeding at different locations adding hay-residue-carbon along with carbon in cattle dung. No influence of CD on LOI was observed at 5–10 or 10–20 cm depths of CHD.
In STR pastures and for several CFP zones, significant positive relationships between CD and LOI were found in 2018 for the 0–5 cm soil layer whereas either a negative or no relationship was apparent in 2015. Figure 6 illustrates that with STR increased cattle density can increase LOI carbon both near CFPs (0–20 m) and further away from CFPs (40–60 m). In STR pastures, high CD values and low LOI carbon in 2015 suggest carbon deposited by congregating animals was not incorporated into the soil due higher BD values in the 5–10 cm soil depth in 2015. In contrast, in 2018, the steeper positive relationship of LOI with CD (0–5 cm and 5–10 cm soil depths) suggests incorporation of carbon sources to greater depths within the STR pastures (data not shown).

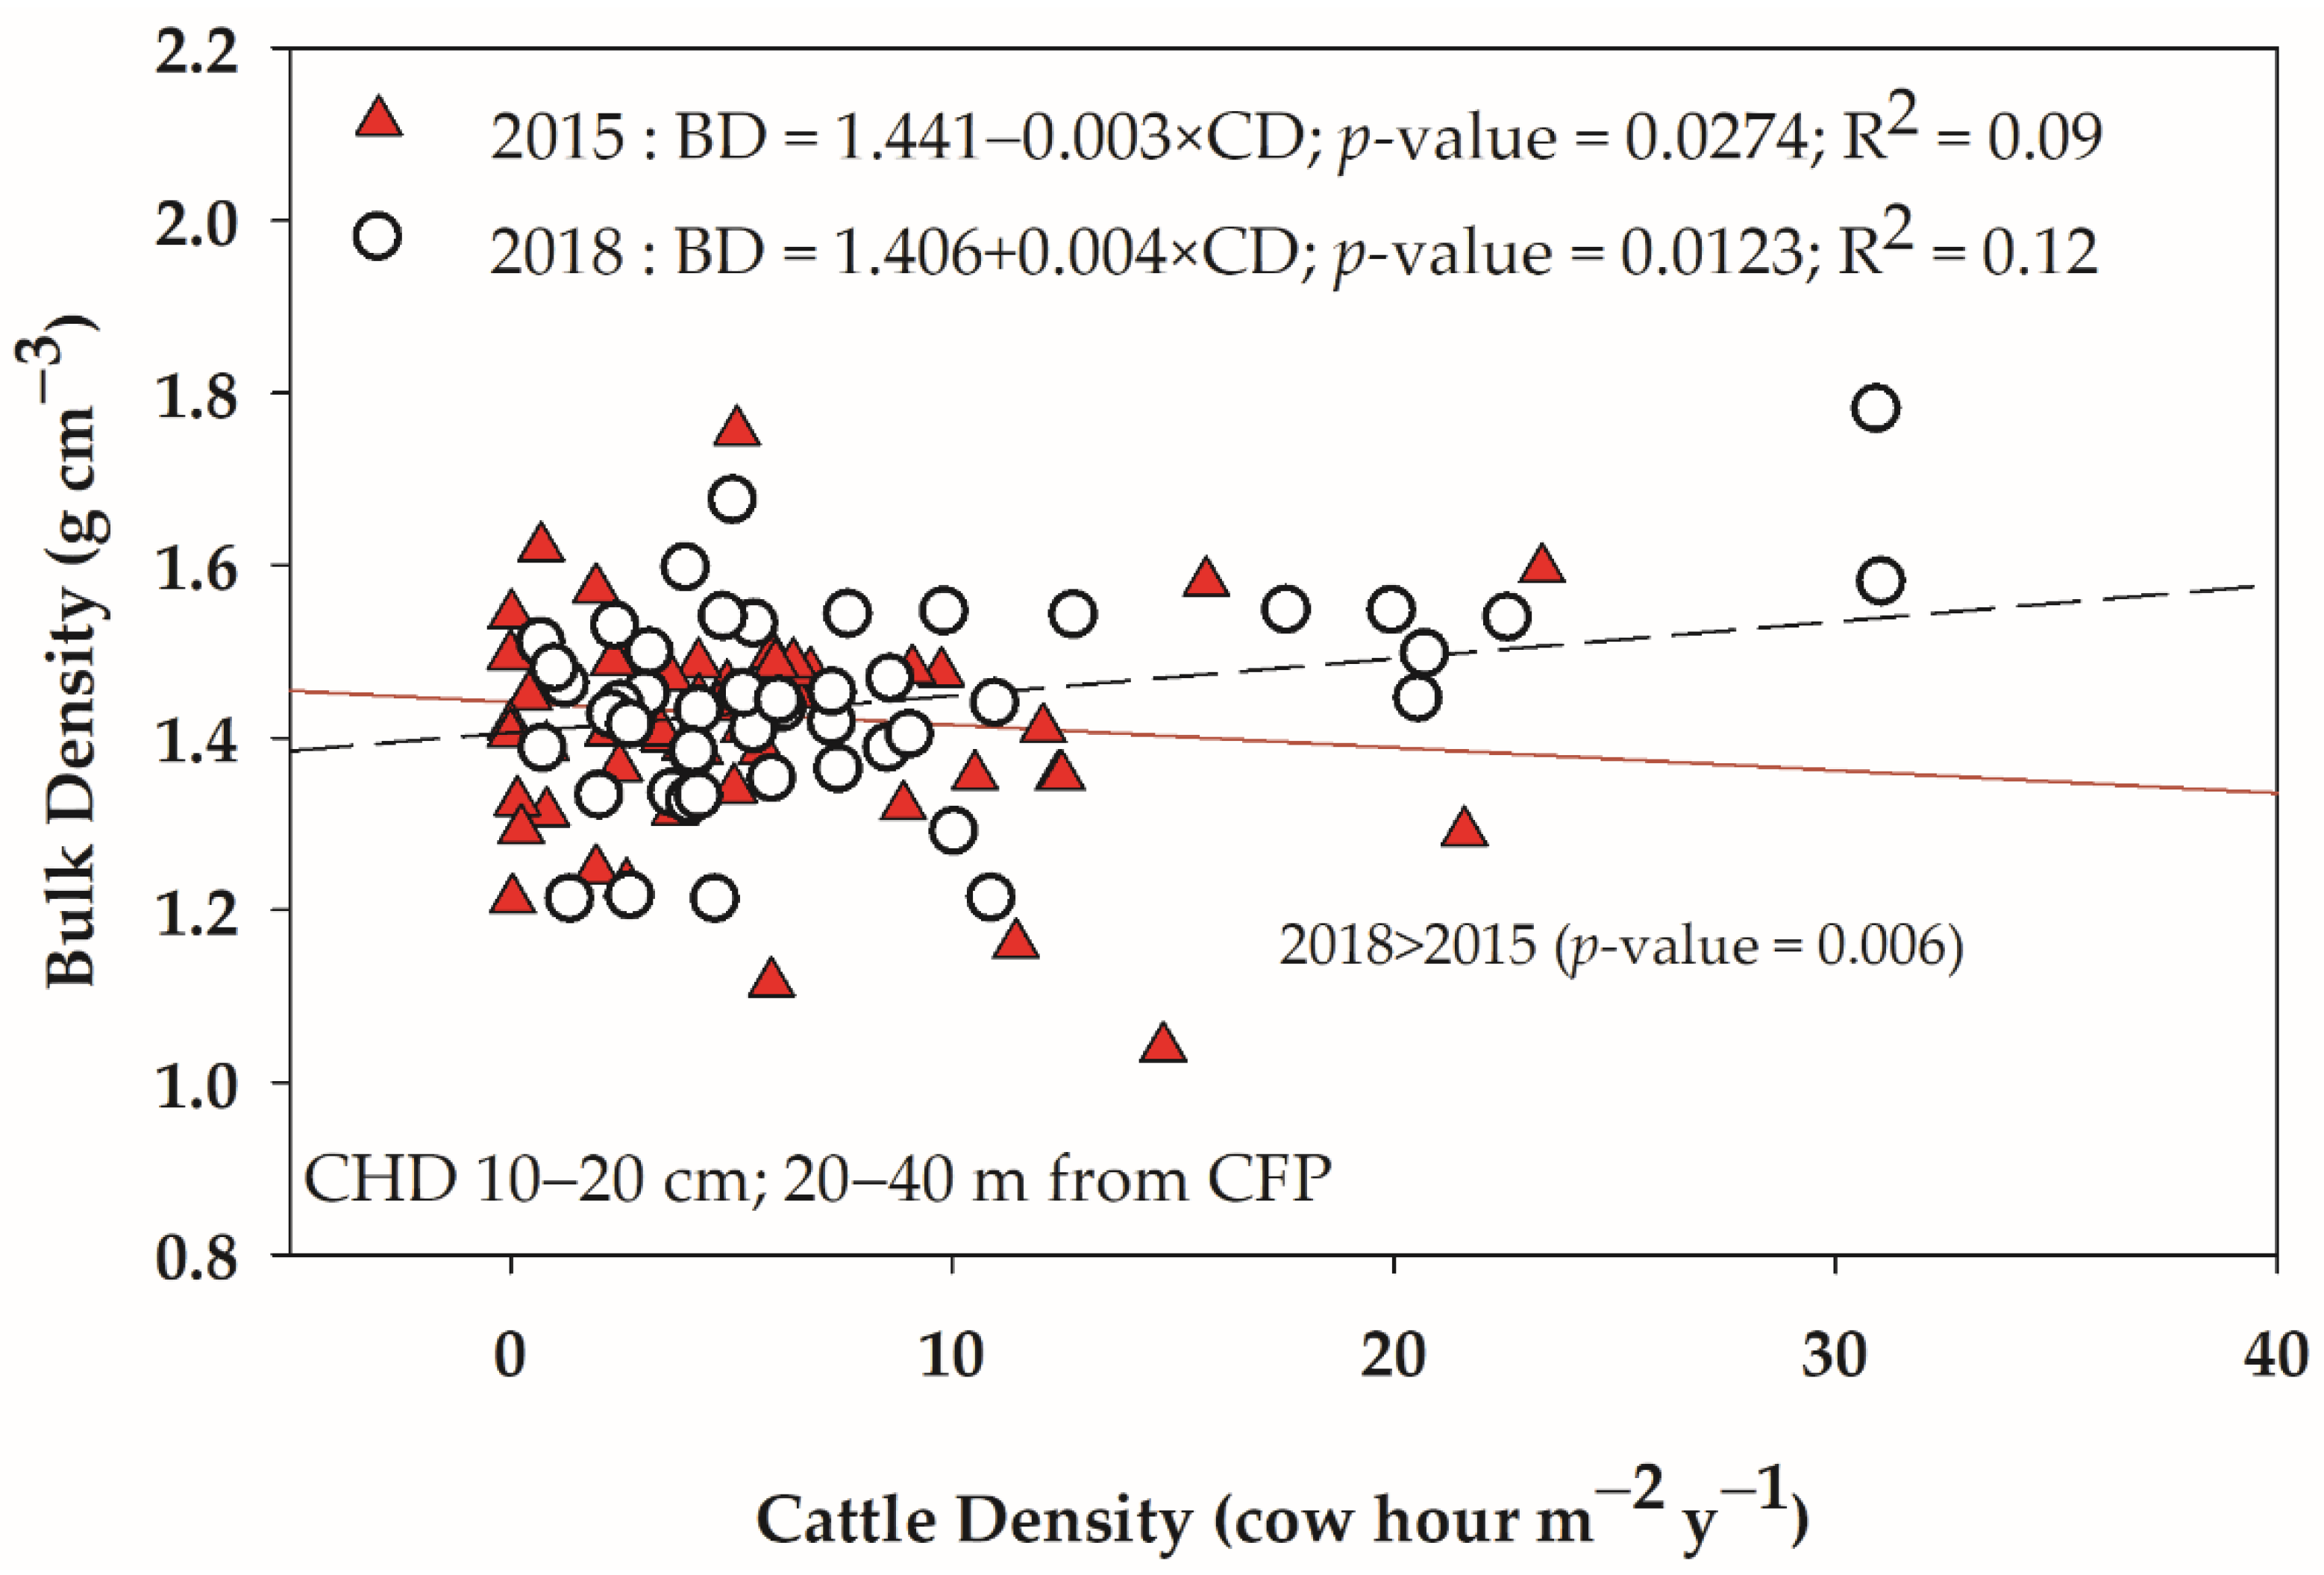
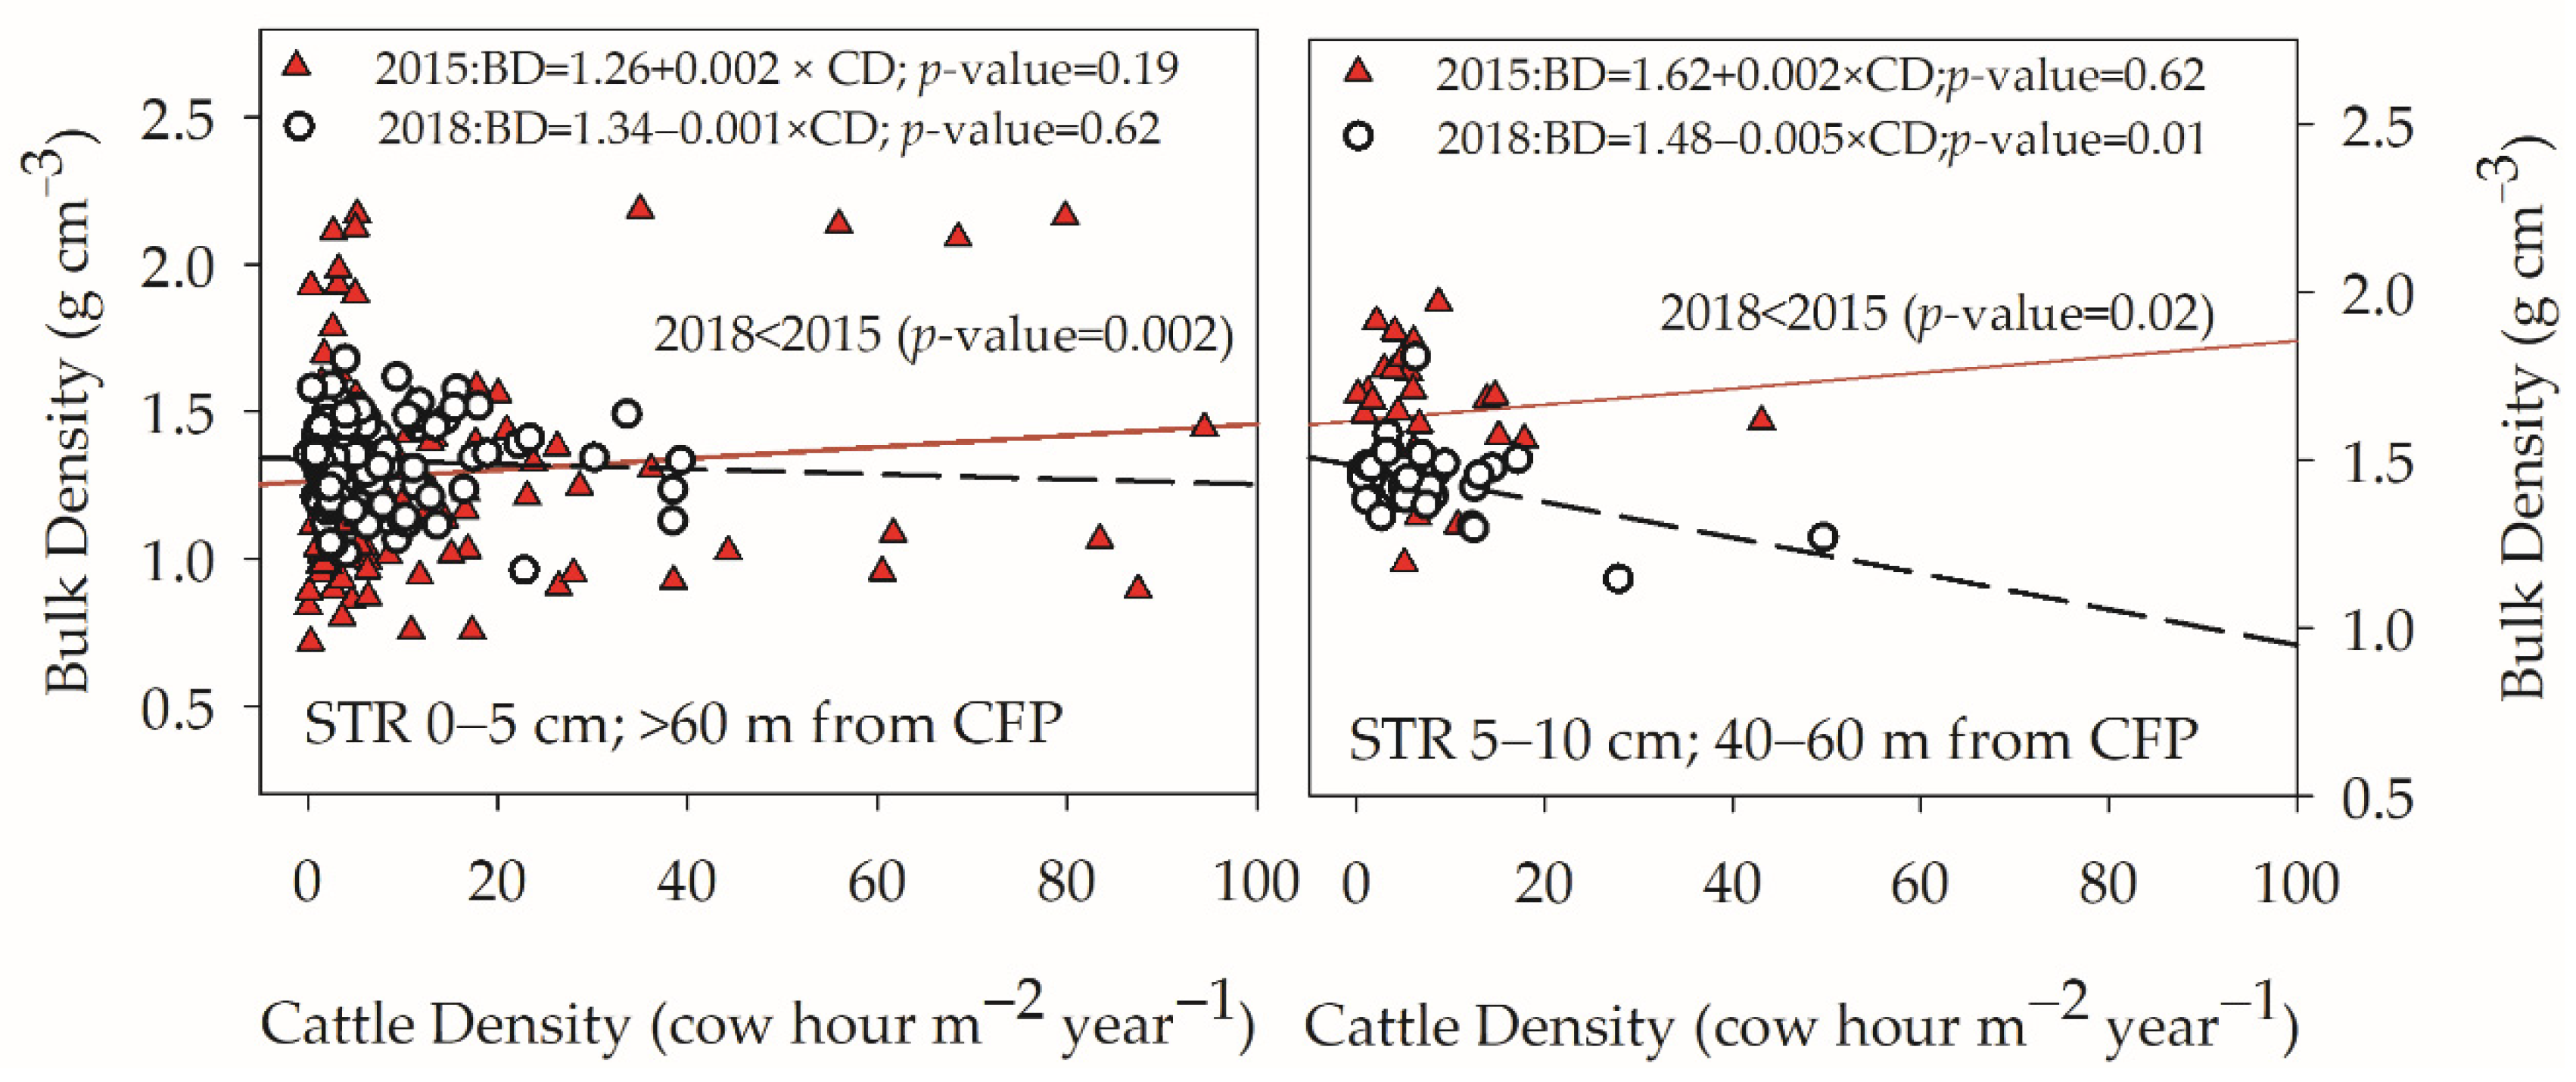
3.4. Influence of Cattle Density on BD

Overall, the CHD pastures had a decrease in BD in the 0–5 and 5–10 cm depths (Table 3). There was, however, one area of concern where cattle frequented (greater CD) which resulted in greater compaction. In the 10–20 cm soil depth within the 20–40 m CFP zone (Figure 7), the relationship between cattle density (CD) and BD in CHD pastures showed significant increase in the relationship between BD and CD in 2018 compared to 2015. In these same areas (CHD pastures, 20–40 m CFP zone) slopes were significantly steeper than in either the 0–20 m or the >60 m CFP zones. Hay rolling out without added equipment is often undertaken on the steeper slopes. This suggests that while hay feeding strategies can reduce BD, managers should be cognizant to distribute hay so as to distribute cattle throughout the whole pasture and on steeper slopes further from CFPs.
Similar comparisons of the relationship between CD and BD for STR pastures demonstrated the ability of the strategic grazing to improve BD within several CFP zones. We give two examples in Figure 8 for two soil depths, 0–5 and 5–10 cm. While there is no significant relationship of CD on BD at >60 CFPs in 2015 or 2018 nor in the 40–60 CFPs in 2015, in both cases there was a significant change in the relationships. In both cases, the slope of the regression changed from a positive relation (more CD more compaction) to a negative relationship (as CD increases BD decreases). This demonstrates that the distribution of cattle in the STR pastures through movable equipages (hay feeding rings, waterers, mineral-feeders) was effective in reducing the impact of cattle on BD and strongly suggests that cattle can improve the ability of soil to receive more rainfall, as compaction is decreased, infiltration of rainfall is more likely.

3.5. Exclusions’ Influences on LOI, BD, and CD

Significant reduction in LOI carbon after 2 years of CHD and STR grazing management within exclusions was observed (Table 5). When exclusions were compared with outside exclusions (grazed areas) at individual sampling years, LOI carbon was similar in 2015 in both CHD and STR grazing management (Table 5). In 2018, the potential exclusion areas in CHD (similar locations in CHD to locations in excluded in STR, referred here as CHD exclusions) had significantly lower LOI carbon compared to grazed areas but the exclusion in STR had comparable LOI carbon in exclusions and grazed areas (Table 5). This demonstrates the ability of exclusions to retain LOI carbon in soil. Although the exclusions in STR did not directly receive organic matter input from grazing animals in 2018 as in 2015, the lower BD and CD inside STR exclusions (Table 5) suggests better infiltration of rainfall and runoff. The reduced loss of LOI in the exclusions may be attributed to ground cover, thus, protecting carbon from runoff loss and lower grazing in those areas suggests greater litter inputs from the forage plants compared to grazed areas. A 13% improvement in BD after 2.5 years of grazing exclusion was reported along with improved unsaturated hydraulic conductivity in continuously grazed sheep pastures owing the change to biological activity, wetting and drying cycles, and absence of animal treading effect [31]. Natural recovery of soil physical and hydraulic properties of deteriorated pasture management systems to a depth of 10 cm when grazing animals are excluded from pastures [32]. Excluding wet soils is important [32] and thus improvement in BD in our pastures can be attributed to cattle exclusion of congregation zones in the wet areas as suggested by lower CD inside exclusions. A synthesis of 51 grassland sites in China suggested strong coupling of mean annual precipitation and rate of change of soil N with rate of change of soil C in grazing exclusions [33] supporting our discussions. It should also be noted that while cattle were excluded from these areas vulnerable to erosion, the areas were over-seeded and flash grazed thereby also increasing the overall availability of forage in these areas which in 2015 were denuded of vegetation by congregating cattle. This vegetative cover not only provides resistance to runoff waters and reduction in BD, it also provided additional forage for cattle to flash graze during drought and during the wetter times in 2017 and 2018.
Further evaluation of the difference in influence of CD on LOI due to overseeded and flashed grazed exclusions revealed greater increases in LOI for unit increase in CD in 2018 at all three depths, but such difference was not observed in the no-exclusions in both treatments.

4. Conclusions

Overall, there was a reduction in LOI carbon for both grazing systems after the grazing systems experienced an extreme drought event followed by several extreme rainfall events. Combining all depths, reductions in LOI were greater in CHD both outside of exclusions (5.9% LOI reduction) and inside of exclusions (16.2%) than were reductions in STR (5.0% outside exclusions and 14.5% inside exclusions). In the 0–5 cm soil layers, reductions in the more recalcitrant LOI carbon were accompanied by significantly greater N and P mineralization as described in earlier publications [19,30]. In all soil depths the more labile carbon, permanganate oxidizable carbon [19], increased but significantly more in STR pastures. From this, we may conclude that CHD and STR grazing systems can be considered regenerative management systems that can improve fertility of low input pasture soils through activation of soil biology. However, for this to be the case in the CHD pastures, farm managers should not distribute hay within 20 m of the CFPs so as to retain nutrients within the grazing system for forage production. In the STR pastures, managing cattle where they spend more time in areas less vulnerable to erosion (CFPs) helped dampen the loss of carbon to a greater extent and facilitated greater deposition of manure and associated nutrients in the upper landscape positions of each of the STR pastures. This paper showed that management practices such as excluding and over-seeding areas vulnerable to erosion can convert denuded areas to areas which can provide forage to cattle during drought while also reducing compaction. From 2015 to 2018, the STR grazing system was better able to reduce the impact of cattle on soil compaction in both the 0–5 and the 5–10 cm soil layers, while this was not the case for CHD pastures. This reduction in compaction was greatest in low lying areas at the edge-of-field that were excluded, over-seeded, and flash grazed. These findings indicate that the STR gazing system was more resilient in retaining carbon lost due to drought followed by extreme rainfall events.

Supplementary Materials

The following are available online at https://www.mdpi.com/article/10.3390/agronomy12092073/s1, Figure S1: Distribution of change in hot spots of loss-on-ignition (LOI) carbon distribution in Eatonton pastures, Figure S2: Distribution of change in hot spots of loss-on-ignition (LOI) carbon distribution in Watkinsville pastures, Figure S3: Distribution of change in hot spots of bulk density (BD) distribution in Eatonton pastures, and Figure S4: Distribution of change in hot spots of bulk density (BD) distribution in Watkinsville pastures.

Author Contributions

Conceptualization, A.S. and D.F.; methodology, A.S., D.F., D.H., L.S., S.D. and A.M.; formal analysis, A.S. and D.F.; investigation, A.S., D.F. and S.D.; writing—original draft preparation, A.S.; writing—review and editing, A.S., D.F., D.H., L.S. and M.C.; supervision, D.F. and M.C.; funding acquisition, D.F. All authors have read and agreed to the published version of the manuscript.

Funding

This research was funded by NRCS-USDA, Conservation Innovation Grant. Grant number 69-3A75-14-251.

Institutional Review Board Statement

Not applicable.

Informed Consent Statement

Not applicable.

Data Availability Statement

Please refer to suggested Data Availability Statements in section “MDPI Research Data Policies” at https://www.mdpi.com/ethics (accessed on 12 July 2022).

Acknowledgments

The authors are thankful to NRCS-USDA for their assistance with the first order soil survey, and to the Sustainable Agriculture Laboratory team, and Charles Trumbo at the University of Georgia for their support in lab and in field.

Conflicts of Interest

The authors declare no conflict of interest.

References

  1. Dahlin, A.S.; Emanuelsson, U.; McAdam, J.H. Nutrient management in low input grazing–based systems of meat production. Soil Use Manag. 2005, 21, 122–131. [Google Scholar] [CrossRef]
  2. Teague, W.R. Forages and pastures symposium: Cover crops in livestock production: Whole-system approach: Managing grazing to restore soil health and farm livelihoods. J. Anim. Sci. 2018, 96, 1519–1530. [Google Scholar] [CrossRef] [PubMed]
  3. Scott, J.M.; Hutchinson, K.J.; King, K.; Chen, W.; McLeod, M.; Blair, G.J.; White, A.; Wilkinson, D.; Lefroy, R.D.B.; Cresswell, H.; et al. Quantifying the sustainability of grazed pastures on the Northern Tablelands of New South Wales. Aust. J. Exp. Agric. 2000, 40, 257–265. [Google Scholar] [CrossRef]
  4. Teague, W.R.; Apfelbaum, S.; Lal, R.; Kreuter, U.P.; Rowntree, J.; Davies, C.A.; Conser, R.; Rasmussen, M.; Hatfield, J.; Wang, T.; et al. The role of ruminants in reducing agriculture’s carbon footprint in North America. J. Soil Water Conserv. 2016, 71, 156–164. [Google Scholar] [CrossRef]
  5. Harmel, R.D.; Smith, D.R.; Haney, R.L.; Angerer, J.; Haile, N.; Grote, L.; Grote, S.; Tiner, K.; Goodwin, J.; Teague, R.; et al. Transitioning from conventional continuous grazing to planned rest-rotation grazing: A beef cattle case study from central Texas. J. Soil Water Conserv. 2021, 76, 534–546. [Google Scholar] [CrossRef]
  6. Silveira, M.L.; Kohmann, M.M. Maintaining soil fertility and health for sustainable pastures. In Management Strategies for Sustainable Cattle Production in Southern Pastures; Academic Press: Cambridge, MA, USA, 2020; pp. 35–58. [Google Scholar]
  7. Sigua, G.C.; Coleman, S.W.; Albano, J.P. Quantifying soil organic carbon in forage-based cow–calf congregation-grazing zone interface. Nutr. Cycl. Agroecosyst. 2009, 85, 215–223. [Google Scholar] [CrossRef]
  8. Sigua, G.C.; Hubbard, R.K.; Coleman, S.W.; Williams, M. Nitrogen in soils, plants, surface water and shallow groundwater in a bahiagrass pasture of Southern Florida, USA. Nutr. Cycl. Agroecosyst. 2010, 86, 175–187. [Google Scholar] [CrossRef]
  9. Hendricks, T.; Franklin, D.; Dahal, S.; Hancock, D.; Stewart, L.; Cabrera, M.; Hawkins, G. Soil carbon and bulk density distribution within 10 Southern Piedmont grazing systems. J. Soil Water Conserv. 2019, 74, 323–333. [Google Scholar] [CrossRef]
  10. Amorim, H.C.; Ashworth, A.J.; Moore, P.A., Jr.; Wienhold, B.J.; Savin, M.C.; Owens, P.R.; Jagadamma, S.; Carvalho, T.S.; Xu, S. Soil quality indices following long-term conservation pasture management practices. Agric. Ecosyst. Environ. 2020, 301, 107060. [Google Scholar] [CrossRef]
  11. Unites States Department of Agriculture, NASS Southern Region. Georgia County Estimates, Cattle 2020. 2021. Available online: https://www.nass.usda.gov/Statistics_by_State/Georgia/Publications/County_Estimates/2021/GACattle2021.pdf (accessed on 9 November 2021).
  12. Zhou, S.; Zhang, Y.; Park Williams, A.; Gentine, P. Projected increases in intensity, frequency, and terrestrial carbon costs of compound drought and aridity events. Sci. Adv. 2019, 5, eaau5740. [Google Scholar] [CrossRef] [PubMed] [Green Version]
  13. Sarker, J.R.; Singh, B.P.; Dougherty, W.J.; Fang, Y.; Badgery, W.; Hoyle, F.C.; Dalal, R.C.; Cowie, A.L. Impact of agricultural management practices on the nutrient supply potential of soil organic matter under long-term farming systems. Soil Tillage Res. 2018, 175, 71–81. [Google Scholar] [CrossRef]
  14. Martınez, L.J.; Zinck, J.A. Temporal variation of soil compaction and deterioration of soil quality in pasture areas of Colombian Amazonia. Soil Tillage Res. 2004, 75, 3–18. [Google Scholar] [CrossRef]
  15. Hu, W.; Drewry, J.; Beare, M.; Eger, A.; Müller, K. Compaction induced soil structural degradation affects productivity and environmental outcomes: A review and New Zealand case study. Geoderma 2021, 395, 115035. [Google Scholar] [CrossRef]
  16. Causarano, H.J.; Franzluebbers, A.J.; Shaw, J.N.; Reeves, D.W.; Raper, R.L.; Wood, C.W. Soil organic carbon fractions and aggregation in the Southern Piedmont and Coastal Plain. Soil Sci. Soc. Am. J. 2008, 72, 221–230. [Google Scholar] [CrossRef]
  17. Kurz, I.; O’Reilly, C.D.; Tunney, H. Impact of cattle on soil physical properties and nutrient concentrations in overland flow from pasture in Ireland. Agric. Ecosyst. Environ. 2006, 113, 378–390. [Google Scholar] [CrossRef]
  18. Dahal, S.; Franklin, D.H.; Cabrera, M.L.; Hancock, D.W.; Stewart, L.; Ney, L.C.; Subedi, A.; Mahmud, K. Spatial distribution of inorganic nitrogen in pastures as affected by management, landscape, and cattle locus. J. Environ. Qual. 2018, 47, 1468–1477. [Google Scholar] [CrossRef]
  19. Dahal, S.; Franklin, D.; Subedi, A.; Cabrera, M.; Hancock, D.; Mahmud, K.; Ney, L.; Park, C.; Mishra, D. Strategic grazing in beef-pastures for improved soil health and reduced runoff-nitrate—A step towards sustainability. Sustainability 2020, 12, 558. [Google Scholar] [CrossRef]
  20. Conant, R.T.; Paustian, K. Potential soil carbon sequestration in overgrazed grassland ecosystems. Glob. Biogeochem. Cycles 2002, 16, 90–91. [Google Scholar] [CrossRef]
  21. Franzluebbers, A.J.; Stuedemann, J.A.; Schomberg, H.H. Spatial distribution of soil carbon and nitrogen pools under grazed tall fescue. Soil Sci. Soc. Am. J. 2020, 64, 635–639. [Google Scholar] [CrossRef]
  22. Kang, S.; Lin, H. General soil-landscape distribution patterns in buffer zones of different order streams. Geoderma 2009, 151, 233–240. [Google Scholar] [CrossRef]
  23. Kirkby, M. Modelling the interactions between soil surface properties and water erosion. Catena 2002, 46, 89–102. [Google Scholar] [CrossRef]
  24. Agouridis, C.T.; Workman, S.R.; Warner, R.C.; Jennings, G.D. Livestock grazing management impacts on stream water quality: A review . JAWRA J. Am. Water Resour. Assoc. 2005, 41, 591–606. [Google Scholar] [CrossRef]
  25. Seneviratne, S.; Nicholls, N.; Easterling, D.; Goodess, C.; Kanae, S.; Kossin, J.; Luo, Y.; Marengo, J.; McInnes, K.; Rahimi, M.; et al. Changes in climate extremes and their impacts on the natural physical environment. In Managing the Risks of Extreme Events and Disasters to Advance Climate Change Adaptation. A Special Report of Working Groups I and II of the Intergovernmental Panel on Climate Change (IPCC SREX Report); Cambridge University Press: Cambridge, UK, 2012; pp. 109–230. [Google Scholar]
  26. Knapp, A.K.; Beier, C.; Briske, D.D.; Classen, A.T.; Luo, Y.; Reichstein, M.; Smith, M.D.; Smith, S.D.; Bell, J.E.; Fay, P.A.; et al. Consequences of more extreme precipitation regimes for terrestrial ecosystems. Bioscience 2008, 58, 811–821. [Google Scholar] [CrossRef]
  27. Frank, D.; Reichstein, M.; Bahn, M.; Thonicke, K.; Frank, D.; Mahecha, M.D.; Smith, P.; Van der Velde, M.; Vicca, S.; Babst, F.; et al. Effects of climate extremes on the terrestrial carbon cycle: Concepts, processes and potential future impacts. Glob. Chang. Biol. 2015, 21, 2861–2880. [Google Scholar] [CrossRef] [PubMed]
  28. Khan, N.; Jhariya, M.K.; Raj, A.; Banerjee, A.; Meena, R.S. Soil carbon stock and sequestration: Implications for climate change adaptation and mitigation. In Ecological Intensification of Natural Resources for Sustainable Agriculture; Springer: Berlin/Heidelberg, Germany, 2021; pp. 461–489. [Google Scholar]
  29. Burt, R. Soil Survey Laboratory Methods Manual. Soil Survey Investigations Report 42, Version 4; United States Department of Agriculture, Natural Resources Conservation Service: Washington, DC, USA; National Soil Survey Center: Linkoln, NE, USA, 2004.
  30. Subedi, A.; Franklin, D.; Cabrera, M.; McPherson, A.; Dahal, S. Grazing Systems to Retain and Redistribute Soil Phosphorus and to Reduce Phosphorus Losses in Runoff. Soil Syst. 2020, 4, 66. [Google Scholar] [CrossRef]
  31. Greenwood, K.L.; MacLeod, D.A.; Scott, J.M.; Hutchinson, K.J. Changes to soil physical properties after grazing exclusion. Soil Use Manag. 1998, 14, 19–24. [Google Scholar] [CrossRef]
  32. Drewry, J.J. Natural recovery of soil physical properties from treading damage of pastoral soils in New Zealand and Australia: A review. Agric. Ecosyst. Environ. 2006, 114, 159–169. [Google Scholar] [CrossRef]
  33. Hu, Z.; Li, S.; Guo, Q.; Niu, S.; He, N.; Li, L.; Yu, G. A synthesis of the effect of grazing exclusion on carbon dynamics in grasslands in China. Glob. Chang. Biol. 2016, 22, 1385–1393. [Google Scholar] [CrossRef]
Figure 1. Monthly precipitation (primary axis) and average monthly temperature (secondary axis) for the study years 2015, 2016, 2017, 2018, and 1991–2020 (30-year normal) for (A) Eatonton and (B) Watkinsville.
Agronomy 12 02073 g001
Figure 2. Study pastures at (a) Eatonton, GA, and (b) Watkinsville, GA, showing pasture boundaries, sampling points, runoff collectors, exclusions, and concentrated flow paths with only the 20 m buffers.
Agronomy 12 02073 g002
Figure 3. Change in loss-on-ignition (LOI) carbon compared across different concentrated-flow-path (CFP) zones at (A) 5–10 cm depth and (C) 0–20 cm depth in continuous grazing with hay distribution (CHD) and at (B) 5–10 cm depth and (D) 0–20 cm depth in strategic grazing (STR) pastures. The solid and dashed lines inside the boxplots represent median and mean, respectively. Different upper-case letters denote significant differences between different CFP zones. Different lower-case letters denote significant differences between CHD and STR treatments for individual CFP zones at specified soil-depths.
Agronomy 12 02073 g003
Figure 4. Depth wise regression of LOI carbon at 5–10 and 10–20 cm in 2015 and 2018 for STR pastures. Individual regressions were significant at p-value <0.0001.
Agronomy 12 02073 g004
Figure 5. Cattle density (CD) influence on loss-on-ignition carbon (LOI) in continuous grazing with hay distribution (CHD) pastures for the 0-5 cm soil layer; left: 0–20 m from CFP and right: 40–60 m from CFP (CFP = concentrated flow path). The red solid line represents the regression line for 2015 and the black dashed line represents year 2018.
Agronomy 12 02073 g005
Figure 6. Cattle density (CD) influence on loss-on-ignition carbon (LOI) in strategic grazing (STR) pastures; left: 0–5 cm depth in 0–20 m from CFP, and right: 0–5 cm depth in 40–60 m from CFP (CFP = concentrated flow path). The red solid line represents the regression line for 2015 and the black dashed line represents year 2018.
Agronomy 12 02073 g006
Figure 7. Cattle density (CD) influence on bulk density (BD) in continuous grazing with hay distribution (CHD) pastures at 10–20 cm depth in 20–40 m from CFP (CFP = concentrated flow path). The red solid line represents the regression line for 2015 and the black dashed line represents year 2018.
Agronomy 12 02073 g007
Figure 8. Cattle density (CD) influence on bulk density (BD) in strategic grazing (STR) pastures at left: 0–5 cm depth in >60 m CFP zone and right: 5–10 cm depth in 40–60 m from CFP (CFP = concentrated flow path). The red solid line represents the regression line for 2015 and the black dashed line represents year 2018.
Agronomy 12 02073 g008
Table 1. Study pastures with their respective area (ha), grazing treatment, number of sampling points in 2015 and 2018, area under exclusion and exclusion cattle density in 2015 and 2018.
PasturesArea (ha)Grazing TreatmentSampling Points (N) (2015/2018)Exclusion Area (ha)Exclusion Cattle Density (2015/2018)
Eatonton Beef Research Unit, Eatonton, Putnam County
ENE22STR84/822.720.7/10.5
ENW18CHD77/73--
ESE18CHD75/75--
ESW18STR72/684.143.4/3.7
JPC, Watkinsville, Oconee County
WNE15STR81/742.03.7/0.6
WNW17CHD90/70-
WSE18CHD72/60-
WSW11STR79/183.054.5/0.6
Table 2. Change in loss-on-ignition carbon (LOI) from continuous grazing (CG) to either continuous grazing with hay distribution (CHD) or strategic rotational grazing (STR) treatments in 2018 for soil depths 0–5, 5–10, and 10–20 cm. Upper case letters indicate a change in population medians. Difference (2018–2015) indicates if change was significantly different than zero.
Grazing ManagementYearLOI at 0–5 cmDifference (2018–2015)LOI at 5–10 cmDifference (2018–2015)LOI at 10–20 cmDifference (2018–2015)
g kg−1
CG201582.8 A −10.7 ***45.9 A−3.4 ***43.6 A−3.9 ***
CHD201872.2 B42.6 B39.7 B
CG201591.3 A−7.2 ***58.9 A−4.2 ***58.5 A−4.7 ***
STR201884.2 B54.8 B53.8 B
Medians separated by different letters denote a significant difference between the sampling dates for each treatment at the 0.1 level of significance. ≤0.05, ≤0.01, ≤0.001 p-values for the Wilcoxon Signed Rank test on the differences are denoted by *, **, and ***, respectively.
Table 3. Change in bulk density (BD) from continuous grazing (CG) in 2015 after two years of either continuous grazing with hay distribution (CHD) or strategic rotational grazing (STR) treatments in 2018 for soil depths 0–5, 5–10, and 10–20 cm. Upper case letter indicates a change in population medians. Difference (2018–2015) indicates if change was significantly different than zero.
Grazing ManagementYearBD at 0–5 cmDifference (2018–2015)BD at 5–10 cmDifference (2018–2015)BD at 10–20 cmDifference (2018–2015)
g cm−3
CG20151.25 B 0.04 *1.62 A−0.15 ***1.45 B0.01
CHD20181.31 A1.48 B1.47 A
CG20151.23 B0.031.63 A−0.17 ***1.39 B0.03 *
STR20181.27 A1.45 B1.42 A
Medians separated by different letters denote a significant difference between the sampling dates for each treatment at the 0.1 level of significance. ≤0.05, ≤0.01, ≤0.001 p-values for the Wilcoxon Signed Rank test on the differences are denoted by *, **, and ***, respectively.
Table 4. Change in bulk density calculated as 2018-2015 in continuous grazing with hay distribution (CHD) and strategic grazing (STR) pastures at different distances from concentrated flow paths (CFPs).
Distance from CFPBD Change in CHD (2018-2015)BD Change in STR (2018-2015)
0–5 cm5–10 cm10–20 cm0–5 cm5–10 cm10–20 cm
g cm−3g cm−3
0–20 m−0.04 −0.13 ***0.03−0.01 −0.14 ***0.01
20–40 m0.08 *−0.17 ***0.02−0.001−0.18 ***0.001
40–60 m0.05 −0.1 ***−0.010.07 −0.21 ***0.04 **
>60 m0.05 *−0.16 ***0.010.06 *−0.18 ***0.03
Wilcoxon’s Signed Rank Test showing significant differences from 2015 to 2018 at ≤0.1, ≤0.05, ≤0.01, and ≤0.001 level of significance denoted by , *, **, and ***, respectively.
Table 5. Loss-on-ignition (LOI), bulk density (BD), and cattle density (CD) values inside and outside of exclusions in continuous grazing with hay distribution (CHD) and strategic grazing (STR) in 2015 (continuous grazing; CG) and 2018.
TreatmentYearLOI g kg−1 Outside ExclusionsLOI g kg−1 Inside ExclusionsBD g cm−3 Outside ExclusionsBD g cm−3 Inside ExclusionsCD (Hour m−2 year−1) Outside ExclusionsCD (Hour m−2 year−1) Inside Exclusions
CHD201553.5 Aa55.1 Aa1.43 Ab1.50 Aa4.27 Aa4.11 Aa
CHD201850.4 Ba46.2 Bb1.44 Aa1.45 Ba4.34 Aa3.81 Aa
STR201569.7 Aa72.1 Aa1.41 Ab1.45 Aa4.81 Aa4.34 Aa
STR201866.2 Ba61.7 Ba1.4 Ba1.38 Ba3.87 Ba1.16 Bb
Different upper-case letters denote significant difference between years (2015 vs. 2018), and different lower-case letters denote significant difference between outside and inside exclusions.
Publisher’s Note: MDPI stays neutral with regard to jurisdictional claims in published maps and institutional affiliations.

