Article

Use of Wild Relatives in Durum Wheat (Triticum turgidum L. var. durum Desf.) Breeding Program: Adaptation and Stability in Context of Contrasting Environments in Tunisia

1
Field Crops Laboratory, LR20–INRAT–02, National Agricultural Research Institute of Tunisia, University of Carthage, Ariana 2049, Tunisia
2
Genetics and Cereal Breeding Laboratory, LR14AGR01, National Agronomic Institute of Tunisia, University of Carthage, Tunis 1082, Tunisia
3
International Center for the Agricultural Research (ICARDA), Rabat 10000, Morocco
*
Author to whom correspondence should be addressed.
These authors equally contributed joint first authors.
Agronomy 2021, 11(9), 1782; https://doi.org/10.3390/agronomy11091782
Submission received: 17 July 2021 / Revised: 16 August 2021 / Accepted: 20 August 2021 / Published: 6 September 2021
(This article belongs to the Special Issue Utilizing Genetic Resources for Agronomic Traits Improvement)

Abstract

:
In Mediterranean regions, the performance of durum wheat (Triticum turgidum L. var. durum Desf.) yield often varies due to significant genotype × environment interaction (GEI); therefore, yield stability is an important consideration in breeding programs. The aim of this research was to explore the GEI pattern and yield stability of 24 promising durum wheat lines, selected by ICARDA in several African countries (seven elites, four commercial varieties, and 13 durum wheat wide crosses, generated by hybridization of elites and Triticum dicoccoides Koern. ex Schweinf., Triticum araraticum Jakubz, and Aegilops speltoides Tausch) against a Tunisian local check variety ‘Salim’. Yield assessment was conducted across six environments under rainfed conditions, at the field station of Kef in a semi-arid region during four cropping seasons (2014–2015, 2015–2016, 2016–2017, and 2017–2018) and in a sub-humid region at the station of Beja during two cropping seasons (2015–2016 and 2018–2019). The analysis of variance showed that the environment is the main source of variation of grain yield (72.05%), followed by the interaction environments × genotypes (25.33%) and genotypes (2.62%). The genotype × genotype by environment model (PC) based on grain yield identified a mega-environment including Kef (2016–2017 and 2017–2018) and Beja (2015–2016 and 2018–2019) and elite line 22 as a widely adapted genotype. Combined analysis, computed using the average grain yield of lines and the yield stability wide adaptation index (AWAI), showed that elite lines 9 and 23 (2.41 and 2.34 t·ha−1, respectively), and wild relative-derived lines, 5, 1, and 10 (2.37, 2.31, and 2.28 t·ha−1, respectively) were more stable and better yielding than the national reference (2.21 t·ha−1). This finding supports the good yield potential of wild relative-derived lines. The five selections are recommended to be developed in multi-environments in several regions of Tunisia, especially in semi-arid area.

1. Introduction

Durum wheat (Triticum turgidum L. var. durum Desf.) represents an important global crop, having an annually cultivated area of approximately 16.1 million ha and production of 38.1 million tons in 2019 [1,2]. The Mediterranean countries account for the largest production area of durum wheat, and North Africa represents the largest import market [3]. In these regions, the appreciation for durum wheat has a long history and is associated with many traditional foods [4], such as pasta and couscous, in addition to a number of other semolina products, such as frike, bourghul, and unleavened breads. Durum wheat is commonly grown in diverse agro-ecological conditions, mainly in arid and semi-arid regions under rainfed conditions, where the precipitation is irregular across years and locations, and farmers use limited inputs [5,6]. In Tunisia, durum wheat is the most widely grown cereal crop, but its yield remains weak compared to the potential estimated by research institutions. The production of durum wheat is highly limited by abiotic stress (drought, salinity, and cold) in semi-arid regions and biotic stress (diseases and pests) in sub-humid areas [7]. New varieties are regularly registered in the national catalogue by public and private enterprises to boost the productivity of Tunisian farmers. However, the great selection pressure imposed on breeding programs has induced a genetic base narrowing of the wheat germplasm [8]. This loss of diversity has caused a reduction in allelic plasticity, hence leading to a germplasm that is less adapted to climate change [9]. Compared to their domesticated descendants, wild relative Poaceae species maintain a much higher level of diversity and have survived various challenges in their natural habitats [10,11]. Therefore, interspecific hybridization between durum elite lines and wild emmer is a promising method to restore the variability of the modern breeding germplasm and to derive superior cultivars [12]. In addition, it has been found that some species, including Aegilops tauschii Coss., Ae. umbellulata Zhuk., Ae. speltoides Tausch, Triticum dicoccum Schrank ex Schübl, T. dicoccoides Koern. ex Schweinf., and Haynaldia have beneficial alleles to improve disease resistance [13], nutritional quality [14], and drought and salinity tolerance [15,16].
The phenotypic expression is the joint outcome of genotype (G) potential, environment (E) conductivity, and the genotype × environment interaction (GEI). Environmental factors, such as growing season, type of soil, planting pattern, and different altitudes, strongly affect crop growth and the final grain yield, leading to considerable variations in the adaptation of durum wheat varieties [17,18]. This situation will be worsened by the effect of climate change due to the decrease in the amount of precipitation and the increase in temperature [19,20].
Economically, grain yield (GY) is the most important trait in durum wheat. This is a quantitative trait controlled by many genes, each having small effects and interactions with the environment. Several studies have described the GEI using multi-environment yield trials (MET) as a method to assess the stability of genotypes, in addition to their yield potential [21,22]. Due to the occurrence of strong GEI, durum wheat breeders tend to identify high yielding and stable genotypes that show a small interaction with the environment or genotypes specifically adapted to specific environments. The presence of this interaction may reduce the correlation between phenotype and genotype, and makes the selection of lines in breeding program more complex. However, evaluation of genotypes across different environments and over several seasons is required to identify stable genotypes that could be recommended for release as a new variety adapted to the environmental changes [23]. Several statistical methods, including regression, principal component analysis (PCA), genotype × genotype by environment (GGE) analysis, and additive main effects and multiplicative interaction (AMMI), have been developed to assess the stability of a set of genotypes and patterns of GEI [21]. These approaches are useful for identification of mega-environments, specific and wide genotype adaptations, high yielding and stable genotypes, and interrelationships among environments [24,25,26,27]. The G×E analysis allows characterizing the genotypes as “widely adapted” or as “specifically adapted” to one environment or group of environments. Among these methods, the AMMI model performs significantly better than linear regression models and other multivariate procedures, such as the GGE biplot, in deciphering GEI [28]. In addition, this method permits characterization of the environment according to several variables, such as climatic or pedological data, explaining, therefore, a larger portion of the GEI [29,30].
In this study, an approach based on the AMMI model was proposed to present GEI from 24 promising lines of durum wheat comprising 13 top-crosses between wild relatives of durum wheat and elite lines of the ICARDA breeding programs, seven ICARDA elites, and four commercial varieties, in six environments, to assess their adaptability response and the possible yield gain using wide-cross lines.

2. Materials and Methods

2.1. Genetic Material and Site Description

Twenty-four (24) promising genetically diverse durum wheat lines sourced from ICARDA’s nurseries, selected across several African countries, and a Tunisian local reference variety (Salim), released in 2009, were used in this study. The promising set included 13 wild relative-derived lines obtained by top-crossing with Triticum dicoccoides Koern. ex Schweinf., Triticum araraticum Jakubz, and Aegilops speltoides Tausch; seven elite lines identified for tolerance to North African stresses; and four references representing commercial varieties previously released in North Africa (Table 1). The selected lines were screened for GY potential to identify promising lines for breeding programs and evaluated across 6 environments (combination of cropping season and location) in a field experiment under rainfed conditions (Table 2). The experimental sites were located in two different climate locations representative of major rainfed cultivated durum wheat growing areas in Tunisia, namely Kef-Boulifa (semi-arid region) and Beja (sub-humid region) (Table 3). The assays were performed during four cropping seasons (2014–2015, 2015–2016, and 2017–2018) in Kef, and during 2015–2016 and 2018–2019 cropping seasons in Beja.

2.2. Trial Management

The experimental design was arranged in an alfa lattice with two replications (n = 2) at a seeding rate of 300 seeds m−2. Two blocs were subdivided each into 25 plots of 7.2 m2 (in total 50) containing six rows of 6 m length, with 0.2 m inter-row spacing and 0.5 m inter-plot spacing. Basal fertilization of 100 kg ha−1 of Di-Ammonium Phosphate was provided at sowing, followed by three split applications of ammonium nitrate (33.5% N) of 100 kg ha−1 each at early tillering (growth stage, Z13), at stem elongation (Z16), and at 2nd node visible (Z32) [31]. Weeds were controlled by a mix of chemical control using Puma® evolution (fenoxaprop-p-ethyl + iodosulfuron-methyl sodium + mefenpyr-diethyl) (Bayer CropScience, Beja, Tunisia) at a rate of 1 l ha−1 at the 2–3 leaf stage, and mechanical interventions.

2.3. Data Collection and Statistical Analysis

GY was recorded for each plot by threshing the central four rows of the plot for a total harvested surface of 4 m2. The grains were then weighed and the final values were expressed as tons per hectare. Genstat [32] was used to conduct the analysis of variance (ANOVA) across environments for a lattice design, with genotypes (G) and environments (E) as fixed factors. The ANOVA analysis was also performed to quantify the contribution of G, E, and G×E effects to the total variation (G + E + G × E sum of squares (SS)) of GY. Best linear unbiased estimates (BLUEs) were derived and the standard error of the differences of the means was used to determine significant differences. The heritability was calculated as follows:
H² = δG/(δG + δG×E/nE + δe/nE × nr)
where δG is obtained as the SS value for genotype, δG×E is the SS of the G×E interaction, nE is the number of environments, δe is the SS of the error, and nr is the number of replicates.
The java script Genotype × Environment Analysis with R (GEA–R) version 3.3.0 [33] was used to conduct the AMMI model [34] and the principal component analysis (PCA). For grain yield, genotype main effects (G) and G × E model or genotype + genotype × environment (G + G × E) were based on two principal components (PC1 and PC2). The yield stability value was derived from the AMMI model as suggested by Sneller et al. [35] following the method described by Sabaghnia et al. [36]. This was named the AMMI wide adaptation index (AWAI), and calculated using the following formula:
AWAI = Σisi·|PCi|
where i is the number of significant IPCs determined by the classical Gollob F-test in R Studio corresponding to 4 IPC in this specific case, si is the percentage of total G × E variance explained by each IPC, and PC is the actual IPC value. AWAI values close to zero (0) are obtained for the most widely adapted and stable germplasm [37]. To characterize the testing sites in terms of environmental factors that would possibly support the AMMI analysis results, a Non-Metric Multidimensional Scaling (NMDS) ordination was performed using climatic data (average temperature and rainfall) for each location.

3. Results and Discussion

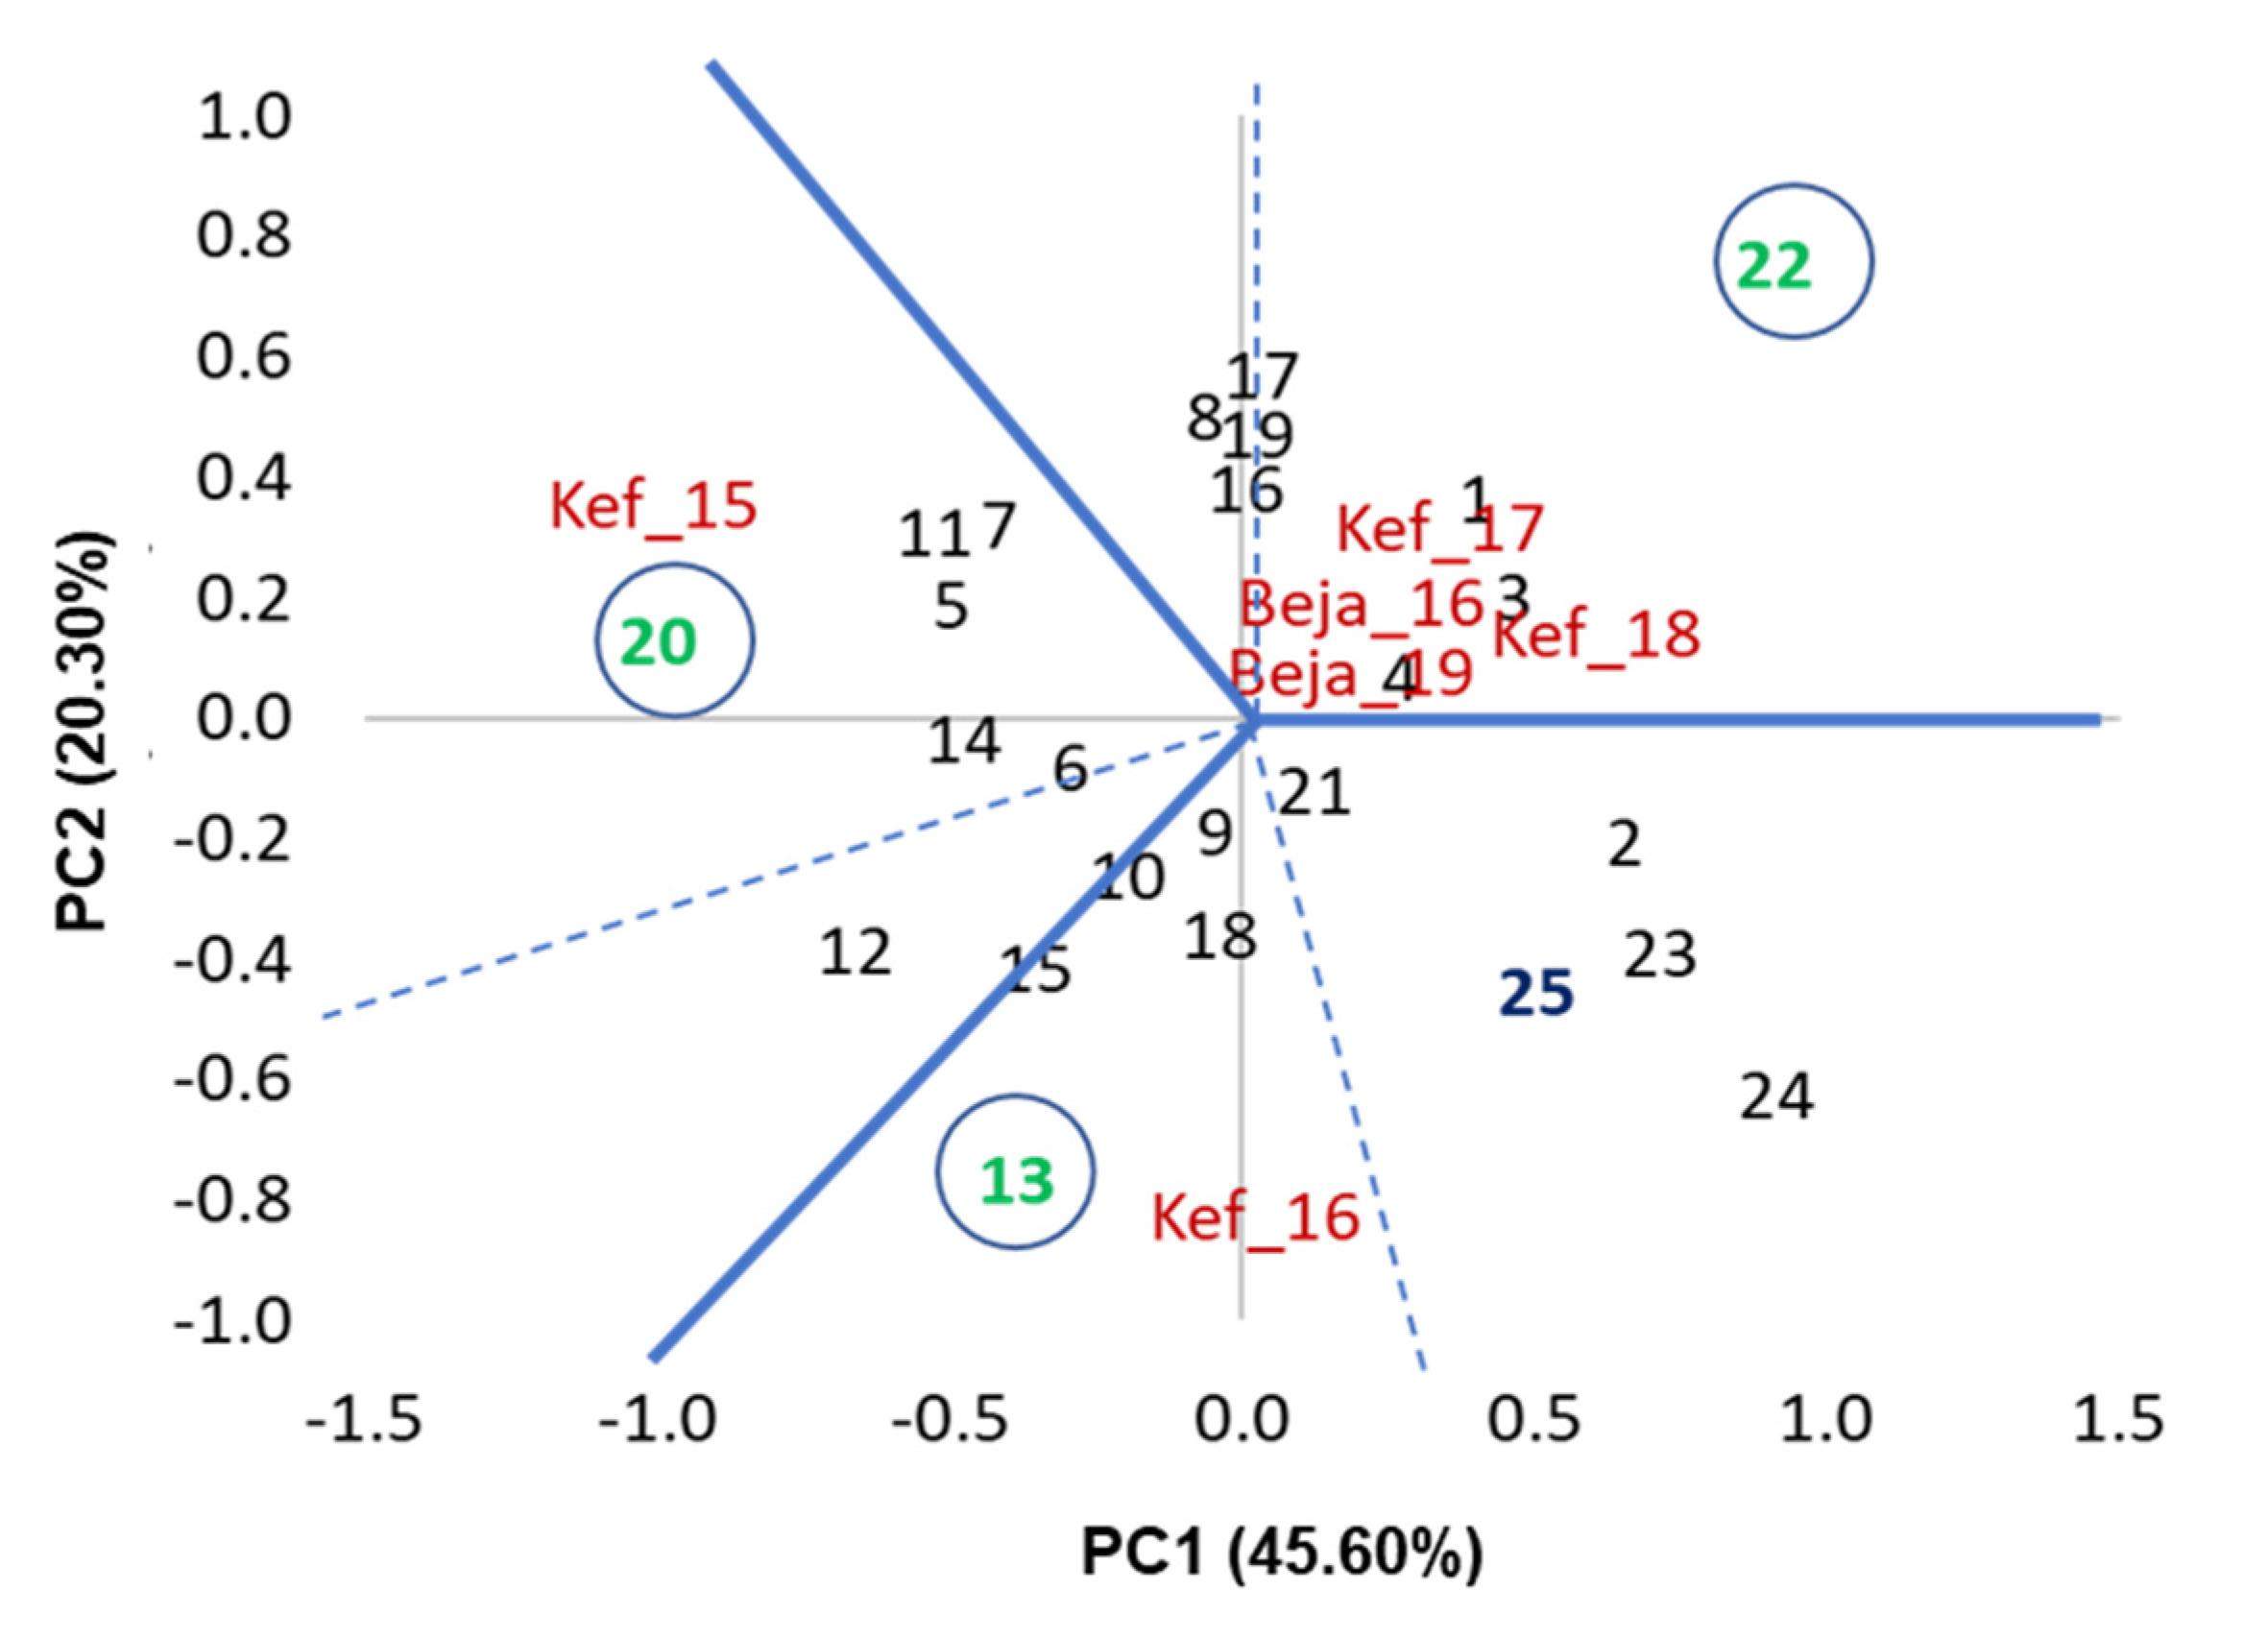
3.1. Variance and AMMI Analysis

The analysis of variance (ANOVA) for GY of the 25 genotypes tested over six environments (combination of cropping season and location) revealed that the effect of environments (E), genotypes (G), and genotype × environment interactions (GEI) were significant (p < 0.01) for this attribute (Table 4). The environment (72.05%) and GEI (25.33%) were the most important source of variation for GY and showed a larger contribution to the total variability (G + E + G × E) compared to the genotype (2.62%) effect. Furthermore, a high heritability for GY was found over all environments with values ranging from 0.68 (Beja_19) to 0.98 (Kef_17) (Table S1). The results indicate that these genotypes responded differently to the environments, thereby confirming the phenotypic diversity among the assessed genotypes. This also suggests the possible existence of different mega-environments with differently performing genotypes.
Environment and GEI are important components for the evaluation of genotype adaptation and in controlling the expression of GY for wheat [23,38,39,40,41]. Therefore, the selection should be carried out in several environments, and it is essential to select different genotypes for a specific environment to spatially and temporally identify stable genotypes that can be recommended for farmers.
In this study, the large variation due to the environment and the GEI for GY justifies the selection of G + G × E model (PC) and the need of further analysis of genotype stability. The G + G × E model (PC) was based on GY data of 25 genotypes across the six environments. The first two principal components (PC1 and PC2) explained 65.90% of the total variability (Figure 1). This model identified three useful environments. Interestingly, Kef_17, 18, and Beja_16 and 19 constituted the only mega-environments and should then be kept in high consideration. Beja_16 and 19 belong to the same location (i.e., same bioclimatic zone and soil characteristics) and were approximatively similar in terms of the amount of precipitation during the durum wheat growing season from November to June (424.8 and 555.4 mm, respectively) (Table 3). However, Beja_16 stood out due to a cold winter (5.1 and 6.4 mm in December and January, respectively) and a cold spring (6.5 and 6.2 mm in February and March, respectively), which were expected to increase the length of the season; however, cold damage may have occurred. By comparison, Kef_17 and 18 were both located in a semi-arid region, and low precipitation was recorded (231.0 and 313.1 mm, respectively) during the two cropping seasons of 2016–2017 and 2017–2018; however, the precipitation occurred throughout the cycle, with the exception of the quantity recorded after maturity in March (2.00 mm) at Kef_17. These results are in agreement with the NMDS analysis (Figure S1) and the cluster analysis based on GY (Figure S2).
Kef_15 constituted an isolated environment and the elite line 20 was the best performing genotype (Figure 1). Kef_15 experienced terminal drought (from flowering), and warm temperatures and low rainfall were particularly recorded in April and June, of 0.00 and 2.00 mm, respectively (Table 3). Kef_16 also constituted an isolated environment and line 13, derived from crosses with Ae. speltoides, was the best yielder (Figure 1). Kef_16 was warm with an initial drought recorded in December (4.00 mm) and a low rainfall quantity in June (5.00 mm) (Table 3).
Overall, rainfall and temperature during the experiment appear to be the major factors explaining the variation in genotype responses, contrary to Ndiaye et al. [42], who stated that soil fertility, rainfall, and sowing date were the discriminant factors of sorghum genotypes. Line 22 appears to be adapted to a wide range of environments (more than environment alone) with different pedoclimatic characteristics (Table 2 and Table 3); this line has a favorable GY performance in semi-arid and sub-humid regions. According to Mohammadi et al. [43], genotypes having a superior performance in a mega-environment should exhibit the same performance in other environments of that mega-environment. However, lines 13 and 20 showed a specific adaptation to semi-arid regions, and may be tolerant to drought of the initial or final development cycle. Based on this study, our results revealed that wide crosses did not exhibit higher specific adaptation compared to elites and commercial varieties. However, it is worth noting that Ae. speltoides may be a good source of tolerance to drought, as reported by Waines [44] and Aberkane et al. [45].

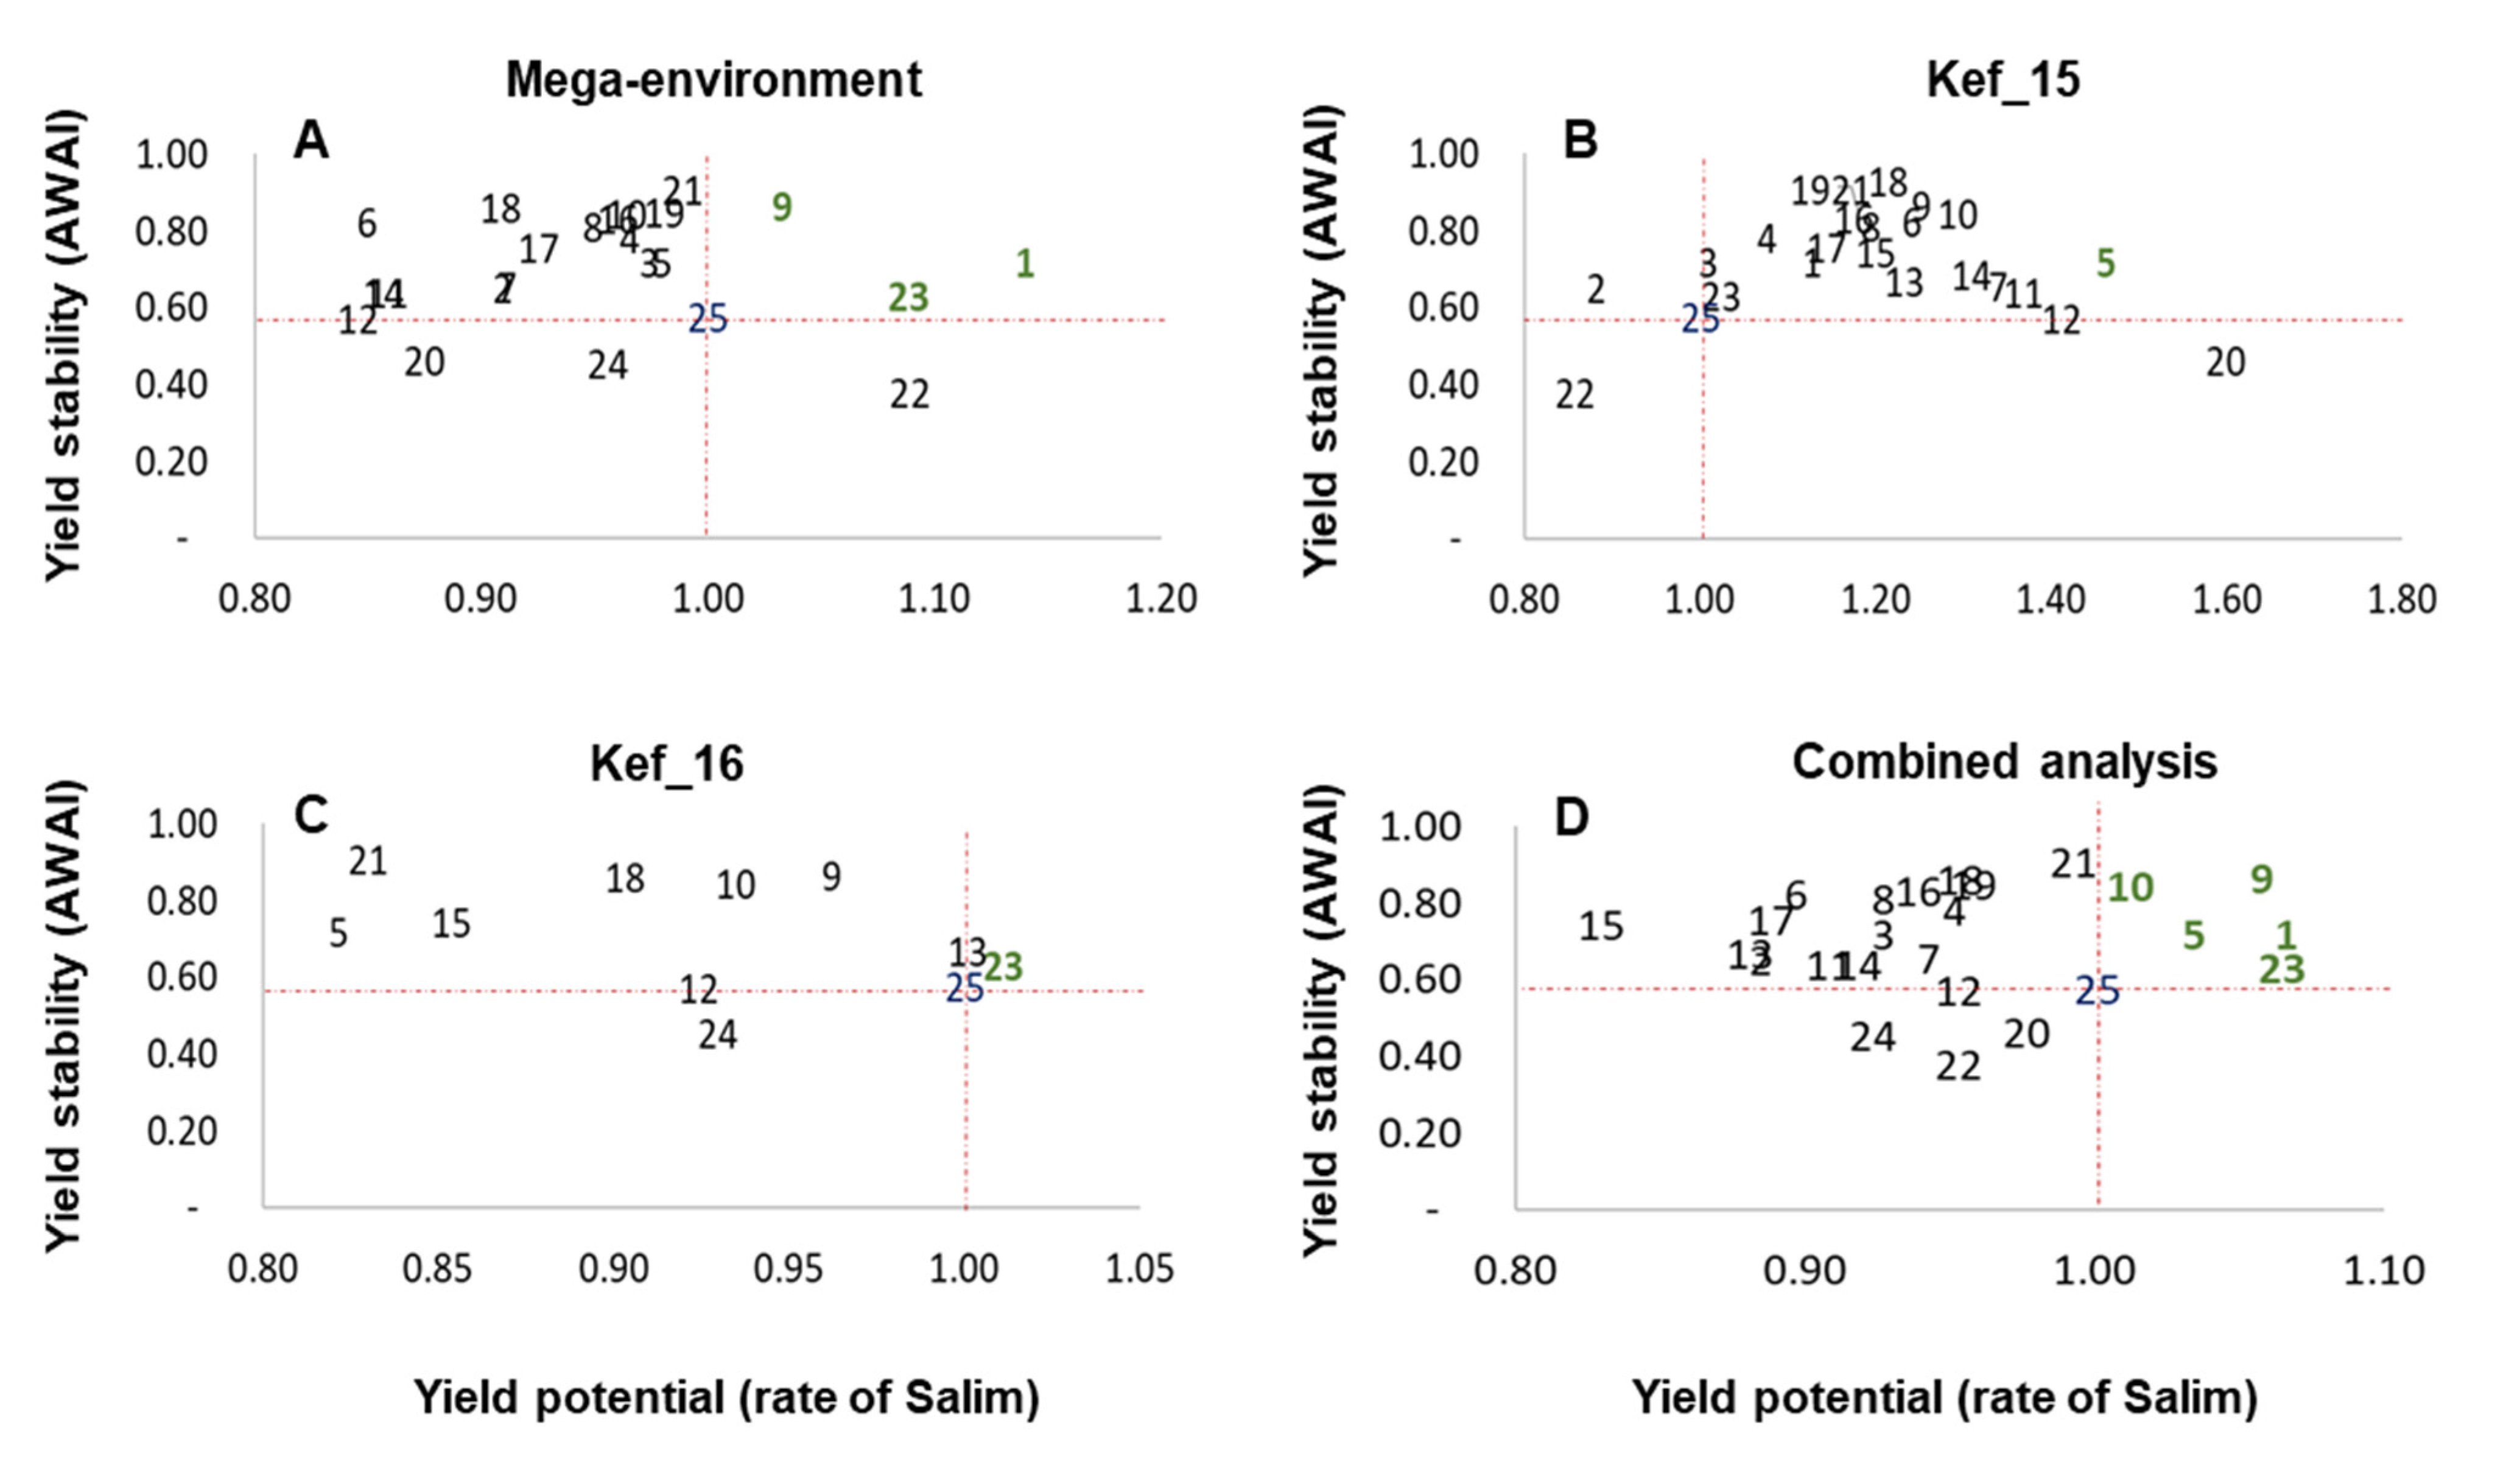
3.2. Performance of Grain Yield and Stability of Genotypes

GY response among the studied durum wheat lines compared to the national reference across six environments was studied (Table 5and Table S1). Overall, the average GY was 2.14 t·ha−1 for all environments (Table S1). The highest GY was observed in the environment Kef_15 with 3.33 t·ha−1, whereas Kef_17 displayed the lowest GY with 1.09 t·ha−1 (Table S1).
Considering the three germplasm types (elites, varieties, and wild relative derived) and all tested environments, elites (2.24 t·ha−1) outyielded commercial varieties and wild relative-derived lines (2.10 t·ha−1) that showed similar GY performance (Table S1). Unexpectedly, wild relative-derived entries outperformed in the sub-humid region (Beja, 2.40 t·ha−1) compared to the semi-arid region (Kef, 1.96 t·ha−1).
Compared to the national reference (2.21 t·ha−1), lines 9, 5, 23, 1, and 10 recorded, respectively, the highest GY of 2.41, 2.37, 2.34, 2.31, and 2.28 t·ha−1; whereas lines 15, 2, and 17 recorded the lowest GY of 1.95, 1.97, and 2.00 t·ha−1 (Table 5 and Table S1). As reported by Zaïm et al. [30], elite line 9 (Icakassem1) was the top yielding genotype in North Africa among elites, varieties, and wide crosses. Regarding the wide crosses, line 10 maintained a good yield performance, as previously noted in Morocco, Algeria, and Lebanon [30]. In these agro-climatic environments, line 14 was one of the best performers, but in our study this genotype showed a lower GY compared to Salim. The same trend was also obtained for line 4.
Stability analysis was undertaken using the AMMI wide adaptation index (AWAI) [24], using the first three PCs, which accounted for 81% of the total G×E effect. Low values of AWAI are indicative of genotypes that are close to the AMMI graph axis and are therefore widely adapted. The results revealed that the elite lines 22 (AWAI = 0.38) and 20 (AWAI = 0.46), and the wild relative-derived line 24 (AWAI = 0.46), appear to be more stable than the national reference (AWAI = 0.57) (Table 5). Interestingly, line 22 is adapted to a wide range of environments (Figure 1) and may allow the expansion of the areas grown to durum wheat in Tunisia. However, the GY performance of this line was lower than that of Salim (Table 5). The stability of yields appears to be independent of their values, and some high-yielding genotypes (e.g., lines 9, 5, 23, and 1) may be relatively unstable (Table 5and Table S1), and vice versa.
In this study, the G + G×E analysis and yield stability (AWAI) compared to the yield ratio of Salim was performed for the three identified environments (i.e., mega-environment, Kef_15, and Kef_16) (Figure 2). For the mega-environment, three lines (1, 9, and 23) were found to be more stable and better yielding compared to Salim. Regarding Kef_15 environment, 21 lines performed better than the national reference. However, the G + G × E analysis of Kef_16 environment revealed that one line (23) appears to be the best performing genotype. The combined analysis, computed using yield stability (AWAI) and compared to the yield ratio of Salim for all six environments, showed that five entries, 9, 5, 23, 1, and 10, were found more stable and better yielding than Salim. Similar results were found by Mehari et al. [46], Bassi and Sanchez–Garcia [37], and Hossain et al. [18] in their studies regarding the grain yield stability in wheat across diverse environments. In a previous report, all ICARDA wide crosses were the top yielding and stable genotypes compared to elites and commercial varieties [30]. Moreover, El Haddad et al. [47] showed that the crop wild relative-derived lines showed larger grain size (i.e., thousand kernel weight) under drought stress and outyielded under low nitrogen input conditions. This supports the idea that these genotypes might be cultivated in marginal environments. In our study, two kinds of wild relative-derived lines—lines 1, 5, and 10—performed better than the national control (Salim), whereas others showed lower GY performance (e.g., lines 2, 4, 6, and 15). Several authors have noted that the wild emmer germplasm may harbor a rich allelic pool that can be used in breeding program to enhance wheat productivity and yield stability, whereas others showed that the introgression of wild relative QTLs depressed the agronomic performance [48]. As reported by Zaïm et al. [30], here, simple top crosses of three wild relative species with old ICARDA varieties followed by targeted field selection did not appear to result in any negative effect; rather, it delivered a large genetic gain in productivity. Aberkane et al. [45] also found that the wild relative-derived lines, (Haurani*2/Triticum urartu) and (Cham5*2/T. dicoccoides), yielded, respectively, 196 and 142% of their recurrent parents’ yield under drought stress. Added support for exploiting the wide crosses in wheat breeding for GY is the success obtained by using synthetics and durum by bread wheat crosses to derive new varieties.
Furthermore, our findings indicate that no superiority was exhibited by the crosses made with T. dicoccoides, Ae. speltoides, or T. araraticum (Table 5). Conversely, Zaïm et al. [30] showed that the best performing entries were derived by top crosses with T. dicoccoides and Ae. speltoides, whereas the performance of T. araraticum crosses was weaker than that of GY for disease resistance, as shown. Furthermore, Aberkane et al. [49] found that several lines derived from Triticum urartu, Triticum aegilopides, and T. dicoccoides were characterized by a cooler canopy temperature under drought stress. An improvement in yield under terminal drought stress was also reported with lines derived from crosses with T. dicoccoides, which also showed a significant variation in GY [49,50].
According to these results, the genotype × environment interactions appeared to be of importance in determining performance and therefore assessment of lines across diverse environments and over several years. This is required to identify spatially and temporally stable genotypes that can be recommended for farmers. Year-to-year climatic variation (rainfall and temperature) has a strong impact on the response of crops; hence, the use of different and contrasting environments with a combination of various factors—that is, cold and drought stresses that influence adaptation and stability performance—is an important strategy. In our investigation, elite line 20 showed a specific adaptation to the semi-arid area that experienced terminal water scarcity. This line was one of the most stable genotypes and performed better than Salim (Table 5). Therefore, line 20 can be recommended to farmers of semi-arid regions where terminal drought stress is the major constraint threatening yield stability. By comparison, elite line 22 may qualify as a widely adapted and stable genotype, but its GY was lower than that of Salim, particularly in the semi-arid region. Convincing farmers of this region to abandon high-yielding genotypes for more adapted and stable but less profitable genotypes is difficult. Therefore, this line (22) may be cultivated in sub-humid regions. The same trend was also obtained for the wild relative-derived line 24. However, lines 9, 5, 23, 1, and 10 combined better yield performance and stability than that of the national reference over the six environments. From these genotypes, wild relative-derived line 1 was widely adapted to contrasting environments, whereas elite line 9 is the best performing and stable genotype in North Africa, including Tunisia. The development and release of high yielding genotypes with high adaptation to different locations may allow the expansion of the areas used to grow durum wheat in Tunisia.

4. Conclusions

In the present investigation, the AMMI model showed that GY performance was strongly influenced by GEI effects; the magnitude of the environment effect was more important than that of the genotype effect. Most lines showed specific adaptations. Rainfall and temperature during the experiment were major factors explaining the variation in lines responses. Interestingly, line 22 showed a wide range of adaptation to semi-arid and sub-humid environments, but its GY was lower than that of Salim. Nonetheless, lines 9, 5, 23, 1, and 10 were found to be more stable and better yielding than the national reference. From these genotypes, line 1 displayed significant environmental adaptation. The AMMI method can be effectively used for the identification of suitable genotypes for adequate environments.

Supplementary Materials

The following are available online at https://www.mdpi.com/article/10.3390/agronomy11091782/s1: Table S1 Grain yield of the 25 genotypes across the six tested environments followed by the analysis of variance (ANOVA). Figure S1 Classification of the six environments based on grain yield. Figure S2 NMDS analysis of climate variables including temperature (°C) and rainfall (mm) characterizing the six environments, used to assess the grain yield.

Author Contributions

Conceptualization, S.A. and F.M.B.; methodology, S.A., F.M.B. and A.O.; software, F.M.B.; validation, F.M.B., S.A., I.B., A.O.; formal analysis, F.M.B. and I.B.; investigation, S.A., I.B. and A.O.; resources, S.A.; data curation, F.M.B.; writing—original draft preparation, S.A. and F.M.B.; writing—review and editing, I.B., F.M.B. and S.A; visualization, F.M.B. and I.B.; supervision, F.M.B. and S.A.; project administration, S.A.; funding acquisition, S.A. All authors have read and agreed to the published version of the manuscript.

Funding

This research received no external funding.

Institutional Review Board Statement

Not applicable.

Informed Consent Statement

Not applicable.

Data Availability Statement

Available upon reasonable request.

Acknowledgments

The work presented here was supported in part by Mounir Rezgui and Salah Bechrif, Technicians at the Experimental Station of Kef/INRAT; and by Jamel Nasri, Technician at the Research Regional Center of Beja. This work was also supported by the Ministry of Agriculture and the Ministry of Higher Education.

Conflicts of Interest

The authors declare no conflict of interest.

References

  1. Dahl, C. Global Durum Outlook 2017. Available online: http://www.italmopa.com/wp-content/uploads/2017/05/144_all_1.pdf. (accessed on 21 October 2019).
  2. Agriculture and Agri-Food Canada. Canada: Outlook for Principal Field Crops. Available online: https://agriculture.canada.ca/en/canadas-agriculture-sectors/crops/reports-and-statistics-data-canadian-principal-field-crops (accessed on 26 September 2019).
  3. Bonjeana, C.A.; Simonet, C. Are grain markets in Niger driven by speculation? Oxf. Econ. Pap. 2016, 68, 714–735. [Google Scholar] [CrossRef]
  4. Martínez–Moreno, F.; Solís, I.; Noguero, D.; Blanco, A.; Özberk, İ.; Nsarellah, N.; Elias, E.; Mylonas, I.; Soriano, J.M. Durum wheat in the Mediterranean Rim: Historical evolution and genetic resources. Genet. Resour. Crop Evol. 2020, 67, 1415–1436. [Google Scholar] [CrossRef]
  5. Merouche, A.; Debaeke, P.; Messahel, M.; Kelkouli, M. Response of durum wheat varieties to water in semiarid Algeria. Afr. J. Agric. Res. 2014, 9, 2879–2892. [Google Scholar]
  6. Liu, Y.; Bowman, B.C.; Hu, Y.-G.; Liang, X.; Zhao, W.; Wheeler, J.; Klassen, N.; Bockelman, H.; Bonman, J.M.; Chen, J. Evaluation of agronomic traits and drought tolerance of winter wheat accessions from the USDA-ARS national small grains collection. Agronomy 2017, 7, 51. [Google Scholar] [CrossRef]
  7. Mansour, M.; Hachicha, M. The vulnerability of Tunisian agriculture to climate change. In Emerging Technologies and Management of Crop Stress Tolerance—A Sustainable Approach; Ahmad, P., Rasool, S., Eds.; Elsevier: San Diego, CA, USA, 2014; Volume 2, pp. 485–500. [Google Scholar]
  8. Jing, R.; Daokun, S.; Liang, C.; Frank, M.Y.; Jirui, W.; Yunliang, P.; Eviatar, N.; Dongfa, S.; Ming, C.L.; Junhua, P. Genetic diversity revealed by single nucleotide pomophism markers in a worldwide germplasm collection of durum wheat. Int. J. Mol. Sci. 2013, 14, 7061–7088. [Google Scholar]
  9. Charmet, G. Wheat domestication: Lessons for the future. C. R. Biol. 2011, 334, 212–220. [Google Scholar] [CrossRef]
  10. Nyine, M.; Adhikari, E.; Clinesmith, M.; Jordan, K.W.; Fritz, A.K.; Akhunov, E. Genomic patterns of introgression in interspecific populations created by crossing wheat with its wild relative. G3 2020, 10, 3651–3661. [Google Scholar] [CrossRef]
  11. Zhang, H.; Mittal, N.; Leamy, L.J.; Barazani, O.; Song, B.H. Back into the wild −apply untapped genetic diversity of wild relatives for crop improvement. Evol. Appl. 2016, 10, 5–24. [Google Scholar] [CrossRef]
  12. Rajaram, S.; Hettel, G.P. Wheat Breeding at CIMMYT: Wheat Special Report No.29; CIMMYT, Ciudad Obregon: Sonora, Mexico, 1994; pp. 21–25. [Google Scholar]
  13. Maccaferri, M.; Harris, N.S.; Twardziok, S.O.; Pasam, R.K.; Gundlach, H.; Spannagl, M.; Ormanbekova, D.; Lux, T.; Prade, V.M.; Milner, S.G.; et al. Durum wheat genome highlights past domestication signatures and future improvement targets. Nat. Genet. 2019, 51, 885–895. [Google Scholar] [CrossRef] [Green Version]
  14. Uauy, C.; Distelfeld, A.; Fahima, T.; Blechl, A.; Dubcovsky, J. A NAC Gene regulating senescence improves grain protein, zinc, and iron content in wheat. Science 2006, 314, 1298–1301. [Google Scholar] [CrossRef] [Green Version]
  15. Reynolds, M.; Dreccer, F.; Trethowan, R. Drought-adaptive traits derived from wheat wild relatives and landraces. J. Exp. Bot. 2007, 58, 177–186. [Google Scholar]
  16. Trethowan, R.M.; Mujeeb–Kazi, A. Novel germplasm resources for improving environmental stress tolerance of hexaploid wheat. Crop Sci. 2008, 48, 1255–1265. [Google Scholar]
  17. Mohammadi, M.; Sharifi, P.; Karimizadeh, R. Stability analysis of durum wheat genotypes by regression parameteres in dryland conditions. Acta Univ. Agric. Silvic. 2014, 62, 1049–1056. [Google Scholar]
  18. Hossain, A.; Jahan, M.A.H.S.; Timsina, J.; da Silva, J.A.T.; Mahboob, M.G.; Farhad, M. Biplot yield analysis of heat-tolerant spring wheat genotypes (Triticum aestivum L.) in multiple growing environments. Open Agric. 2018, 3, 404–413. [Google Scholar]
  19. Amamou, H.; Ben Sassi, M.; Aouadi, H.; Khemiri, H.; Mahouachi, M.; Beckers, Y.; Hammami, H. Climate change-related risks and adaptation strategies as perceived in dairy cattle farming systems in Tunisia. Clim. Risk Manag. 2018, 20, 38–49. [Google Scholar]
  20. Sadok, W.; Schoppach, R.; Ghanem, M.E.; Zucca, C.; Sinclair, T.R. Wheat drought-tolerance to enhance food security in Tunisia, birthplace of the Arab Spring. Eur. J. Agron. 2019, 107, 1–9. [Google Scholar]
  21. Neisse, A.C.; Kirch, J.L.; Hongyu, K. AMMI and GGE Biplot for genotype × environment interaction: A medoid–based hierarchical cluster analysis approach for high–dimensional data. Biom. Lett. 2018, 55, 97–121. [Google Scholar]
  22. Kumar, B.; Hooda, E. GGE Biplot analysis of multi-environment yield trials for wheat in northern India Bhushan. Adv. Res. 2018, 16, 1–9. [Google Scholar]
  23. Chamekh, Z.; Karmous, C.; Ayadi, S.; Sahli, A.; Hammami, Z.; Belhaj Fraj, M.; Benaissa, N.; Trifa, Y.; Slim-Amara, H. Stability analysis of yield component traits in 25 durum wheat (Triticum durum Desf.) genotypes under contrasting irrigation water salinity. Agric. Water Manag. 2015, 152, 1–6. [Google Scholar]
  24. Yan, W.; Tinker, N.A. Biplot analysis of multi-environment trial data: Principles and applications. Can. J. Plant Sci. 2006, 86, 623–645. [Google Scholar]
  25. Akbarpour, O.; Dehghani, H.; Sorkhi, B.; Gauch, H.G., Jr. Evaluation of Genotype × Environment interaction in barley (Hordeum vulgare L.) based on AMMI model using developed SAS program. J. Agr. Sci. Tech. 2014, 16, 909–920. [Google Scholar]
  26. Ram, K.; Munjal, R.; Kesh, H.; Suresh; Kumari, A. AMMI and GGE biplot analysis for yield stability of wheat genotypes under drought and high temperature stress. Int. J. Curr. Microbiol. Appl. Sci. 2020, 9, 377–389. [Google Scholar] [CrossRef]
  27. Katsenios, N.; Sparangis, P.; Chanioti, S.; Giannoglou, M.; Leonidakis, D.; Christopoulos, M.V.; Katsaros, G.; Efthimiadou, A. Genotype × Environment interaction of yield and grain quality traits of maize hybrids in Greece. Agronomy 2021, 11, 357. [Google Scholar] [CrossRef]
  28. Gauch, H.G.; Zobel, R.W. Identifying mega-environments and targeting genotypes. Crop Sci. 1997, 37, 311–326. [Google Scholar] [CrossRef]
  29. Sanchez–Garcia, M.; Álvaro, F.; Martín–Sánchez, J.A.; Sillero, J.C.; Escribano, J.; Royo, C. Breeding effects on the genotype´ environment interaction for yield of bread wheat grown in Spain during the 20th century. Field Crop. Res. 2012, 126, 79–86. [Google Scholar] [CrossRef]
  30. Zaïm, M.; El Hassouni, K.; Gamba, F.; Filali–Maltouf, A.; Belkadi, B.; Ayed, S.; Amri, A.; Nachit, M.; Taghouti, M.; Bassi, M.F. Wide crosses of durum wheat (Triticum durum Desf.) reveal good disease resistance, yield stability, and industrial quality across Mediterranean sites. Field Crop. Res. 2017, 214, 219–227. [Google Scholar] [CrossRef]
  31. Zadoks, J.C.; Chang, T.T.; Konzak, C.F.A. decimal code for the growth stages of cereals. Weed Res. 1974, 14, 415–421. [Google Scholar] [CrossRef]
  32. Payne, R.W.; Harding, S.A.; Murray, D.A.; Soutar, D.M.; Baird, D.B.; Welham, S.J.; Kane, A.F.; Gilmour, A.R.; Thompson, R.; Webster, R. GenStat Release 9 Reference Manual, Part 2: Directives; VSN Int.: Hemel Hempstead, UK, 2006. [Google Scholar]
  33. Pacheco, A.; Vargas, M.; Alvarado, G.; Rodríguez, F.; Crossa, J.; Burgueño, J.; GEA–R (Genotype × Environment Analysis with R for Windows). Version 2.0. CIMMYT. 2016. Available online: http://hdl.handle.net/11529/10203 (accessed on 20 June 2016).
  34. Zobel, R.W.; Wright, M.J.; Gauch, H.G. Statistical analysis of a yield trial. Agron. J. 1988, 80, 388–393. [Google Scholar] [CrossRef]
  35. Sneller, C.H.; Cilgore–Norquest, L.; Dombek, D. Repeatability of yield stability statistics in soybean. Crop Sci. 1997, 37, 383–390. [Google Scholar] [CrossRef]
  36. Sabaghnia, N.; Sabaghpour, S.H.; Dehghani, H. The use of an AMMI model and its parameters to analyze yield stability in multi-environment trials. J. Agric. Sci. 2008, 146, 571–581. [Google Scholar] [CrossRef]
  37. Bassi, F.M.; Sanchez–Garcia, M. Adaptation and stability analysis of ICARDA durum wheat elites across 18 countries. Crop Sci. 2017, 57, 2419–2430. [Google Scholar] [CrossRef]
  38. Kaya, Y.; Akçura, M.; Taner, S. GGE-biplot analysis of multi-environment yield trials in bread wheat. Turk. J. Agric. For. 2006, 30, 325–337. [Google Scholar]
  39. Subira, J.; Álvaro, F.; del Moral, L.F.G.; Royo, C. Breeding effects on the cultivar × environment interaction of durum wheat yield. Eur. J. Agron. 2015, 68, 78–88. [Google Scholar] [CrossRef] [Green Version]
  40. Muhammad, S.; Mohammad, F. Identifying stable bread wheat derived lines across environments through GGE biplot analysis. Sarhad J. Agric. 2018, 34, 63–69. [Google Scholar] [CrossRef]
  41. Thungo, Z.; Shimelis, H.; Odindo, A.O.; Mashilo, J. Genotype-by-environment interaction of elite heat and drought tolerant bread wheat (Triticum aestivum L.) genotypes under non-stressed and drought-stressed conditions. Acta Agric. Scand. B Soil Plant Sci. 2019, 69, 1651–1913. [Google Scholar] [CrossRef]
  42. Ndiaye, M.; Adam, M.; Ganyo, K.K.; Guissé, A.; Cissé, N.; Muller, B. Genotype-environment interaction: Trade-offs between the agronomic performance and stability of dual-purpose sorghum (Sorghum bicolor L. Moench) genotypes in Senegal. Agronomy 2019, 9, 867. [Google Scholar] [CrossRef] [Green Version]
  43. Mohammadi, R.; Farshadfar, E.; Amri, A. Interpreting genotype × environment interactions for grain yield of rainfed durum wheat in Iran. Crop J. 2015, 3, 526–535. [Google Scholar] [CrossRef] [Green Version]
  44. Waines, J. High temperature stress in wild wheats and spring wheats. Funct. Plant Biol. 1994, 21, 705–715. [Google Scholar] [CrossRef]
  45. Aberkane, H.; Amri, A.; Belkadi, B.; Filali–Maltouf, A.; Kehel, Z.; Tahir, I.S.A.; Meheesi, A.; Tsivelikas, A. Evaluation of durum wheat lines derived from interspecific crosses under drought and heat stress. Crop Sci. 2021, 61, 119–136. [Google Scholar] [CrossRef]
  46. Mehari, M.; Tesfay, M.; Yirga, H.; Mesele, A.; Abebe, T.; Workineh, A.; Amare, B. GGE biplot analysis of genotype-by-environment interaction and grain yield stability of bread wheat genotypes in South Tigray, Ethiopia. Commun. Biomet. Crop Sci. 2015, 10, 17–26. [Google Scholar]
  47. El Haddad, N.; Kabbaj, H.; Zaïm, M.; El Hassouni, K.; Tidiane Sall, A.; Azouz, M.; Rodomiro, O.; Baum, M.; Amri, A.; Gamba, F.; et al. Crop wild relatives in durum wheat breeding: Drift or thrift? Crop Sci. 2021, 61, 37–54. [Google Scholar] [CrossRef]
  48. Mondal, S.; Rutkoski, J.E.; Velu, G.; Singh, P.K.; Crespo–Herrera, L.A.; Guzmán, C.; Bhavani, S.; Lan, C.; He, X.; Singh, R.P. Harnessing diversity in wheat to enhance grain yield, climate resilience, disease and insect pest resistance and nutrition through conventional and modern breeding approaches. Front. Plant Sci. 2016, 7, 991. [Google Scholar] [CrossRef] [PubMed] [Green Version]
  49. Aberkane, H.; Belkadi, B.; Kehel, Z.; Filali–Maltouf, A.; Tahir, I.S.A.; Meheesi, S.; Amri, A. Assessment of drought and heat tolerance of durum wheat lines derived from interspecific crosses using physiological parameters and stress indices. Agronomy 2021, 11, 695. [Google Scholar] [CrossRef]
  50. Nachit, M.M.; Elouafi, I. Durum wheat adaptation in the mediterranean dryland: Breeding, stress physiology, and molecular markers. In CSSA Special Publications; Rao, S.C., Ryan, J., Eds.; Crop Science Society of America and American Society of Agronomy: Madison, WI, USA, 2015; pp. 203–218. ISBN 978-0-89118-611-3. [Google Scholar]
Figure 1. Genotype plus genotype × environment model (PC) based on grain yield of 25 durum wheat genotypes across the six environments.
Agronomy 11 01782 g001
Figure 2. Combined analysis using yield stability (AWAI) compared to the yield ratio of Salim for each environment separately (AC) and for all environments (D). Green lines are more stable and better yielding than Salim (line 25).
Agronomy 11 01782 g002
Table 1. List and pedigree of durum wheat genotypes used in the study.
LineNameTypePedigree
1DWAyT_0204Wild relative-derivedYounes/TdicoAlpCol//Korifla
2DWAyT_0214Wild relative-derivedKorifla/AegSpeltoidesSyr//Amedakul
3FarajCommercial varietyF413J.S/3/Arthur71/Lahn//Blk2/Lahn/4/Quarmal
4NachitWild relative-derived Amedakul1/TdicoSyrCol//Loukos
5DWAyT_0306Wild relative-derived Korifla/AegSpeltoidesSyr//Heider
6JabalWild relative-derived Korifla/AegSpeltoidesSyr//Mrb5
7WahaCommercial varietyPlc/Ruff//Gta/Rtte
8MagrourWild relative-derivedAmedakul1/TdicoSyrCol//Cham1
9Icakassem1EliteGeromtel1/Icasyr1
10DWAyT_0217Wild relative-derived Korifla/AegSpeltoidesSyr//Loukos
11Jabal 2Wild relative-derived Korifla/AegSpeltoidesSyr//Mrb5
12SecondroueEliteStj3//Bcr/Lks4/3/Ter3/4/Bcr/Gro1//Mgnl1
13DAWRyT_0208Wild relative-derived Korifla/AegSpeltoidesSyr/Amedakul
14DAWRyT0122Wild relative-derived Amedakul1/TdicoJCol//Cham1
15DWAyT_0205Wild relative-derived Younes/TdicoAlpCol//Korifla
16TomouhCommercial varietyJoric69/Hau
17DWAyT-0322Wild relative-derivedHeider/TAraticumMA//Mrb5
18Omrabi5Commercial varietyJoric69/Hau
19Zagharin2EliteIcasyr1/3/Gcn//Stj/Mrb3
20Ouassara1EliteOuasloukos1/5/Azn1/4/BEZAIZSHF//SD19539/Waha/3/Gdr2
21IcacubeEliteMgnl3/Ainzen1//Mgnl3/Ainzen1
22AghramatlasEliteMgnl3/Ainzen1//Mgnl3/Aghrass2
23IcaverveEliteAzeghar1/4/IcamorTA0462/3/Maamouri3//Vitron/Bidra1/5/Mgnl3/Ainzen1
24Icamoram 7Wild relative-derivedTAraraticum0472/Ammar7
25SalimLocal check varietyALTAR84/FD8419-126-1-2/RAZZAK/3/KORIFLA/BALADIAHAMRA
Table 2. Description of the tested environments in Kef and Beja sites.
EnvironmentSeasonLocationCoordinatesAltitude (m)Soil TexturepHOM (%) 1CaCO3 (%) 2N (ppm) 3P (ppm) 4K (ppm) 5
Kef_152014–2015Kef36°11′10″ N; 8°42′00″ E532Clay-loam7.911.4125.6798.0016.53510.00
Kef_162015–2016
Kef_172016–2017
Kef_182017–2018
Beja_162015–2016Beja36°43′ N; 9°12′ E161Vertic7.002.102.3087.5380.00621.00
Beja_192018–2019
1 OM, organic matter. 2 CaCO3, calcium carbonate. 3 N, nitrogen. 4 P, phosphorus. 5 K, potassium.
Table 3. Climatic variations across the six tested environments in Kef and Beja sites.
EnvironmentTotalOctoberNoveberDecemberJanunaryFebruary MarchAprilMayJune
Rainfall (mm)Kef_15362.033.043.060.070.066.066.00.022.02.0
Kef_16298.028.042.04.055.013.089.030.032.05.0
Kef_17242.011.043.051.032.024.02.040.02.037.0
Kef_18340.127.096.223.232.431.641.439.78.240.4
Beja_16502.377.5108.821.465.039.2115.623.440.411.0
Beja_19678.2122.875.439.8138.449.8108.837.0106.20.0
Average44.949.968.133.265.537.370.528.435.115.9
Avg. temperature (°C)Kef_1514.720.815.07.49.98.213.710.923.423.1
Kef_1617.622.414.69.612.611.216.218.525.328.3
Kef_1715.720.814.310.16.712.512.317.021.226.5
Kef_1816.516.815.510.010.810.315.718.023.028.7
Beja_1610.614.111.45.16.46.56.29.612.024.3
Beja_1916.818.517.115.613.412.916.613.217.326.3
Average15.318.914.69.69.910.313.414.520.326.2
Table 4. Analysis of variance for grain yield of 25 genotypes studied across the six environments.
Sources of VariancedfSum Square% (G + E + G × E) 1
Genotypes (G)24579.98 **2.62
Environment (E)516,422.55 **72.05
G × E1205769.77 **25.33
df, degree freedom; **, significant at 0.01, 1: % respect (E + G + G × E) SS.
Table 5. Mean grain yield of 24 durum wheat lines converted into ratios to Salim (grain yield rate) across the six environments.
LineGrain Yield Converted into Ratios to SalimAWAI
Kef_15Kef_16Kef_17Kef_18Beja_16Beja_19MeanGroups 1
11.130.711.110.961.011.481.04A0.72
20.880.790.640.851.011.140.89AB0.65
31.010.660.810.751.081.270.93AB0.72
41.080.771.100.681.011.070.95AB0.79
51.460.820.840.801.241.051.07A0.72
61.240.740.700.580.931.180.91AB0.83
71.340.670.840.860.951.000.96AB0.66
81.200.570.570.831.111.290.94AB0.82
91.250.960.640.841.361.291.09A0.87
101.270.930.790.731.191.111.03AB0.85
111.350.660.720.751.000.970.94AB0.64
121.410.920.450.581.131.221.00AB0.58
131.231.000.280.710.941.120.93AB0.67
141.330.750.100.801.141.390.97AB0.64
151.200.850.210.790.940.980.88B0.75
161.180.621.000.840.871.130.93AB0.83
171.140.490.480.701.121.410.90AB0.76
181.190.900.460.831.041.300.98AB0.86
191.180.640.950.801.131.050.96AB0.85
201.600.760.760.680.911.141.01AB0.46
211.170.830.860.711.071.311.00AB0.91
220.860.510.880.921.441.110.95AB0.38
231.021.011.100.751.181.331.06A0.63
240.790.930.870.641.011.300.91AB0.46
251.001.001.001.001.001.001.00AB0.57
1 Means with similar letter(s) is not significantly different at 5% probability level according to LSD test.
Publisher’s Note: MDPI stays neutral with regard to jurisdictional claims in published maps and institutional affiliations.

