
Bio-Fertilizers Based on Digestate and Biomass Ash as an Alternative to Commercial Fertilizers—The Case of Tomato


Abstract
:1. Introduction
2. Materials and Methods
2.1. Site Description
2.2. Weather Conditions
2.3. Experimental Design
- (1)
- Bio-Fertilizer A (composed of 70% of biomass ash (BA) + 25% of digestate (D) + 5% of S0);
- (2)
- Bio-Fertilizer B (composed of 25% of BA + 75% of digestate D);
- (3)
- Bio-Fertilizers C (composed of 30% BA + 45% of digestate D) + 5% of S0 + 5% of urea + 15% of phosphoric rock;
- (4)
- The rate of applied bio-fertilizers was as follows: 200; 400; 800, and 1600 kg ha−1;
- (5)
- Absolute Control plot (AC)—i.e., plot without application of any fertilizers;
- (6)
- Mineral Control plot (MC)—i.e., plot fertilized with Yara Mila Complex (N-12%, P2O5-11%; K2O-18%; MgO-2.7%; SO3-2%; B-0.015%; Fe-0.2%; Mn-0.02%; Zn-0.02%) supplied at an N rate of 100 kg N ha−1.
2.4. Chemical Measurements
2.4.1. Soil
2.4.2. Plant
2.5. Statistical Analysis
3. Results
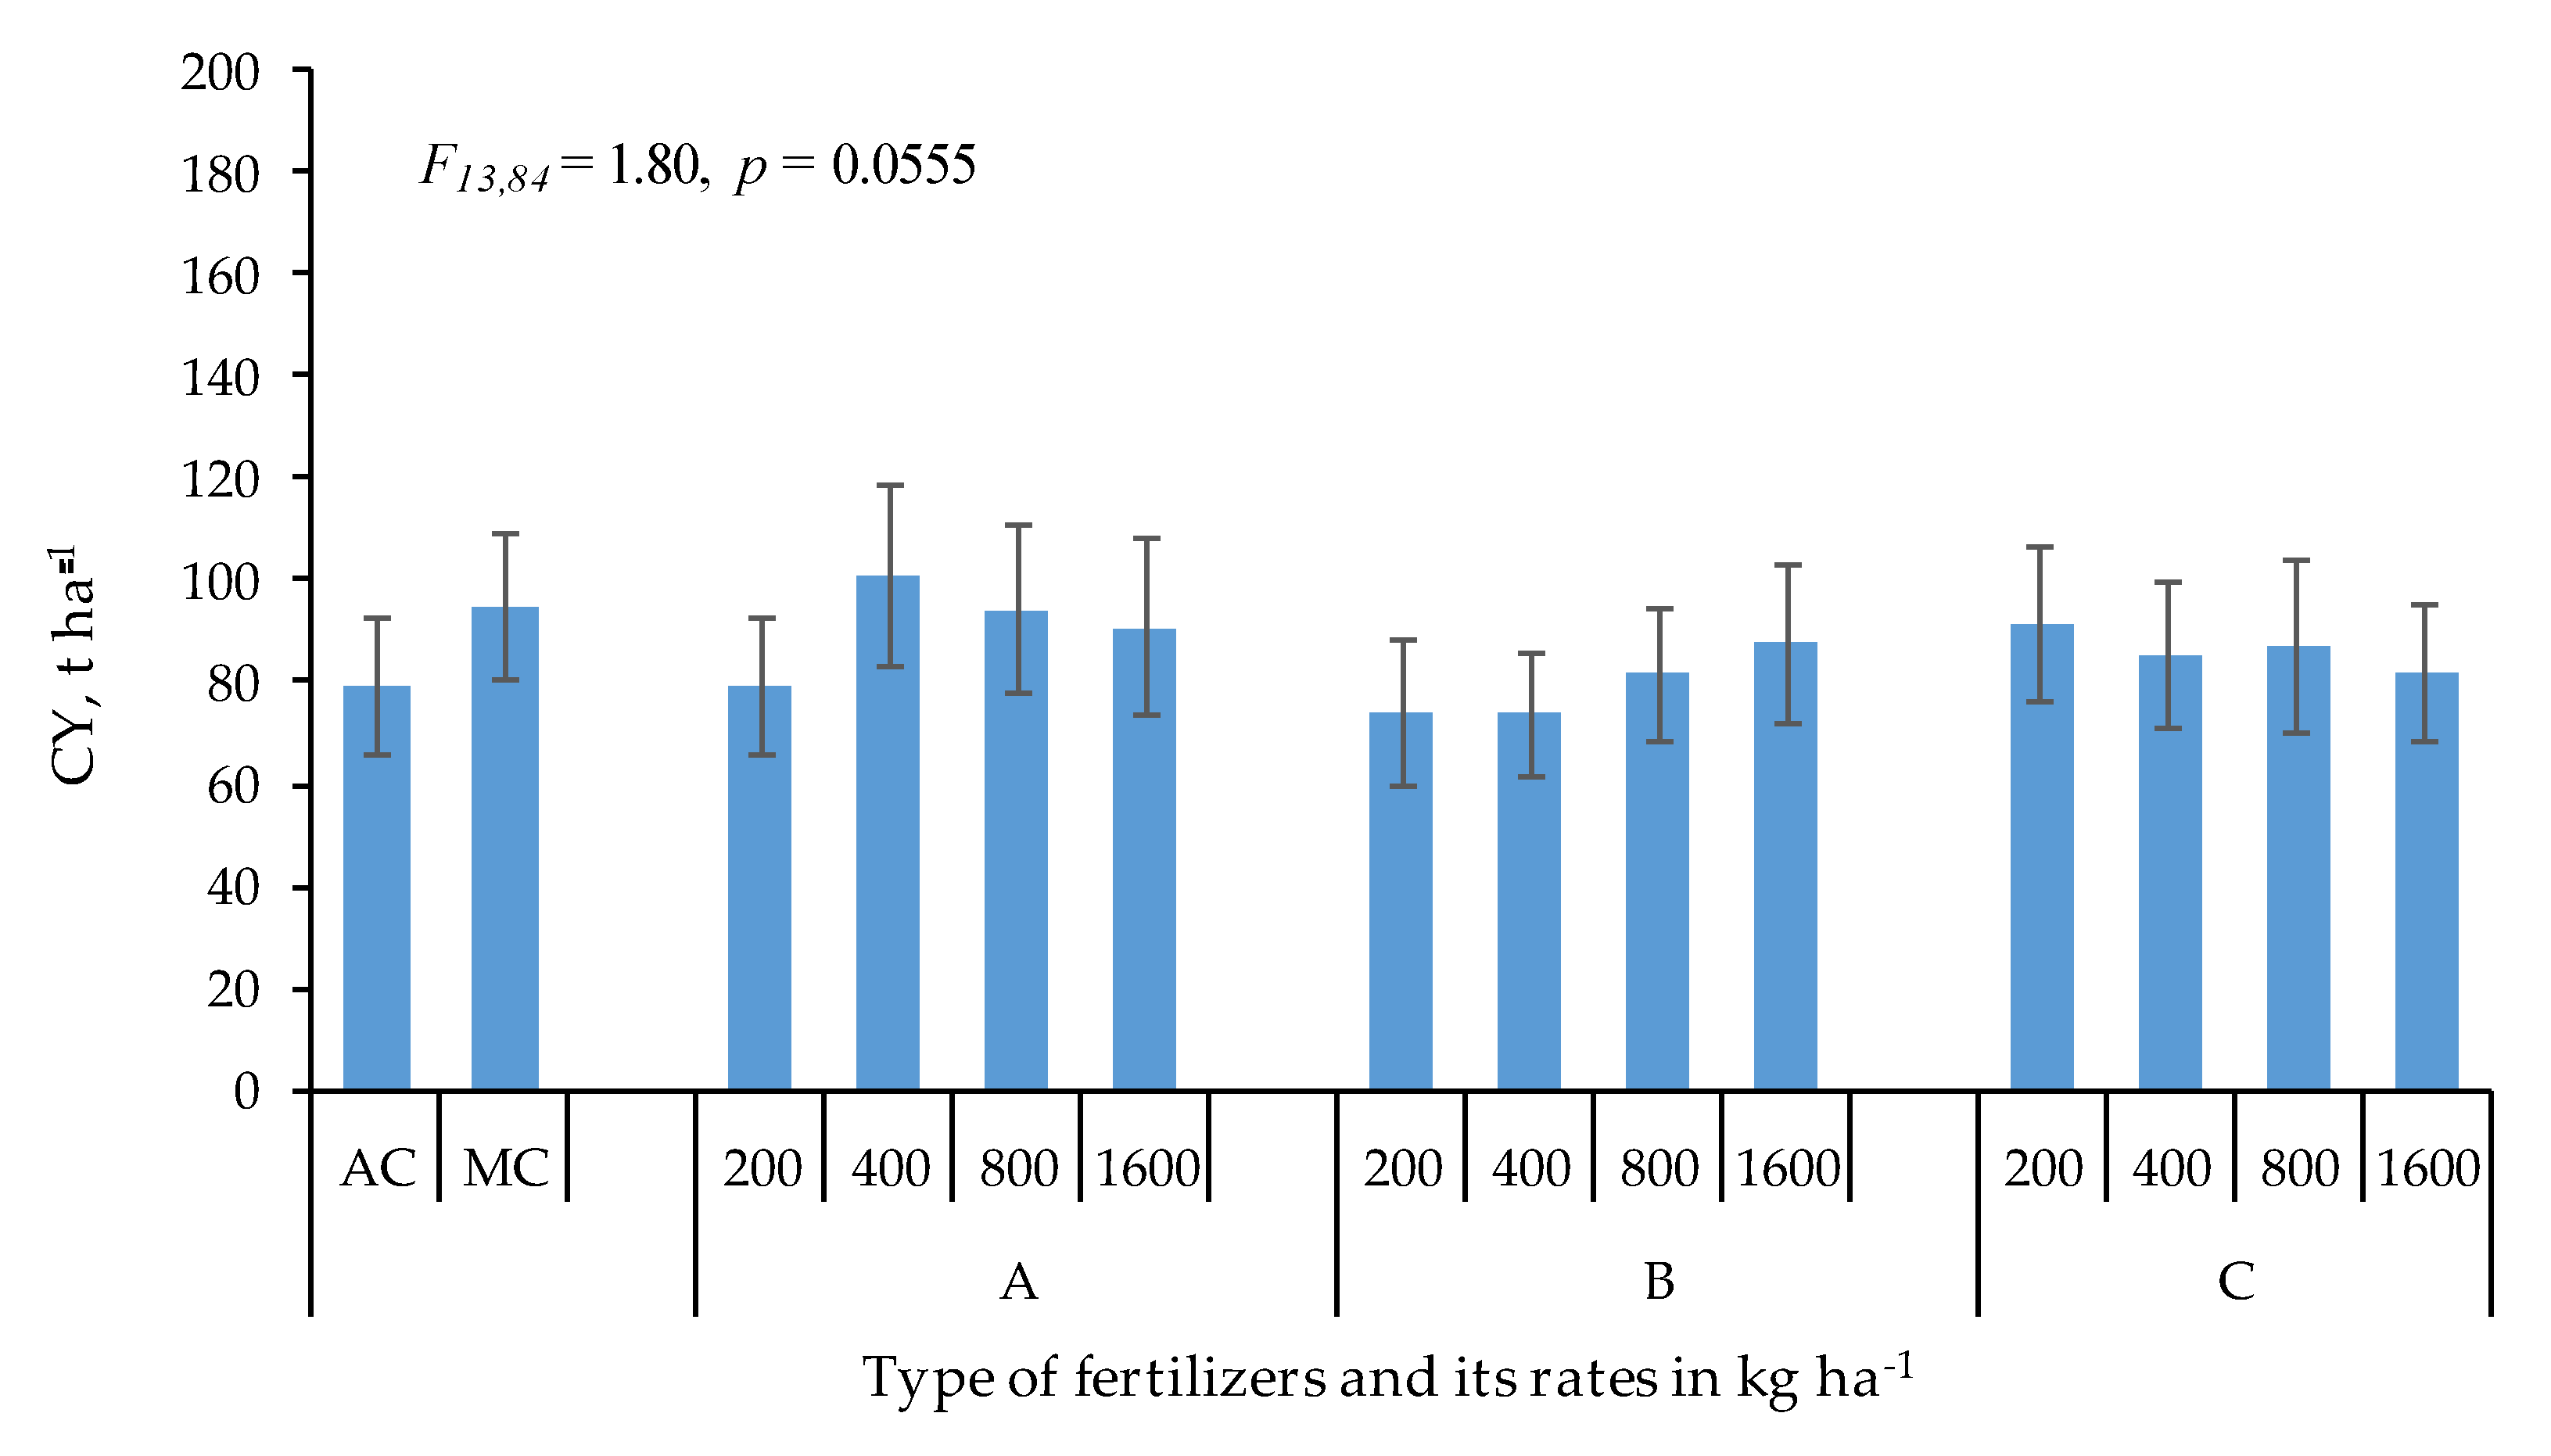
3.1. Tomato Yield
3.2. Yield Components
3.3. Chemical Quality Parameters
3.4. Nutrients and Heavy Metals
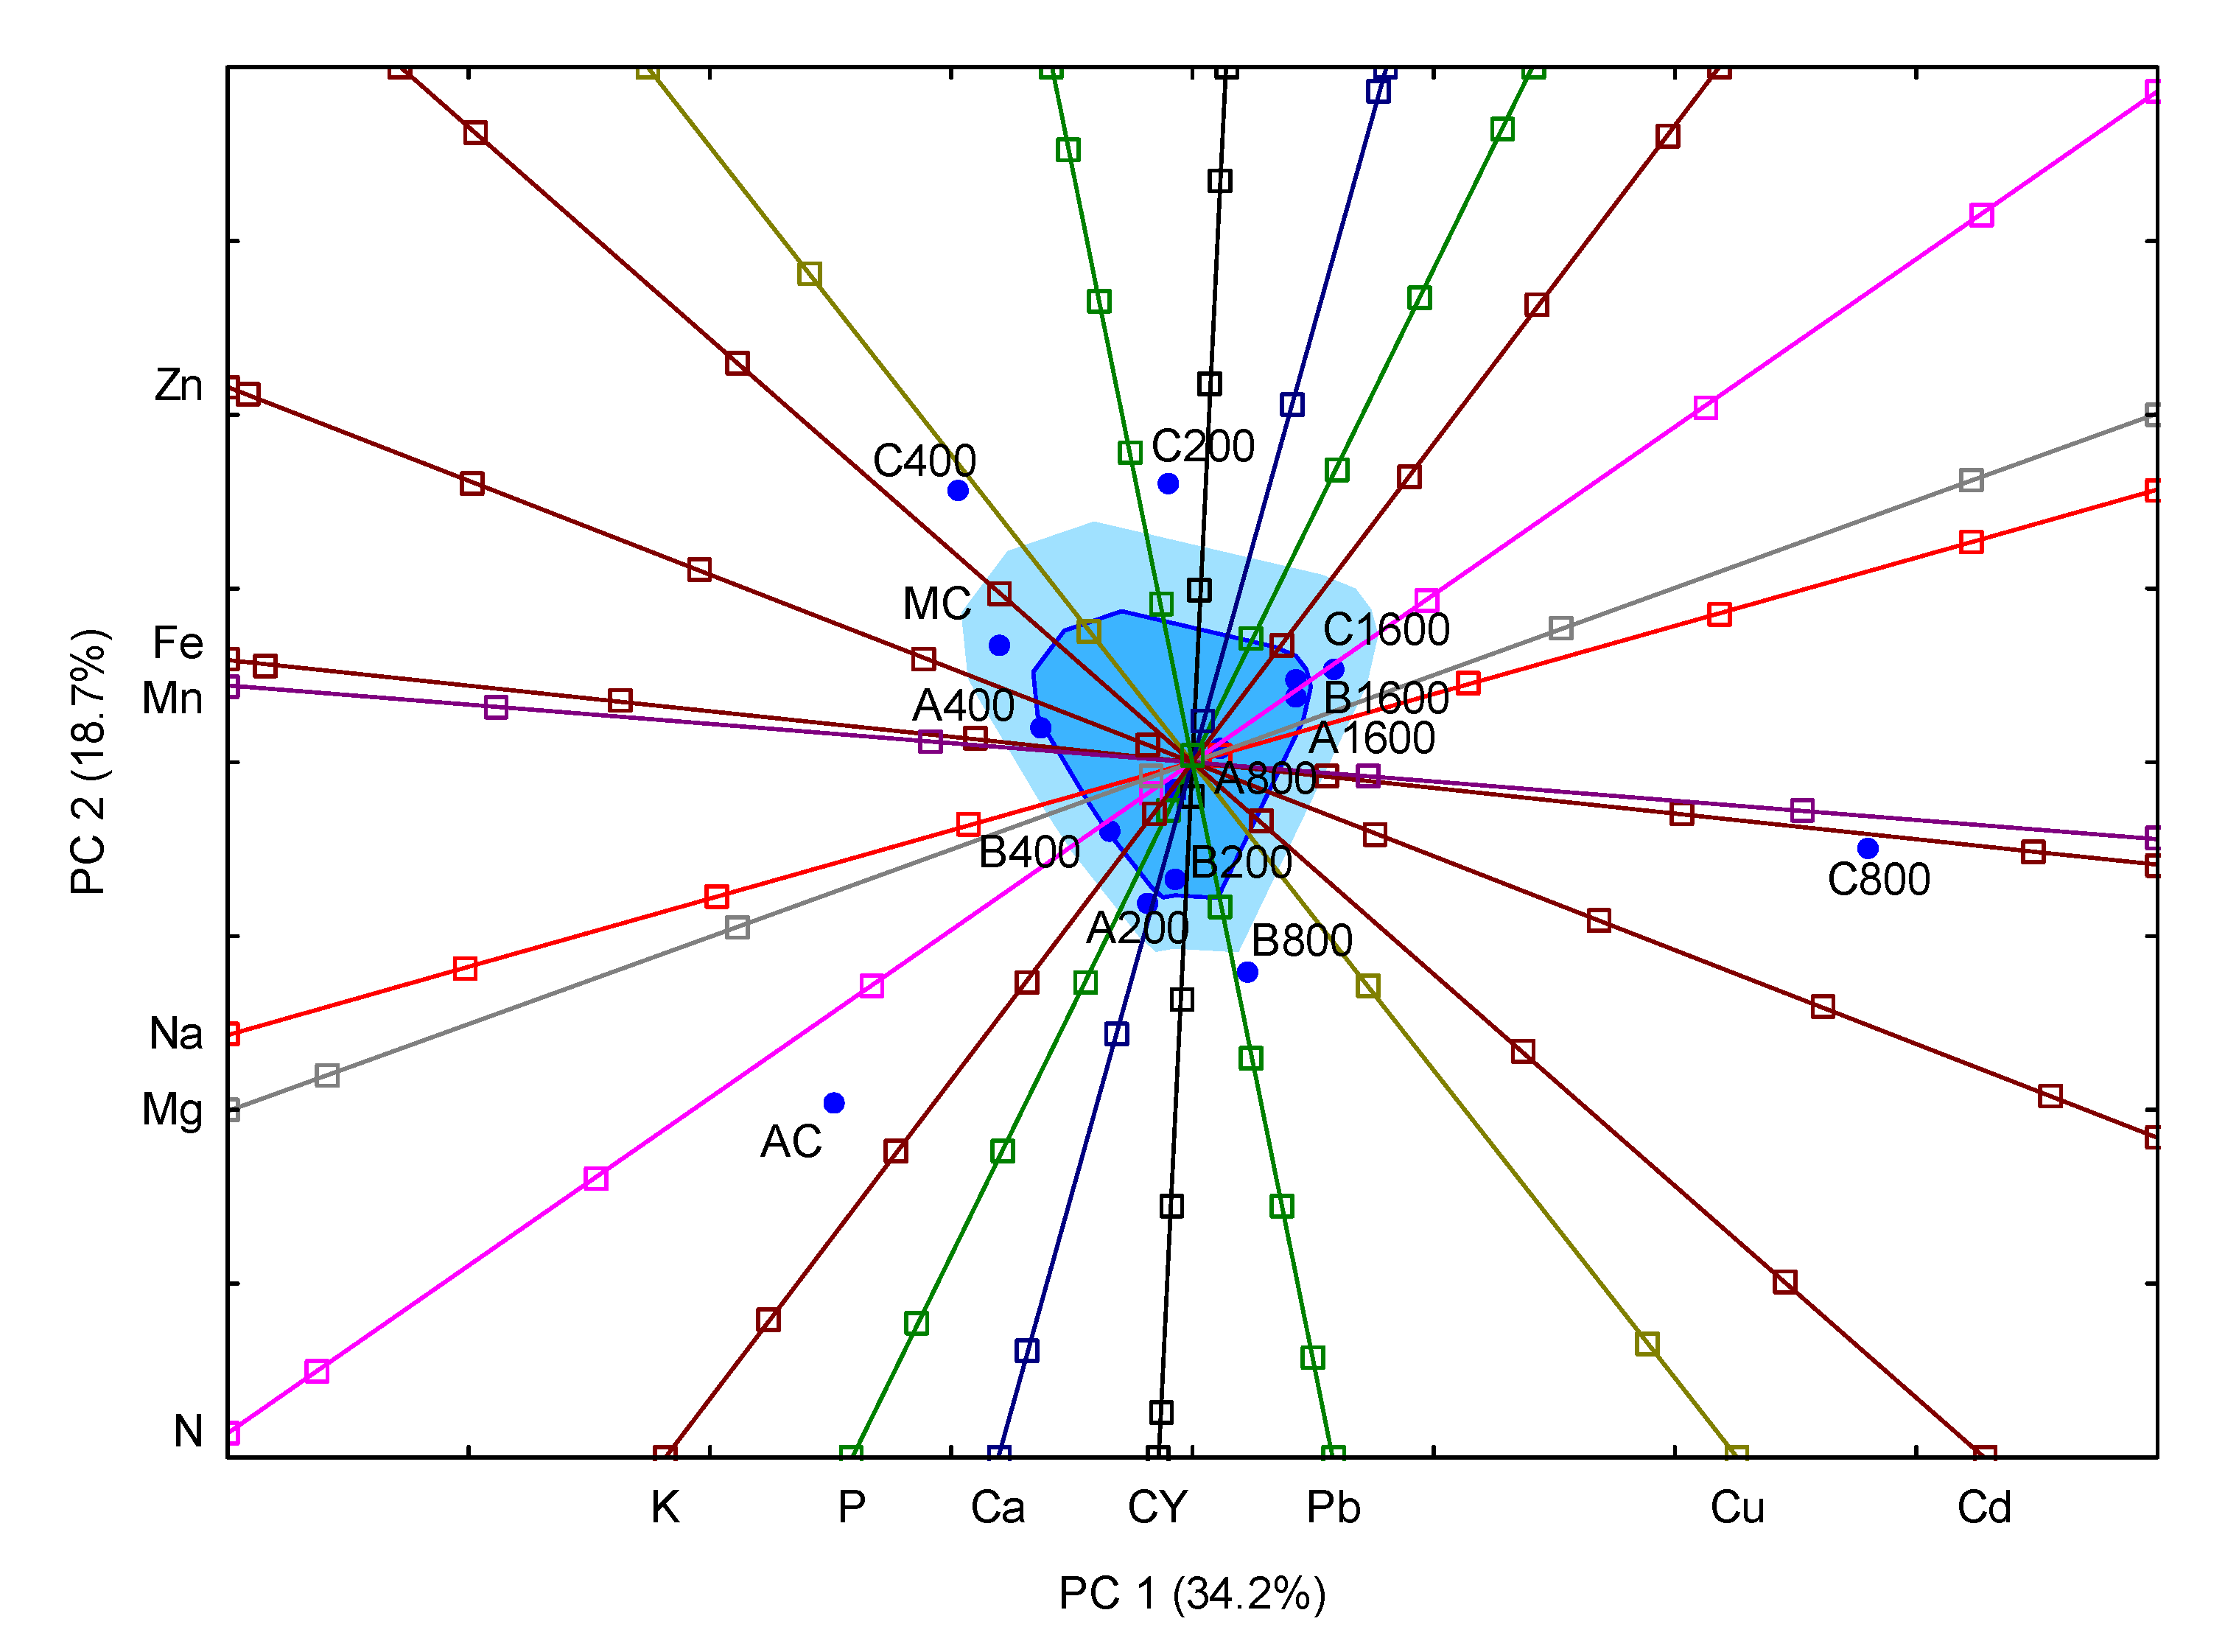
3.5. Relationships between Features
4. Discussion
5. Conclusions
Supplementary Materials
Author Contributions
Funding
Institutional Review Board Statement
Informed Consent Statement
Conflicts of Interest
References
- Altoukhov, A.; Kashkin, S.; Utkina, E. Bioeconomic development in Europe and in the world. XXII E3S Web Conf. 2021, 244, 10061. [Google Scholar] [CrossRef]
- Eurostat. Share of Energy from Renewable Sources. Available online: https://ec.europa.eu/eurostat/databrowser/view/nrg_ind_ren/default/table?lang=en (accessed on 3 July 2021).
- Marks-Bielska, R.; Bielski, S.; Pik, K.; Kurowska, K. The importance of renewable energy sources on Poland’s energy mix. Energies 2020, 13, 4624. [Google Scholar] [CrossRef]
- Braingardt, S.; Bürger, V.; Zieger, J.; Bosselaar, L. How to include cooling in the EU renewable Energy Directive: Strategies and policy implications. Energy Policy 2019, 129, 260–267. [Google Scholar] [CrossRef]
- Tzelepi, V.; Zeneli, M.; Kourkoumas, D.S.; Karampinis, E.; Gypakis, A.; Nikolopoulos, N.; Grammelis, P. Biomass availability in Europae as an alternative fuel for full conversion of lignite power plants—Acritical review. Energies 2020, 13, 3390. [Google Scholar] [CrossRef]
- Bioenergy Fact Sheet. Available online: https://etipbioenergy.eu/images/ETIP_B_Factsheet_Bioenergy%20in%20Europe_rev_feb2020.p (accessed on 3 July 2021).
- Baum, R.; Wajszczuk, K.; Pepliński, B.; Wawrzynowicz, J. Potential for Agricultural Biomass Production for Energy Purposes in Poland: A Review, Contemporary Economics; SSRN: New York, NY, USA, 2014; Volume 7, pp. 63–74. Available online: https://ssrn.com/abstract=2253173 (accessed on 3 July 2020).
- Singh, A.; Christensen, T.; Panoutsou, C. Policy review for biomass value chans in European bioeconomy. Glob. Transit. 2021, 3, 13–42. [Google Scholar] [CrossRef]
- Kowalczyk-Juśko, A. The influence of the ash from the biomass on the power boiler production. J. Ecol. Eng. 2017, 18, 200–204. [Google Scholar] [CrossRef]
- Zając, G.; Szyszlak-Bargłowicza, J.; Gołebiowski, W.; Szczepanik, M. Chemical characteristics of biomass ashes. Energies 2018, 11, 2885. [Google Scholar] [CrossRef] [Green Version]
- Scarlat, N.; Dallemand, J.F.; Fahl, F. Biogas: Developments and perspectives in Europe. Renew. Energy 2018, 129, 457–472. [Google Scholar] [CrossRef]
- Winquist, E.; van Galen, M.; Zielonka, S.; Rikkonen, P.; Qudendag, D.; Zhou, J.; Greijdanus, A. Expert views on the future development of biogas business branch in Germany, The Netherlands, and Finland until 2030. Sustainability 2021, 13, 1148. [Google Scholar] [CrossRef]
- Vaneckhaute, C.; Meers, E.; Michels, E.; Buysse, J.; Tack, F.M.G. Ecological and economic benefits of the application of bio-based mineral fertilizers in modern agriculture. Biomass Bioenergy 2013, 49, 239–248. [Google Scholar] [CrossRef] [Green Version]
- Möller, K.; Müller, T. Effects of anaerobic digestion on digestate nutrient availability and crop growth: A review. Eng. Life Sci. 2012, 3, 242–257. [Google Scholar] [CrossRef]
- Hadley Kershaw, E.; Hartley, S.; McLeod, C.; Polson, P. The sustainable path to circular bioeconomy. Trends Biotechnol. 2021, 39, 6. [Google Scholar] [CrossRef] [PubMed]
- Przygocka-Cyna, K.; Grzebisz, W. The multifactorial effect of digestate on the availability of soil elements and grain yield and its mineral profile—The case of maize. Agronomy 2020, 10, 275. [Google Scholar] [CrossRef] [Green Version]
- Łagocka, A.; Kamiński, M.; Cholewiński, M.; Pospolita, W. Health and environmental benefits of utilization of post-fermentation pulp from agricultural biogas plants as a natural fertilizer. Kosmos 2016, 65, 601–607. [Google Scholar]
- Herbes, C.; Roth, C.; Wulf, S.; Dahlin, W. Economic assessment of different biogas digestate processing technologies: A scenario-based analysis. J. Clean. Prod. 2020, 255, 120282. [Google Scholar] [CrossRef]
- Przygocka-Cyna, K.; Grzebisz, W. Biogas digestate—Benefits and risks for soil fertility and crop quality—An evaluation of grain maize response. Open Chem. 2018, 16, 258–271. [Google Scholar] [CrossRef] [Green Version]
- Przygocka-Cyna, K.; Grzebisz, W.; Łukowiak, R. Effect of bio-fertilizer amendment on agrochemical properties of soil cropped with vegetables. J. Elem. 2018, 23, 163–167. [Google Scholar]
- Przygocka-Cyna, K.; Grzebisz, W. Effect of bio-fertilizer amendments on the concentration of elements in edible parts of radish and green been grown in a cropping sequence. J. Elem. 2018, 23, 69–83. [Google Scholar]
- Barłóg, P.; Hlisnikovský, L.; Kunzová, E. Yield, content, and nutrient uptake by winter wheat and spring barley in response to applications of digestate, cattle slurry, and NPK mineral fertilizers. Arch. Agron Soil Sci. 2020, 66, 1481–1496. [Google Scholar] [CrossRef]
- Dias, J.S. Nutritional quality and health benefits of vegetables—A review. Food Nutr. Sci. 2012, 3, 1354–1374. [Google Scholar] [CrossRef] [Green Version]
- Dorais, M.; Ehret, D.L.; Papadopoulos, A.P. Tomato (Solanum lycopersicum L.) health components: From the seed to the consumer. Phytochem. Rev. 2008, 7, 231–250. [Google Scholar] [CrossRef]
- Przygocka-Cyna, K.; Grzebisz, W.; Łukowiak, R.; Biber, M. Biomass ash and biogas digestate bio-fertilizers as a source of nutrients for light acid soil—An exhaustion lettuce test. J. Elem. 2018, 23, 413–428. [Google Scholar]
- Przygocka-Cyna, K.; Grzebisz, W.; Biber, M. Evaluation of the potential of bio-fertilizers as a source of nutrients and heavy metals by means of the exhaustion lettuce test. J. Elem. 2018, 23, 429–445. [Google Scholar] [CrossRef]
- Guerra, F.; Trevizam, A.R.; Muraoka, T.; Marcante, N.C.; Cannatti-Brazaca, S.G. Heavy metals in vegetables and potential risk for human health. Sci. Agric. 2012, 69, 54–60. [Google Scholar] [CrossRef] [Green Version]
- Musielińska, R.; Kowol, J.; Kwapuliński, J.; Rochel, R. Antagonism between lead and zinc ions in plants. Arch. Environ. Protect. 2016, 42, 78–91. [Google Scholar] [CrossRef] [Green Version]
- Directive 2008/98/EC of the European. Parliament and of the Council on Waste and Repealing Certain Directives of 19 November 2008. European Union, Setting Maximum Levels for Certain Contaminants in Foodstuffs, Commission Regulation (EC) No. 1881/2006 of 19 December 2006. Off. J. Eur. Union. Available online: https://eur-lex.europa.eu/legal-content/FR/ALL/?uri=CELEX:52014SC0172 (accessed on 20 July 2021).
- Gruca-Królikowska, S.; Wacławek, W. Metals in the environment. Part II. Effect of heavy metals on plants. Chem. Dydakt. Ekol. Metrol. 2006, 11, 41–56. (In Polish) [Google Scholar]
- Li, F.-L.; Shi, W.; Jin, Z.-F.; Wu, H.; Sheng, G.D. Excessive uptake of heavy metals by greenhouse vegetables. J. Geochem. Expl. 2017, 173, 76–84. [Google Scholar] [CrossRef]
- Diacono, M.; Persiani, A.; Testani, E.; Montemuro, F.; Ciaccia, C. Recycling agricultural wastes and by-products in organic farming: Biofertilizer production, yield, performance and carbon footprint analysis. Sustainability 2019, 11, 3824. [Google Scholar] [CrossRef] [Green Version]
- Nkoa, R. Agricultural benefits and environmental risks of soil fertilization with anaerobic digestates: A review. Agron. Sustain. Dev. 2014, 34, 473–492. [Google Scholar] [CrossRef] [Green Version]
- Foereid, B. Nutrients recovered from organic residues as fertilizers: Challenges to management and research methods. World J. Agric. Soil Sci. 2019, 1, 1–7. [Google Scholar] [CrossRef]
- Chojnacka, K.; Moustakas, K.; Witek-Krowiak, A. Bio-based fertilizers: A practical approach towards circular economy. Bioresour. Technol. 2020, 295, 122223. [Google Scholar] [CrossRef]
- Murtić, S.; Zahirović, Ć.; Čivić, H.; Karić, L.; Jurković, J. Uptake of heavy metals by tomato plants (Lycopersicum esculnetum Mill.) and their distribution inside the plant. Agric. For. 2018, 65, 251–261. [Google Scholar]
- Dragicevic, I.; Sogn, T.A.; Eich-Greatoerx, Z. recycling of biogas digestate in crop production—soil and plant trace metals content and variability. Front. Sustain. Food Syst. 2018, 2, 45. [Google Scholar] [CrossRef] [Green Version]
- Pastorelli, R.; Valboa, G.; Lagomarsino, A.; Fabiani, A.; Simoncini, S.; Zaghi, M.; Vignozzi, N. recycling biogas digestate from energy crops: Effects on soil properties and crop productivity. App. Sci. 2021, 11, 750. [Google Scholar] [CrossRef]
- Bertato, V. Digestate and Compost as Fertilizers: Risk Assessment and Risk Management Options; EU 2019. In Wood Environment & Infrastructure Solutions UK Limited; p. 463. Available online: https://ec.europa.eu/environment/chemicals/reach/pdf/40039%20Digestate%20and%20Compost%20RMOA%20-%20Final%20report%20i2_20190208.pdf%20Final%20report%20i2_20190208.pdf20Final%20report%20i2_20190208.pdf (accessed on 20 July 2021).
- Mehlich, A. Mehlich 3 soil test extractant: A modification of Mehlich 2 extractant. Comm. Soil. Sci. Plant Anal. 1984, 15, 1409–1416. [Google Scholar] [CrossRef]
- Trávník, K.; Zbíral, J.; Nemec, P. Agrochemical Soil Testing—Mehlich III; Central Institute for Supervising and Testing in Agriculture: Brno, Czech Republic, 1999. [Google Scholar]
- Zbiral, J. Determination of plant-available micronutrients by the Mehlich 3 soil extractant—A proposal of critical values. Plant. Soil Environ. 2016, 62, 527–531. [Google Scholar] [CrossRef] [Green Version]
- Yemm, E.W.; Wills, A.J. The estimation of carbohydrates in plant extracts by antrone. Biochem. J. 1954, 57, 508–514. [Google Scholar] [CrossRef] [Green Version]
- Nagata, M.; Yamashita, I. Simple method for simultaneous determination of chlorophyll and carotenoids in tomato fruit. J. Jpn. Soc. Food Sci. 1992, 39, 925–928. [Google Scholar]
- Rousseeuw, J.; Ruts, I.; Tukey, J.W. The Bagplot: A bivariate Boxplot. Am. Stat. 1999, 53, 382–387. [Google Scholar] [CrossRef]
- TIBCO Software Inc. Data Science Textbook. 2020. Available online: https://docs.tibco.com/data-science/textbook (accessed on 7 March 2021).
- Coronado, M.; Dosal, E.; Coz, A. Estimation of Construction and Demolition Waste (C&DW) Generation and Multicriteria Analysis of C&DW Management Alternatives: A Case Study in Spain. Waste Biomass Valor. 2011, 2, 209–225. [Google Scholar]
- Hanif, R.; Iqbal, Z.; Hanif, S.; Rasheed, M. Use of vegetables as nutritional food: Role in human health. J. Agric. Biol. Sci. 2006, 1, 18–22. [Google Scholar]
- Korzeniowska, A.; Niemirowicza-Szczytt, K.A. Comparison of ground varieties of tomato from different centers from Poland and abroad. Folia Hort. 2001, 13/1A, 297–302, (In Polish with English Summary). [Google Scholar]
- Machado, R.M.A.; Rosario, M.; Oliveira, G.; Portas, C.A.M. Tomato root distribution, yield, and fruit quality under subssurface irrigation. Plant Soil 2003, 255, 333–341. [Google Scholar] [CrossRef] [Green Version]
- Adams, S.; Cockshull, K.E.; Cave, C.R. Effect of temperature on the growth and developments of tomato fruits. Ann. Bot. 2001, 88, 439–447. [Google Scholar] [CrossRef]
- Ronga, D.; Caradonia, F.; Parisi, M.; Bezzi, G.; Parisi, B.; Allesisna, G.; Pedrazzi, S.; Francia, E. Using digestate and biochar as fertilizers to improve processing tomato production sustainability. Agronomy 2020, 10, 138. [Google Scholar] [CrossRef] [Green Version]
- Wang, X.; Xing, Y. Eval;uation of the effects of irrigation and fertilization on tomato fruit yield and quality: A principal component analysis. Sci. Rep. 2017, 7, 350. [Google Scholar] [CrossRef] [PubMed] [Green Version]
- Takacs, S.; Pek, Z.; Csanyi, D.; Daood, H.G.; Szuvandzsiev, P.; Palotas, G.; Helyes, L. Influence of water stress levels on the yield and lycopene content of tomato. Water 2020, 12, 2165. [Google Scholar] [CrossRef]
- Ronga, D.; Parisi, M.; Pentangelo, A.; Mori, M.; Di Mola, I. Effects of nitrogen management on biomass production and dry matter distribution of processing tomato cropped in Southern Italy. Agronomy 2019, 9, 855. [Google Scholar] [CrossRef] [Green Version]
- Scholberg, J.M.S.; McNeal, B.L.; Jones, J.W.; Boote, K.J. Nitrogen stress effects on growth and nitrogen accumulation by field-grown tomato. Agron. J. 2000, 92, 159–167. [Google Scholar] [CrossRef]
- Warner, J.; Zhang, T.Q.; Hao, X. Effects of nitrogen fertilization on fruit yield and quality of processing tomato. Can. J. Plant. Sci. 2004, 84, 865–871. [Google Scholar] [CrossRef]
- Panuccio, M.R.; Mallamaci, C.; Attina, E.; Muscolo, A. Using digestate as fertilizer for sustainable tomato cultivation. Sustainability 2021, 13, 1574. [Google Scholar] [CrossRef]
- Marles, R.J. Mineral nutrient composition of vegetables, fruits and grains: The context of reports of apparent historical declines. J. Food Comp. Anal. 2016, 56, 93–103. [Google Scholar] [CrossRef]
- De Luca, A.; Corell, M.; Chivet, M.; Parrado, M.A.; Pardo, J.M.; Leidi, E.O. Reassessing the role of potassium in tomato growth with water shortages. Horticulturae 2021, 7, 20. [Google Scholar] [CrossRef]
- Davis, D.R. Declinig fruits and vegetable nutrient composition: What is the evidence. Am. Soc. Hort. Sci. 2009, 44, 15–19. [Google Scholar]
- Cassity-Duffey, K.; Cabrere, M.; Gaskin, J.; Franklin, D.; Kissel, D.; Saha, U. Nitrogen mineralization from organic materials and fertilizers: Predicting N release. Soil Sci. Soc. Am. J. 2020, 84, 522–533. [Google Scholar] [CrossRef]
- Nieder, R.; Benbi, D.K.; Scherer, H.W. Fixation and defixation of ammonium in soil: A review. Biol. Fertil. Soils 2011, 47, 1–14. [Google Scholar] [CrossRef] [Green Version]
- Serio, F.; Leo, L.; Parente, A.; Santamaria, P. Potassium nutrition increases the lycopene content of tomato fruit. J. Hort. Sci. Biotech. 2007, 82, 941–945. [Google Scholar] [CrossRef]
- Lošák, T.; Válka, T.; Elbl, J.; Kintl, A.; Keutgen, A.; Keutgen, N.; Demková, L.; Árvay, J.; Varga, L.; Hnátkova, H.; et al. Fertilization with magnesium- and sulfur-supplemented digestate increase the yield and quality of kolhlrabi. Sustainability 2020, 12, 5733. [Google Scholar] [CrossRef]
- Huang, X.; Duan, S.; Wu, Q.; Yu, M.; Shabal, S. Reducing cadmium accumulation in plants: Structure-function relations and tissue-specific operation of transporters in the spotlight. Plants 2020, 9, 223. [Google Scholar] [CrossRef] [Green Version]


| Year | pH1 | P 2 | K 2 | Mg 2 | Ca 2 | NO3-N 4 | NH4-N 4 | Nmin 5 |
|---|---|---|---|---|---|---|---|---|
| mg kg−1 | kg ha−1 | |||||||
| 2016 | 5.4 | 440 VH3 | 230 G | 200 H | 2800 G | 28 | 6 | 34 |
| 2017 | 5.5 | 409 VH | 280 G | 222 H | 2650 G | 24 | 14 | 38 |
| 2018 | 5.6 | 390 VH | 260 G | 266 H | 2550 G | 24 | 10 | 34 |
| Year | Fe 1 | Mn 1 | Zn 1 | Cu 1 | Pb 1 | Cd 1 |
|---|---|---|---|---|---|---|
| mg kg−1 | ||||||
| 2016 | 370 G | 86 G | 44 H | 2.8 G | 7.1 | 0.12 |
| 2017 | 340 G | 92 G | 40 H | 3.2 G | 6.9 | 0.10 |
| 2018 | 330 G | 77 G | 42 H | 3.0 G | 6.5 | 0.09 |
| Years/Months | May | June | July | August | September |
|---|---|---|---|---|---|
| 2016 | 15.71/32.62 | 18.8/71.5 | 19.3/102.9 | 18.0/25.4 | 17.5/3.2 |
| 2017 | 15.2/49.9 | 18.3/86.1 | 18.4/164.2 | 19.6/109.9 | 13.8/23.9 |
| 2018 | 19.0/30,9 | 19.3/49.9 | 20.8/97.2 | 21.5/11.0 | 16.0/45.4 |
| 1961–2018 | 13.7/44 | 17.1/56 | 18.8/74 | 18.5/63 | 13.4/38 |
| Nutrients | Bio-Fertilizers | ||
|---|---|---|---|
| A (D = 25%) | B (D = 75%) | C (D = 45%) | |
| kg t−1 | kg t−1 | kg t−1 | |
| Nt | 7.68 | 15.83 | 33.34 |
| NH4-N | 1.05 | 3.15 | 1.89 |
| P | 12.20 | 6.86 | 34.09 |
| S | 49.75 | 0.00 | 49.75 |
| K | 35.52 | 58.49 | 42.69 |
| Ca | 107.09 | 41.62 | 93.74 |
| Mg | 15.41 | 8.81 | 9.50 |
| Na | 5.55 | 8.87 | 9.98 |
| Zn | 0.253 | 0.149 | 0.229 |
| Cu | 0.053 | 0.031 | 0.059 |
| Mn | 1.78 | 0.711 | 0.98 |
| Fe | 12.47 | 5.58 | 6.62 |
| C:Nt | 14.2 | 20.9 | 5.9 |
| Bio-Fertilizer Type | Rate of Applied Bio-Fertilizer, Kg ha−1 | |||
|---|---|---|---|---|
| 200 | 400 | 800 | 1600 | |
| A | 1.5 | 3.1 | 6.1 | 12.3 |
| B | 3.2 | 6.3 | 12.6 | 25.3 |
| C | 6.7 | 13.3 | 26.7 | 53.3 |
| Fertilizer/F Ratio | Rate Kg ha−1 | TFW g | CFW G | TFN No. m2 | CFN No. m2 |
|---|---|---|---|---|---|
| AC | 160.1 ± 4.72 | 170.5 ± 5.74 | 71.9 ± 8.76ab | 47.5 ± 7.20 | |
| MC | 166.4 ± 6.61 | 172.8 ± 4.90 | 85.5 ± 8.76 a | 56.0 ± 7.21 | |
| A | 200 | 160.9 ± 3.90 | 172.6 ± 4.53 | 70.8 ± 9.05 ab | 47.1 ± 7.49 |
| 400 | 170.6 ± 5.32 | 176.7 ± 5.18 | 81.1 ± 10.41 ab | 57.5 ± 8.21 | |
| 800 | 155.5 ± 7.57 | 168.8 ± 3.69 | 84.1 ± 10.14 ab | 56.8 ± 8.02 | |
| 1600 | 170.1 ± 5.47 | 171.6 ± 5.92 | 76.8 ± 11.20 ab | 53.7 ± 8.99 | |
| B | 200 | 161.3 ± 5.22 | 169.4 ± 4.93 | 64.4 ± 9.30 b | 45.1 ± 7.01 |
| 400 | 162.5 ± 3.78 | 167.6 ± 4.08 | 67.7 ± 8.10 ab | 44.8 ± 6.50 | |
| 800 | 167.7 ± 8.02 | 172.5 ± 9.52 | 69.5 ± 8.49 ab | 48.4 ± 6.68 | |
| 1600 | 164.8 ± 5.70 | 172.0 ± 5.22 | 74.7 ± 9.90 ab | 51.5 ± 7.54 | |
| C | 200 | 169.1 ± 5.90 | 179.5 ± 7.44 | 75.8 ± 10.28 ab | 52.2 ± 7.83 |
| 400 | 156.5 ± 4.39 | 161.5 ± 4.60 | 77.7 ± 9.89 ab | 53.7 ± 7.79 | |
| 800 | 164.9 ± 4.96 | 171.2 ± 5.96 | 73.1 ± 11.28 ab | 52.1 ± 8.69 | |
| 1600 | 162.9 ± 6.24 | 173.9 ± 6.30 | 70.6 ± 9.57 ab | 48.7 ± 7.14 | |
| F13,84 | n.s. | n.s. | 1.87 * | n.s. |
| Fertilizer/F Ratio | Rate, kg ha−1 | EX g kg−1 FM | TS g kg−1 FM | CRD mg kg−1 FM | LCP mg kg−1 FM | DM g kg−1 FM |
|---|---|---|---|---|---|---|
| AC | 44.9 ± 0.45 ab | 33.5 ± 0.88 ab | 317.8 ± 9.5 b | 226.4 ± 7.2 bc | 58.2 ± 0.84 c | |
| MC | 44.9 ± 0.58 ab | 37.2 ± 1.34 a | 371.0 ± 12.0 ab | 252.5 ± 11.4 abc | 61.4 ± 0.39 abc | |
| A | 200 | 44.7 ± 0.39 ab | 34.5 ± 1.06 ab | 411.4 ± 30.5 a | 299.0 ± 16.8 a | 62.1 ± 0.82 abc |
| 400 | 44.1 ± 0.36 b | 34.4 ± 1.04 ab | 315.0 ± 21.4 b | 234.2 ± 13.6 bc | 58.9 ± 0.68 bc | |
| 800 | 44.6 ± 0.45 ab | 32.0 ± 2.34 ab | 317.8 ± 11.0 b | 232.5 ± 7.8 bc | 60.2 ± 0.83 abc | |
| 1600 | 44.4 ± 0.29 b | 32.2 ± 0.91 ab | 386.2 ± 25.2 ab | 258.7 ± 17.4 abc | 60.1 ± 0.64 abc | |
| B | 200 | 46.0 ± 0.24 ab | 35.2 ± 0.56 ab | 349.0 ± 20.5 ab | 232.5 ± 15.2bc | 62.1 ± 0.50 abc |
| 400 | 44.8 ± 0.33 ab | 34.6 ± 0.29 ab | 333.1 ± 11.6 ab | 241.0 ± 3.7 abc | 62.1 ± 0.59 abc | |
| 800 | 45.4 ± 0.64 ab | 35.6 ± 1.50 ab | 321.8 ± 13.1 b | 218.8 ± 6.9 c | 63.6 ± 0.35 ab | |
| 1600 | 44.4 ± 0.17 b | 30.0 ± 1.57 b | 358.4 ± 17.0 ab | 246.0 ± 5.5 abc | 63.9 ± 0.55 a | |
| C | 200 | 45.5 ± 0.44 ab | 35.8 ± 0.72 ab | 411.4 ± 11.8 a | 282.5 ± 12.0 ab | 62.2 ± 0.55 abc |
| 400 | 44.6 ± 0.26 ab | 34.2 ± 1.11 ab | 372.3 ± 11.5 ab | 262.7 ± 9.0 abc | 63.3 ± 1.89 abc | |
| 800 | 46.4 ± 0.44 a | 38.0 ± 0.92 a | 398.5 ± 10.4 ab | 272.7 ± 11.1 abc | 64.5 ± 2.08 abc | |
| 1600 | 45.3 ± 0.30 ab | 35.9 ± 0.97 ab | 335.5 ± 20.2 ab | 235.5 ± 12.9 bc | 62.6 ± 0.63 abc | |
| F13,84 | 2.70 ** | 2.67 ** | 4.14 *** | 3.39 *** | 3.23 *** |
| Fertilizer/F Ratio | Rate kg ha−1 | N | P | K | Mg | S | Na |
|---|---|---|---|---|---|---|---|
| AC | 32.2 ± 1.2 abc | 0.36 ± 0.03 | 37.4 ± 2.7 c | 2.05 ± 0.14 | 0.62 ± 0.06 | 0.35 ± 0.04 | |
| MC | 30.7 ± 0.7 bcd | 0.40 ± 0.01 | 40.7 ± 2.6 ab | 2.15 ± 0.07 | 0.69 ± 0.06 | 0.44 ± 0.06 | |
| A | 200 | 27.8 ± 0.7 d | 0.43 ± 0.01 | 39.9 ± 1.9 ab | 2.14 ± 0.07 | 0.67 ± 0.05 | 0.46 ± 0.06 |
| 400 | 31.9 ± 1.0 bc | 0.46 ± 0.02 | 38.5 ± 2.8 bc | 2.21 ± 0.05 | 0.66 ± 0.05 | 0.41 ± 0.04 | |
| 800 | 32.5 ± 0.6 abc | 0.40 ± 0.01 | 41.4 ± 1.9 a | 2.26 ± 0.05 | 0.62 ± 0.06 | 0.43 ± 0.05 | |
| 1600 | 32.3 ± 1.3 abc | 0.38 ± 0.03 | 41.5 ± 1.8 a | 2.30 ± 0.04 | 0.70 ± 0.05 | 0.43 ± 0.05 | |
| B | 200 | 31.3 ± 1.2 bcd | 0.43 ± 0.03 | 39.5 ± 2.8 abc | 2.25 ± 0.05 | 0.73 ± 0.05 | 0.44 ± 0.04 |
| 400 | 30.7 ± 0.5 cd | 0.44 ± 0.01 | 40.4 ± 2.3 ab | 2.18 ± 0.06 | 0.72 ± 0.05 | 0.40 ± 0.04 | |
| 800 | 32.3 ± 0.5 abc | 0.38 ± 0.02 | 40.2 ± 2.3 ab | 2.26 ± 0.05 | 0.67 ± 0.06 | 0.41 ± 0.04 | |
| 1600 | 34.6 ± 0.6 abc | 0.50 ± 0.06 | 40.9 ± 2.4 ab | 2.25 ± 0.04 | 0.69 ± 0.07 | 0.41 ± 0.03 | |
| C | 200 | 34.8 ± 1.0 ab | 0.43 ± 0.01 | 40.5 ± 2.7 ab | 2.19 ± 0.11 | 0.75 ± 0.18 | 0.42 ± 0.03 |
| 400 | 32.6 ± 1.0 abc | 0.44 ± 0.06 | 41.1 ± 2.2 a | 2.14 ± 0.06 | 0.74 ± 0.07 | 0.38 ± 0.05 | |
| 800 | 36.3 ± 0.8 a | 0.44 ± 0.01 | 41.3 ± 2.4 a | 2.27 ± 0.05 | 0.70 ± 0.08 | 0.46 ± 0.04 | |
| 1600 | 32.5 ± 1.2 abc | 0.46 ± 0.01 | 40.8 ± 2.5 ab | 2.30 ± 0.07 | 0.73 ± 0.06 | 0.42 ± 0.04 | |
| F13,84 | 5.91 *** | n.s. | 5.56 *** | n.s. | n.s. | n.s. |
| Fertilizer/F Ratio | Rate, kg ha−1 | Zn | Cu | Mn | Fe | Pb | Cd |
|---|---|---|---|---|---|---|---|
| Control | 1.90 ± 0.11 | 0.79 ± 0.06 | 1.60 ± 0.10 | 5.52 ± 0.83 | 0.49 ± 0.15 | 0.029 ± 0.002 | |
| YaraMila | 1.97 ± 0.10 | 0.79 ± 0.03 | 1.67 ± 0.09 | 5.18 ± 0.45 | 0.31 ± 0.08 | 0.026 ± 0.002 | |
| A | 200 | 2.12 ± 0.08 | 0.87 ± 0.05 | 1.75 ± 0.09 | 5.77 ± 0.39 | 0.37 ± 0.09 | 0.028 ± 0.002 |
| 400 | 1.97 ± 0.08 | 0.83 ± 0.03 | 1.65 ± 0.09 | 5.28 ± 0.31 | 0.37 ± 0.11 | 0.027 ± 0.002 | |
| 800 | 2.04 ± 0.10 | 0.86 ± 0.03 | 1.76 ± 0.08 | 5.61 ± 0.50 | 0.35 ± 0.11 | 0.027 ± 0.001 | |
| 1600 | 2.07 ± 0.08 | 0.87 ± 0.03 | 1.73 ± 0.11 | 5.93 ± 0.53 | 0.28 ± 0.04 | 0.028 ± 0.002 | |
| B | 200 | 2.03 ± 0.08 | 0.88 ± 0.04 | 1.71 ± 0.08 | 5.51 ± 0.39 | 0.61 ± 0.26 | 0.026 ± 0.001 |
| 400 | 1.99 ± 0.11 | 0.89 ± 0.10 | 1.68 ± 0.08 | 5.61 ± 0.37 | 0.46 ± 0.23 | 0.027 ± 0.001 | |
| 800 | 2.03 ± 0.11 | 0.87 ± 0.05 | 1.79 ± 0.10 | 6.35 ± 0.55 | 0.72 ± 0.48 | 0.027 ± 0.003 | |
| 1600 | 1.99 ± 0.10 | 0.92 ± 0.04 | 1.61 ± 0.06 | 5.88 ± 0.76 | 0.37 ± 0.09 | 0.028 ± 0.001 | |
| C | 200 | 1.98 ± 0.14 | 0.76 ± 0.04 | 1.96 ± 0.20 | 5.92 ± 0.29 | 0.24 ± 0.04 | 0.025 ± 0.003 |
| 400 | 1.76 ± 0.18 | 0.67 ± 0.06 | 1.66 ± 0.12 | 5.65 ± 0.59 | 0.23 ± 0.03 | 0.026 ± 0.003 | |
| 800 | 2.71 ± 0.24 | 0.87 ± 0.06 | 2.89 ± 0.28 | 6.63 ± 0.71 | 0.51 ± 0.24 | 0.032 ± 0.003 | |
| 1600 | 1.97 ± 0.10 | 0.85 ± 0.02 | 1.73 ± 0.06 | 6.49 ± 0.90 | 0.36 ± 0.10 | 0.028 ± 0.002 | |
| F13,84 | n.s. | n.s. | n.s. | n.s. | n.s. | n.s. |
| Year | Yield Category | Absolute Control | Mineral Control | Bio-Fertilizer |
|---|---|---|---|---|
| 2016 | Total | 349 | 469 | 402 |
| Commercial | 268 | 387 | 312 | |
| 2017 | Total | 385 | 450 | 397 |
| Commercial | 278 | 308 | 288 | |
| 2018 | Total | 397 | 493 | 387 |
| Commercial | 226 | 252 | 252 |
Publisher’s Note: MDPI stays neutral with regard to jurisdictional claims in published maps and institutional affiliations. |
© 2021 by the authors. Licensee MDPI, Basel, Switzerland. This article is an open access article distributed under the terms and conditions of the Creative Commons Attribution (CC BY) license (https://creativecommons.org/licenses/by/4.0/).
Share and Cite
Przygocka-Cyna, K.; Barłóg, P.; Spiżewski, T.; Grzebisz, W. Bio-Fertilizers Based on Digestate and Biomass Ash as an Alternative to Commercial Fertilizers—The Case of Tomato. Agronomy 2021, 11, 1716. https://doi.org/10.3390/agronomy11091716
Przygocka-Cyna K, Barłóg P, Spiżewski T, Grzebisz W. Bio-Fertilizers Based on Digestate and Biomass Ash as an Alternative to Commercial Fertilizers—The Case of Tomato. Agronomy. 2021; 11(9):1716. https://doi.org/10.3390/agronomy11091716
Chicago/Turabian StylePrzygocka-Cyna, Katarzyna, Przemysław Barłóg, Tomasz Spiżewski, and Witold Grzebisz. 2021. "Bio-Fertilizers Based on Digestate and Biomass Ash as an Alternative to Commercial Fertilizers—The Case of Tomato" Agronomy 11, no. 9: 1716. https://doi.org/10.3390/agronomy11091716
APA StylePrzygocka-Cyna, K., Barłóg, P., Spiżewski, T., & Grzebisz, W. (2021). Bio-Fertilizers Based on Digestate and Biomass Ash as an Alternative to Commercial Fertilizers—The Case of Tomato. Agronomy, 11(9), 1716. https://doi.org/10.3390/agronomy11091716