Article

Genome-Wide Association Mapping for Stomata and Yield Indices in Bread Wheat under Water Limited Conditions

1
Department of Plant Breeding and Genetics, Faculty of Agriculture and Environment, The Islamia University of Bahawalpur, Bahawalpur 63100, Pakistan
2
Rural Health Center Sardar Pur Kabirwala, Khanewal 58150, Pakistan
3
DHQ Hospital Muzaffargarh, Muzaffargarh 34200, Pakistan
4
Biotechnology and Germplasm Resources Institute, Yunnan Academy of Agricultural Sciences, Kunming 650205, China
5
Department of Plant Breeding and Genetics, Faculty of Agriculture, University of Sargodha, Sargodha 40100, Pakistan
6
Nuclear Institute for Agriculture and Biology (NIAB), Faisalabad 38000, Pakistan
7
Soil and Water Testing Laboratory, Khanewal 58150, Pakistan
8
Department of Agronomy, University of Agriculture, Faisalabad 38040, Pakistan
*
Authors to whom correspondence should be addressed.
Agronomy 2021, 11(8), 1646; https://doi.org/10.3390/agronomy11081646
Submission received: 7 July 2021 / Revised: 12 August 2021 / Accepted: 16 August 2021 / Published: 18 August 2021
(This article belongs to the Special Issue Wheat Agronomic and Quality Responses to Environmental Impacts)

Abstract

:
Genome-wide association study (GWAS) was performed for stomata- and yield-related attributes with high-density Illumina 90 K Infinium SNP (single nucleotide polymorphism) array in bread wheat to determine genetic potential of germplasm for scarce water resources with sustainable yield potential. Major yield and stomata attributes were phenotyped on a panel of Pakistani and foreign accessions grown in non-stressed and water shortage environments during two seasons. Highly significant variations were shown among accessions in both conditions for examined characteristics. Water shortage conditions reduced the overall wheat yield and strong positive correlation existed among stomatal frequency, leaf venation and grain yield per plant. Population structure analyses based on 90,000 SNP data classified the accessions into four sub-populations which indicated the presence of genetic variability. Marker-trait association (MTA) analyses revealed that 422 significant SNPs at p ≤ 10−3, after crossing the false discovery rate (FDR) <0.05 threshold, were linked with examined attributes. Pleiotropic loci (wsnp_Ex_c8913_14881924 and Tdurum_contig10598_304) were associated with flag leaf area (FLA), stomata size (SS), stomata frequency (SF), leaf venation (LV), number of grain per spike (NGS) and grain yield per plant (GYP), which were located on chromosome 4B and 6B at the positions 173.63cM and 229.64cM, respectively, under water shortage conditions. Pleotropic loci wsnp_Ex_c24167_33416760, wsnp_Ex_c5412_9564046 and Tdurum_contig81797_369 on chromosomes 7A, 2A and 4B at the positions 148.26cM, 261.05cM and 173.63cM, respectively, were significantly linked with stomata and yield indices such as FLA, SS, SF, LV, NGS and GYP under normal and water shortage conditions. The current experiment not only validated several MTAs for studied indices reported in other studies but also discovered novel MTAs significant under water shortage environments. Associated and significant SNPs will be useful in discovering novel genes underpinning water shortage tolerance in bread wheat for producing high-yielding and drought tolerant wheat varieties to fulfill the wheat demand for growing populations.

1. Introduction

Bread wheat (Triticum aestivum L.) is one of the earliest cereals ever domesticated and is currently one of the major sources of food and feed in the world. Wheat is adapted to diverse climatic zones including drought prone areas [1]. Changes in global climate and expansion of wheat production to less optimum production zones are causing severe crop losses annually. Water stress is one of the grand challenges limiting crop growth and productivity in various parts of the world [2]. The characteristics of the plants that result in the increase of their abilities to tolerate the physiological processes can result in the increase in their development and yields. Confirming sustainable wheat yield to accomplish the requirements of a growing population under continuous variation in climate is a remarkable problem for wheat scientists and growers [3]. Therefore, wheat needs more advancement with biotic and abiotic stress tolerance. The demand of wheat is rising with the constantly growing human population and it is predicted to increase up to 40% by 2030. Therefore, there is an urgent requirement to escalate wheat yield to settle sustainable food security [4,5]. Wheat crop ranks first among other cereal crops due to its nutritional importance and more uses. The prompt growth in population and healthier ways of life have made new tasks for wheat breeders to produce new wheat genotypes with higher yield, good quality and resistance to biotic and abiotic stresses [6].
Wheat actual yield is not in accordance with its potential due to certain restriction factors, one of which is water shortage, primarily due to irregular patterns of rainfall [7]. It was reported that yield losses in wheat are 17–70% due to a shortage of water. Water shortage is the main problem of wheat yield loss. Due to this problem, the efficiency of translocation of photosynthetic activity is affected, and ultimately wheat grain weight and total yield is reduced [8]. Another study reported a 50–90% yield reduction under water shortage environments as compared to its well-watered potential in several regions of the world. The wheat plant undergoes a severe reaction to water shortage stress at the tillering, jointing, booting, anthesis and grain filling stages. The tillering phase in wheat is a crucial phase in which the plant produces tillers, spike primordia, spikelet, and floret. Water shortage environment in this stage can decrease total wheat yield by 46% [6].
Water shortage stress is a complex mechanism because it depends on several factors, for example, species of crop, intensity of water shortage, water shortage duration, and plant growth stages [9]. To create water shortage tolerant varieties, it is imperative to know the mechanisms and behavior of plants under water shortage conditions. To survive, plants in a water shortage environment can adopt more than one tolerance mechanism. In that regard there are three basic phenomena in which a plant can compete with water shortage stress: (1) escape mechanisms, (2) avoidance mechanisms, and (3) tolerance mechanisms [10,11]. In the first phenomena, a plant completes its life cycle earlier in response to water shortage stress. In the second phenomena, plants compete parallel with water shortage stress, e.g., by the closing of stomata and/or decreasing transpiration rate. In the third phenomena, a plant proceeds phases against water shortage stress by increasing the pigmentation of photosynthates and retaining the ratio of root/shoot to efficiently partition the overall assimilate [12,13]. Although breeding progress for improvement in wheat has been attained for normal water environments, much less success has been had for water shortage environments.
Due to climate change, the frequency and severity of drought stress will significantly increase in the future and pose a threat to the food security of the rapidly increasing world population [14]. Crop productivity in dry areas can be improved through appropriate exploitation of available genetic variability of crop plants to better adapt to climate change [15]. Drought-related plant traits including leaf venation, stomata size and stomatal frequency are important to select for developing drought resistant varieties/lines [16]. To identify the ploidy level of different species of plants, the frequency and the size of the stomata have been utilized as the morphological markers. Scientists observed that there was enough variation in frequency of the stomata among the ploidy levels for the leaves in Aegilops neglecta Req.ex Bertol. and Triticum, respectively, but it was reported that the frequency and the size of the stomata are associated with each other negatively [17]. The problem is more acute under water shortage conditions, and the production differences are large among the maximum production regions and dryland farming regions. Scientists proposed that the larger frequency of the stomata, along with the pathways of photosynthesis, are interconnected with the larger proficiency of use of water in plants that have C4 pathway than the plants that have C3 pathway. The mechanisms of drought tolerance are very complicated, therefore enhancing drought tolerance selection for productivity must be utilized together with all the unidentified factors that are necessary for the increasing drought tolerance [13].
Approaches to decrease this gap include the advancement of genetics for water shortage environments by recognizing causes of water shortage tolerance and subsequent introgression of genes for associated specific characteristics to domesticated wheat genotypes. The challenges to the application of such approaches in breeding schemes are the knowledge of the desired characteristics in a time-efficient and cost-effective manner in water shortage environments [18]. A higher number of veins per unit leaf area will increase leaf area, therefore greater flag leaf area played an important role in yield increase under normal as well as water stress conditions. Stomata play an important role in regulating drought condition, as gaseous exchange and transpiration rate depends upon the size of stomata aperture and its number per unit leaf area. A lower number and smaller sized stomata can help the plant to use available water more efficiently [17,19]. Similarly, stomata size and frequency also help the plant to stand well, even under shortage of water. Denser leaf venation helps plants to survive under a shortage of water by adequately consuming available moisture, thus maintaining yield [16]. Similarly, stomatal size and number of stomata also contribute to adequate water consumption, thus, these traits can be selected for when developing normal and drought resistant wheat varieties Producing maximum yield and water shortage tolerant genotypes has been a slow process, since yield and water shortage tolerance-related genes are complex and polygenic in nature. Several methods have been considered for selecting bread wheat varieties for water shortage conditions. The choice of wheat genotypes on the basis of these drought-related traits is informal, inexpensive, and less protracted [5,20].
Understanding drought tolerance mechanisms and identifying loci responsible for mediating drought tolerance are key steps for any breeding approach aimed at increasing stress tolerance induced by water deficiency in bread wheat [13,21]. Several efforts have been made by applying conventional breeding approaches to enhance wheat production under water shortage stress, but these strategies have contributed no more than a 1% increase in annual production [22,23,24]. As time goes on, wheat breeding systems will depend upon discovering genetic and molecular potential of heat and water shortage tolerance using QTLs (quantitative trait loci) and Association Mapping (AM) studies. Genome-wide association mapping studies (GWAS) with genotypic and phenotypic data of association panels has been proved to be a robust method to detect QTLs linked with target attributes [25]. They permit the use of a different set of germplasms and make available wider genomic regions/allelic frequency with a maximum resolution, without any bi-parental mapping population [26]. GWAS explore the genetic basis of desired characteristics and their related genes. Genome-wide association mapping is a valuable technique with the best results due to contained maximum genetic diversity (GD) and favorable recombinant alleles among the relevant panel [27]. It is useful to identify the genomic parts linked with water shortage tolerance and yield-related indices in diverse association mapping panels. In the current experiment, a diverse panel of bread wheat accessions was genotyped with a 90,000 SNPs array, as well as phenotyped under normal and water shortage conditions for two cropping cycles in 2017–2018 and 2018–2019. Novel SNPs were found to be associated with key drought tolerance-related traits. Favorable alleles controlling grain yield and drought-related traits were of vital importance, and incorporation of these alleles after validation through marker assisted selection and fine mapping could be helpful in wheat yield improvement under stress and non-stress conditions.

2. Materials and Methods

2.1. Plant Material

A panel of 96 Pakistani and foreign bread wheat accessions preserved at the department of Plant Breeding and Genetics (PBG), Faculty of Agriculture and Environment, The Islamia University of Bahawalpur, Pakistan was used in this study. The detailed information about genotype code, origin, name, and pedigree record can be found in the Supplementary Materials Table S1. The association panel was sown in non-stressed and water shortage conditions in the research area of PBG in triplicates with a randomized complete block design in crop seasons of two consecutive years, 2017–2018 and 2018–2019. In the non-stressed experiment, irrigation was given at three critical stages; the first irrigation was applied at tillering stage (35 DAS (Days after sowing)), second irrigation was given at booting stage (85 DAS) and third irrigation was given at milking stage (112 DAS) [28]. In the present study, water stress was induced at tillering stage by skipping the irrigation. Each genotype was sown in a 1 m long experimental unit with 3 replicates maintaining a P × P distance of 15 cm and R × R distance of 30 cm. Only 2 seeds of each genotype were dibbled/hole and a healthy seedling was kept after germination by thinning. All other agronomic practices such as fertilizer applications, hoeing, weeding, etc., were applied homogeneously to reduce the experimental error in both conditions during both seasons.

2.2. Phenotyping

At maturity, data were recorded from ten plants from each replication for flag leaf area (FLA), stomata size (SS), stomata frequency (SF), leaf venation (LV), number of grain per spike (NGS) and grain yield per plant (GYP) under non-stressed and water shortage environments. Flag leaves of fully matured selected plants of each genotype were used to estimate the FLA. Maximum length and width of these leaves were measured in cm2 and FLA was calculated by using the formula: flag leaf area = flag leaf length × flag leaf width × 0.74 [29]. The number of stomata per unit area was measured from the top (upper) surface of the third leaf of each randomly selected plant. The leaf strips taken from the center of the leaf were immersed in Carnoy’s solution (10% acetic acid, 30% chloroform and 60% ethanol) to stop stomatal activities and remove chlorophyll from the leaf tissue [30]. After 48 h, the leaf strips were removed from the solution, peeled off with a razor, and inspected with a 40× microscope to determine the frequency of stoma in the tissue. Each leaf strip was observed and the average value was taken for analysis [16,19]. The same leaf strip was also used to measure the size of the stomata under the objective lens of a 10× microscope. For three stomata of each sample, the length and width of the stomata were measured randomly using a microscope eyepiece, and the length and width were multiplied by the microscopic normalized value of 3.33 μ by 10×, then the average mean values were scored. Using a micrometer, the length and width of the epidermal cells on the surface of the same flag leaf strip at 40× were measured [8,19]. Leaf veins were observed as the number of longitudinal veins entering the microscope field of view at 10×, which is the low magnification [8,16].

2.3. Statistical Analysis

Scored data were used for pooled analysis of variance (ANOVA) procedure applying the GenStat® Ver.17 [31] for studied attributes in non-stressed and water shortage environments. Broad-sense heritability was also calculated from recorded data average over years. Pearson’s Correlation coefficients (r) were calculated to accomplish the correlation between yield- and stomata-related characteristics using the SPSS ver.23 [32] in both environmental conditions. For ANOVA and correlation analysis significance levels, α = 0.01 was used for highly significant effects and α = 0.05 was used for significant effects. The broad-sense heritability for each trait under individual stress treatment was calculated using the following equation [33]
H 2 = σ g 2 / σ g 2 + σ g × e 2 n y + σ e 2 n y × n r
where H 2 is the broad-sense heritability, σ g 2 is genotypic variances, σ g × e 2 is variance for genotype and environment interaction, n y is the number of years and n r is the number of replications.

2.4. Genotyping of Bread Wheat Genotypes

Each genotype was sown in polyethene bags. The fresh leaf of 15-day wheat seedlings was used for DNA extraction according to the CIMMYT Molecular Genetics Manual procedure [34]. The DNA of each genotype (70–100 ng/μL) was preserved in 96-well plates and sent for genotyping to CapitalBio® at Beijing in China with high-density Illumina 90 K Infinium SNP array [35]. The genome-wide positions of SNPs in terms of genetic distance (cM) situated on chromosomes founded on a consensus genetic map of bread wheat in 2015 were used in the current experiment [35]. During data analysis, monomorphic SNPs, more than 20% missing SNPs, minor alleles and allelic frequency <5%, were excluded in this study.

2.5. Population Structure

Bayesian clustering procedure was used with SNPs to categorize clusters of genetically similar genotypes through the statistical analysis through STRUCTURE v.2.3. Burn-in iterations of 104 cycles and admixture model selection was applied. An ad-hoc method based on the online tool “Structure Harvester v0.6.93” was practiced [36] to attain high value or peak of “K” for authentication to know the STRUCTURE outcomes. We choose the K value range from one to ten and performed six independent runs to achieve reliable effects.

2.6. GWAS Analysis

GAPIT (Genome Association and Prediction Integrated Tool) was practiced with modal selections preference to check the dependability of the outcomes [37]. It is an R package that performs a genome-wide association study and genome prediction. It implements unconventional statistical methods including compressed mixed linear modal (CMLM) and CMLM-based genomics prediction selections and determines the false discovery rate (FDR) [37,38]. The threshold for describing a marker to be significant (p-values) was measured at 10−3 or above [25,33]. The significance level for p-values were measured after Bonferroni adjustment (p = 1/n, n = total number of SNPs) after crossing the FDR <0.05 threshold [39]. To determine the relevance of the applied model for GWAS, quantile-quantile (QQ) plot was derived among the observed and expected log10(p) value. To describe the unclear correlation obtained from population structures, covariates from STRUCTURE [40] were measured as fixed effects and using the principal components through GAPIT [37,41]. The mysterious associations among genotypes were estimated using a kinship matrix in the incorporated MLM [42]. Overall, 33,210 of the functional iSelects beads chip analyses visually exhibited polymorphisms and were detected on the available genetic map [35] in the genotypes being studied.

3. Results

3.1. Phenotypic Evaluation

In the present study, analysis of variances (ANOVA) for 96 bread wheat accessions showed significant influence on phenotypic variation (p < 0.01). All traits showed significant effects among studied accessions as exhibited in Table 1. Descriptive statistics data of observed characteristics in non-stressed and water shortage environments based on average data over years are presented in Table 2. Broad-sense heritability of the studied indices was calculated and is given in Supplementary Materials Table S2. The highest heritability was observed for FLA with values of H2 = 73.512 and H2 = 81.19 under normal and water shortage environments, respectively (Table 2). Flag leaf Area (FLA) and stomata size (SS) had mean values of 33.2 cm2 and 3699 µm2 under normal environments, while in water shortage environments the values were 18.2 cm2 and 3480 µm2, respectively. Stomata frequency (SF) and leaf venation (LV) exhibited mean performance of 13.25 and 7.81 under normal environments, and 12.7 and 7.54 under water shortage environment, respectively. The average value of grain yield per plant was 22.50 g and 15.4 g under non-stressed and stressed environments, respectively. Pearson’s Correlation coefficient of the studied attributes based on data averaged over years under normal and water shortage environments are mentioned in Table 3. Stomata size (SS) was negatively associated with all studied traits in non-stressed and water shortage conditions. The SF was positively correlated with LV, NGS and GYP under all studied conditions. Water shortage tolerance-related characteristics such as FLA and NGS were strongly and positively linked among themselves, while a negative correlation with stomata size under both environments was observed Table 1. The yield-related traits such as FLA, LV, SF, NGS and GYP exhibited positive correlation with each other in non-stressed and water shortage conditions.

3.2. Population Structure

The results from the structure harvester displayed that the uppermost peak at K = 4 depended on the rates of changes in the log probabilities of the data among successive K-values (Supplementary Figure S1) that were found on the second order derivation on the variance of the maximum probability of the model to give a specific K. Delta K exhibits only the highest clustering level and number of sub-populations in main populations. Results from STRUCTURE analysis (Supplementary Figure S2) exhibited that a total of 12 accessions (genotype 1 to genotype 10, genotype 27 to genotype 28) were included in the first group. In the second group, a total of 14 genotypes (genotype 11 to genotype 22, genotype 29 to genotype 30) were recorded. The third group included a total of 39 genotypes from genotype 34 to genotype 72. Three genotypes from genotype 31 to genotype 33 exhibited mixed genetic material from above-mentioned (2nd and 3rd) groups. The 4th group contained a total of 17 genotypes from genotype 73 to genotype 89. A total of 6 accessions from genotype 90 to genotype 96 revealed the collective genetic material from the third and fourth group [3].

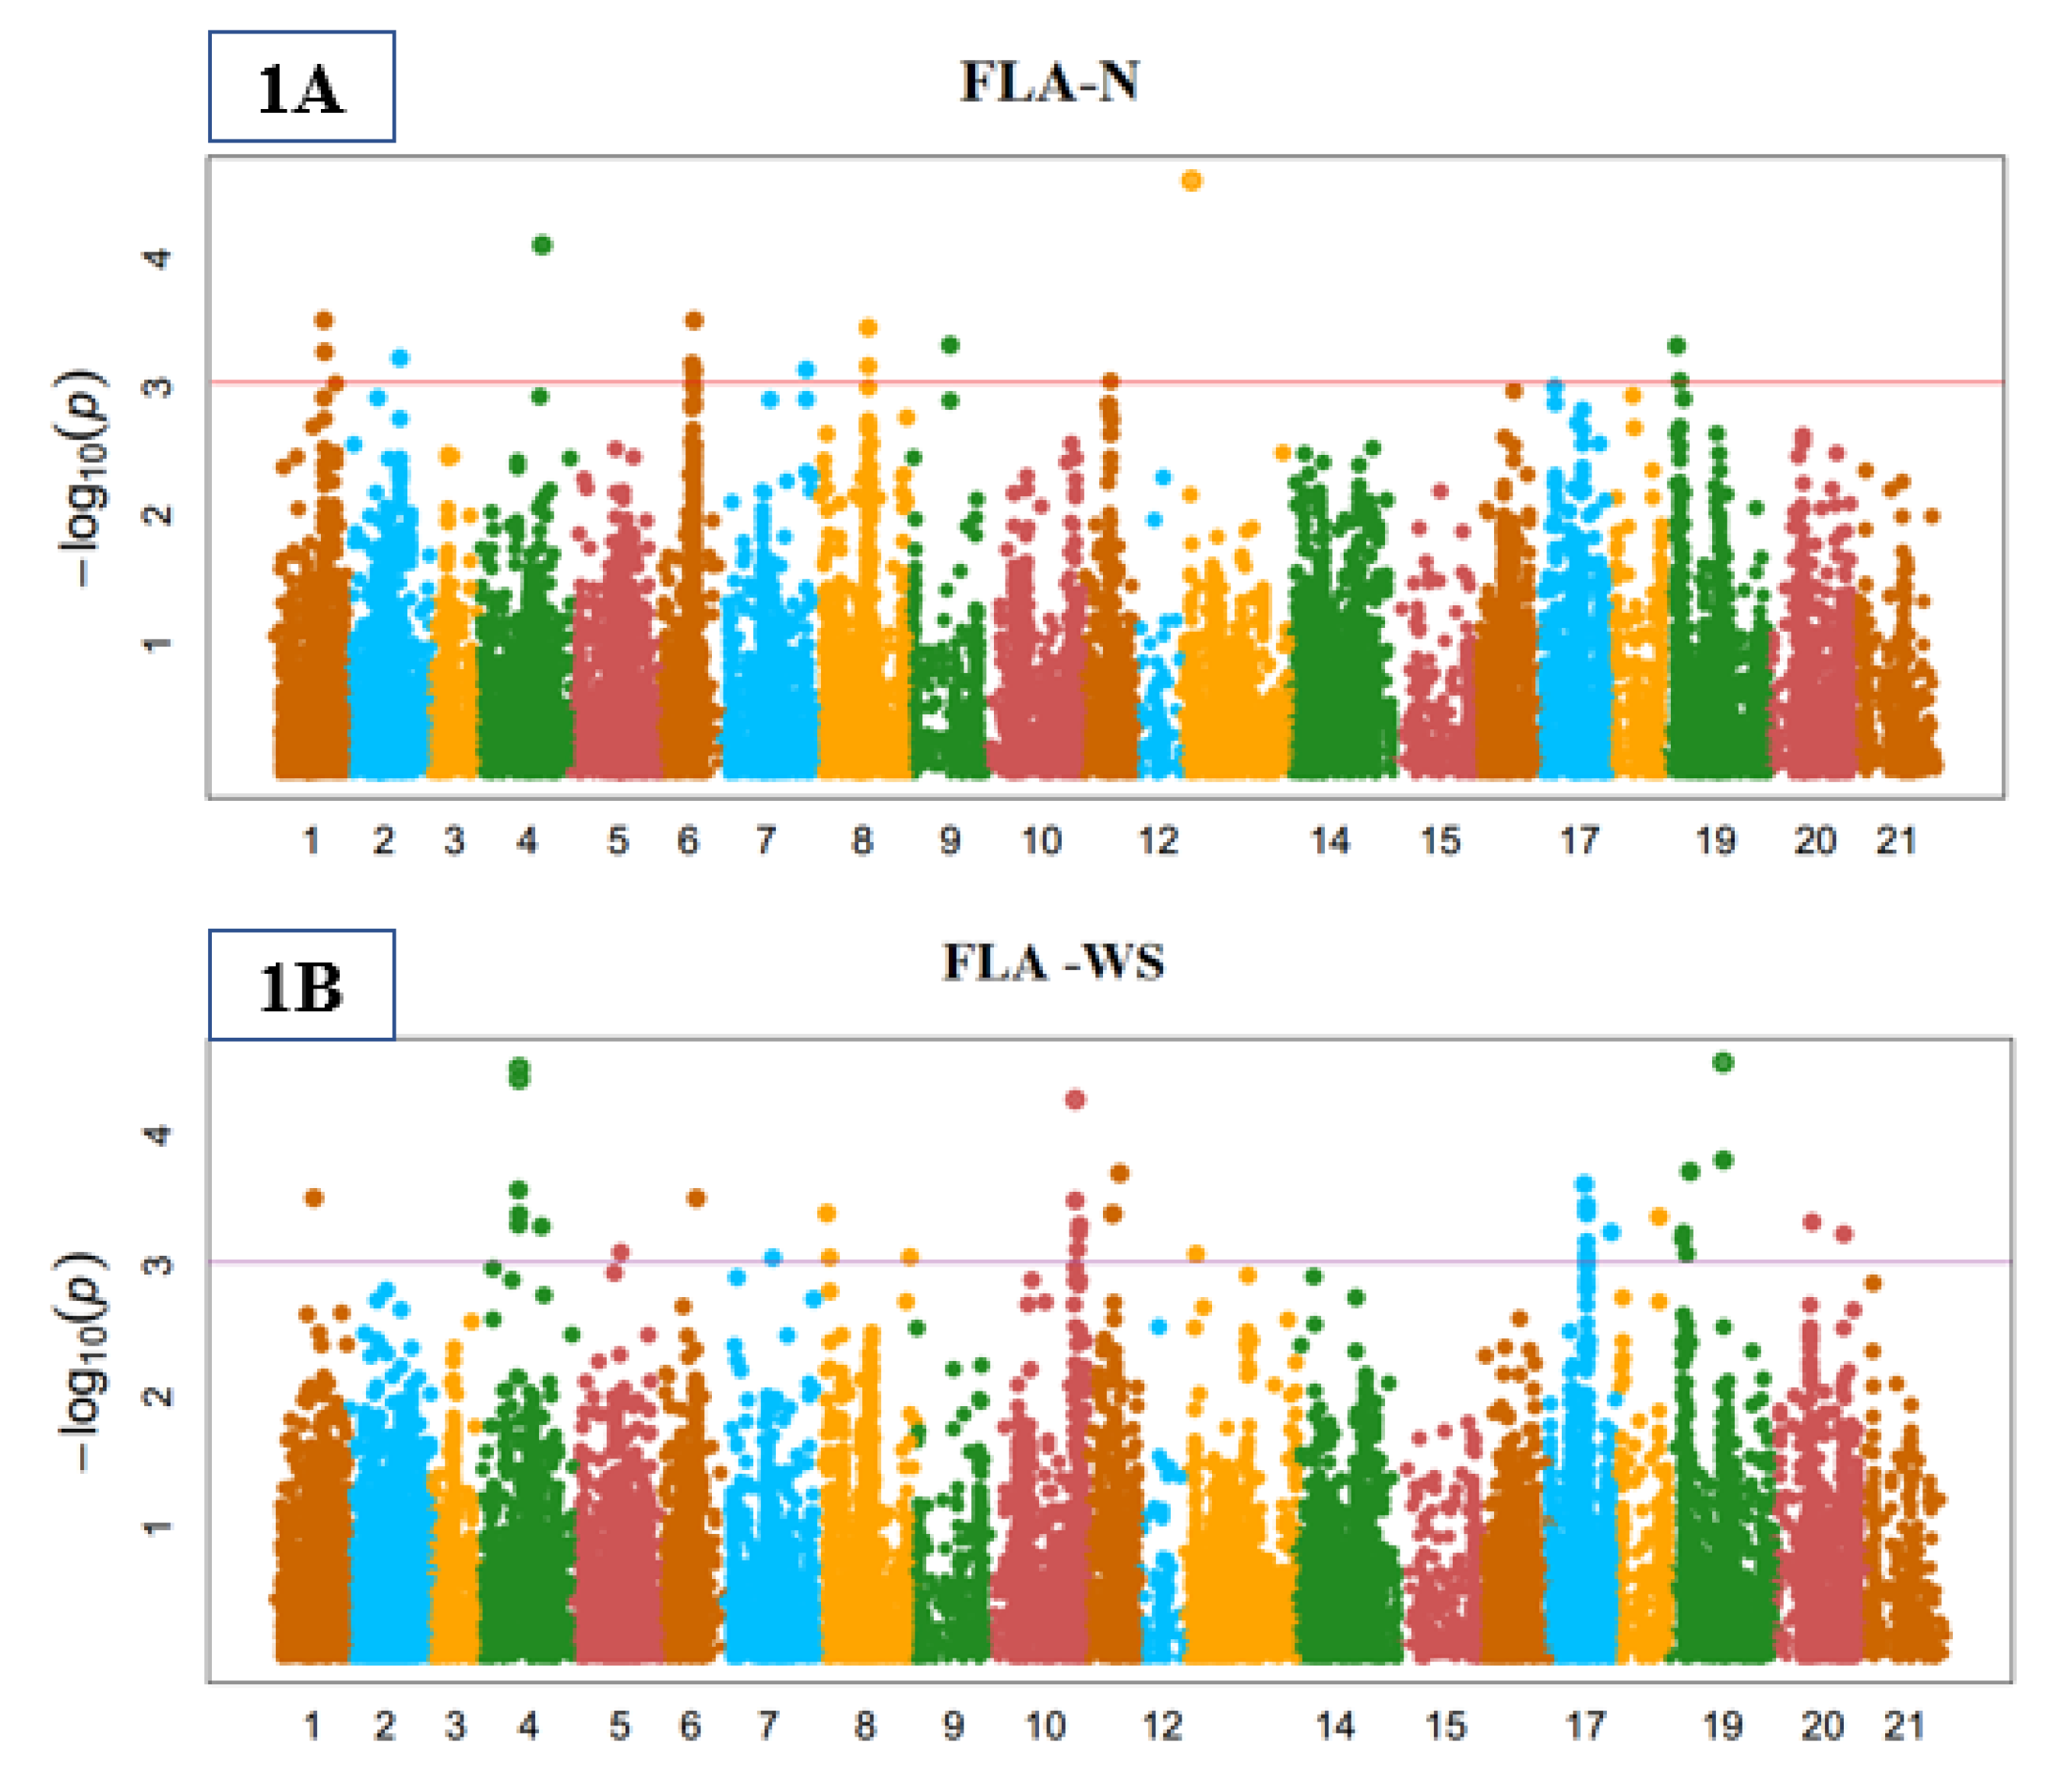
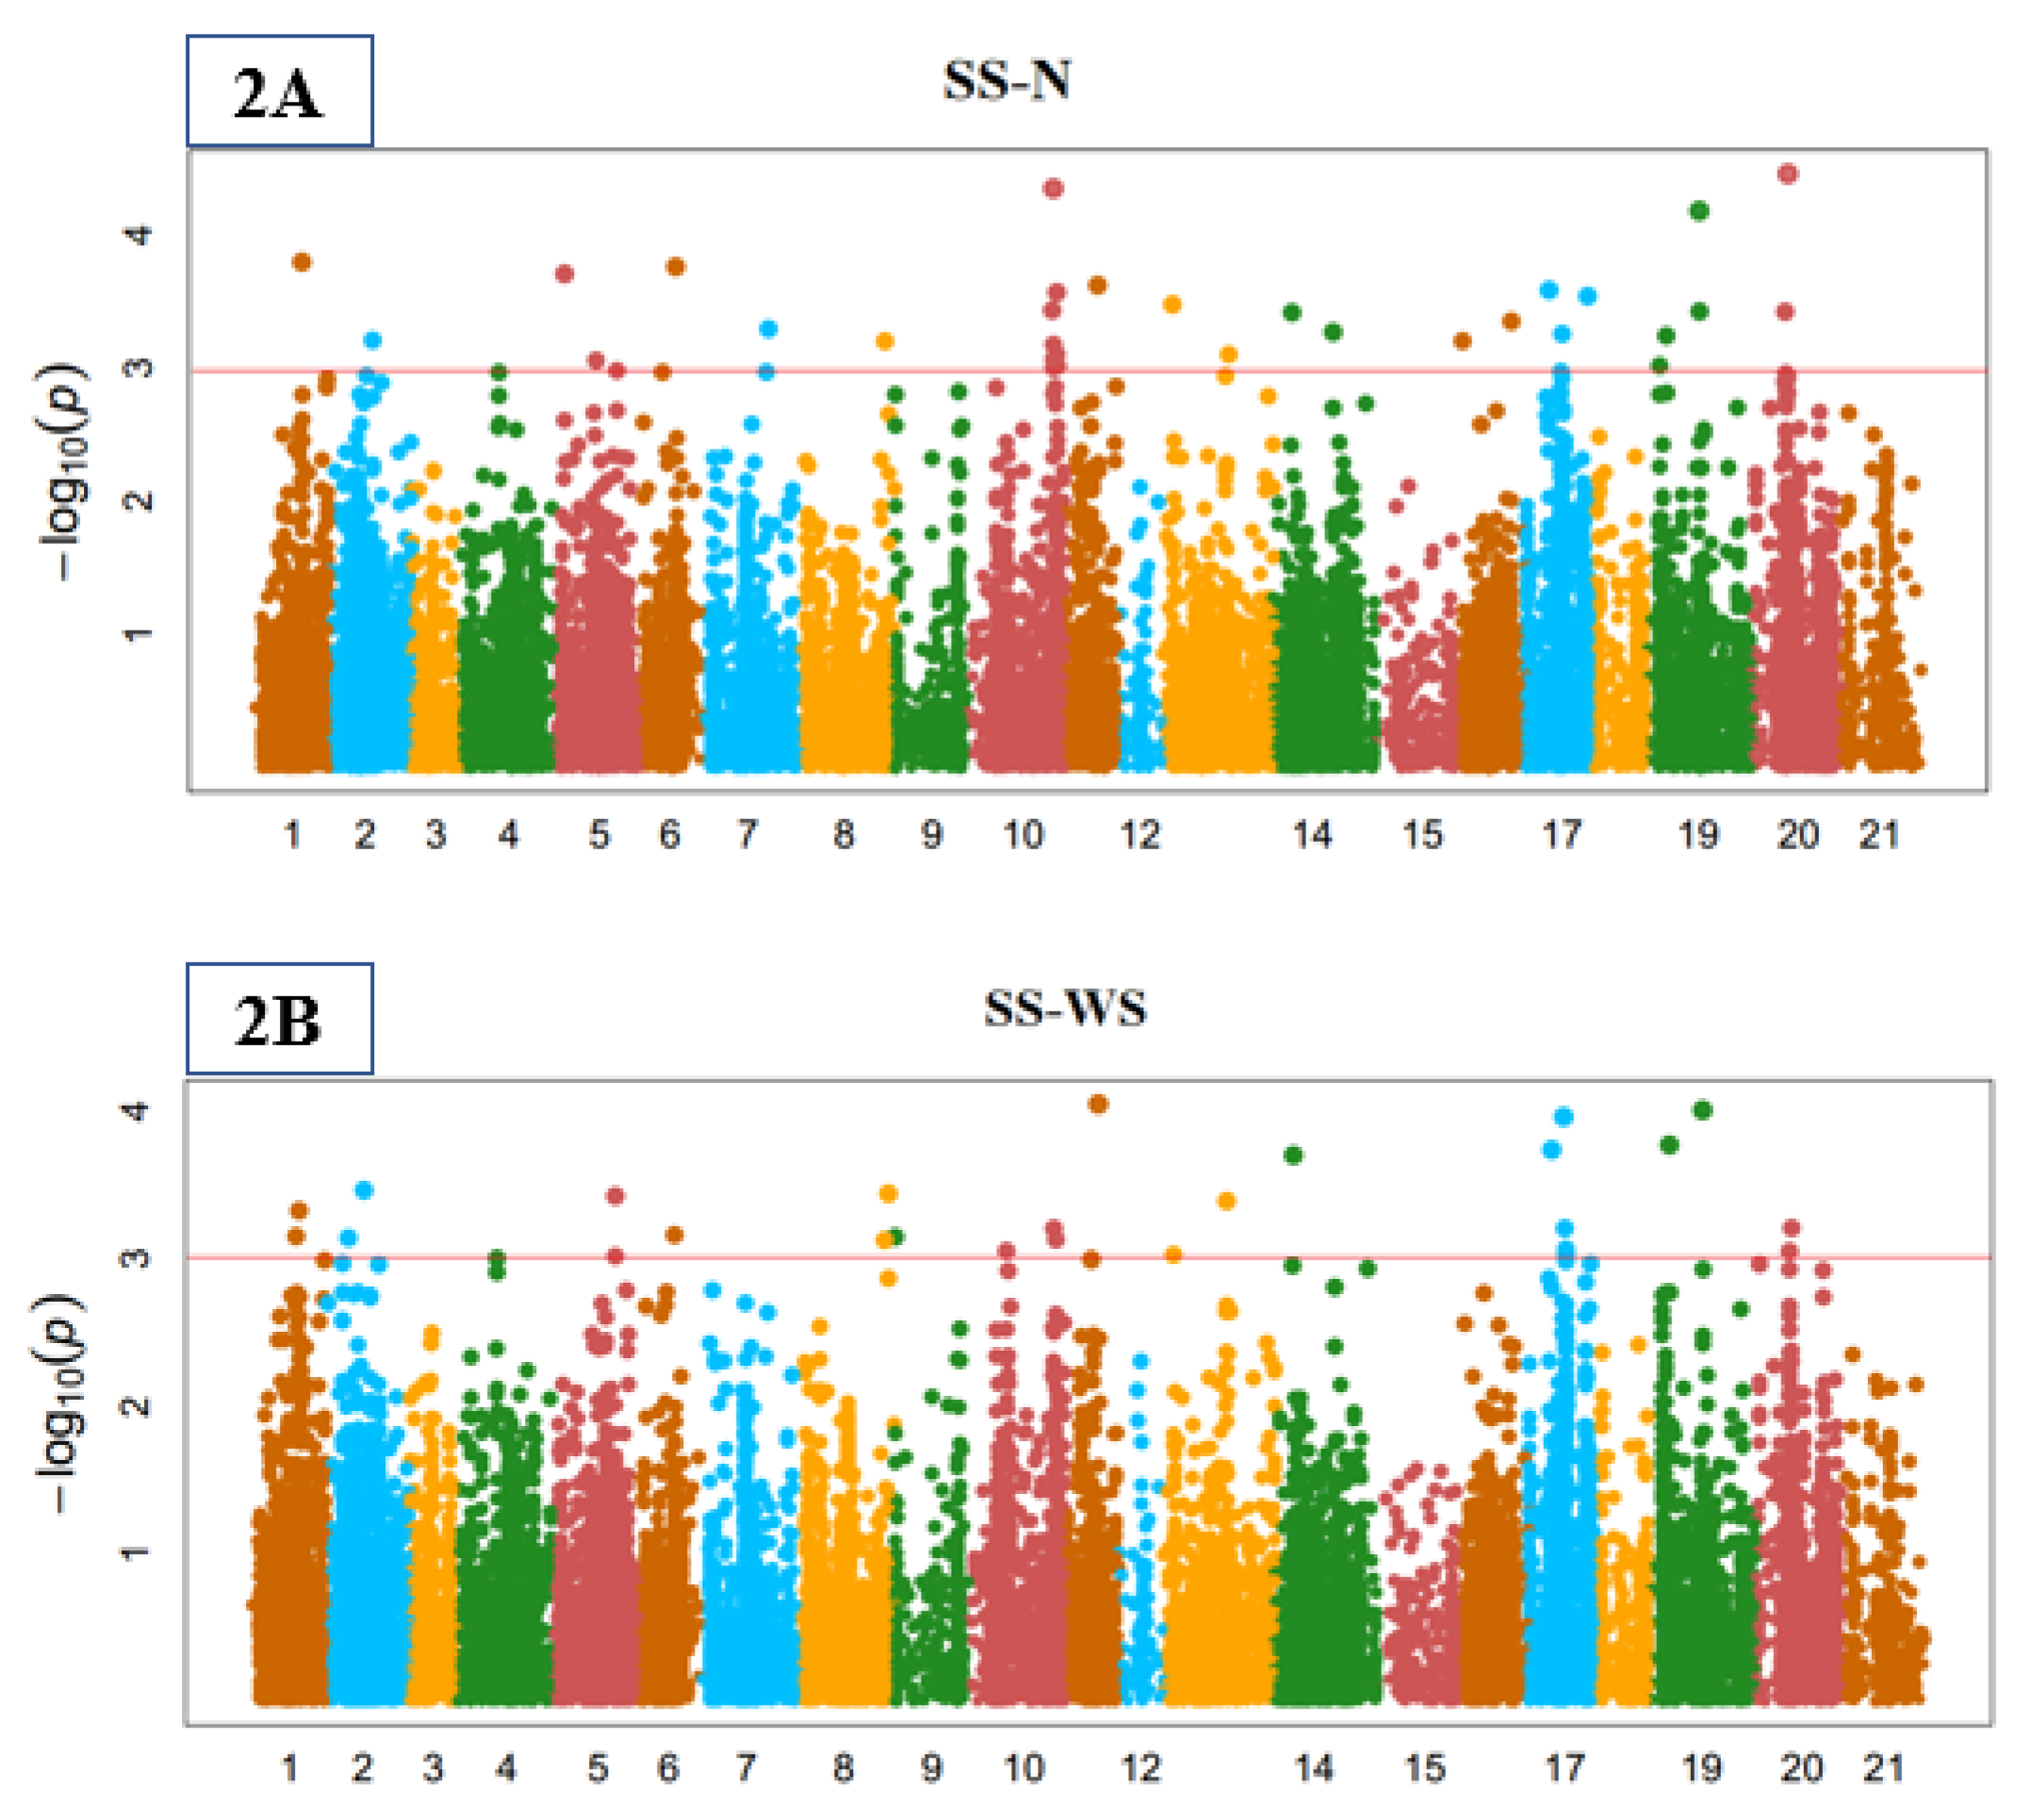
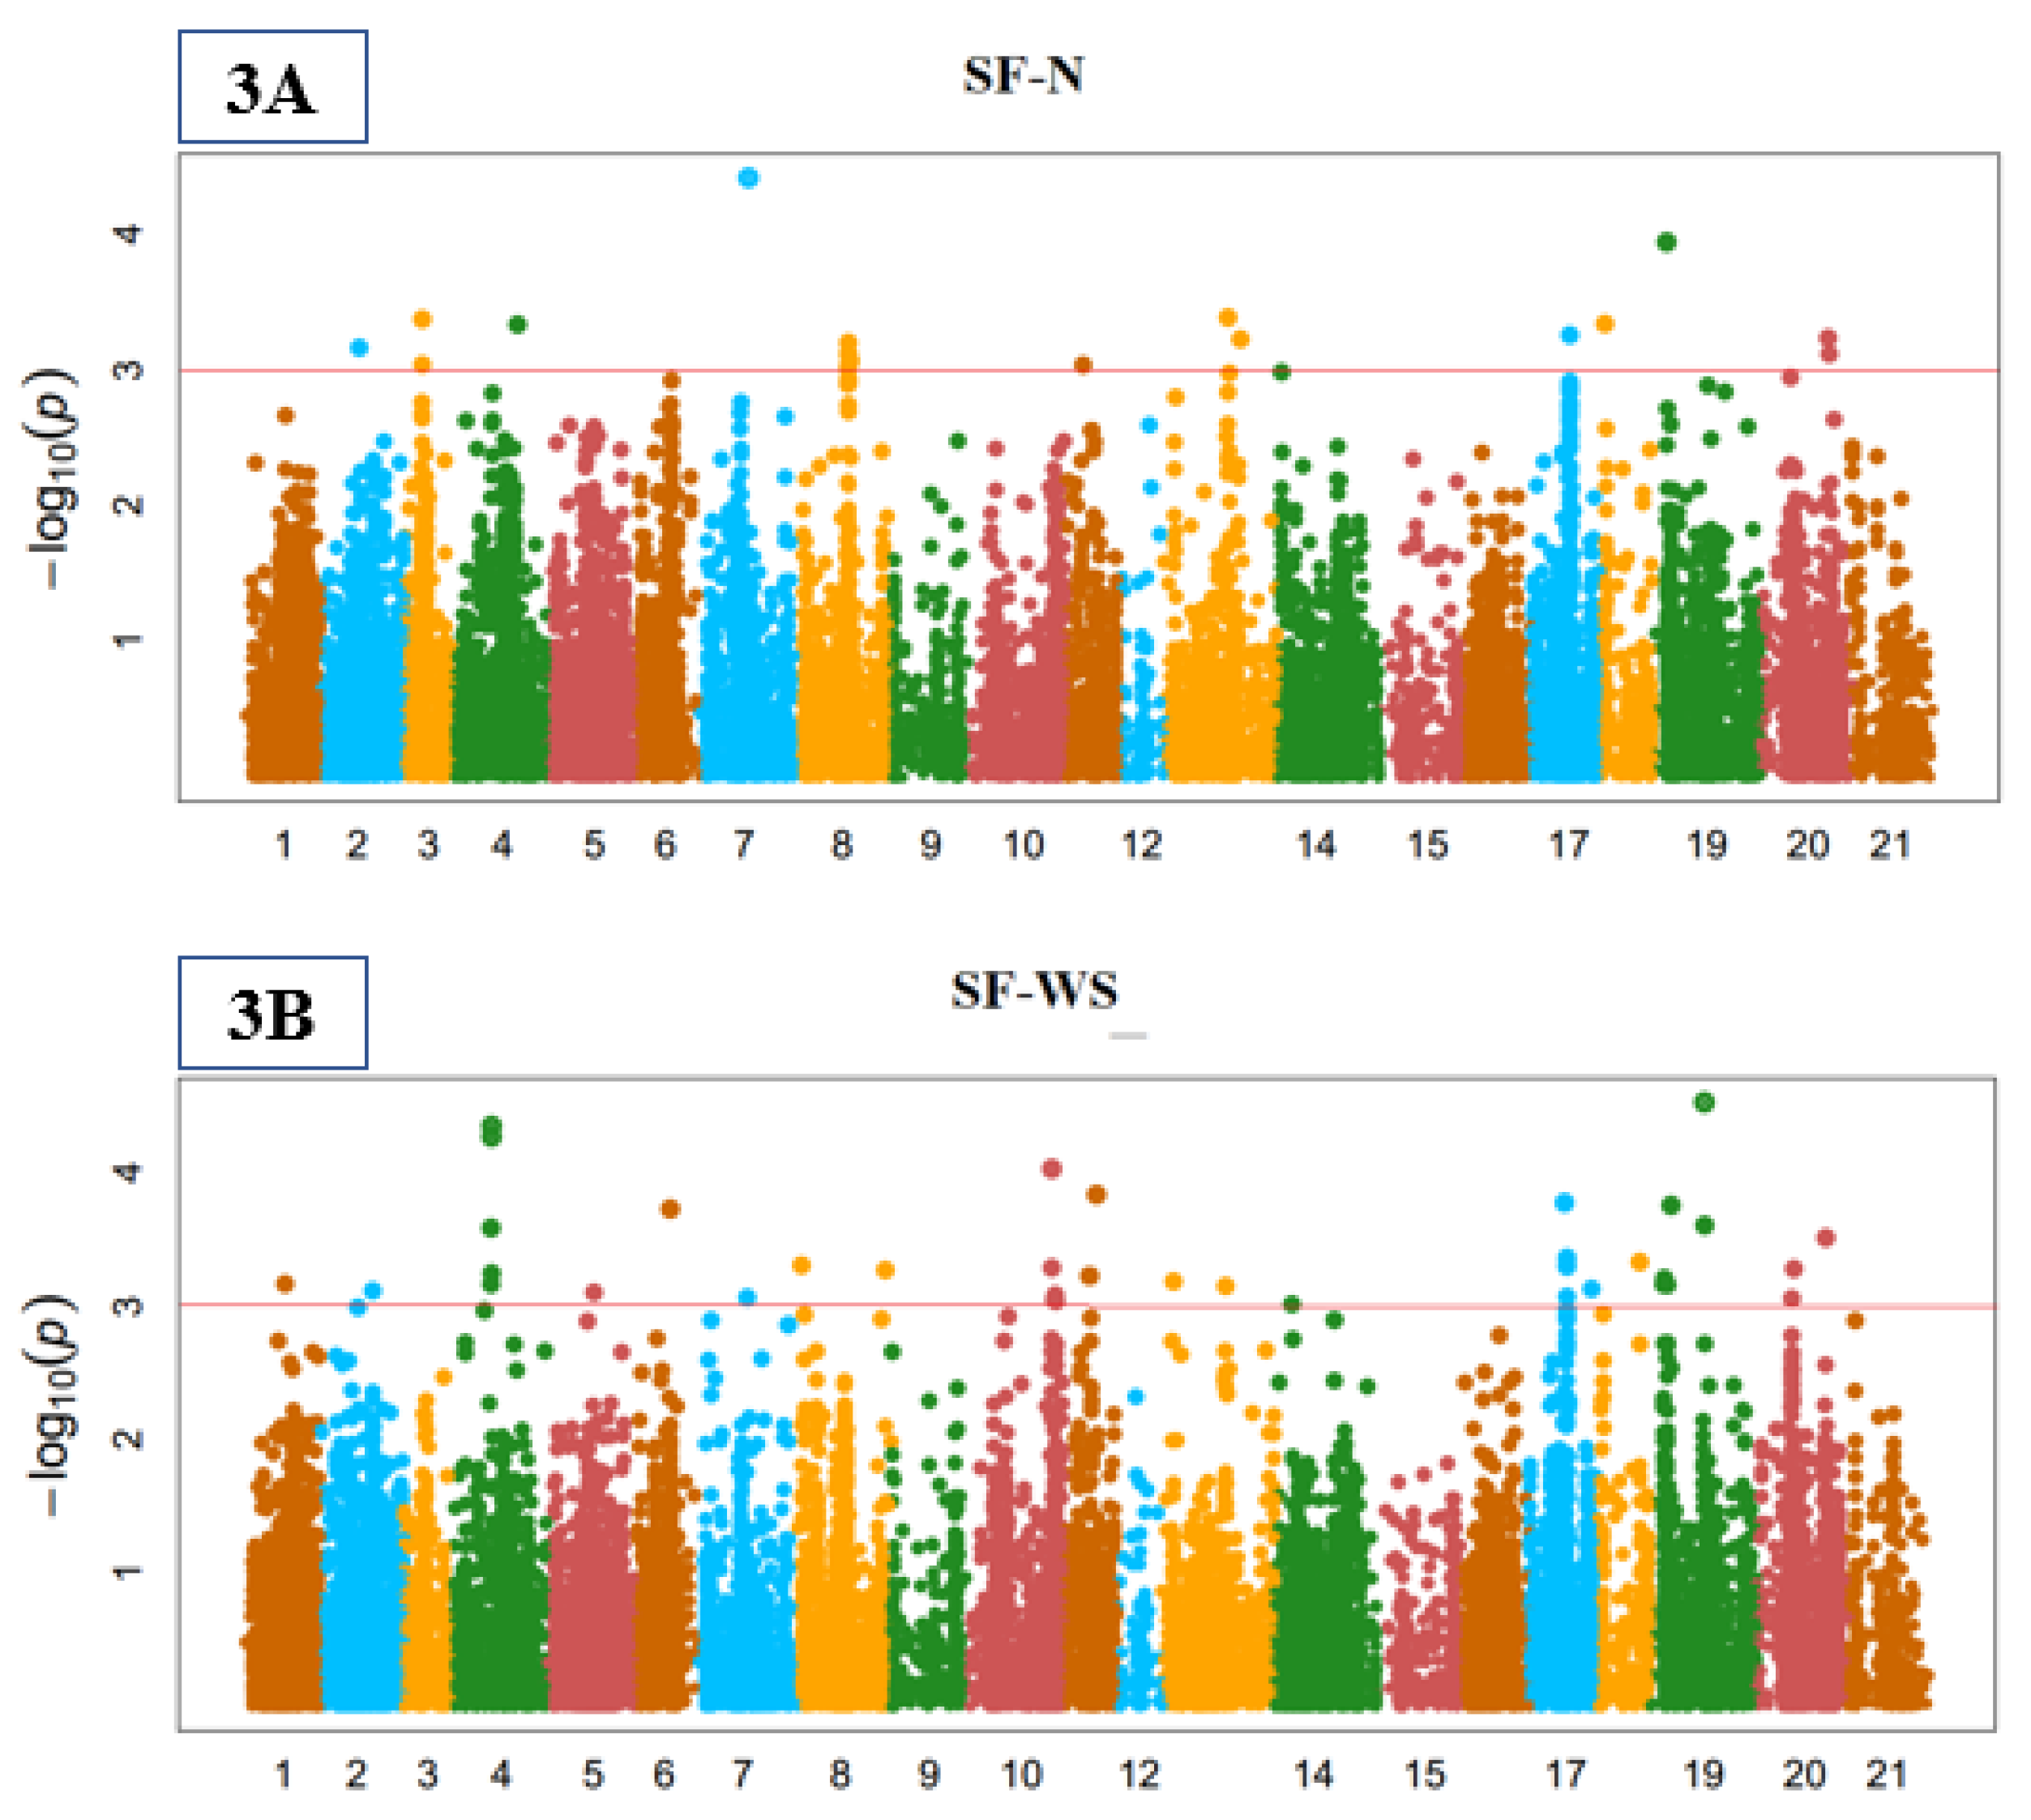
3.3. Genome-Wide Marker-Trait Associations (MTA)

In this study, 33,210 high-density SNP markers from the 90 K Illumina iSelects SNP array were evaluated to perceive SNPs associated with water shortage tolerance and yield-related indices. Before analyses of GWAS and genomic prediction, scientists should validate and maintain genotype quality. The GAPIT provides a series of diagnostic tools to help users perform quality control on genotypes. Marker-trait associations for these indices in non-stressed and water shortage conditions were examined. A total of 422 significant SNPs were correlated with the observed characteristics, and out of those 178 and 244 MTAs were scored in non-stressed and water shortage conditions, respectively, at or above −log 10 (p < 0.0001) threshold level using MLM (mixed linear model) for yield- and stomata-related traits (Supplementary Tables S2 and S3). Manhattan plots Figure 1A,B, Figure 2A,B, Figure 3A,B, Figure 4A,B, Figure 5A,B and Figure 6A,B present the site of significant SNPs at −log10(p) which significantly linked with the desired characteristics under studied conditions. The quantile-quantile (QQ) plot of p-values was created (Supplementary Figures S3–S14) to confirm the results of Manhattan plots as mentioned in the figures. The Y-axis is the observed negative base 10 logarithm of the p-values, and the X-axis is the expected observed negative base 10 logarithm of the p-values under the assumption that the p-values follow a uniform (0,1) distribution. The dotted lines show the 95% confidence interval for the QQ plot under the null hypothesis of no association between the SNP and the trait.

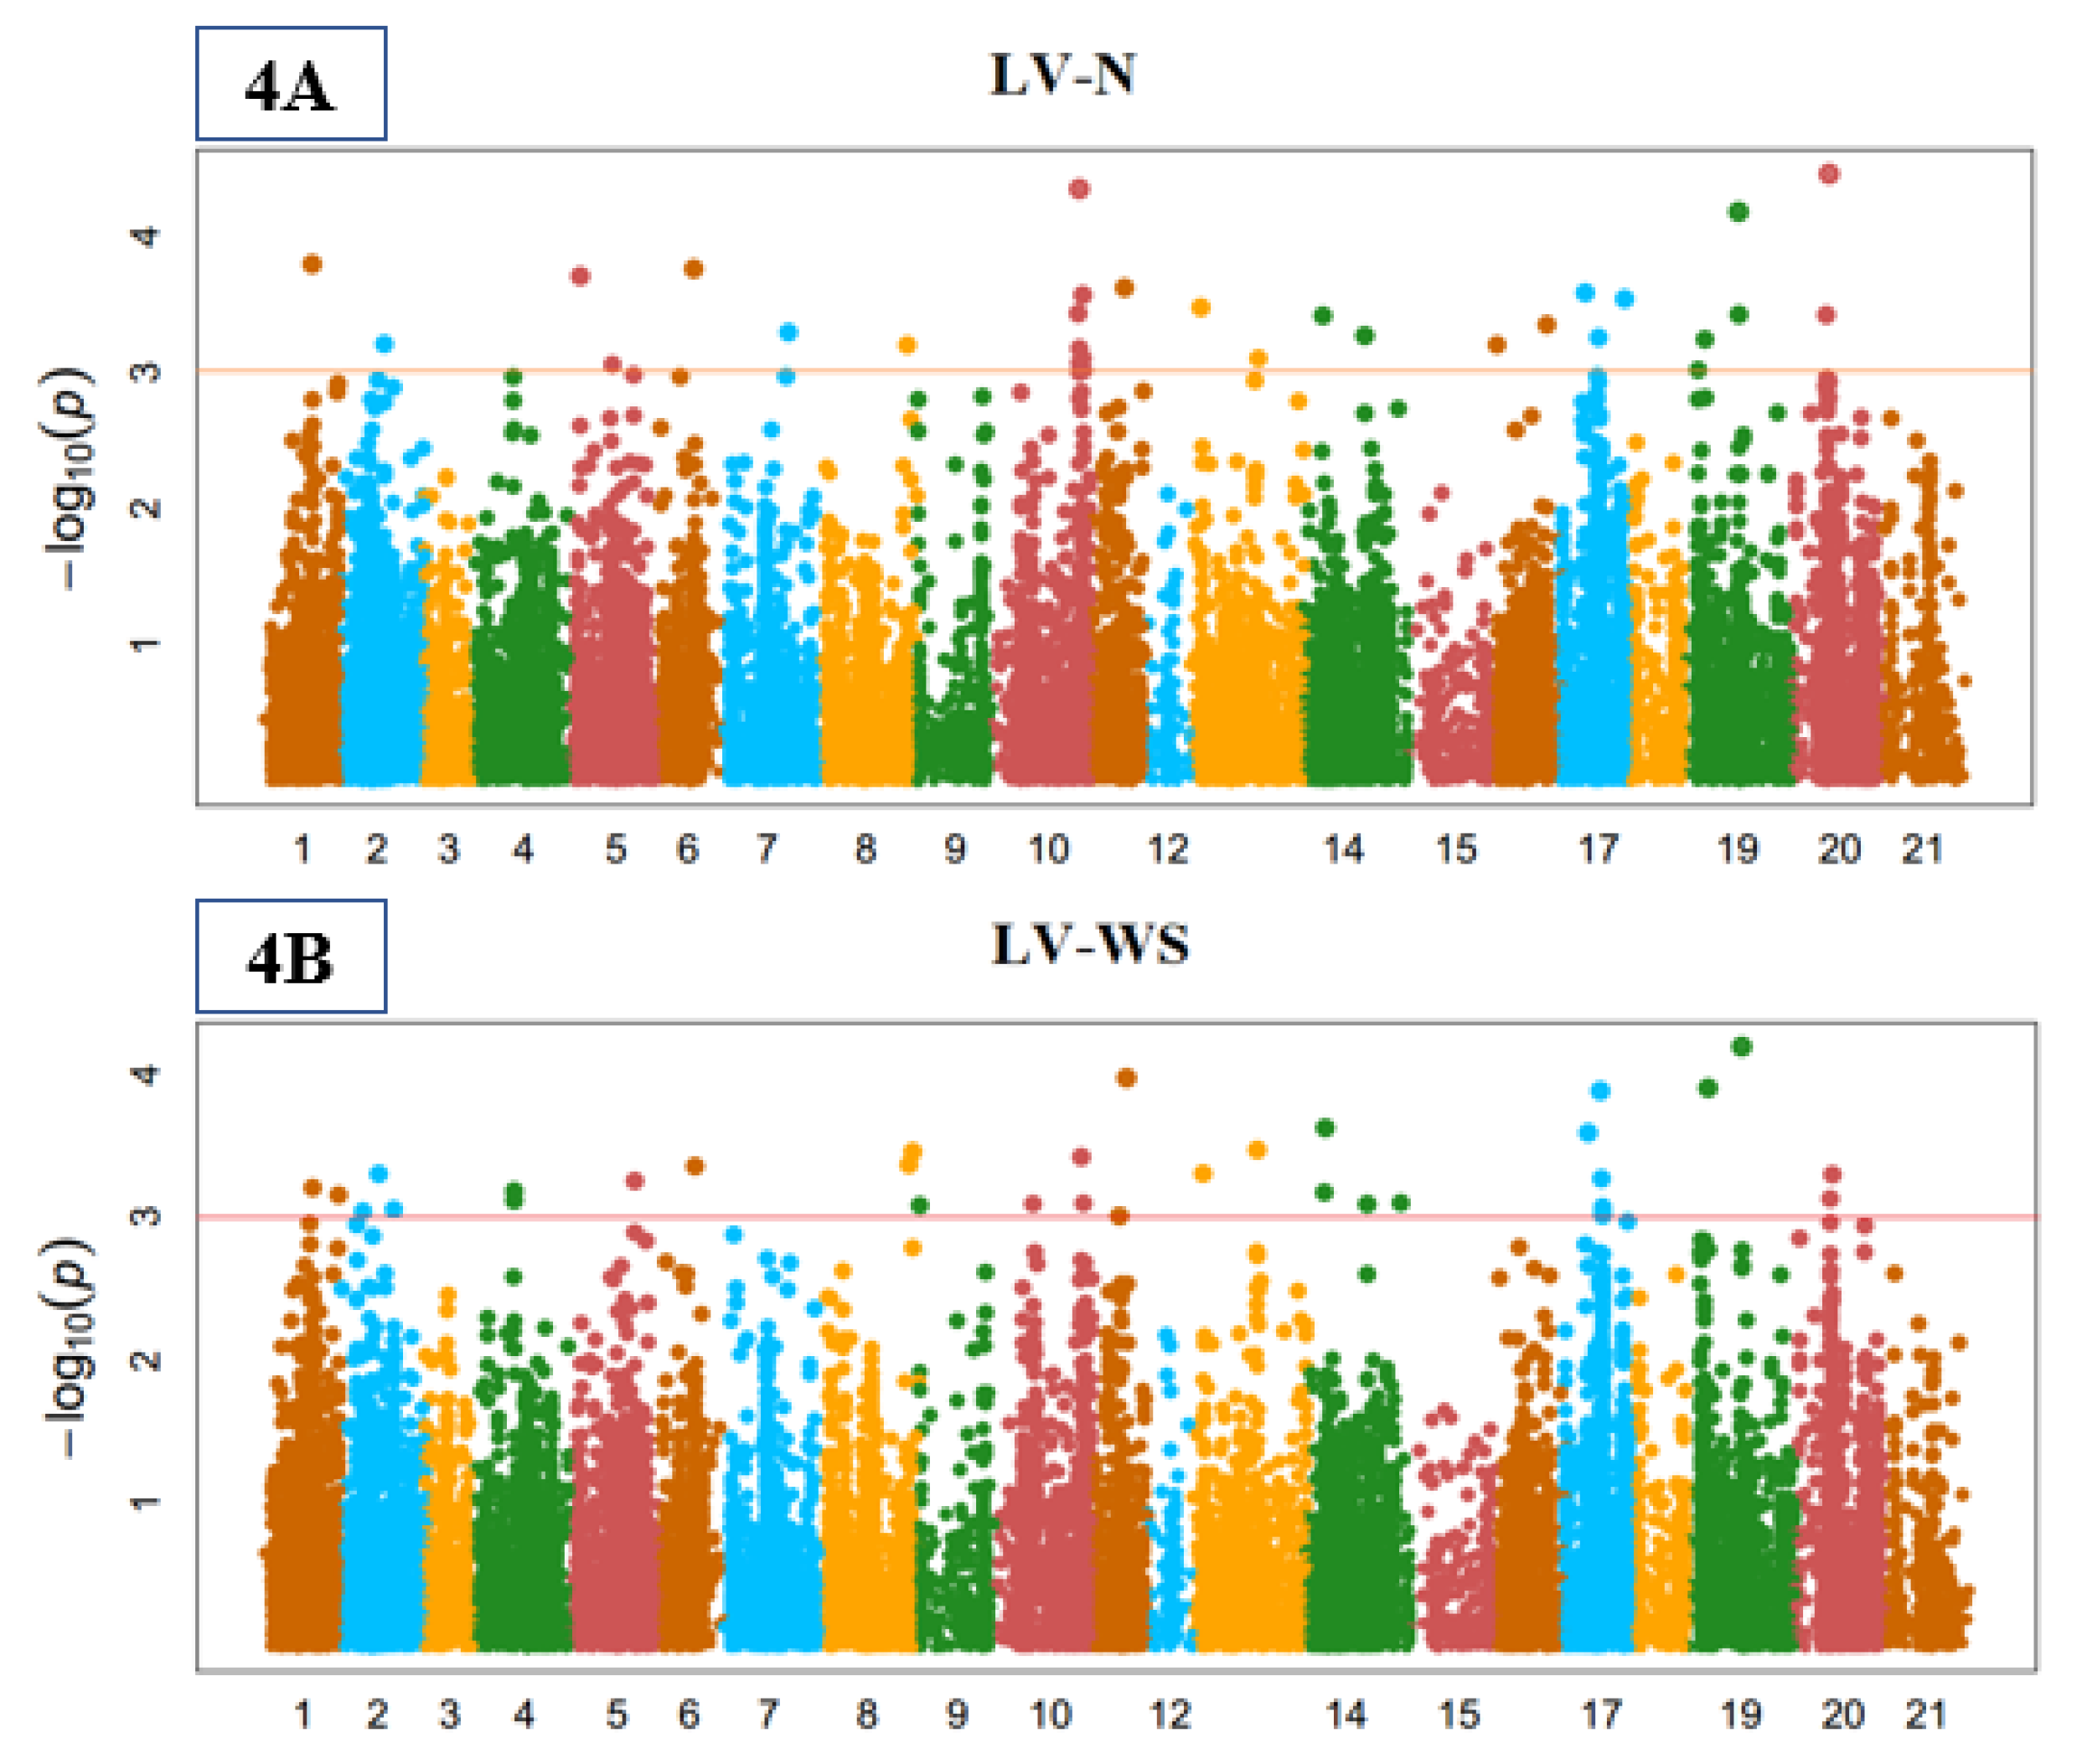
3.4. Stomata Indices

Under normal environment, stomata size (SS) was highly linked with 30 markers. These significant MTA associated with SS were detected on chromosomes 1A, 1B, 2A, 2B, 2D, 3B, 3D, 4B, 5A, 5B, 6B and 7A, as shown in Figure 2A. These markers explained 12.25% to 29.65% of the variability in this attribute (Supplementary Table S2). In non-stressed conditions, the marker (snp_Ex_c24167_33416760) explained the highest phenotypic variation (29.65%) on chromosome 7A at position 148.26cM. Under water shortage environment, 29 significant SNPs were positively associated with SS which were situated on chromosomes 1A, 1B, 2A, 2B, 2D, 3A, 3B, 4A, 4B, 5A, 5B, 6B, 6D, 7A and 7B as exhibited in the Manhattan plot in Figure 2B. These markers explained 8.18% to 24.08% of the phenotypic variability in SS under water shortage environment. The marker (BS00038787_51) on chromosome 7A at 369.49cM distance had the highest phenotypic variability at 24.08%. In non-stressed conditions, the stomata frequency (SF) was highly correlated with 19 MTAs, which were located on chromosomes 1B, 1D, 2A, 3A, 3B, 4B, 5A, 6B, 6D 7A and 7B as shown in Figure 3A. They explained the phenotypic trait variability from 8.55% to 29.30% in the present study. Significant MTAs for SF were distributed on all wheat genomes (Supplementary Table S2). The marker (wsnp_RFL_Contig2699_2402527) showed more phenotypic variability (29.30%) on chromosome 3A at the position of 321.73cM under normal environment. Under water shortage environment, 41 significantly associated SNPs explaining phenotypic variability ranged from 8.18% to 24.08% in stomata frequency. These were detected at chromosomes 1A, 1B, 2A, 2D, 3A, 3B, 4A, 4B, 5A, 5B, 6B, 6D, 7A and 7B shown in the Manhattan plot in Figure 3B. For leaf venation (LV), 32 markers were highly associated in non-stressed conditions which were found at chromosomes 1A, 1B, 2B, 2D, 3A, 3B, 4A, 4B, 5A, 5B, 6A, 6B, 7A and 7B as shown in Figure 4A. These significantly associated markers explained 14.59% to 29.50% of the variability in this attribute. Significant MTAs for LV were dispersed on all three genomes (Supplementary Table S2). Significantly, 37 associated markers were perceived for LV under water shortage environments. These markers were located on chromosomes 1A, 1B, 2A, 2B, 2D, 3B, 3D, 4A, 4B, 5A, 5B, 6B, 7A and 7B (Figure 4B), explaining 18.98% to 28.10% variation for LV under water shortage environment (Supplementary Table S3).

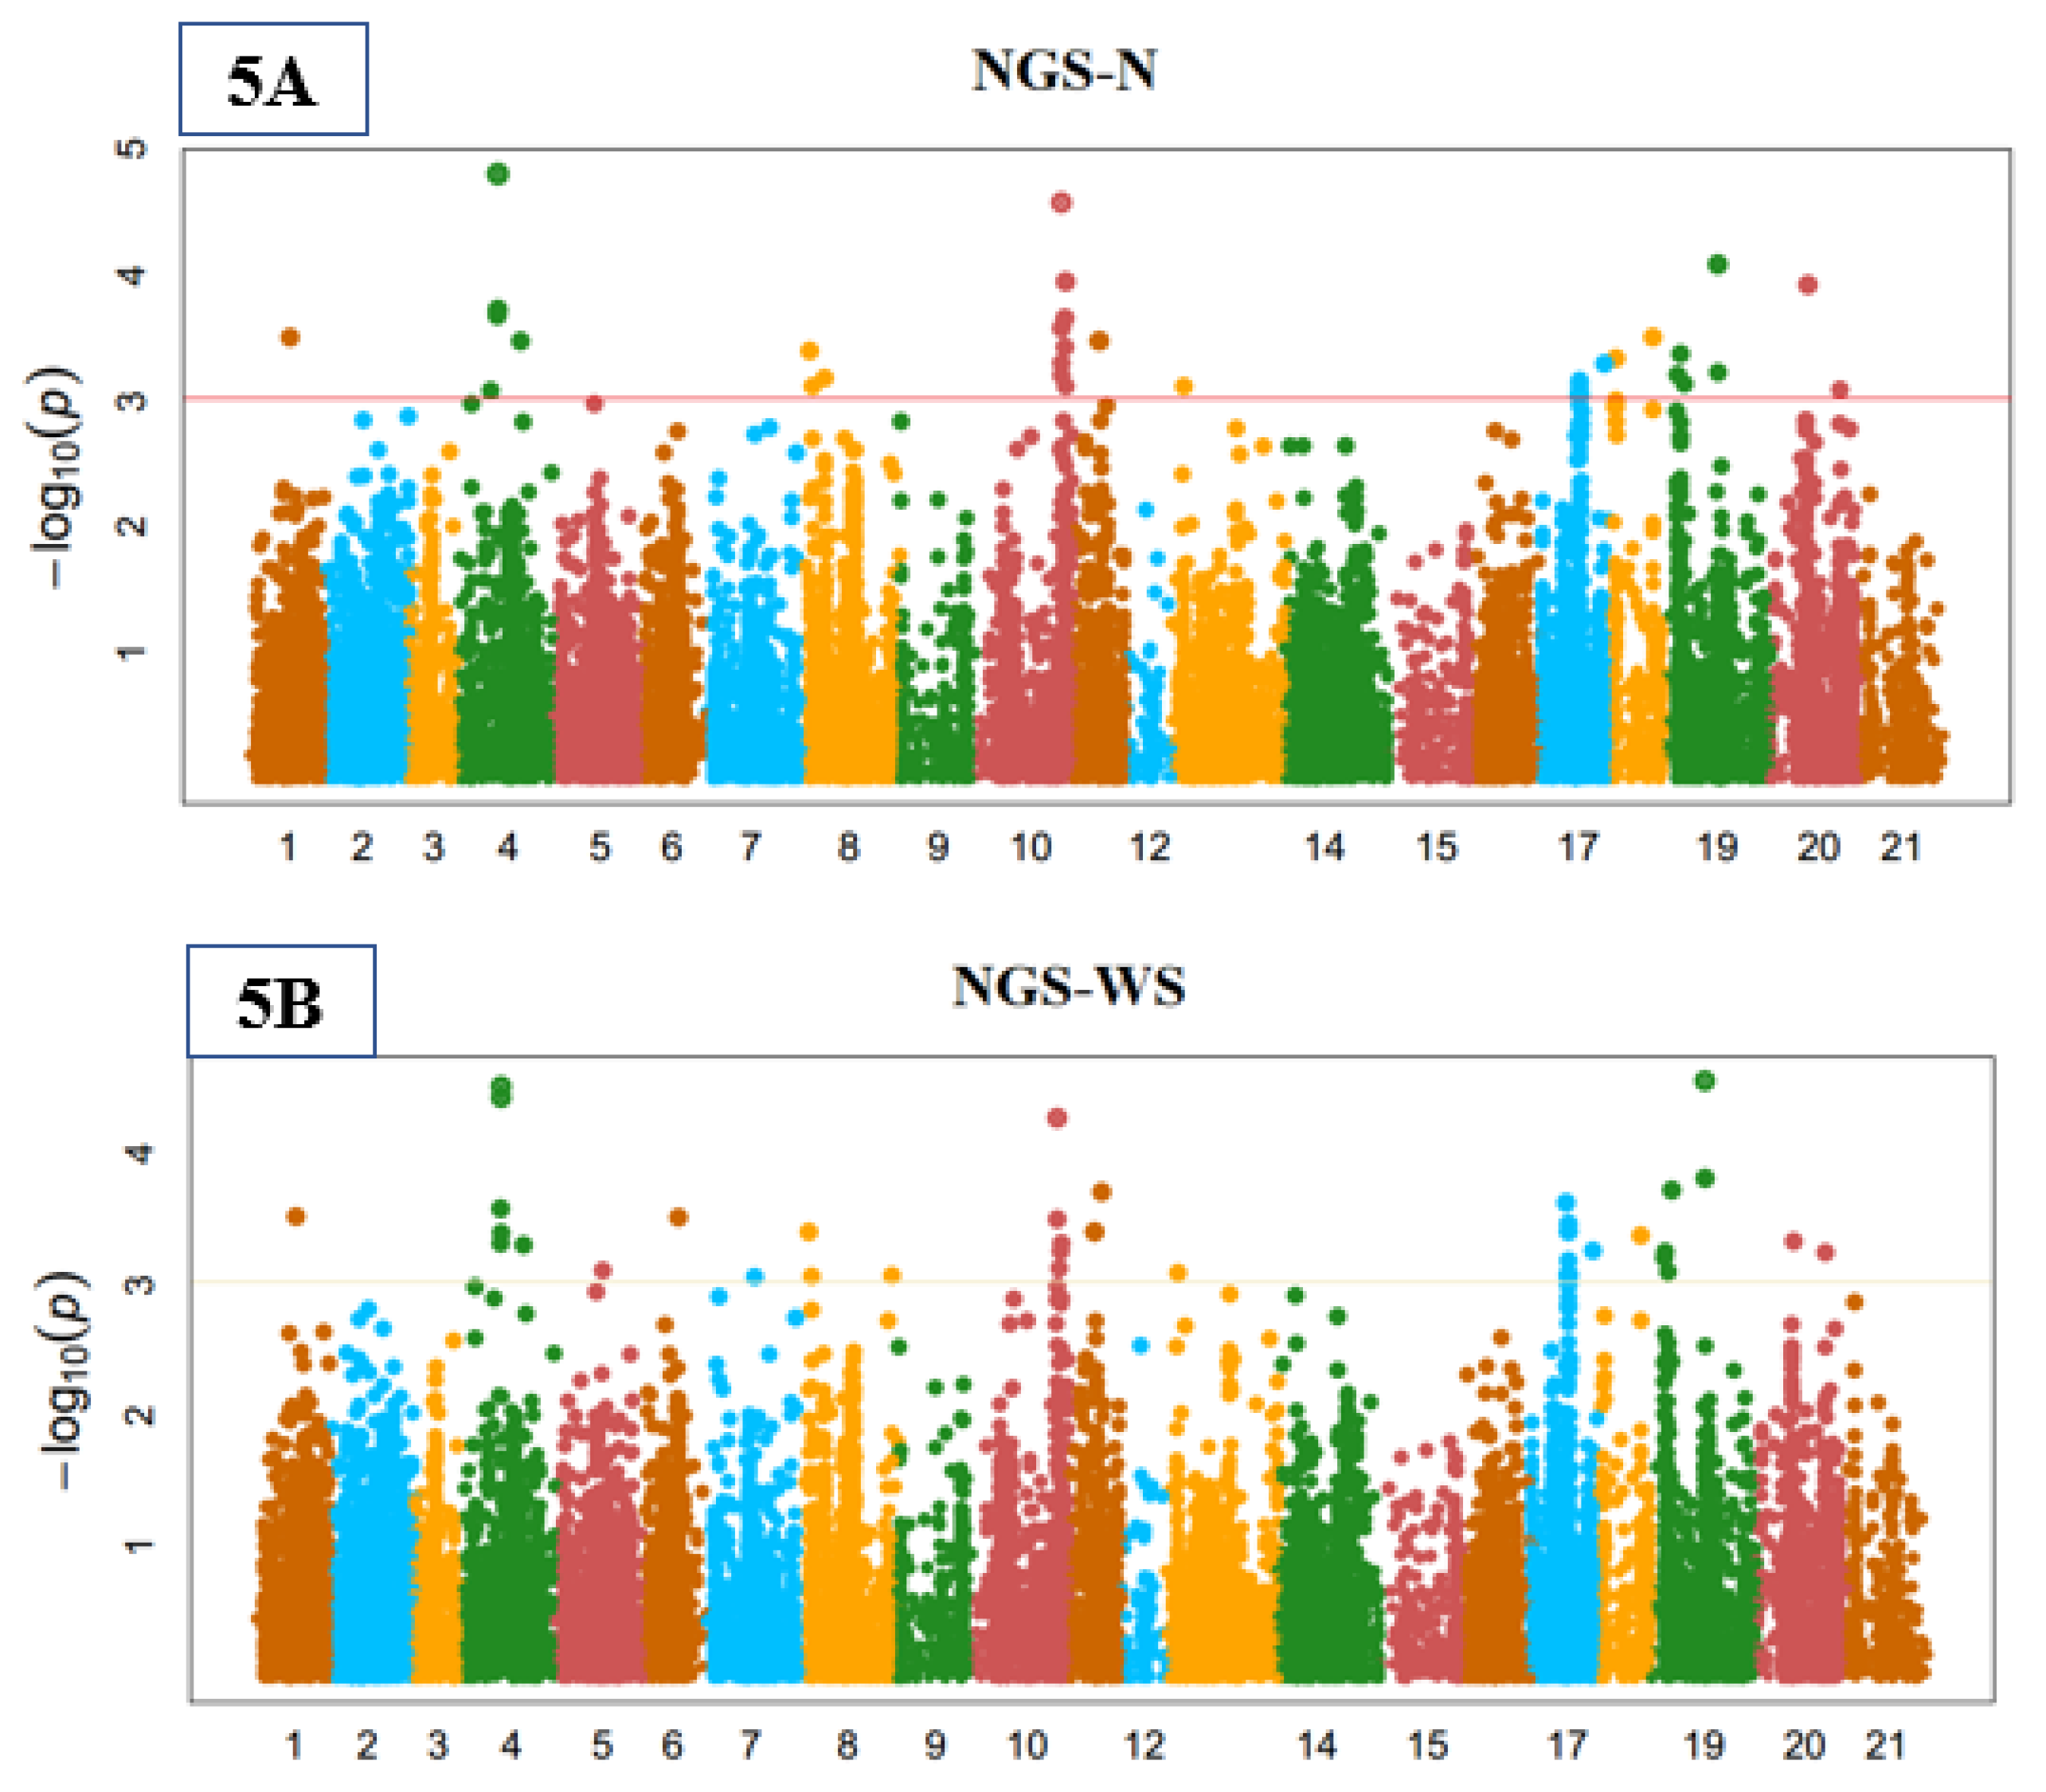
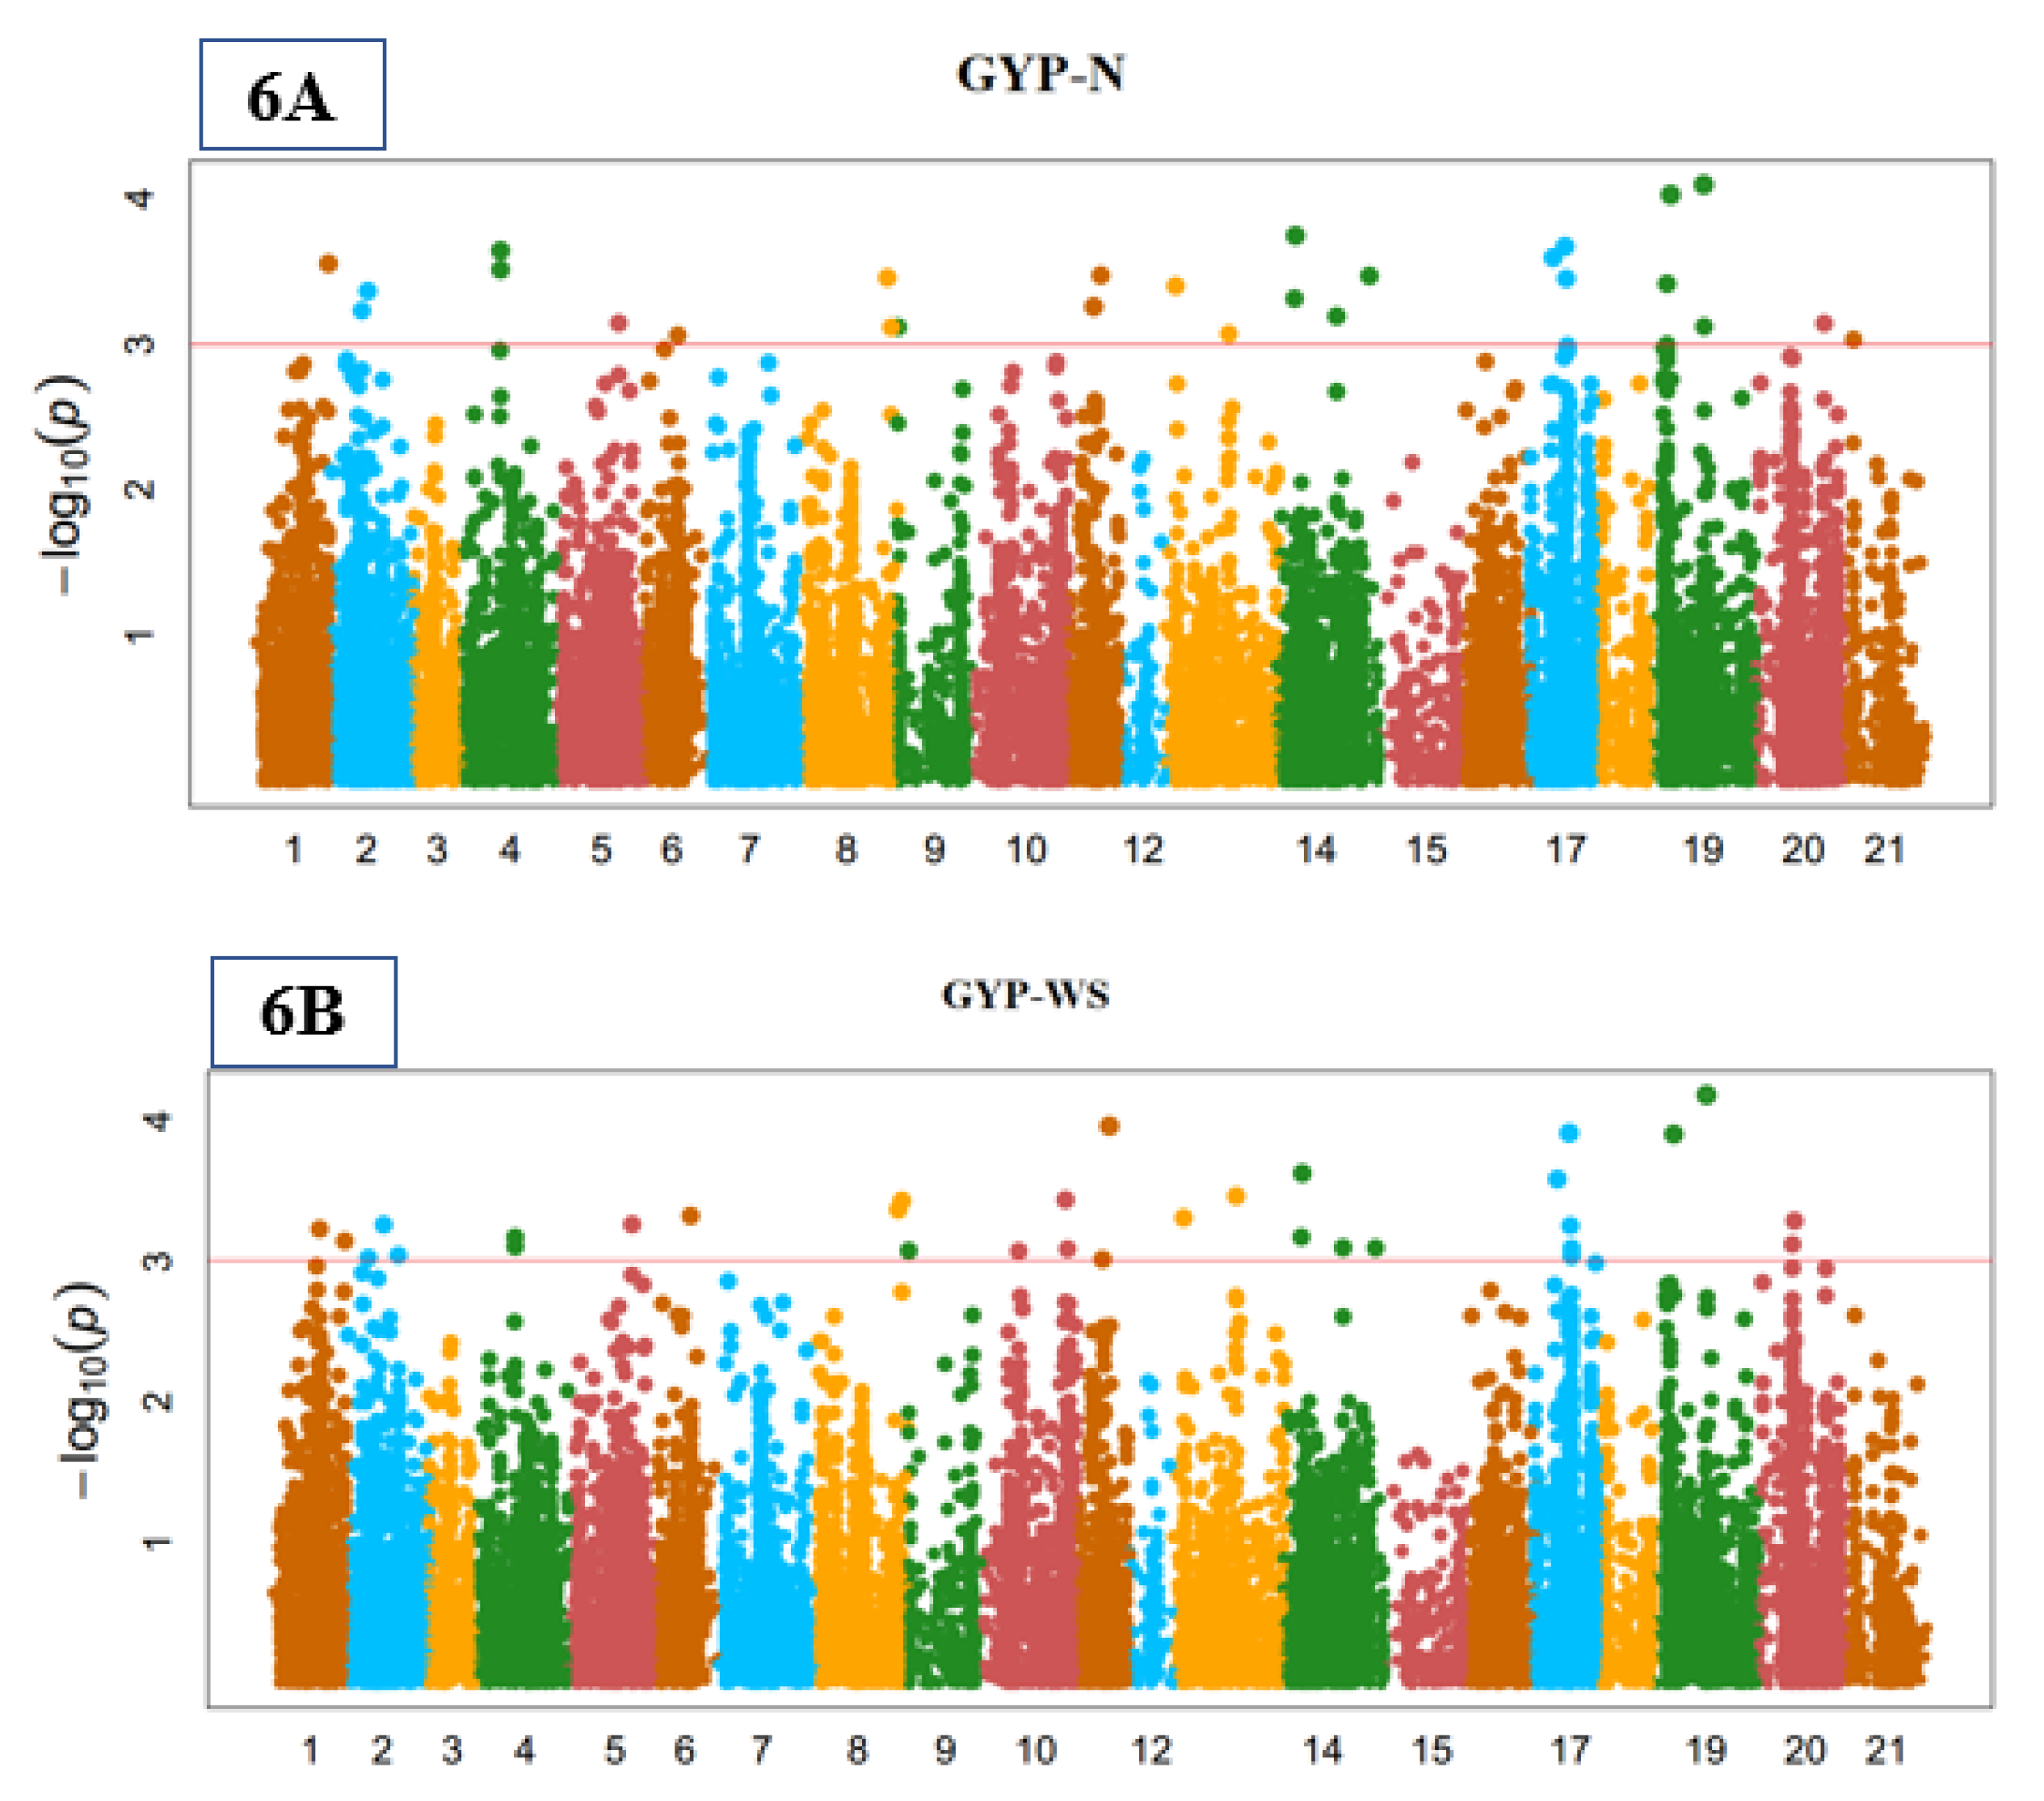
3.5. Yield-Related Indices

Fifteen markers showed highly significant association with FLA which were found on chromosomes 1A, 1B, 2A, 2D, 3A, 3B, 3D, 4B, 5A and 7A in non-stressed environment (Figure 1A). Associated loci of this trait showed phenotypic variation explained (PVE) by 9.62% to 25.66% of the total phenotypic variation (Supplementary Table S2). Under water shortage environment, 50 SNPs were strongly associated with FLA on chromosomes 1A, 2A, 2B, 2D, 3A, 3B, 4A, 4B, 5A, 6D, and 7A (Figure 1B). Total phenotypic variability by these associated markers ranged from 10.40% to 23.40%. In total, 47 significantly associated SNPs were recorded in the current experiment for number of grain per spike (NGS) in non-stressed environment. These SNP markers were recorded at chromosomes 1A, 2A, 3B, 4A, 4B, 5A, 6B, 6D, 7A and 7B Figure 5A. For this attribute, phenotypic variations described by these SNPs markers fluctuated from 6.53% to 21.50%. Under water shortage environment, fifty significantly associated SNPs were positively linked with SPS. They situated at chromosomes 1A, 2A, 2B, 2D, 3A, 3B, 4A, 4B, 5A, 6B, 6B, 6D, 7A and 7B, as shown in the Manhattan plot in Figure 5B. These SNPs had 6.95% to 22.11% variation in SPS under water shortage environment. For grain yield per plant (GYP), 31 markers were highly associated in non-stressed conditions which were found at chromosomes 1A, 1B, 2A, 2B, 2D, 3B, 3D, 4B, 5A, 5B, 6B, 7A, 7B and 7D (Figure 6A). These significantly associated markers explained 14.60% to 23.50% of the variability in this attribute. Significant MTAs for GYP were dispersed on all three genomes Supplementary Table S2. Significantly 37 associated markers were perceived for GYP under water shortage environments. These markers were located on chromosomes 1A, 1B, 2A, 2B, 2D, 3B, 3D, 4A, 4B, 5A, 5B, 6B, 7A and 7B (Figure 6B) explaining 14.78% to 23.46% variation for GYP under water shortage environment (Supplementary Table S3). The marker (BS00038787_51) explained more trait phenotypic variability (23.46%) at chromosome 7A with position 369.49cM while the marker (BobWhite_c44691_648) from chromosome 4B with the position 173.63cM explained least variability (14.78%) in water shortage conditions.

3.6. Genome-Wide Multiple Traits Loci Associations

The highest phenotypic variability of 29.30% and 28.10% occurred in A-genome represented by the significant SNPs wsnp_RFL_Contig2699_2402527 and BS00038787_51 from chromosomes 3A and 7A, having the position of 321.73cM and 369.49cM, and were associated with SF and LV in non-stressed and water shortage conditions, respectively. The significant markers, namely wsnp_Ra_c3176_5975986 and Excalibur_c35339_106 were correlated with LV in B-genome from chromosome 7B (246.93cM) and 4B (220.48cM), explaining 29.50% and 27.97% variation in non-stress and water shortage conditions, respectively. The significant SNPs, namely Excalibur_c17237_688 and Excalibur_c17237_688 located on chromosome 2D (222.41cM) were associated with LV in D-genome showing more phenotypic variability of 27.55% and 25.60%, respectively, in the examined conditions. The lowest phenotypic variation of 6.53% and 13.74% existed in D-genome as depicted by the markers Excalibur_c53680_124 and tplb0025h02_1383 on the same chromosome, 6D, with the positions 50.3cM and 293.15cM linked with NGS in normal and water shortage conditions, respectively.
In normal conditions, pleiotropic locus (BS00038787_51) at chromosome 7A on the positions 369.49cM was also linked with SS, LV, NGS and GYP. The examined characteristics such as SF, LV, NGS and GYP were also influenced by a pleiotropic locus (wsnp_Ex_c24167_33416760) on chromosome 7A at 148.26cM under normal environments. Under water shortage conditions, a pleiotropic locus (BobWhite_c44691_648) for FLA, SS, SF, LV, NGS and GYP was identified on chromosome 4B at the position 173.63cM. The studied characteristics governed by a pleiotropic locus (wsnp_Ex_c8913_14881924) were associated with all studied yield- and stomata-related traits which were located on chromosome 4B at 173.63cM under water shortage conditions as shown in Supplementary Table S3.

4. Discussions

4.1. Phenotypic Evaluation

In this study, highly significant differences were observed among genotypes and environmental conditions, which showed the occurrence of variation and environmental effects on genotype performance in all studied traits as exhibited in Supplementary Table S2 [5,18]. An overall decline in stomatal frequency was observed under water shortage conditions in respect to non-stressed conditions. Enhanced drought stress declined the stomatal frequency which caused a reduction in transpiration rate and exchange of gases [19]. Heritability estimates provided the information about the extent of which a genetic character can be transmitted to the successive generations. In current experiments, high heritability was reported in the studied traits under normal environments, such as FLA (73.52), followed by SS (69.21), LV (68.29) and NGS (64.33) which indicated (Supplementary Table S2) that these were simply inherited traits and most likely the heritability was due to additive gene effects, and selection may be effective in early generations for these traits. Previous studies have also reported the high heritability in NGS and GYP as complex traits. The average value of grain yield per plant was 22.50 g and 15.4 g under non-stressed and stressed environments, respectively. Adverse possessions of drought stress on wheat performance in addition to genotypic variation in response to water shortage have already been observed [13,18]. It is also reported that in wheat crop the maximum loss of grain development due to water shortage environments at anthesis and post-anthesis stage ultimately reduce overall grain yield per plant [43]. The occurrence of water deficiency at booting stage directly reduced the number of spikelets per spike, which ultimately reduced the number of grains per spike and grain yield per plant. The findings agreed with our results regarding water deficit stress at the booting stage. Few motives are associated with the limit of physiological and biochemical pathways due to water shortage, which cause yield losses in wheat [21]. Drought- related plant traits including leaf venation, stomata size and stomatal frequency are important to select for developing drought resistant varieties/lines [16]. Stomata size (SS) was negatively associated with all studied traits in non-stressed and water shortage conditions in a previous study, which supports our findings [8], and showed that no association was established with other observed parameters. Leaf venation had positive association with frequency of stomata. A higher number of veins contained maximum stomatal frequency; some wheat scientists have also observed that higher stomatal frequency may lead to thick veins. As a result, the selection for stomata size is not a favorable criterion for these genotypes. The yield-related traits such as FLA, NGS and GYP showed positive association with each other in non-stressed and drought conditions and the selection of mentioned traits will be fruitful for this germplasm [28,44]. Stomata frequency (SF) and leaf venation have already been used to select tolerant varieties [45]. In wheat, grain filling is closely related to flag leaf characteristics and function. Stomata are specialized leaf epidermal cells which regulate photosynthetic CO2 uptake and water loss by transpiration. Understanding the mechanisms controlling stomatal size, and their opening under drought, is critical to reduce plant water loss and maintain a high photosynthetic rate which ultimately leads to elevated yield [17]. The mean variability of drought- and yield-related traits was observed. Among the genotypes with variable performance in water shortage conditions, the best performers were categorized as drought tolerant genotypes. Based on these evidences, the tolerant genotypes were G6, followed by G1 and G21, as shown in Table 4.

4.2. Population Structure

The Bayesian approach in statistical software package STRUCTURE version 2.3.3 was used to assess the genetic structures of 96 bread wheat genotypes. The observed accessions were classified into four sub-groups based on molecular data. Various kinds of colors in Supplementary Figure S2 show the discrete groups and overall studied genotypes assigned into the four sub-groups. This practice was also previously used in a wheat breeding program by several experts and they attained descriptive results [20]. STRUCTURE analysis recommended that 96 genotypes originated from diverse progenies. However, the known origin indication according to preserver of 96 wheat genotypes and pedigree records, exhibited three types of populations, but genetically these genotypes were divided into four sub-populations. According to the maintained sources (Supplementary Table S1), the first group consisted of the accessions G1 to G22 from advance-breeding lines, established in PBG-UAF, while the second group had accessions G23 to G46 from a foreign source and the third group had the accessions G47 to G96 from locally cultivated Pakistani wheat varieties.
In wheat breeding programs these practices have also been used by several wheat breeders [21,46]. STRUCTURE analysis recommended the divergences among 96 bread wheat genotypes which represented the genetic resemblance within groups and genetic differences between the groups. Mainly, outcomes were practically deliberating to the already identified pedigree record and origin of wheat accessions. Determination of genetic diversity would be helpful to recognize the diverse accessions for the improvement and progress of future wheat breeding programs [47]. Those accessions having diverse genetic makeup can be designated for required combinations to produce multiple and significant traits to gain a better yield [3]. Discernment of wheat accessions based on their genetic basis will be beneficial for effective and early screening of anticipated accessions in wheat breeding programs for producing high-yielding wheat varieties.

4.3. Genome-Wide Marker-Traits Associations

Genes and QTLs related to drought tolerance and yield characteristics in whole wheat genomes were distributed across 21 chromosomes described by several wheat breeders [33]. A marker-trait association (MTA) study recognized the connection between a particular morphological and genetic variation within a genome, which ultimately perceived locus underpinning-related characteristics at the end [48]. In this study, 33,210 high-density, polymorphic SNP markers from 90 K Illumina iSelects SNPs array [35] were examined to study SNPs associated with stomata- and yield-associated indices. Marker-trait associations (MTA) for these characteristics in non-stressed and water shortage conditions were detected. The red horizontal line on Manhattan plot entitles the threshold level (p < 0.0001) of significance for SNPs with specific traits (Figure 1A,B, Figure 2A,B, Figure 3A,B, Figure 4A,B, Figure 5A,B and Figure 6A,B). The quantile-quantile (QQ) plot (Supplementary Figures S3–S14) is a useful tool for assessing how well the model used in GWAS accounts for population structure and familial relatedness. In this plot, the negative logarithms of the p-values from the models fitted in GWAS are plotted against their expected value under the null hypothesis of no association with the trait. Because most of the SNPs tested are probably not associated with the trait, the majority of the points in the QQ plot should lie on the diagonal line [49,50]. Deviations from this line suggest the presence of spurious associations due to population structure and familial relatedness, and that the GWAS model does not sufficiently account for these spurious associations. It is expected that the SNPs on the upper right section of the graph deviate from the diagonal. These SNPs are most likely associated with the trait under study. By default, the QQ plots in GAPIT show only a subset of the larger p-values (i.e., less significant p-values) to reduce the file size of the graph [37,50].
MTAs for stomata size were dispersed overall on seven chromosomes, eleven MTAs at A-genomes, seventeen at B-genomes and two at D-genomes under water shortage stress conditions. Earlier researches had reported MTAs for and stated that, two SNPs situated at chromosomes 1A and 2D are linked with stomata-related attributes under water shortage environments [51]. Thirteen MTAs/QTLs controlling stomatal traits such as stomata size were located on chromosomes 3A, 4A, 6A, 6B, 2D, and 3D, accounting for 7.69 to 22.83% of the phenotypic variation under different water regimes [17,51]. In this experiment, MTAs for SS were dispersed across the three genomes under water shortage environments. Wheat scientists [33] found the significant SNPs on 5A for physiological and yield-related trait under water shortage conditions. Nine significant MTAs/QTLs for stomata frequency were detected on chromosomes 4A, 5A, 6A, 1B, and 2B, explaining from 7.65 to 30.93% of the phenotypic variation under the normal and drought stress conditions [51,52]. MTAs for SF were dispersed across 8 chromosomes with 20 SNPs at A-genomes, 19 at B-genomes and 2 at D-genomes under drought conditions (Supplementary Table S3). The significant MTAs for leaf venation were distributed across A- and B genomes, including 12 SNPs at A-genome, 24 at B-genome, and 2 at D-genome. Thomelin et al. [53] evaluated a water shortage and high temperature tolerant QTL qDHY.3BL in~1Mbp on chromosome 3B, having twenty-two responsible genes for physiological and yield indices. In this trait, 20 SNPs were reported, which showed a significant association [45]. These were situated at chromosomes 1A, 1B, 2A, 3A, 4A, 4B, 6B and 7B, and similar to our findings. Wheat scientists [54] reported that in water shortage environments, grain per spike was significantly linked with eight SNPs situated at chromosomes 1B, 2B, 4B, 6B, 2D and 5D; where in similar conditions, seven significant marker-trait associations were reported which were situated at chromosomes 5A, 1B, 4B, 5B, 6B and 2D and which supports our results for this study.
Highly phenotypic attribute associations can be described in relation to directly or indirectly influencing one attribute to other attributes. Within the genome, these attributes could be controlled by pleiotropic loci. It is proved by the presence of numerous MTAs in which one gene will show the pleiotropic influence on more associated attributes. MTA for NGS were dispersed across three genomes; nineteen at A-genomes, twenty-seven at B-genomes and four at D-genomes under water shortage conditions. Remarkably, wheat scientists identified [33,46] that chromosome 5B harbors a region regulating numerous yield-related attributes which have genomic parts linked with grain per spike. The record noteworthy and steady MTAs/QTL responsible for NGS was observed on chromosomes 1A and 2A commonly found across different environmental conditions [55]. Earlier detected MTAs for controlling NGS and GYP in wheat crop were at chromosomes 1B, 2B, 3A, 7A, 7B and 3D and 5B 1A, 4B, 6B, and 7D, respectively [18].
The marker locus on 5A was correlated with GYP in normal conditions described previously by wheat scientists [33]. Similarly, Edae et al. [46] described significant MTAs for GYP at chromosomes 4A, 1B, 5B, and 2B. Moreover, Lozada et al. [56] also specified MTAs for this trait on chromosomes 5A, 1B, 2B and 4B. MTAs for GYP on 2D, 4A and 1B have been informed by several scientists which described 27% of variations in water shortage conditions [26]. MTAs for GYP recognized in the present study were precise to different environmental conditions suggesting the dynamic nature of genetics corresponding to the grain yield per plant. The highest number of marker-trait associated genome regions and chromosomes are mentioned trait-wise in Table 5.

4.4. Genome-Wide Multiple Traits Loci Associations

Multi-trait loci were seen on chromosomes 1A (FLA, SS, LV, NGS, and GYP), 1B (FLA, SS, SF, LV and GYP), 2A (SS, SF, NGS and GYP), 3B (FLA, SS, SF, LV, NGS and GYP), 4B (FLA, SS, SF, LV, NGS and GYP), 5A (FLA, SS, SF, LV, NGS and GYP), 6B (SS, SF, LV, NGS and GYP), and 7A (FLA, SS, SF, LV, NGS and GYP)) under normal conditions. The Q gene situated at chromosome 5A confirmed the easily threshing of spikes, pleiotropic effects and several domestically associated attributes such as yield and yield-related attributes [18,57,58]. TaTEF-7A and TaMOCI-7A also have been reported as linked with grain per spike and located on chromosome 7A [59]. Multi-trait loci were identified on chromosomes 1A (FLA, SS, SF, LV, NGS and GYP), 1B (SS, SF, LV, GYP), 2A (FLA, SS, SF, LV NGS and GYP), 2B (FLA, SS, SF, LV, NGS and GYP), 2D (FLA, SS, SF, LV, NGS, GYP), 3B (FLA, SS, SF, LV, NGS and GYP), 4A (FLA, SS, SF, LV, NGS and GYP), 4B (FLA, SS, SF, LV, NGS, GYP), 5A (FLA, SS, SF, LV, NGS and GYP), 6B (FLA, SS, SF, LV, NGS and GYP), 7A (FLA, SS, SF, LV, NGS and GYP), and 7B (FLA, SS, SF, LV, NGS and GYP) under water shortage stressed environments (Table 5). QTLs/MTAs were identified by several wheat scientists for stomatal traits on chromosomes 1A, 1B, 2B, and 7A in bread wheat genotypes under different environmental conditions [17]. Therefore, one of the important aspects in wheat breeding for increasing drought tolerance lies in a better understanding of the molecular mechanisms and genetic control of stomatal distribution and opening associated with growth rate and grain yield under abiotic stress [52]. The distal areas of chromosomes 7A and 7B are described to comprise QTL for yellow pigment content of grain, which is directed by Phytoene synthase1 (PSY-1) genes, and the occurrence of these genes can affect the pleiotropic link at 7B [60]. The TaSnRK2 gene that determined sucrose non-fermenting 1-related protein kinase was situated at chromosomes 4A and 4B. Its role is important for responding against several environmental factors, and it depicted significant association with stomata- and yield-related characteristics [25]. Wheat yield-related genes, such as TaGW2-A1 at 6A, TaTGW6-A1 at 3A, TaCwi at 2A, TaGS5-A1/TaGS-D1 at 4A, TaSus1 at 7A, and TaSus2 at 7B have been reported by wheat scientists [60].
A pleiotropic locus is correlated and alters the appearance of several phenotypic attributes. In the current experiment, many pleiotropic loci were recorded, under normal and water shortage environments. Pleiotropic locus (wsnp_Ex_c5412_9564046) on chromosome 2A at 261.05cM was significantly linked with yield and stomata-related characteristics such as FLA, SF, SS, NGS, GYP, NGS and GYP. The markers BS00038787_51 and wsnp_Ex_c24167_33416760 on the same chromosome (7A) at 369.49cM and 148.26cM, respectively, showed pleiotropic effects for observed stomata and yield indices under both environments as shown in Supplementary Tables S2 and S3. In this experiment, multi-character loci for yield- and stomata-related characteristics were recognized on chromosomes 2A, 5A, 4B, 7A, 6B and 7B in both conditions as mentioned in Table 3. These regions would be a useful target for selection in breeding programs. As the interval is still large, fine genetic mapping will be necessary to demonstrate that these MTAs are a unique locus with pleiotropic effects.

5. Conclusions

Drought stress reduced grain yield and strong positive correlation among yield and drought-related attributes such as stomata frequency and leaf venation with grain yield per plant exists. Therefore, selection based on these characteristics would be fruitful, such as the parameter stomata size, which was negatively associated and can affect the performances of other attributes during selection procedures. In this experiment, numerous pleiotropic loci were known, and the examined characteristics such as SF, LV, NGS and GYP were also influenced by a pleiotropic locus (wsnp_Ex_c24167_33416760) on chromosome 7A at 148.26cM under normal environments. The studied characteristics governed by a pleiotropic locus (wsnp_Ex_c8913_14881924) were associated with all of the studied yield- and stomata-related traits which were located on chromosome 4B at 173.63cM under water shortage conditions. The markers BS00038787_51 and wsnp_Ex_c24167_33416760 on the same chromosome (7A) at 369.49cM and 148.26cM, respectively, showed pleiotropic effects for observed stomata and yield indices under both environments. In this experiment, multi-trait loci for yield and water shortage tolerance linked attributes was recognized on chromosomes 2A, 5A, 7A, 4B, 6B and 7B under both conditions.

Supplementary Materials

The following are available online at https://www.mdpi.com/article/10.3390/agronomy11081646/s1, Figure S1: The result obtained of 96 spring wheat genotypes using studied SNPs from Structure Harvester analysis. Figure S2: Population structure of 96 bread wheat accessions. Figure S3–S14: Quantile-quantile (QQ)—plot of p-values. Table S1: Genotypes code, name and pedigree of 96 bread wheat genotypes, Table S2: GWAS Results under normal conditions, Table S3: GWAS Results under water shortage conditions.

Author Contributions

Data curation, M.I. (Muhammad Iqbal), N.S., S.H.; Formal analysis, H.G.M.-D.A., S.H.; Funding acquisition, Y.Z.; Methodology, H.G.M.-D.A., A.U.; Software, M.A.I., M.M.Y.; Project administration, M.N.I., Y.Z., H.R.; Writing—original draft, H.G.M.-D.A.; Validation, M.I. (Muhammad Iqbal); Writing—review and editing, Y.Z., M.I. (Muhammad Imran). All authors have read and agreed to the published version of the manuscript.

Funding

All co-authors acknowledge the China Agriculture Research System (CARS-05-01A-04) and Yawen Zeng.

Institutional Review Board Statement

Not applicable.

Informed Consent Statement

Not applicable.

Conflicts of Interest

The authors declare no conflict of interest.

References

  1. Ayalew, H.; Liu, H.; Börner, A.; Kobiljski, B.; Liu, C.; Yan, G. Genome-Wide Association Mapping of Major Root Length QTLs Under PEG Induced Water Stress in Wheat. Front. Plant Sci. 2018, 9, 1759. [Google Scholar] [CrossRef]
  2. Zhao, T.; Dai, A. The Magnitude and Causes of Global Drought Changes in the Twenty-First Century under a Low–Moderate Emissions Scenario. J. Clim. 2015, 28, 4490–4512. [Google Scholar] [CrossRef]
  3. Ahmed, H.G.M.-D.; Sajjad, M.; Zeng, Y.; Iqbal, M.; Khan, S.H.; Ullah, A.; Akhtar, M.N. Genome-Wide Association Mapping through 90K SNP Array for Quality and Yield Attributes in Bread Wheat against Water-Deficit Conditions. Agriculture 2020, 10, 392. [Google Scholar] [CrossRef]
  4. Dixon, J.; Braun, H.-J.; Kosina, P.; Crouch, J.H. Wheat Facts and Futures 2009; CIMMYT: Mexico-Veracruz, Mexico, 2009. [Google Scholar]
  5. Ahmed, H.G.M.-D.; Khan, A.S.; Kashif, M.; Khan, S.H. Genetic analysis of yield and physical traits of spring wheat grain. J. Natl. Sci. Found. Sri Lanka 2018, 46, 23. [Google Scholar] [CrossRef]
  6. Ahmed, H.G.M.-D.; Zeng, Y.; Yang, X.; Anwaar, H.A.; Mansha, M.Z.; Hanif, C.M.S.; Ikram, K.; Ullah, A.; Alghanem, S.M.S. Conferring Drought-Tolerant Wheat Genotypes through Morpho-Physiological and Chlorophyll Indices at Seedling Stage. Saudi J. Biol. Sci. 2020, 27, 2116–2123. [Google Scholar] [CrossRef]
  7. Toker, C.; Canci, H.; Yildirim, T. Evaluation of perennial wild Cicer species for drought resistance. Genet. Resour. Crop. Evol. 2007, 54, 1781–1786. [Google Scholar] [CrossRef]
  8. Ahmed, H.; Khan, A.S.; Muhammad, K.; Khan, S.H. Genetic Mechanism of Leaf Venation and Stomatal Traits for Breeding Drought Tolerant Lines in Wheat. Bangladesh J. Bot. 2017, 46, 35–41. [Google Scholar]
  9. Mir, R.R.; Zaman-Allah, M.; Sreenivasulu, N.; Trethowan, R.; Varshney, R.K. Integrated genomics, physiology and breeding approaches for improving drought tolerance in crops. Theor. Appl. Genet. 2012, 125, 625–645. [Google Scholar] [CrossRef] [PubMed] [Green Version]
  10. Ahmad, I.; Khaliq, I.; Khan, A.S.; Farooq, M. Screening of Spring Wheat (Triticum Aestivum L.) Genotypes for Drought Tolerance on the Basis of Seedling Traits. Pak. J. Agric. Sci. 2014, 51, 367–372. [Google Scholar]
  11. Ashfaq, W.; Ul-Allah, S.; Kashif, M.; Sattar, A.; Nabi, H.G. Genetic Variability Study among Wheat Genotypes under Normal and Drought Conditions. J. Glob. Innov. Agric. Soc. Sci. 2016, 4, 111–116. [Google Scholar] [CrossRef]
  12. Noorka, I.R.; Batool, A.; Rauf, S.; Teixeira da Silva, J.; Ashraf, E. Estimation of Heterosis in Wheat (Triticum Aestivum L.) under Contrasting Water Regimes. Int. J. Plant Breed. 2013, 7, 55–60. [Google Scholar]
  13. Ahmed, H.; Sajjad, M.; Li, M.; Azmat, M.; Rizwan, M.; Maqsood, R.; Khan, S. Selection Criteria for Drought-Tolerant Bread Wheat Genotypes at Seedling Stage. Sustainability 2019, 11, 2584. [Google Scholar] [CrossRef] [Green Version]
  14. Adopted, I. Climate Change 2014 Synthesis Report; IPCC: Geneva, Switzerland, 2014. [Google Scholar]
  15. Merchuk-Ovnat, L.; Fahima, T.; Ephrath, J.E.; Krugman, T.; Saranga, Y. Ancestral QTL Alleles from Wild Emmer Wheat Enhance Root Development under Drought in Modern Wheat. Front. Plant Sci. 2017, 8, 703. [Google Scholar] [CrossRef] [PubMed]
  16. Khan, A.; Khaliq, I.; Saddam, M.S.; Zafar, S.; Aslam, W.; Muhammad, D. Estimation of Genetic Mechanism of Stomatal Traits Influencing Grain Yield in Hexaploid Wheat (Triticum Aestivum L.). Int. J. Biosci. 2015, 6, 72–77. [Google Scholar]
  17. Shahinnia, F.; Le Roy, J.; Laborde, B.; Sznajder, B.; Kalambettu, P.; Mahjourimajd, S.; Tilbrook, J.; Fleury, D. Genetic association of stomatal traits and yield in wheat grown in low rainfall environments. BMC Plant Biol. 2016, 16, 1–14. [Google Scholar] [CrossRef]
  18. Ain, Q.-U.; Rasheed, A.; Anwar, A.; Mahmood, T.; Imtiaz, M.; Xia, X.; He, Z.; Quraishi, U.M. Genome-wide association for grain yield under rainfed conditions in historical wheat cultivars from Pakistan. Front. Plant Sci. 2015, 6, 743. [Google Scholar] [CrossRef] [PubMed] [Green Version]
  19. Khan, A.; Khaliq, I.; Ahmad, M.; Ahmed, H.; Khan, A.G.; Farooq, M.S. Comparative Performance of Spring Wheat (Triticum Aestivum L.) through Heat Stress Indices. Pak. J. Bot. 2018, 50, 481–488. [Google Scholar]
  20. Ahmed, H.; Khan, A.S.; Khan, S.H.; Kashif, M. Genome Wide Allelic Pattern and Genetic Diversity of Spring Wheat Genotypes through Ssr Markers. Int. J. Agric. Biol. 2017, 19, 1559–1565. [Google Scholar]
  21. Rahimi, Y.; Bihamta, M.R.; Taleei, A.; Alipour, H.; Ingvarsson, P. Genome-wide association study of agronomic traits in bread wheat reveals novel putative alleles for future breeding programs. BMC Plant Biol. 2019, 19, 1–19. [Google Scholar] [CrossRef] [Green Version]
  22. Sharma, R.C.; Crossa, J.; Velu, G.; Huerta-Espino, J.; Vargas, M.; Payne, T.S.; Singh, R.P. Genetic Gains for Grain Yield in CIMMYT Spring Bread Wheat across International Environments. Crop. Sci. 2012, 52, 1522–1533. [Google Scholar] [CrossRef] [Green Version]
  23. Sukumaran, S.; Lopes, M.; Dreisigacker, S.; Reynolds, M.P. Correction to: Genetic analysis of multi-environmental spring wheat trials identifies genomic regions for locus-specific trade-offs for grain weight and grain number. Theor. Appl. Genet. 2018, 131, 999. [Google Scholar] [CrossRef] [Green Version]
  24. Aisawi, K.A.B.; Reynolds, M.P.; Singh, R.P.; Foulkes, J. The Physiological Basis of the Genetic Progress in Yield Potential of CIMMYT Spring Wheat Cultivars from 1966 to 2009. Crop. Sci. 2015, 55, 1749–1764. [Google Scholar] [CrossRef]
  25. Sukumaran, S.; Dreisigacker, S.; Lopes, M.; Chavez, P.; Reynolds, M.P. Genome-wide association study for grain yield and related traits in an elite spring wheat population grown in temperate irrigated environments. Theor. Appl. Genet. 2015, 128, 353–363. [Google Scholar] [CrossRef] [PubMed]
  26. Tadesse, W.; Ogbonnaya, F.C.; Jighly, A.; Sanchez-Garcia, M.; Sohail, Q.; Rajaram, S.; Baum, M. Genome-Wide Association Mapping of Yield and Grain Quality Traits in Winter Wheat Genotypes. PLoS ONE 2015, 10, e0141339. [Google Scholar] [CrossRef] [Green Version]
  27. Sorkheh, K.; Malysheva-Otto, L.V.; Wirthensohn, M.G.; Tarkesh-Esfahani, S.; Martínez-Gómez, P. Linkage Disequilibrium, Genetic Association Mapping and Gene Localization in Crop Plants. Genetics Mol. Biol. 2008, 31, 805–814. [Google Scholar] [CrossRef]
  28. Noorka, I.R.; Teixeira da Silva, J.A. Physical and Morphological Markers for Adaptation of Drought-Tolerant Wheat to Arid Environments. Pak. J. Agric. Sci. 2014, 51, 943–952. [Google Scholar]
  29. Muller, J. Determining Leaf Surface Area by Means of a Wheat Osmoregulation Water Use: The Challenge. Agric. Meteorol. 1991, 14, 311–320. [Google Scholar]
  30. Sheehan, D.; Hrapchak, B. Theory and Practice of Histotechnology, 2nd ed.; Mosby, C.V., Ed.; The CV Mosby Company: St. Louis, MO, USA, 1980. [Google Scholar]
  31. Payne, R. A Guide to Anova and Design in Genstat; VSN International: Hempstead, UK, 2008. [Google Scholar]
  32. Spss, I. Ibm Spss Statistics Version 21; International Business Machines Corp: Boston, MA, USA, 2012; p. 126. [Google Scholar]
  33. Qaseem, M.F.; Qureshi, R.; Muqaddasi, Q.H.; Shaheen, H.; Kousar, R.; Röder, M. Genome-wide association mapping in bread wheat subjected to independent and combined high temperature and drought stress. PLoS ONE 2018, 13, e0199121. [Google Scholar] [CrossRef] [Green Version]
  34. Dreisigacker, S.; Tiwari, R.; Sheoran, S. Laboratory Manual: Icar-Cimmyt Molecular Breeding Course in Wheat; CIMMYT: Mexico-Veracruz, Mexico, 2013. [Google Scholar]
  35. Wang, S.; Wong, D.; Forrest, K.; Allen, A.; Chao, S.; Huang, B.E.; Maccaferri, M.; Salvi, S.; Milner, S.G.; Cattivelli, L.; et al. Characterization of polyploid wheat genomic diversity using a high-density 90 000 single nucleotide polymorphism array. Plant Biotechnol. J. 2014, 12, 787–796. [Google Scholar] [CrossRef] [PubMed] [Green Version]
  36. Earl, D.A.; Vonholdt, B.M. Structure Harvester: A Website and Program for Visualizing Structure Output and Implementing the Evanno Method. Conserv. Genet. Resour. 2012, 4, 359–361. [Google Scholar] [CrossRef]
  37. Lipka, A.E.; Tian, F.; Wang, Q.; Peiffer, J.; Li, M.; Bradbury, P.J.; Gore, M.; Buckler, E.; Zhang, Z. GAPIT: Genome association and prediction integrated tool. Bioinformatics 2012, 28, 2397–2399. [Google Scholar] [CrossRef] [Green Version]
  38. Benjamini, Y.; Hochberg, Y. Controlling the False Discovery Rate: A Practical and Powerful Approach to Multiple Testing. J. R. Stat. Soc. Ser. B 1995, 57, 289–300. [Google Scholar] [CrossRef]
  39. Li, H.; Peng, Z.; Yang, X.; Wang, W.; Fu, J.; Wang, J.; Han, Y.; Chai, Y.; Guo, T.; Yang, N.; et al. Genome-wide association study dissects the genetic architecture of oil biosynthesis in maize kernels. Nat. Genet. 2013, 45, 43–50. [Google Scholar] [CrossRef]
  40. Pritchard, J.K.; Stephens, M.; Rosenberg, N.; Donnelly, P. Association Mapping in Structured Populations. Am. J. Hum. Genet. 2000, 67, 170–181. [Google Scholar] [CrossRef] [Green Version]
  41. Yu, J.; Zhang, Z.; Zhu, C.; Tabanao, D.A.; Pressoir, G.; Tuinstra, M.R.; Kresovich, S.; Todhunter, R.J.; Buckler, E. Simulation Appraisal of the Adequacy of Number of Background Markers for Relationship Estimation in Association Mapping. Plant Genome 2009, 2, 63–77. [Google Scholar] [CrossRef] [Green Version]
  42. Yu, J.; Pressoir, G.; Briggs, W.H.; Bi, I.V.; Yamasaki, M.; Doebley, J.F.; McMullen, M.D.; Gaut, B.S.; Nielsen, D.M.; Holland, J.B.; et al. A unified mixed-model method for association mapping that accounts for multiple levels of relatedness. Nat. Genet. 2006, 38, 203–208. [Google Scholar] [CrossRef]
  43. Dodig, D.; Zoric, M.; Kobiljski, B.; Savić, J.; Kandić, V.; Quarrie, S.; Barnes, J. Genetic and Association Mapping Study of Wheat Agronomic Traits Under Contrasting Water Regimes. Int. J. Mol. Sci. 2012, 13, 6167–6188. [Google Scholar] [CrossRef] [Green Version]
  44. Zampieri, M.; Ceglar, A.; Dentener, F.; Toreti, A. Wheat yield loss attributable to heat waves, drought and water excess at the global, national and subnational scales. Environ. Res. Lett. 2017, 12, 064008. [Google Scholar] [CrossRef]
  45. ElBasyoni, I.; Saadalla, M.; Baenziger, S.; Bockelman, H.; Morsy, S. Cell Membrane Stability and Association Mapping for Drought and Heat Tolerance in a Worldwide Wheat Collection. Sustainability 2017, 9, 1606. [Google Scholar] [CrossRef] [Green Version]
  46. Edae, E.A.; Byrne, P.F.; Haley, S.D.; Lopes, M.S.; Reynolds, M.P. Genome-Wide Association Mapping of Yield and Yield Components of Spring Wheat under Contrasting Moisture Regimes. Theor. Appl. Genet. 2014, 127, 791–807. [Google Scholar] [CrossRef]
  47. Daba, S.D.; Tyagi, P.; Brown-Guedira, G.; Mohammadi, M.M. Genome-Wide Association Studies to Identify Loci and Candidate Genes Controlling Kernel Weight and Length in a Historical Us Wheat Population. Front. Plant Sci. 2018, 9, 1045. [Google Scholar]
  48. Su, J.; Zhang, F.; Chong, X.; Song, A.; Guan, Z.; Fang, W.; Chen, F. Genome-wide association study identifies favorable SNP alleles and candidate genes for waterlogging tolerance in chrysanthemums. Hortic. Res. 2019, 6, 1–13. [Google Scholar] [CrossRef] [PubMed]
  49. Tang, Y.; Liu, X.; Wang, J.; Li, M.; Wang, Q.; Tian, F.; Su, Z.; Pan, Y.; Liu, D.; Lipka, A.E.; et al. GAPIT Version 2: An Enhanced Integrated Tool for Genomic Association and Prediction. Plant Genome 2016, 9. [Google Scholar] [CrossRef] [Green Version]
  50. Liu, X.; Huang, M.; Fan, B.; Buckler, E.; Zhang, Z. Iterative Usage of Fixed and Random Effect Models for Powerful and Efficient Genome-Wide Association Studies. PLoS Genet. 2016, 12, e1005767. [Google Scholar] [CrossRef] [PubMed]
  51. Wang, S.-G.; Jia, S.-S.; Sun, D.-Z.; Fan, H.; Chang, X.-P.; Jing, R.-L. Mapping QTLs for stomatal density and size under drought stress in wheat (Triticum aestivum L.). J. Integr. Agric. 2016, 15, 1955–1967. [Google Scholar] [CrossRef] [Green Version]
  52. ShuguangWang, F.D.; Sun, Y.C.D.; Yan, R.J.X. QTL analysis for stomatal density and size in wheat spike organ. Emir. J. Food Agric. 2018, 173–179. [Google Scholar] [CrossRef] [Green Version]
  53. Thomelin, P.; Bonneau, J.; Taylor, J.; Choulet, F.; Sourdille, P.; Langridge, P. Positional Cloning of a Qtl, Qdhy. 3bl, on Chromosome 3bl for Drought and Heat Tolerance in Bread Wheat. In Proceedings of the Plant and Animal Genome Conference (PAG XXIV), San Diego, CA, USA, 9 January 2016. [Google Scholar]
  54. Mwadzingeni, L.; Shimelis, H.; Rees, J.; Tsilo, T.J. Genome-wide association analysis of agronomic traits in wheat under drought-stressed and non-stressed conditions. PLoS ONE 2017, 12, e0171692. [Google Scholar] [CrossRef] [Green Version]
  55. Gizaw, S.A. Genome-Wide Association Studies of Drought Resistance and Yield Potential in Wheat (Triticum Aestivum L.) Using Agronomic and Remotely Sensed Traits; ProQuest LLC: Ann Arbor, MI, USA, 2015. [Google Scholar]
  56. Lozada, D.N.; Mason, R.E.; Babar, A.; Carver, B.F.; Guedira, G.-B.; Merrill, K.; Arguello, M.N.; Acuna, A.; Vieira, L.; Holder, A.; et al. Association mapping reveals loci associated with multiple traits that affect grain yield and adaptation in soft winter wheat. Euphytica 2017, 213, 222. [Google Scholar] [CrossRef]
  57. Ogbonnaya, F.C.; Rasheed, A.; Okechukwu, E.C.; Jighly, A.; Makdis, F.; Wuletaw, T.; Hagras, A.; Uguru, M.I.; Agbo, C.U. Genome-wide association study for agronomic and physiological traits in spring wheat evaluated in a range of heat prone environments. Theor. Appl. Genet. 2017, 130, 1819–1835. [Google Scholar] [CrossRef]
  58. Abbas, M.; Sheikh, A.; Sabir, H.M.; Nighat, S. Factors Responsible for Low Wheat Productivity in Central Punjab. Pak. J. Agric. Sci. 2005, 42, 3–4. [Google Scholar]
  59. Bordes, J.; Goudemand, E.; Duchalais, L.; Chevarin, L.; Oury, F.X.; Heumez, E.; Lapierre, A.; Perretant, M.R.; Rolland, B.; Béghin, D.; et al. Genome-wide association mapping of three important traits using bread wheat elite breeding populations. Mol. Breed. 2013, 33, 755–768. [Google Scholar] [CrossRef]
  60. Zhang, W.; Dubcovsky, J. Association between allelic variation at the Phytoene synthase 1 gene and yellow pigment content in the wheat grain. Theor. Appl. Genet. 2008, 116, 635–645. [Google Scholar] [CrossRef] [Green Version]
Figure 1. Manhattan plot of flag leaf area (FLA) under normal (N) (A) and water shortage (WS) (B) conditions. Manhattan plots showing the location of significant SNPs and −log10(p) associated with flag leaf area in bread wheat under normal and water shortage conditions. The red horizontal line on Manhattan plot entitles the threshold level (p < 0.0001) of significance for SNPs with this trait.
Agronomy 11 01646 g001
Figure 2. Manhattan plot of stomata size (SS) under normal (N) (A) and water shortage (WS) (B) conditions. Manhattan plots showing the location of significant SNPs and −log10(p) associated with stomata size in bread wheat under normal and water shortage conditions. The red horizontal line on Manhattan plot entitles the threshold level (p < 0.0001) of significance for SNPs with this trait.
Agronomy 11 01646 g002
Figure 3. Manhattan plot of stomata frequency (SF) under normal (N) (A) and water shortage (WS) (B) conditions. Manhattan plots showing the location of significant SNPs and −log10(p) associated with stomata frequency in bread wheat under normal and water shortage conditions. The red horizontal line on Manhattan plot entitles the threshold level (p < 0.0001) of significance for SNPs with this trait.
Agronomy 11 01646 g003
Figure 4. Manhattan plot of leaf venation (LV) under normal (N) (A) and water shortage (WS) (B) conditions. Manhattan plots showing the location of significant SNPs and −log10(p) associated with leaf venation in bread wheat under normal and water shortage conditions. The red horizontal line on Manhattan plot entitles the threshold level (p < 0.0001) of significance for SNPs with this trait.
Agronomy 11 01646 g004
Figure 5. Manhattan plot of number of grain per spike (NGS) under normal (N) (A) and water shortage (WS) (B) conditions. Manhattan plots showing the location of significant SNPs and −log10(p) associated with number of grain per spike in bread wheat under normal and water shortage conditions. The red horizontal line on Manhattan plot entitles the threshold level (p < 0.0001) of significance for SNPs with this trait.
Agronomy 11 01646 g005
Figure 6. Manhattan plot of grain yield per plant (GYP) under normal (N) (A) and water shortage (WS) (B) conditions. Manhattan plots showing the location of significant SNPs and −log10(p) associated with grain yield per plant in bread wheat under normal and water shortage conditions. The red horizontal line on Manhattan plot entitles the threshold level (p < 0.0001) of significance for SNPs with this trait.
Agronomy 11 01646 g006
Table 1. Mean sum of squares of 96 spring wheat genotypes for studied attributes under both seasons, data averaged over environments.
SourceDF/
Season
FLASSSFLVNGSGYP
S1S2S1S2S1S2S1S2S1S2S1S2
REP2958805 **6.537.414.042.775.656.4843.3642.1840.4862.85
GET9546.8 **56.0 **36.2 **34.6 **36.66 **36.05 **36.30 **35.46 **297.18 **280.91 **147.58 **143.89 **
LEL19331 **9121 **4090.8 *4196.93457.44 *3559.24 *581.77 *490.11 **570.25 *415.06441 **424.61 *
GET × LEL956.44 **8.22 **18.43 **18.09 **16.38 **20.29 **17.95 **19.28 **137.13 **149 **100.08 **106.65 **
Error3822.915.014.995.195.44.325.065.248.2749.6628.6327.84
Total575
Heritability 73.5281.1969.2165.3854.6761.0068.2965.9864.3360.8257.7056.26
S1 = season 1 (2016–2017), S2 = season 2 (2017–2018), REP = Replication, GET= genotypes, LEL= level, DF= degree of freedom, flag leaf area (FLA), stomata size (SS), stomata frequency (SF), leaf venation (LV), number of grain per spike (NGS) and grain yield per plant (GYP), N = normal (N), water shortage (WS) and Env = environment, * = Significant (α = 0.05) and ** = Highly significant (α = 0.01).
Table 2. Summary statistics of studied attributes under both conditions based on data averaged over years.
TableFLASSSFLVNGSGYP
NWSNWSNWSNWSNWSNWS
Mean33.218.23699348013.2512.77.817.5451.53322.5015.4
Variance4.135.9110.6913.1610.6910.7116.7610.9689.9799.949.3952.31
SE0.210.250.330.370.330.360.410.320.960.990.710.74
Flag leaf area (FLA), stomata size (SS), stomata frequency (SF), leaf venation (LV), number of grain per spike (NGS) and grain yield per plant (GYP), N = normal (N), water shortage (WS) and Env = environment.
Table 3. Pearson’s Correlation coefficient of studied attributes based on data averaged over years under normal and water shortage environments.
TraitsEnv.FLASSSFLVNGS
SSN−0.22
WS−0.20
SFN0.36 *0.39 *
WS0.38 *0.41 *
LVN0.45 *0.340.91 **
WS0.37 *0.330.84 **
NGSN0.76 **−0.220.56 **0.56 **
WS0.77 **0.180.91 **0.89 **
GYPN0.88 **−0.090.88 **0.92 **0.56 **
WS0.81 **−0.120.84 **0.83 **0.89 **
Flag leaf area (FLA), stomata size (SS), stomata frequency (SF), leaf venation (LV), number of grain per spike (NGS) and grain yield per plant (GYP), N = normal (N), water shortage (WS) = water shortage, Env = environment, * = Significant (α = 0.05) and ** = Highly significant (α = 0.01).
Table 4. Best performance wheat genotypes under both environments on data averaged over years.
TraitNormal ConditionsWater Shortage
FLAG-9244 followed by G-9610, G-9883, C-586642 and G-9493G-586642 followed by G-9610, G-9493, G-9883and G-9244
SSG-9610 followed by G-9244, G-9883, C-586642 and G-9493G-9610 followed by C-586642, G-9883, G-9244 and G-9493
SFG-9610 followed by G-9244, G-9883 C-586642 and G-9493G-9610 followed by G-9244, G-9883, C-586642 and G-9493
LVG-9610 followed by C-586642, G-9610, G-9244 and G-9493G-9610 followed by G-9244, G-9883, C-586642 and G-9493
NGSG-9244 followed by G-9610, G-9493, C-586642 and G-9883G-9610 followed by G-9244, G-9883, C-586642 and G-9493
GYPG-9493 followed by G-9796, G-9610, G-9883 and G-9244G-9493 followed by G-9796, G-9610, G-9244 and G-9883
Flag leaf area (FLA), stomata size (SS), stomata frequency (SF), leaf venation (LV), number of grain per spike (NGS) and grain yield per plant (GYP).
Table 5. Highest number of Significant MTAs in 105 bread wheat genotypes.
Significant MTAs
Genome and Chromosome Wise DistributionCharacteristics Wise Distribution
Genome Normal Water ShortageTraits Normal Water Shortage
A-GenomeTotal 75 MTAs (1A = 8, 2A = 14, 3A = 3,
4A = 16, 5A = 9, 6A = 2, 7A = 23)
Total 92 MTAs (1A = 9, 2A = 22, 3A = 3, 4A = 24, 5A = 10, 7A = 24)FLA1950
SS3029
B-GenomeTotal 86 MTAs (1B = 8, 2B = 4, 3B = 16,
4B = 16, 5B = 11, 6B = 24, 7B = 7)
Total 140 MTAs (1B = 9, 2B = 7, 3B = 14, 4B = 28, 5B = 12, 6B = 57, 7B = 13)SF1941
LV3237
D-genomeTotal 17 MTAs (1D = 2, 2D = 9, 3D = 3,
6D = 2, 7D = 1)
Total 12 MTAs (2D = 6, 3D = 3, 6D = 3) NGS4750
GYP3137
MTAs = Markers Traits Associations, Flag leaf area (FLA), stomata size (SS), stomata frequency (SF), leaf venation (LV), number of grain per spike (NGS) and grain yield per plant (GYP).
Publisher’s Note: MDPI stays neutral with regard to jurisdictional claims in published maps and institutional affiliations.

