Article

Contribution of Wild Relatives to Durum Wheat (Triticum turgidum subsp. durum) Yield Stability across Contrasted Environments

1
International Center for Agricultural Research in the Dry Areas (ICARDA), Rabat 10000, Morocco
2
Plant and Microbial Biotechnology, Biodiversity and Environmental Research Center, Faculty of Sciences, Mohammed V University of Rabat, Rabat 10000, Morocco
3
Former head of Genetic Resources Unit, ICARDA, 15000 Praha, Czech Republic
*
Author to whom correspondence should be addressed.
Agronomy 2021, 11(10), 1992; https://doi.org/10.3390/agronomy11101992
Submission received: 6 August 2021 / Revised: 1 September 2021 / Accepted: 4 September 2021 / Published: 1 October 2021
(This article belongs to the Special Issue Wheat Agronomic and Quality Responses to Environmental Impacts)

Abstract

:
Durum wheat (Triticum turgidum subsp. durum) is mostly grown in Mediterranean type environments, characterized by unpredictable rainfall amounts and distribution, heat stress, and prevalence of major diseases and pests, all to be exacerbated with climate change. Pre-breeding efforts transgressing adaptive genes from wild relatives need to be strengthened to overcome these abiotic and biotic challenges. In this study, we evaluated the yield stability of 67 lines issued from interspecific crosses of Cham5 and Haurani with Triticum dicoccoides, T. agilopoides, T. urartu, and Aegilops speltoides, grown under 15 contrasting rainfed and irrigated environments in Morocco, and heat-prone conditions in Sudan. Yield stability was assessed using parametric (univariate (e.g., Bi, S2di, Pi etc) and multivariate (ASV, SIPC)) and non-parametric (Si1, Si2, Si3 and Si6) approaches. The combined analysis of variance showed the highly significant effects of genotypes, environments, and genotype-by-environment interaction (GEI). The environments varied in yield (1370–6468 kg/ha), heritability (0.08–0.9), and in their contribution to the GEI. Several lines derived from the four wild parents combined productivity and stability, making them suitable for unpredictable climatic conditions. A significant advantage in yield and stability was observed in Haurani derivatives compared to their recurrent parent. Furthermore, no yield penalty was observed in many of Cham5 derivatives; they had improved yield under unfavorable environments while maintaining the high yield potential from the recurrent parent (e.g., 142,026 and 142,074). It was found that a limited number of backcrosses can produce high yielding/stable germplasm while increasing diversity in a breeding pipeline. Comparing different stability approaches showed that some of them can be used interchangeably; others can be complementary to combine broad adaption with higher yield.

1. Introduction

Durum wheat (Triticum turgidum subsp. durum (Desf.)) is an important cereal cultivated worldwide with an annual production of 40 million tones [1]. Its importance worldwide is the result of its grain characteristics, which make it suitable to develop various products namely, pasta, couscous, and burghul among others [2]. Most of the area cultivated with durum wheat is in the Mediterranean region, accounting for 60% of global production [3].
Durum wheat is generally grown under the rainfed conditions of the semi-arid regions, where it is exposed to several biotic and abiotic stresses [1,4]. For instance, Hessian fly (Mayetiola destructor), a major pest for wheat in North America and the temperate Mediterranean drylands, can cause significant yield losses of more than 30% in Morocco [5,6]. Diseases such as leaf rust, stem rust and root rot are important in west Asia and north Africa [7]. Their economic impact has been documented [8,9], and new, more virulent strains of leaf rust and stripe rust are emerging in Europe, especially in France and Spain [10,11]. In terms of abiotic stresses, drought and high temperatures decrease wheat yields worldwide and their frequency is expected to increase under climate change [12,13,14].
These stresses, combined with different crop management practices, increase genotype-by-environment interactions (GEI) and affect yield stability [15,16,17]. Between 1985 and 2017, changes in climatic conditions accounted for 70% of the year to year variation in GEI and crossover interactions GEI for bread and durum wheat yields [18]. Crossover interactions imply changes in genotype rankings, and reduce the selection efficiency for superior and stable genotypes. In fact, low stability has been recognized as an important factor in the gap between potential and actual yield [19,20,21]. Breeding stable genotypes with high yield potential therefore becomes essential for the sustainable production of durum wheat under variable environments [22].
Coping with high environmental variation requires germplasm with high plasticity, which can be supplied by crop wild relatives [23,24]. Durum wheat has a rich gene pool that has been used extensively in breeding for yield, pest, disease resistance, and end use quality [25,26]. Triticum dicoccoides was identified as a source of resistance to leaf rust and stripe rust, and for improved concentrations of protein, zinc, and iron [27,28,29,30]. Resistance to leaf rust, stripe rust, stem rust, powdery mildew and wheat blast was introgressed from several Aegilops and wild Triticum species from the primary, secondary, and tertiary wheat gene pool (Triticum monococcum subsp. Aegilopoides, Triticum urartu, Aegilops speltoides, Aegilops sharonensis, Aegilops kotschyi, Aegilops tauschii and Aegilops ventricosa) [31,32,33,34,35,36,37]. Hessian fly resistance was identified in Aegilops tauschii, Aegilops geniculata, Aegilops ventricosa, Aegilops cylindrica, Aegilops neglecta and Triticum araraticum [38,39]. Drought adaptive traits were identified in Triticum dicoccoides and Aegilops tauschii [29,40], and tolerance to high temperature was found in Aegilops geniculata, Aegilops speltoides and Aegilops longissima [41]. The mobilization of these traits into a cultivated gene pool through pre-breeding can improve wheat productivity, resilience, and genetic diversity simultaneously [42,43].
In addition to harnessing diversity, several statistical approaches have been suggested to account for GEI and select stable genotypes. The regression coefficient (Bi) and the squared deviation from regression (S2di) [44,45] are widely used to measure phenotypic stability. Wricke ecovalence (Wi2) [46] and stability variance (σi2) [47] have also been suggested, to make selections based on the contribution of each genotype to the GEI. These two approaches are similar for the ranking of genotypes [48]. Francis and Kannenberg [49] recommended the coefficient of variation (CV), while environment variance (EV) was proposed by Roemer [50] (cited by (Becker and Leon [48]) to select stable genotypes based on low variance. Genotypic superiority (Pi) [51] uses the mean squared distance between each genotype and the maximum response in each environment as a stability measure. These approaches rely on absolute data, and on the assumption of normal distribution and homogeneity of the variance. Non-parametric stability approaches are suggested based on genotype ranking with no assumptions related to data distribution. Four non-parametric indices are recommended by Huehn [52] and Nassar and Huehn [53]. Si1 is the mean of absolute rank difference over environment, Si2 is the variance of the ranks, Si3 is the sum of absolute deviations and Si6 is the relative sum of squares of rank for genotype.
The additive main effects and multiplicative interaction (AMMI) [54,55] is a multivariate model that is used extensively to analyze multi-environment trials with complex GEI structures. Several stability indices are derived from the AMMI model using interaction principal components [56,57,58]. Recently, Olivoto et al. [59] suggested the use of weighed averages of absolute scores (WAAS) as a multivariate analysis technique using mixed models. The derived superiority index (WAASY) offers the flexibility to balance stability and productivity, based on the population and the objective of the selection.
These different parameters select stable genotypes based on two stability concepts. The “biological concept” selects genotypes which have consistent performance with minimal variation across environments. In general, these genotypes will not respond to improvement in the environmental conditions, nor increase the yield in favorable environments. The “agronomic concept” defines a stable genotype as one with the minimum contribution to the GEI. According to the agronomic concept, stable genotypes will respond to change in the environments [48].
This research was conducted to study the contribution of durum wheat wild relatives to yield stability under different environments characterized by drought, heat, and disease pressure, and under optimal conditions. Different stability approaches were used to characterize both the germplasm stability and the relationships between the testing environments.

2. Materials and Methods

2.1. Plant Material

The germplasm tested here is composed of 67 lines of backcrossing populations derived from interspecific crosses of two durum wheat cultivars (Haurani and Cham5) with four wild wheat progenitors. 29 lines were derived from hybridization with the tetraploid progenitor (Triticum turgidum subsp. dicoccoides (syn. Triticum dicoccoides), and 47 lines from crosses with the three diploid ancestors Triticum monococcum subsp. aegilopoides (syn. Triticum aegilopoides), Triticum urartu and Aegilops speltoides. The choice of the recurrent parent was based on the local adaptation and drought tolerance of Haurani. Cham5, on the other hand, is a high yielding variety released in several countries from the ICARDA breeding program. The wild parents were selected based on their origins and the available information on their resistance to disease (mainly leaf rust). Table 1 provides a summary of the number of lines derived from each cross, with the number of backcrosses and a detailed list with DOIs given in Supplementary Table S1. The two recurrent parents and eight checks, including the released varieties and the ICARDA elite lines, were included in the trials and represented 13% of the total nursery.

2.2. Testing Environments and Experimental Design

The trials were conducted in 15 environments representing six locations during different seasons, between 2015 and 2018. Five locations were in Morocco, representing the Mediterranean hot and temperate environments, while Wad Medani in Sudan represented the hot and irrigated environment (Table 2). At Tessaout and Melk Zher, two trials were planted in the same season with different water regimes, one under full irrigation (FIR) and the second under rainfed (RFD) or supplemental irrigation (SIR). The purpose was to assess yield losses and the effects of late drought by comparing the two treatments/environments. At Tessaout, the fully irrigated trials received six irrigations, the first one at sowing, and the rest supplemented at different growth stages. The drought-stressed trials at Tessaout were irrigated only at sowing to ensure simultaneous germination with the irrigated trials. At Melk Zher, drip irrigation was used to supply a total of 411 mm for MZIR-16. MZRF-16 (the stressed environment) received 127 mm between rainfall and irrigation. The trials at Wad Medani were irrigated at an interval of seven days. All other trials were conducted under rainfed conditions, with the exception of Marchouch during the 2016 season, which received one supplementary irrigation during the vegetative stage.
The trials were randomized in an incomplete block design (alpha-lattice) with two replications. Each replication was composed of eleven incomplete blocks, with seven plots in each block. Each plot consisted of four rows of two meters length, with a distance of 0.25–0.30 m between rows, and a sowing density of 300 seeds/m2. The recommended agronomic practices (land preparation, fertilizers, weeding, etc.) for each environment were applied. At maturity, the grain yield (GY) was estimated by harvesting and weighing the two internal rows, avoiding the borders, and then converting to kg/ha.

2.3. Data Analysis

2.3.1. Analysis of Variance and Genotype by Environment Interaction

In order to investigate the genotype-by-environment interaction (GEI) and estimate the variance components, a linear mixed model and an Additive Main Effects and Multiplicative Interaction Model (AMMI) [54,55] were used for the analysis of variance. The mixed model was fitted using the sommer R package [60] in R version 4.0.4 [61] with the environment as fixed effects, and the genotypes and GEI as random effects. Diagonal variance structures were used to account for the heterogenous residual variance between environments, and therefore to estimate the residual variance in each environment. Similarly, the replication and block effects were considered heterogenous and estimated in each environment as random effects. The genotypic effects allowed the computation of the best linear unbiased prediction (BLUP) across environments for each genotype. The Metan R package [62] was used to perform the AMMI model and the results were used to compute stability parameters based on the interaction principal components from AMMI. The best linear unbiased estimations (BLUEs) in each environment were computed using Meta-R software [63]. The BLUEs were used to run a genotype and genotype-by-environment interaction model (GGE) [64] using the GGEBiplots R package [65]. The GGE model was used to assess the representativeness and discrimination of each environment. Meta-R was also used to estimate the genetic correlation (ρg) between environments for grain yield, following Equation (1) from Cooper and DeLacy [66].
ρ g i j = ρ p i j h i h j
where, ρgij is the genetic correlation, ρpij is the phenotypic correlation between the environments i and j, hi and hj are the broad sense heritabilities in environments i and j, respectively.

2.3.2. Analysis of Stability

The BLUPs computed from the linear mixed model were the first stability parameter used for the ranking of genotypes. The stability indices derived from the AMMI model were sums of the absolute values of the IPCA scores [56] and AMMI stability values (ASV) [57]. The SIPC and ASV were computed according to Equations (2) and (3), respectively.
SIPC = k = 1 P | λ k 0.5 α i k |
where P is the number of IPCs retained via the F-test, λk is the eigenvalue of the kth IPC and αik is the genotype principal component score.
A S V = [ S S I P C 1 S S I P C 2 ( I P C 1 ) ] 2 + ( I P C 2 ) 2
where SSIPC1 and SSIPC2 are the sum of squares of the first and second IPC, respectively. IPC1 and IPC2 are the scores of the genotypes in the first and second IPC, respectively.
The weighed average of absolute scores (WAAS) [59] was estimated following Equation (4). A superiority index (WAASY) was derived by rescaling the yield and WAAS to balance productivity and stability [59]. In the present study, yield and stability were given the same weight (50/50) (Equation (5)).
W A A S = k = 1 p | IPCA i k × E P k | k = 1 p E P k
where, PCAik is the score of the ith genotype in the kth IPCA, and EPk is the amount of variance explained by the kth IPCA
W A A S Y = ( r G i × θ Y ) + ( r W i × θ s ) θ Y + θ s
where rGi and rWi are the rescaled values for GY and WAAS, θY and θS are the weights for grain yield and stability assumed to be 50 for each in this study.
The rest of the stability parameters were computed using the BLUEs from each environment. The Agrostab package [67] was used for the estimation of the regression coefficient (Bi), squared deviation from the regression (S2di) [45], environment variance (EV) [50] and the coefficient of variation [49]. The Metan package was used to compute Shukla stability variance (σi2) [47], geometric adaptability index (GAI) [68] and the superiority index (Pi) [51].
Four non-parametric stability indices [52,53] were also estimated using the Metan R package: Si1, which is the mean of absolute rank difference over environment, Si2, which is the variance of the ranks, Si3, which is the sum of absolute deviations and Si6, which is the relative sum of squares of rank for genotype. The Pearson correlation coefficients between the stability indices were computed using the Hmisc R package [69] and plotted using the corrplot R package [70].

3. Results

3.1. Analysis of Variance

The analysis of variance from the linear mixed model and AMMI showed highly significant effects of the environment, genotypes, and their interaction (p < 0.001) (Table 3 and Table 4). The highest proportion of variance was explained by the environment (66.93%), followed by the GEI (18.74%), while the genotypes accounted for 8.39% of the variance (Table 4). The diagonal structure of the error in the mixed model validated the assumption of residual heterogeneity between the environments (Table 3). Therefore, accounting for the heterogeneity of error variance would increase the precision of genotypic variance estimation and thus the BLUPs across environments and their precision. The first seven interaction principal components (IPCs) from the AMMI model were significant, and explained 80.6% of the GEI (Table 4). The variance explained by the first two IPCs was relatively low, accounting for only 38.8% of the GEI. The first IPC captured 22.6% of the variance while the second (IPC2) accounted for 16.2%, which highlights the complexity of the interaction patterns.

3.2. Characterization of the Testing Environments

3.2.1. Climatic Data

The testing locations in Morocco represent typical Mediterranean semi-arid and temperate environments, while Wad Medani in Sudan represents dry hot irrigated environments. The maximum temperature at Wad Medani was consistently above 30 °C and no rainfall was registered during both cropping seasons. In Morocco, the rainfall distribution seemed to be as important as the total amount of rainfall in determining the type of environment. For instance, the Marchouch and Annoceur locations received almost double the amount of rainfall (514 and 611 mm, respectively) in 2018 compared to 2017 (Table 5). In terms of rainfall distribution, MCH-17 was exposed to a severe drought during the vegetative stage, while drought was more intense during the reproductive stage at MCH-17 and TSRF-17. Melk Zher was characterized by a dry season where the total rainfall registered was 85.5 mm, and drip irrigation was applied to differentiate between fully irrigated and drought-stressed environments. The trials in Melk Zher were irrigated, where MZIR-16 and MZRF-16 received, between irrigation and rainfall, a total of 411 mm and 127 mm, respectively. In terms of temperature, Annoceur and Marchouch were characterized by a cooler winter in comparison to other locations, while higher temperatures were observed during the reproductive stages in all locations.

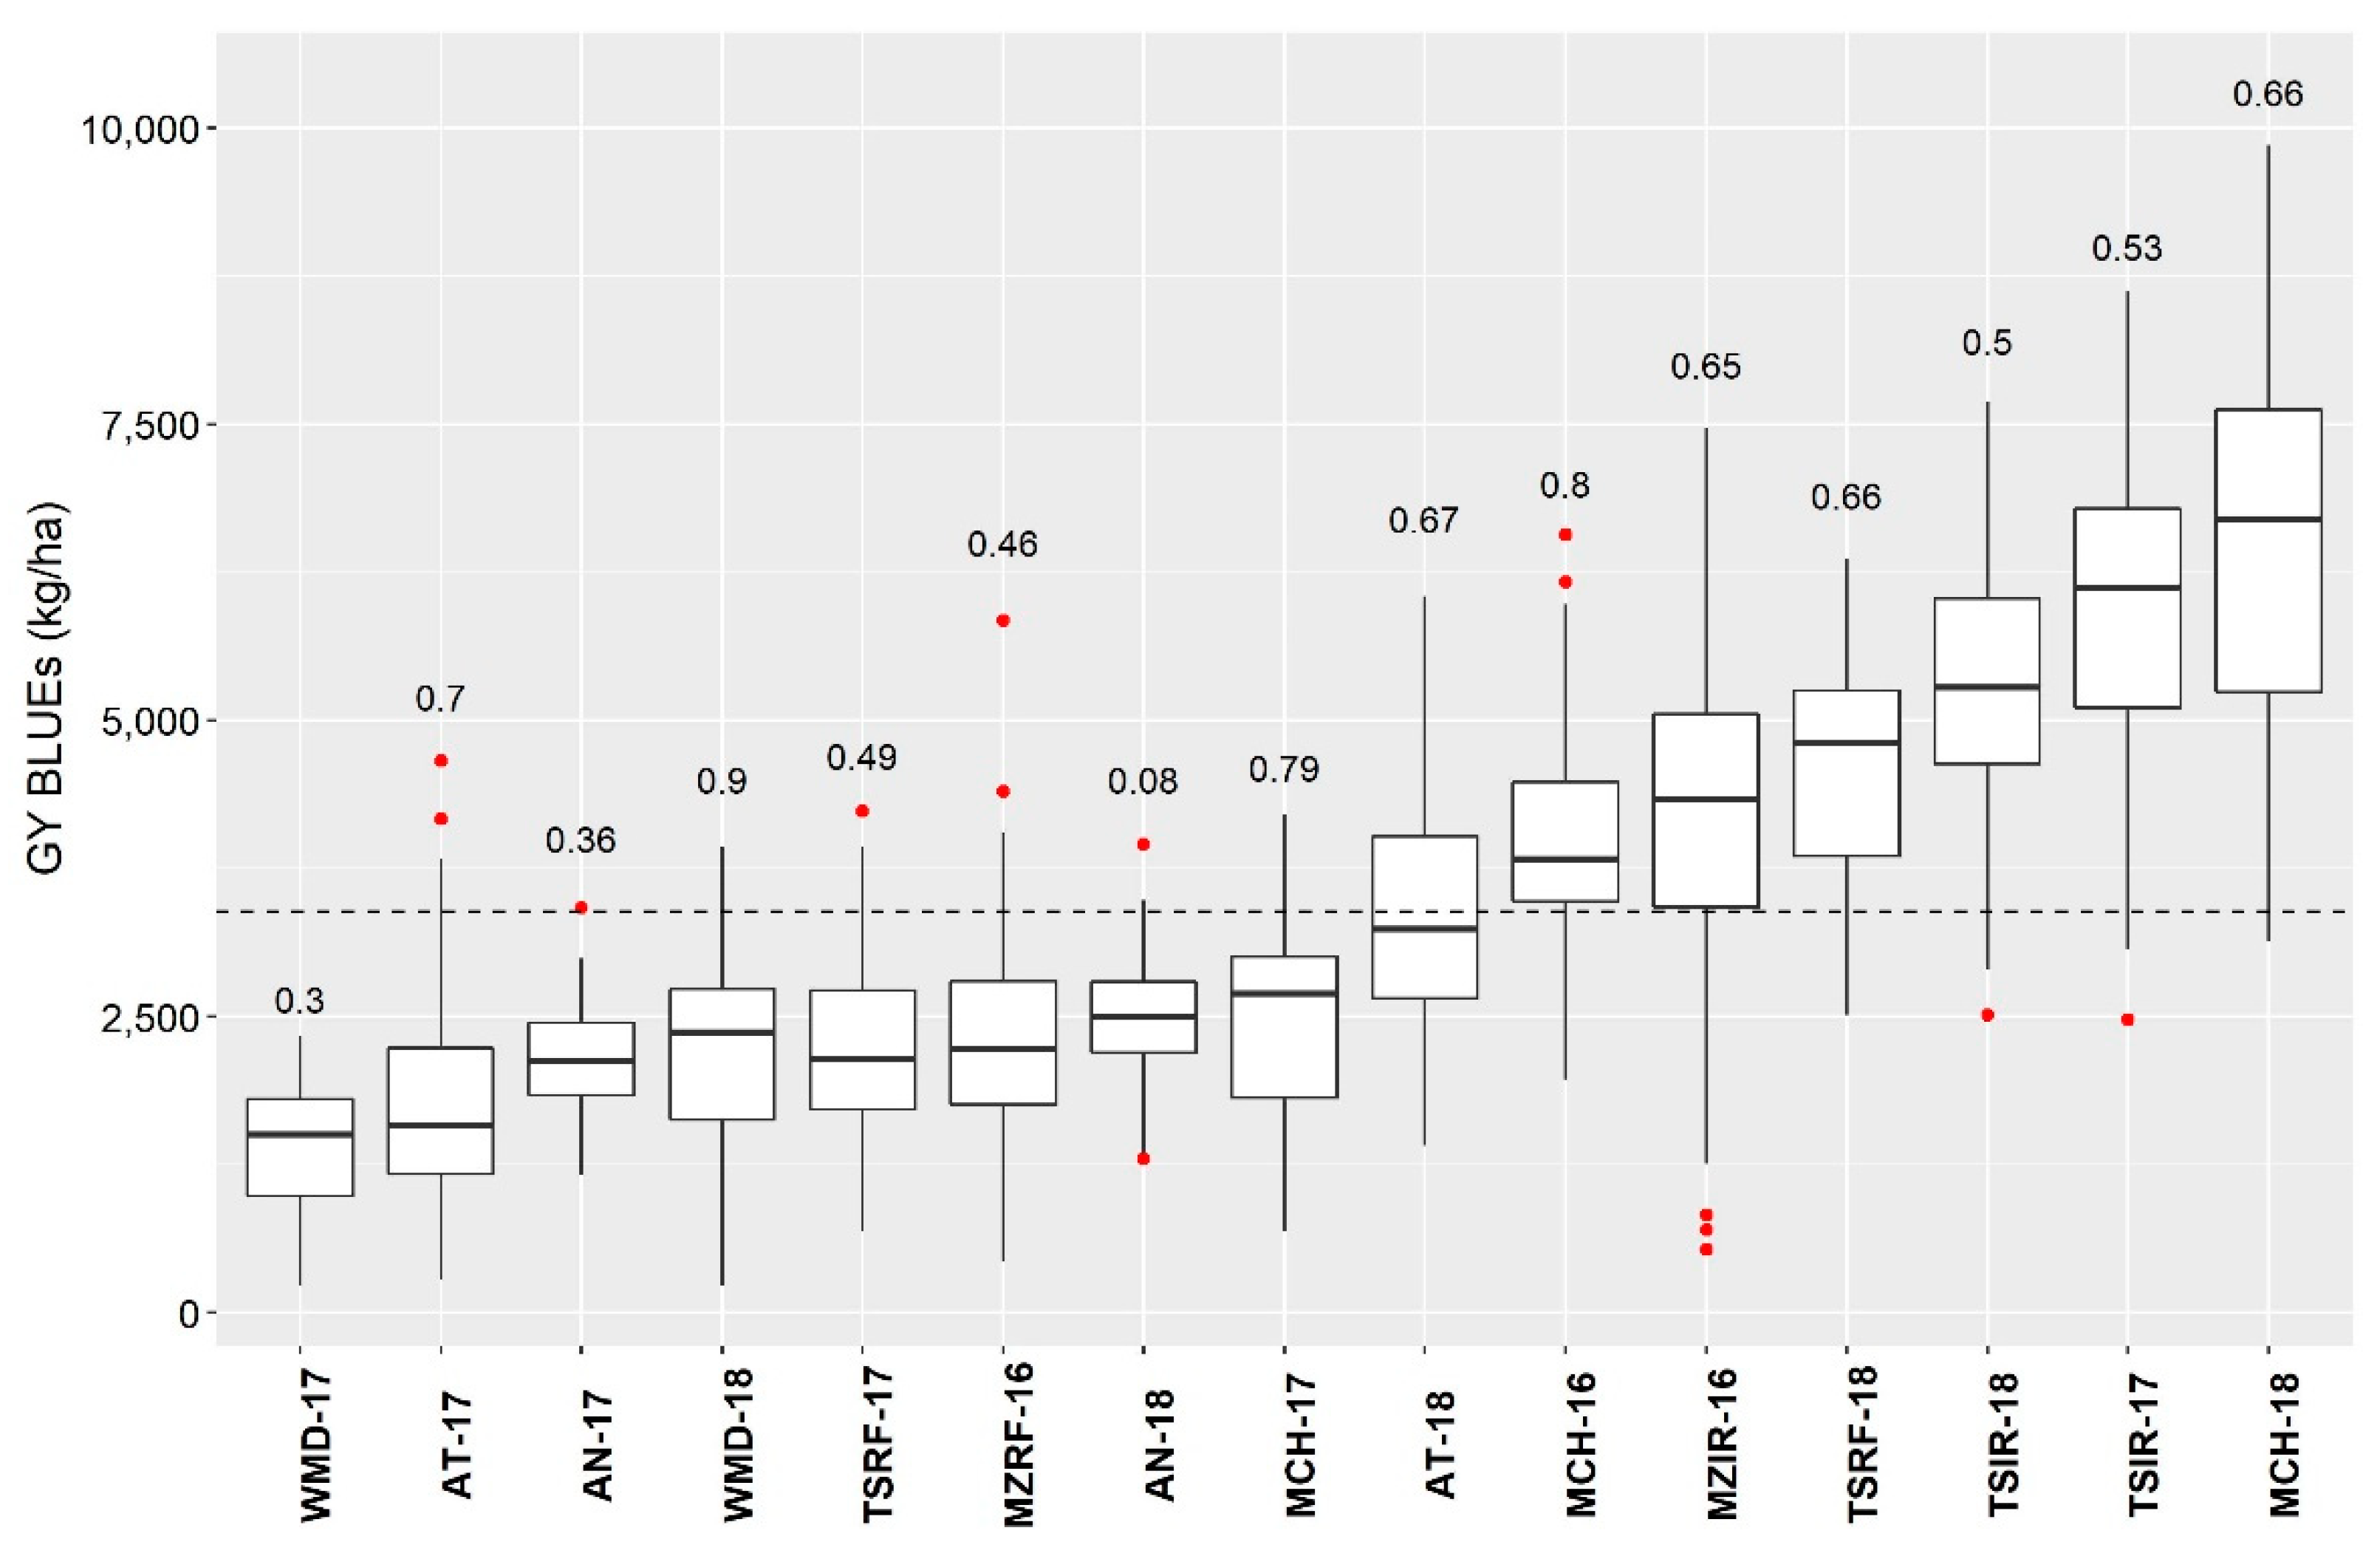
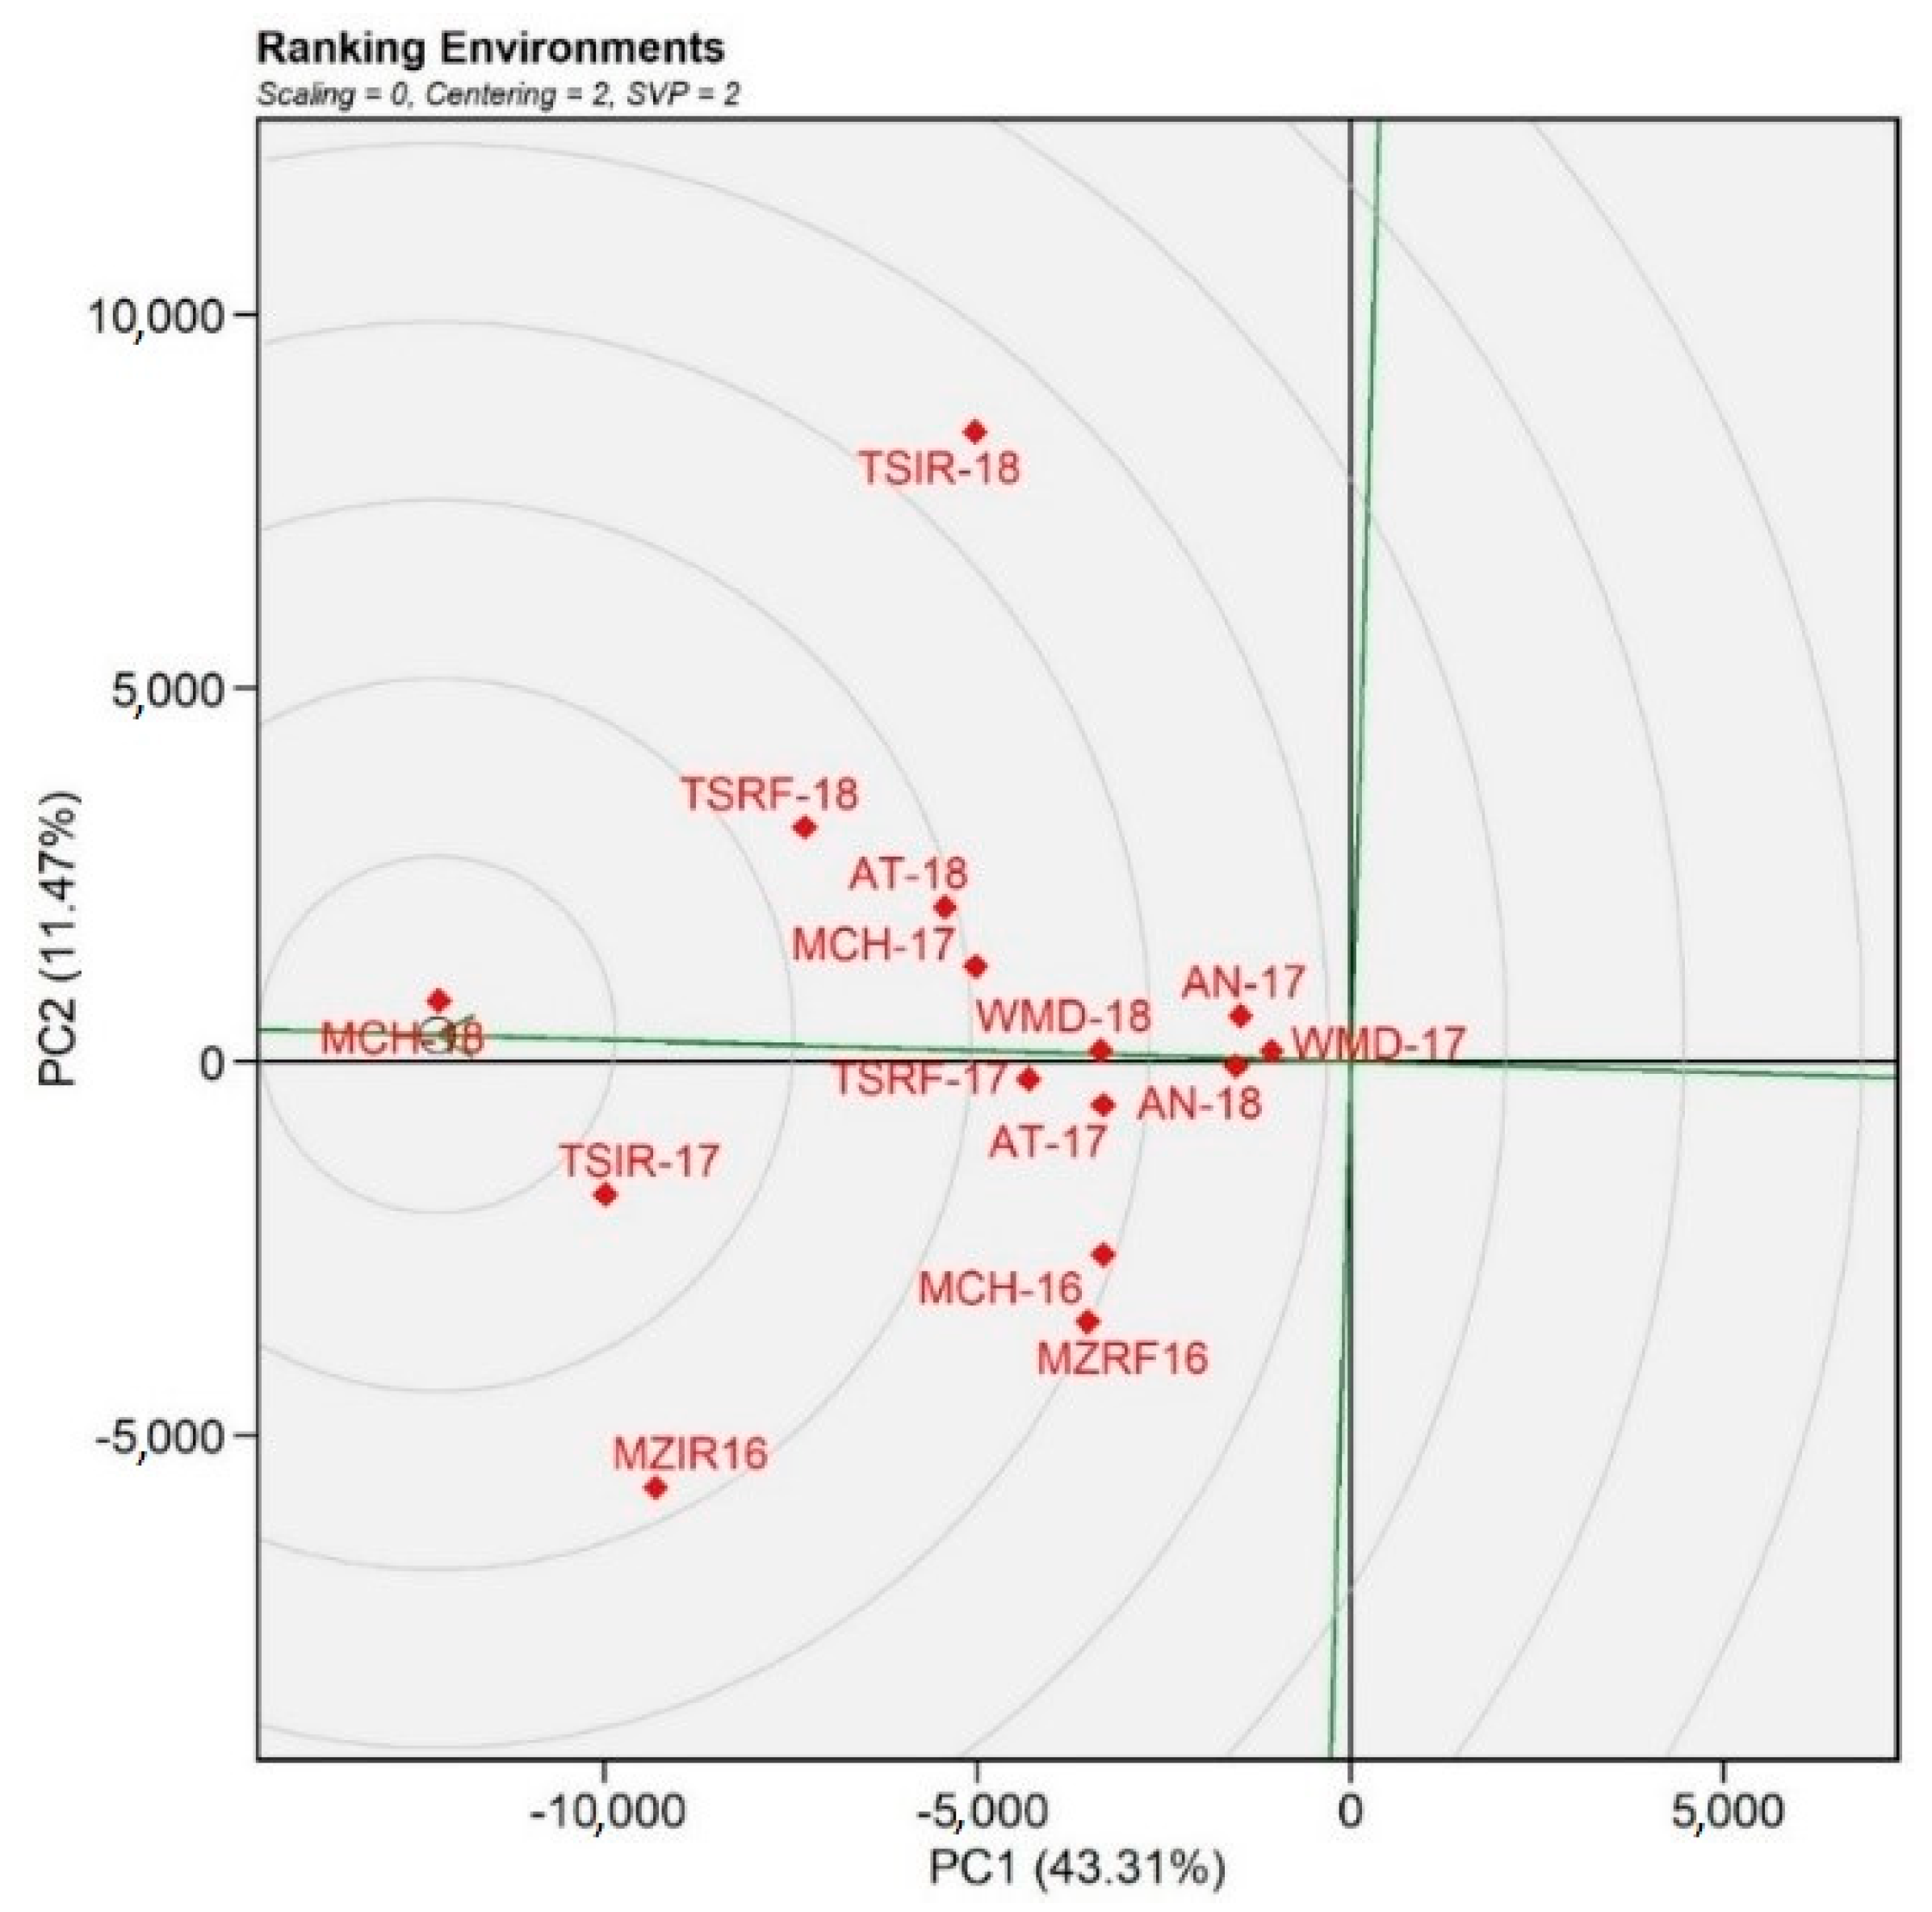
3.2.2. Environment Characterization for Yield

The average yield across all environments was 3387 kg/ha. This yield is in the range of the national average yield in the Mediterranean region, which varies between 1500 kg/ha under rainfed conditions, and 4500 kg/ha under irrigated or favorable rainfed conditions. Six environments had yields above average, while nine were unfavorable and had lower yields (Figure 1). The highest mean yield was registered at MCH-18 (6468 kg/ha), followed by TSIR-17 (5955 kg/ha) and TSIR-18 (5251 kg/ha). The lowest yield was observed under heat stress at WMD-17 (1370 kg/ha), followed by yields at AT-17 (1751 kg/ha), AN-17 (2149 kg/ha), and WMD-18 (2183 kg/ha). The yield at MCH-18 reflected the favorable season in comparison to MCH-17 where the average yield was 2533 kg. The supplemental irrigation at MCH-16 resulted in favorable conditions and a yield of 3993 kg/ha. The contrasts between fully irrigated and rainfed trials at Tessaout and Melk Zher were high, as shown by the yield reduction between irrigated and rainfed conditions (Figure 1). On average, the yield at MZIR-16 was 73% higher than MZRF-16, while TSIR-17 had an average yield 164% higher than TSRF-17. The broad sense heritability ranged between 0.08 at AN-17 and 0.90 at WMD-18, and was moderate in the rest of the environments (Figure 1). Significant genotypic effects were observed in 12 environments and only three had non-significant genotypic effects (AN-17, AN-18, and WMD-17).

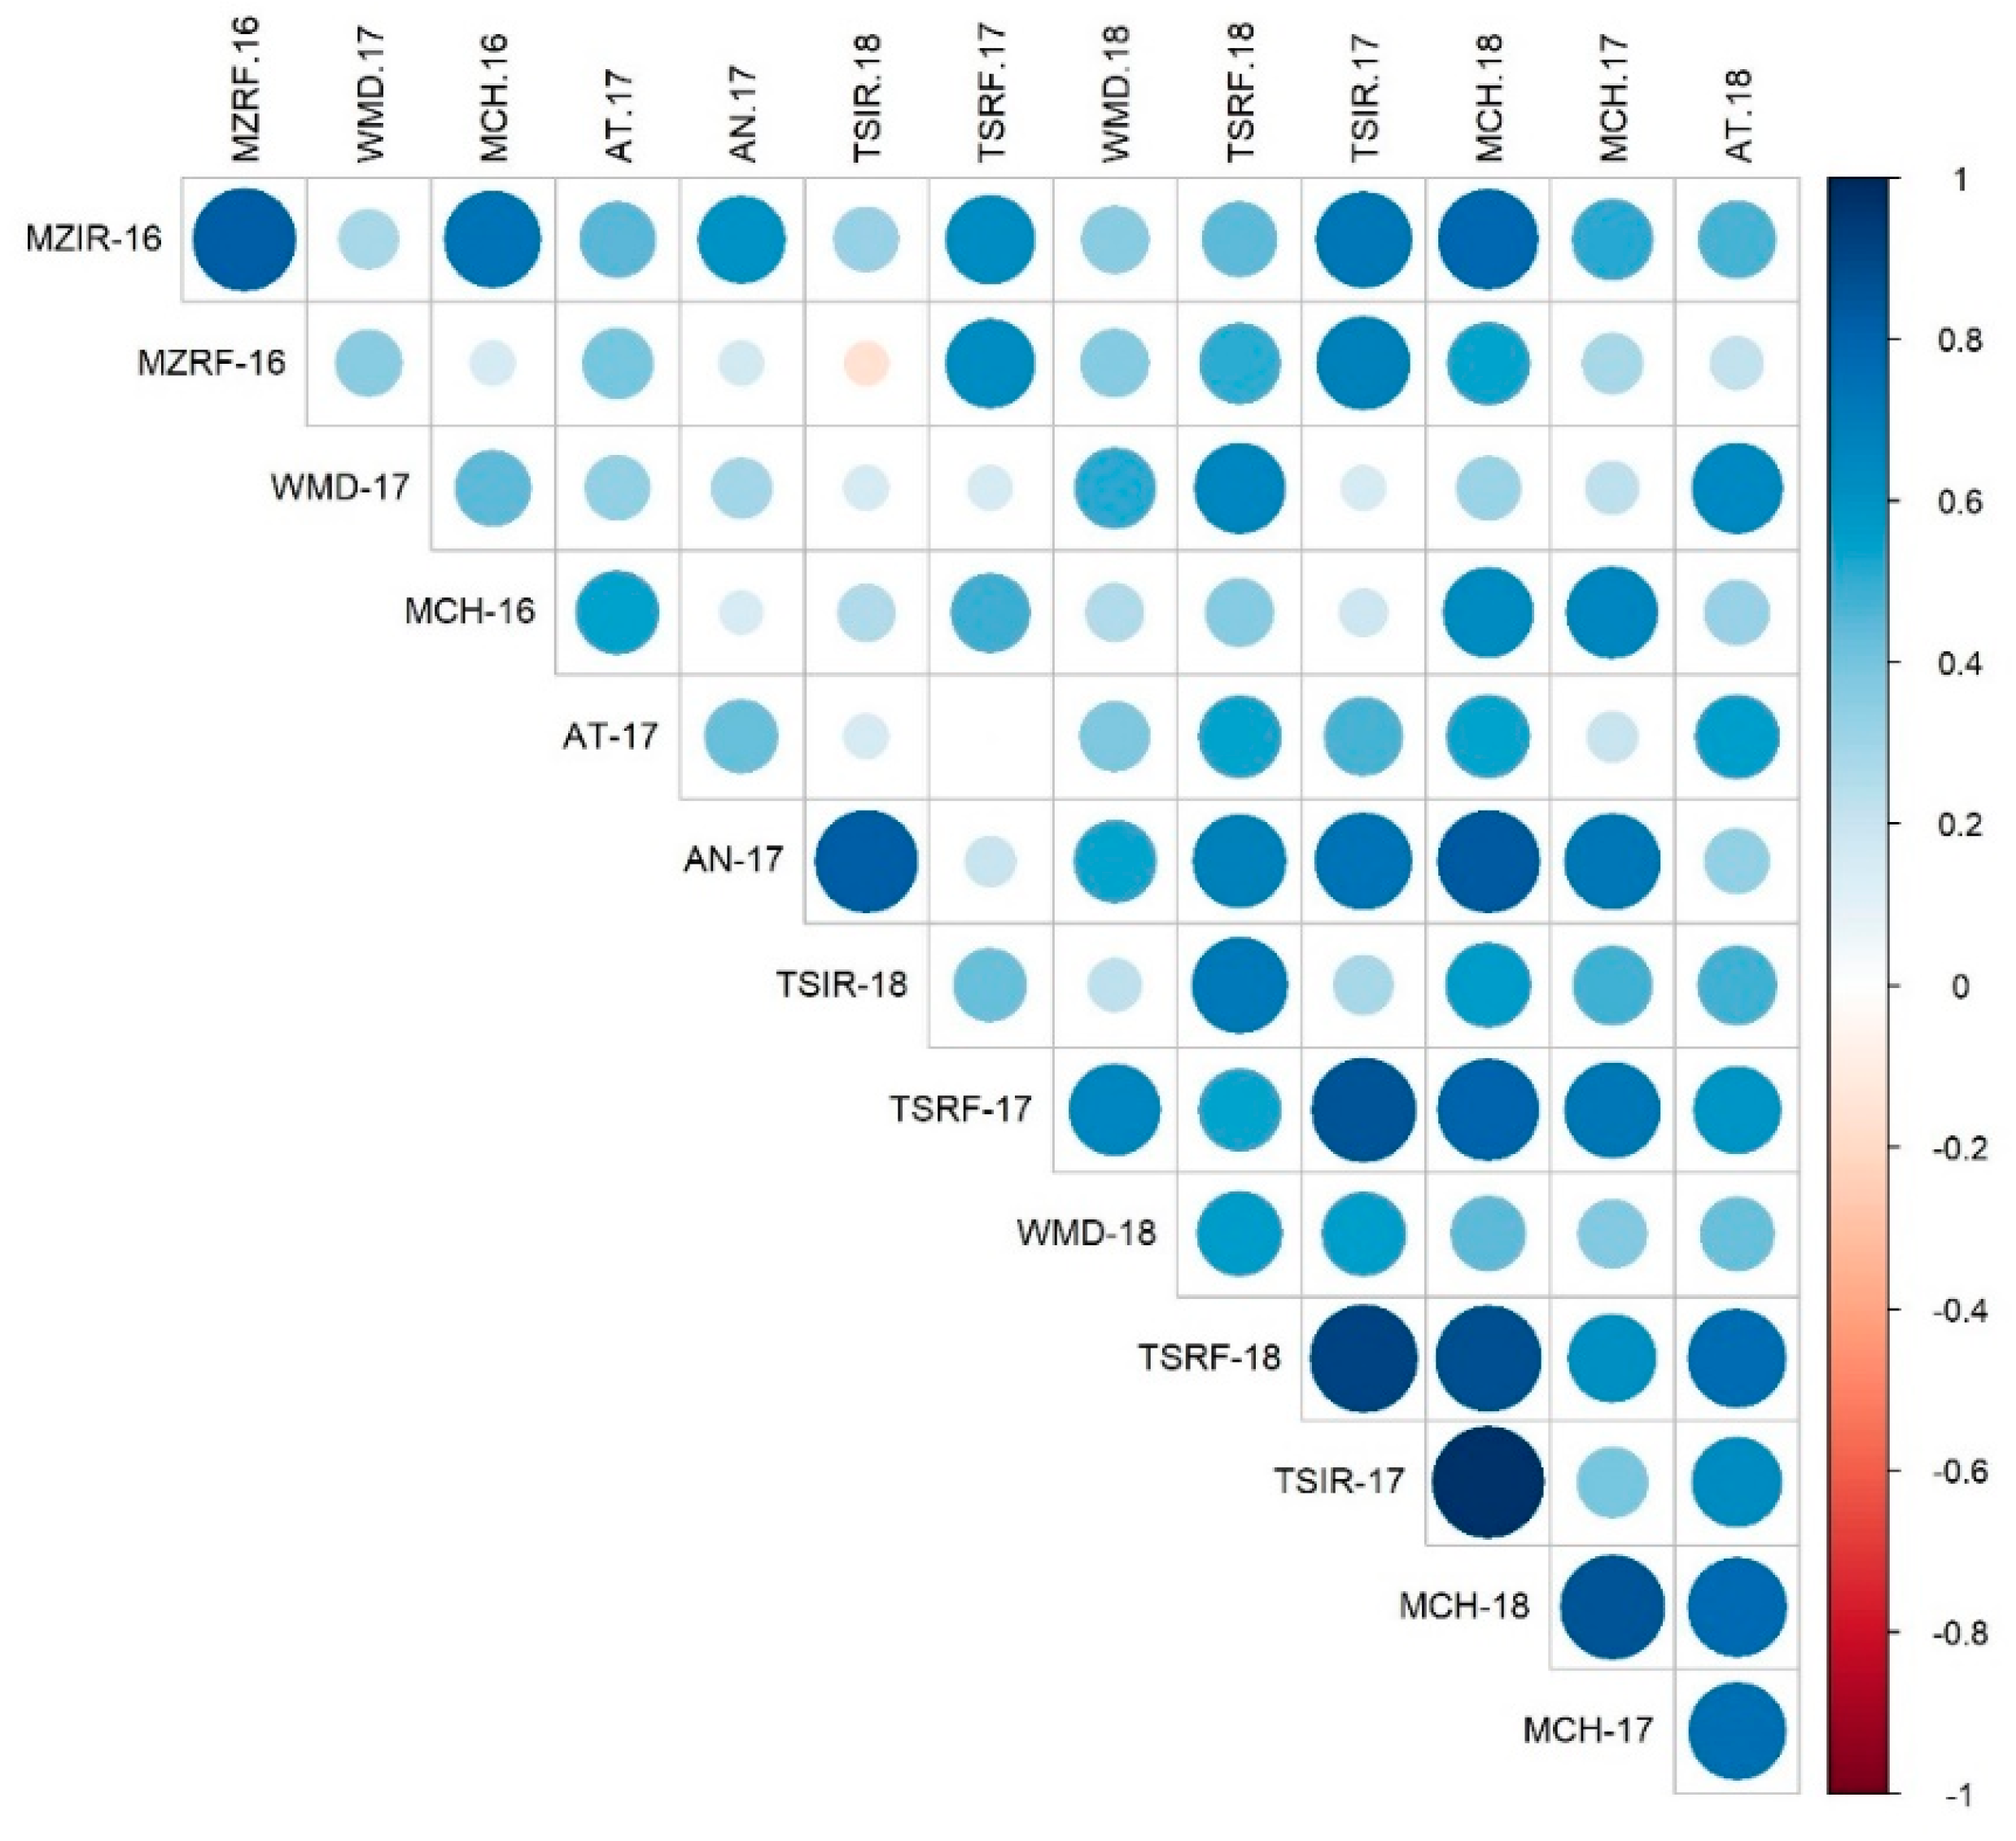
3.2.3. Association between the Environments

The genetic correlation, which provided insight into the interaction between different pairs of environments, ranged between −0.15 (MZRF-16 and TSIR-18) and 0.97 (TSIR-17 and MCH-18) (Figure 2). MCH-18 was highly correlated with both favorable (TSIR-17, MZIR-16) and unfavorable environments (TSRF-17 and AN-17), indicating a lower GEI of MCH-18 with many other environments (Figure 2). It was followed by TSIR-17 and TSRF-18 in terms of correlations with other environments. AT-17 and WMD-17 had the lowest association with the rest of the environments (Figure 2), and the correlation between AT-17 and TSRF-17 was null, indicating a full interaction. WMD-17 had a strong interaction with most of the environments, and was correlated only with AT-18, WMD-18, and TSRF-18. WMD-18 was significantly correlated only with TSRF-17 (r2 = 0.65) and TSRF-18 (r2 = 0.56). AN-18 was dropped from the analysis due to its low heritability. The genetic correlation results were corroborated by the GGE biplot for the association between environments (Figure 3). The GGE biplot confirmed the high discrimination ability of MCH-18, TSIR-18, and MZIR-16. MCH-18 had the advantage of efficiently representing most of the other environments compared to TSIR-18 and MZIR-16. Low yielding environments such as WMD-17, AN-17 and AN-18 showed low discrimination ability for the genotypes (Figure 3).
The color and size of the circles represent the direction and strength of the correlation between environments.

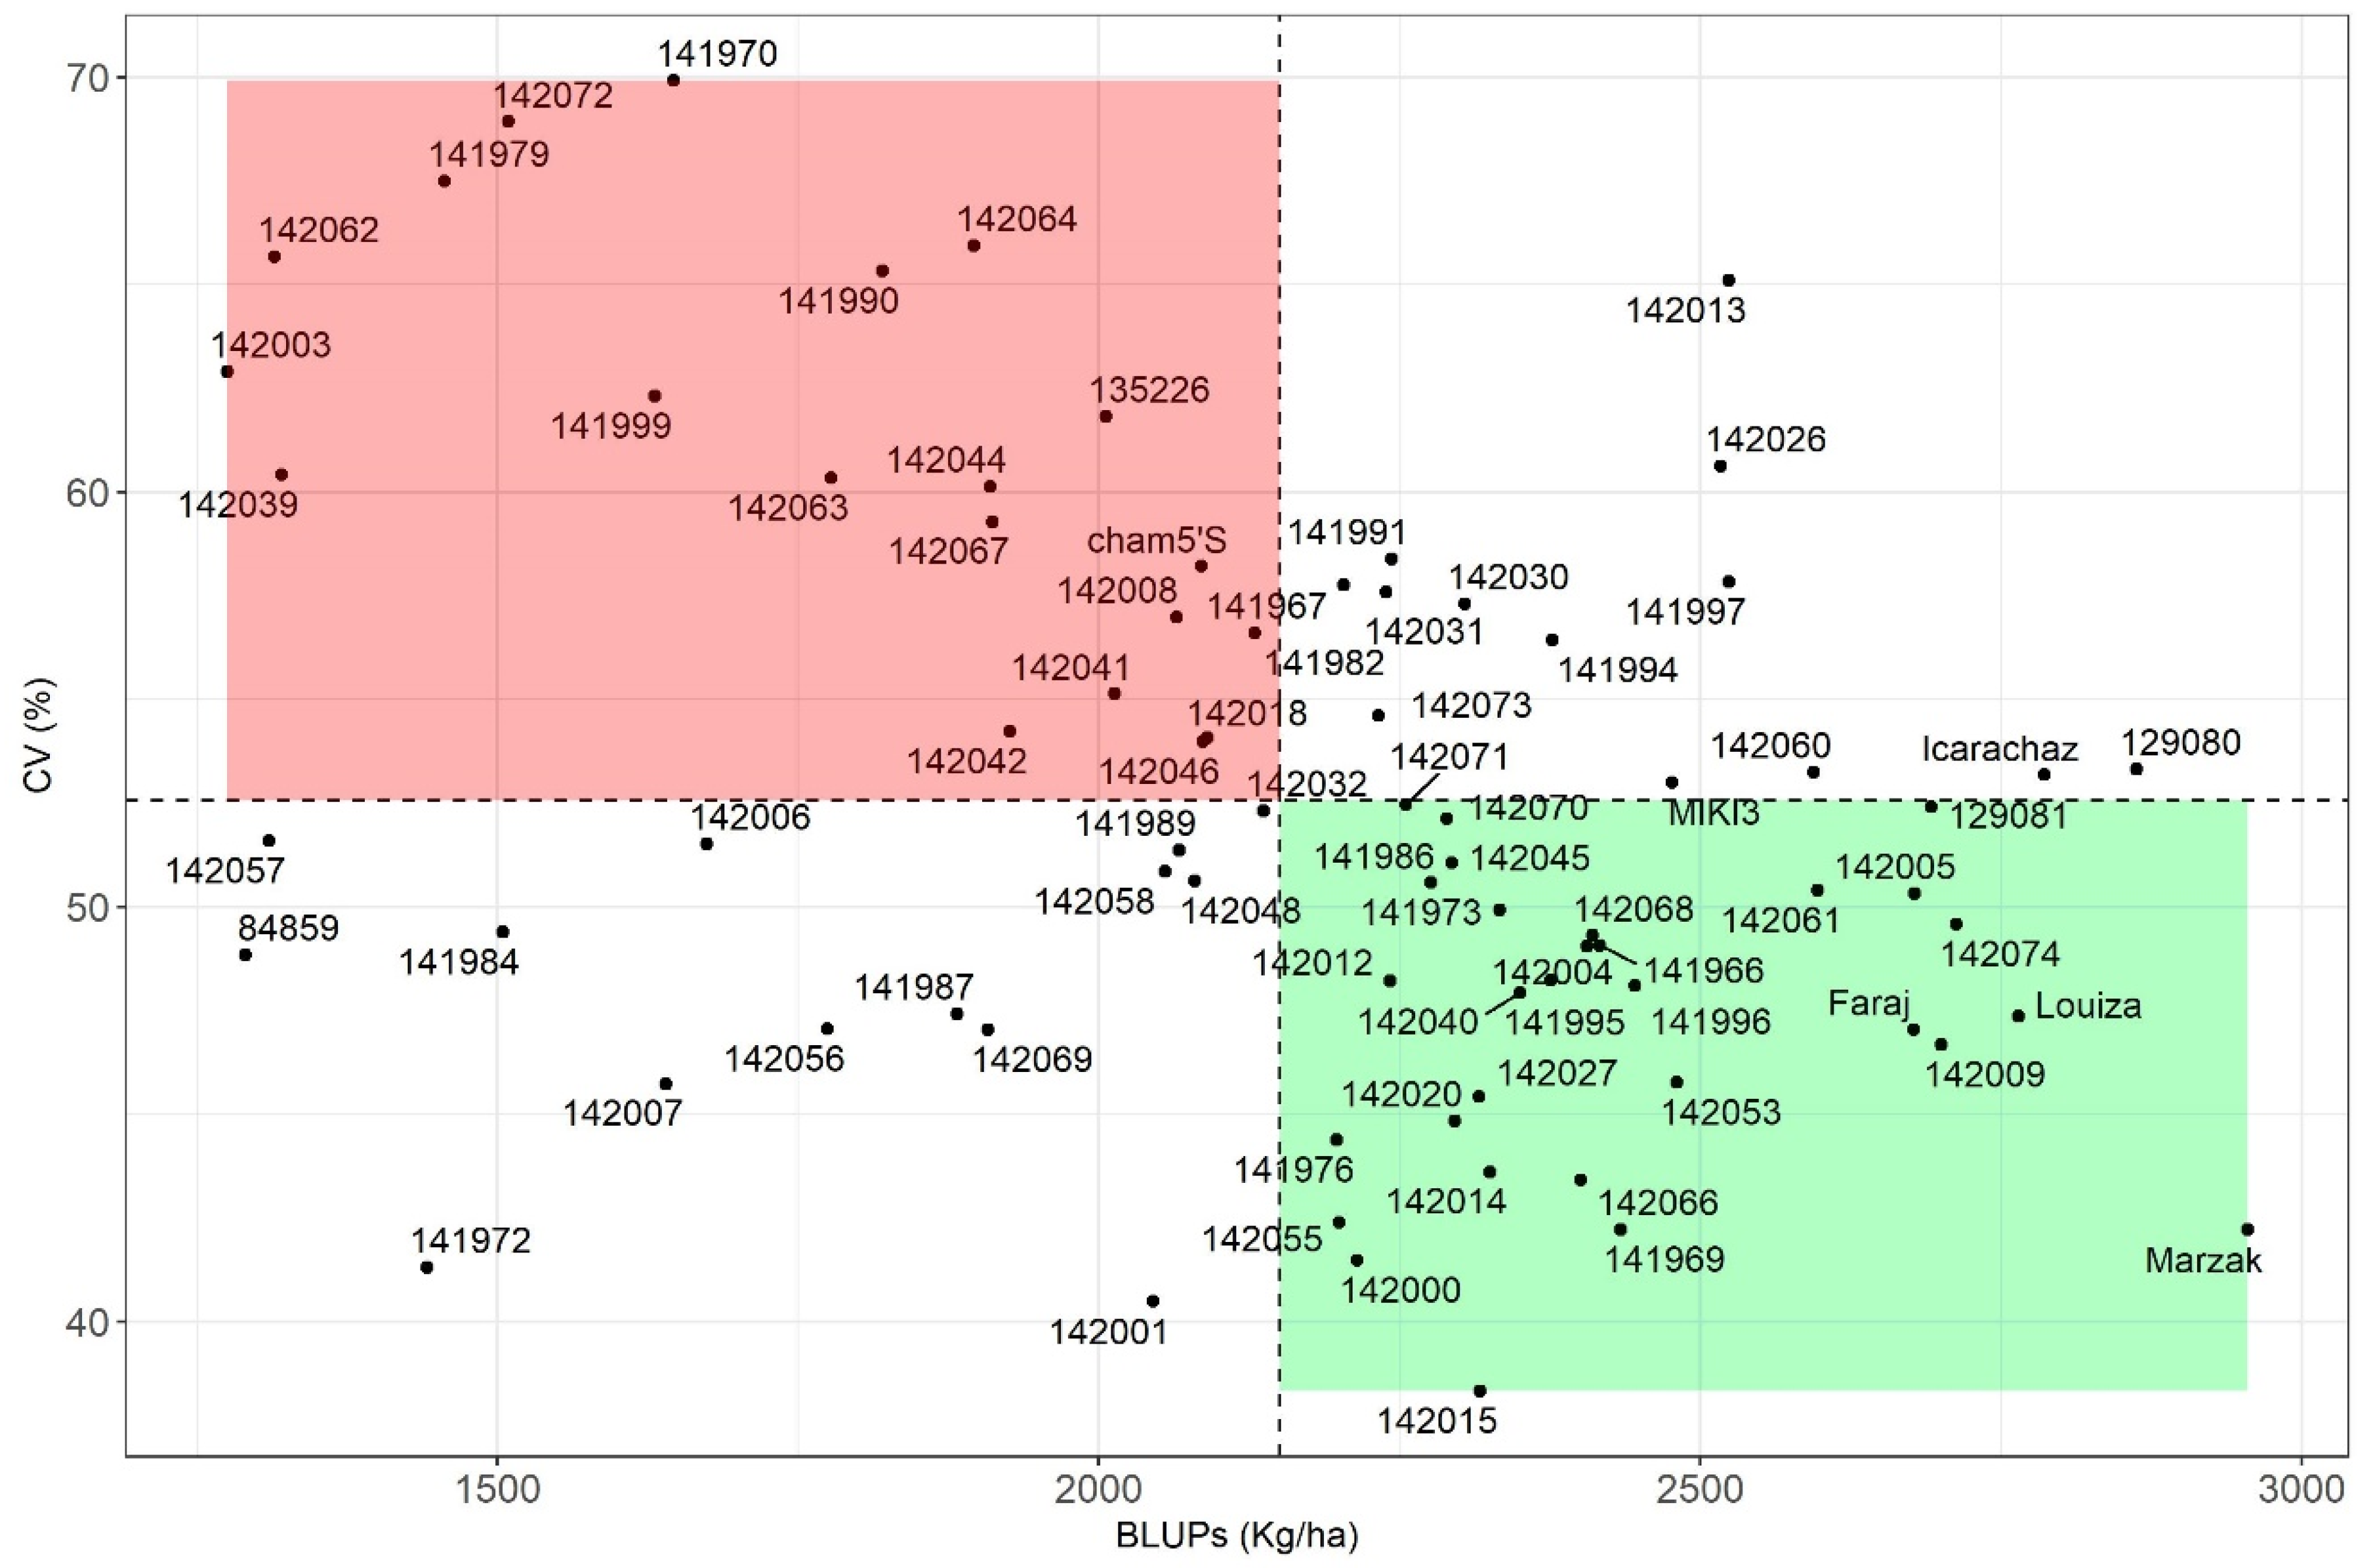
3.3. Yield Stability Assessment

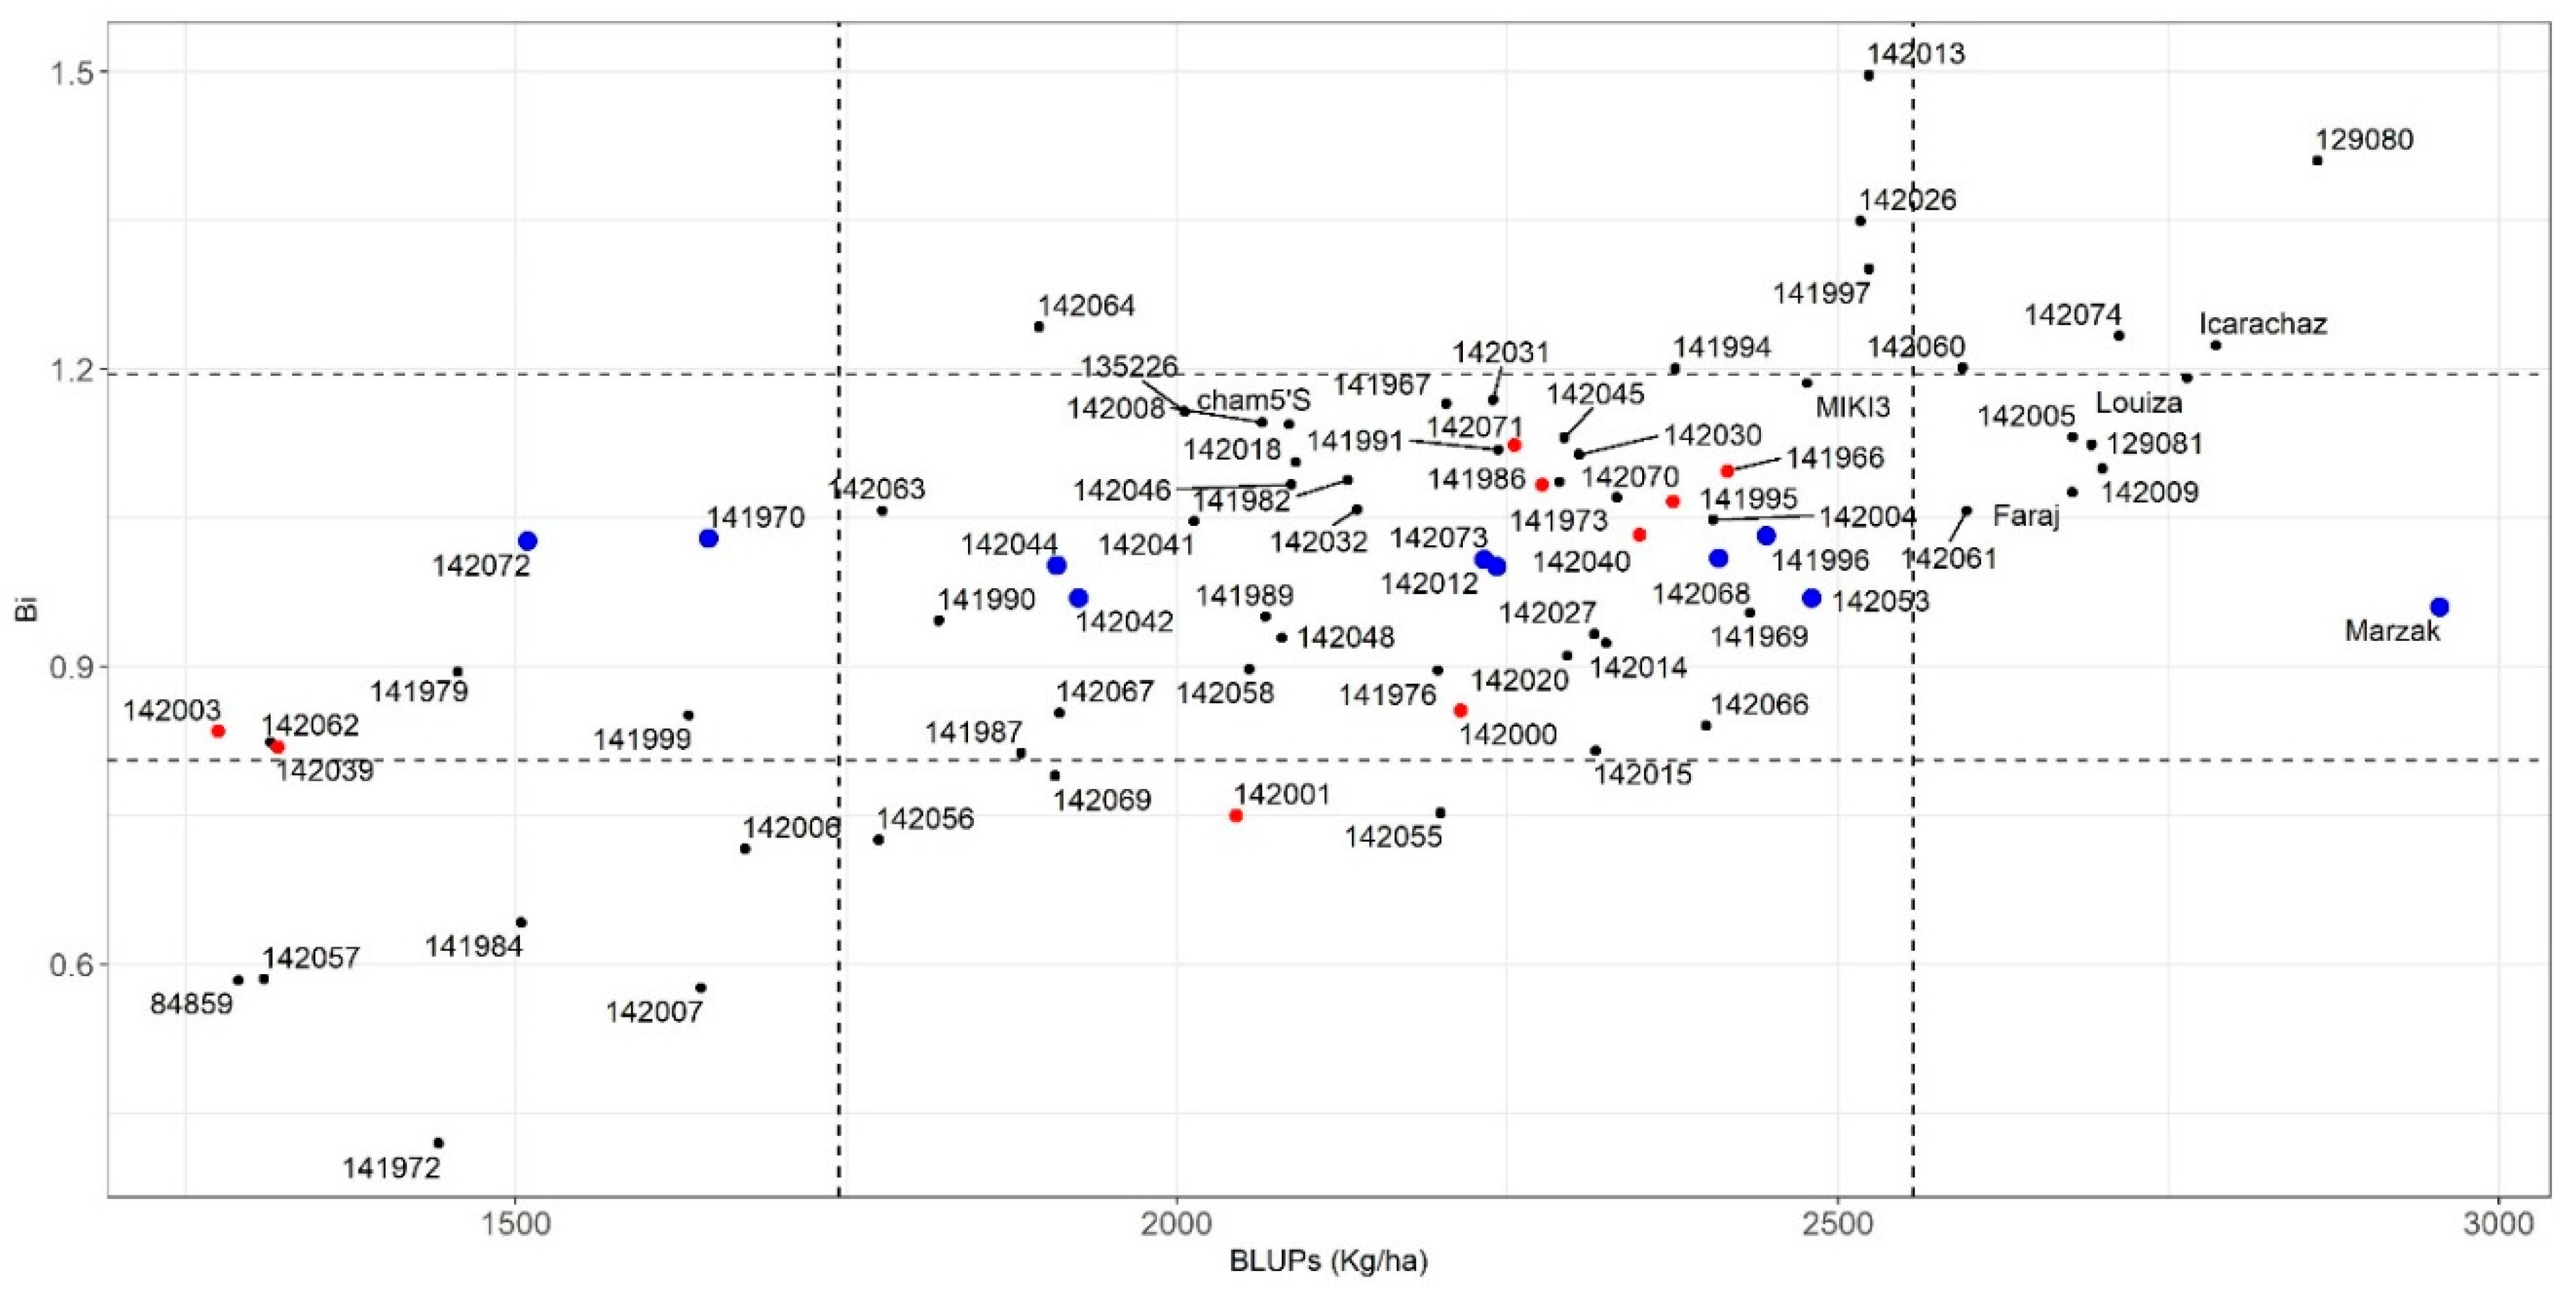
3.3.1. Parametric Stability Indices

More than 50% of the tested lines had BLUPs for yield above average. The check Marzak had the highest yield (2854 kg/ha), while line 142003 had the lowest yield (1274 kg/ha). Four other checks (129080, Icarachaz, Louiza and Faraj), the recurrent parent Cham5, and four of its derivatives, were also among the highest yielding lines (Table 6). The recurrent parent Haurani had the second lowest BLUP (1290 kg/ha), and the highest yielding of its derivatives was 142001 (Haurani*2/T. urartu), with a yield 58% higher than its recurrent parent. The range of the BLUPs suggests that the germplasm tested here have high variation in yield. Therefore, the BLUPs should be taken into consideration for the interpretation of the other stability parameters in order to balance productivity and stability.
According to the joint regression, the ideal genotype would have a regression coefficient (Bi~1) combined with low squared deviation (S2di) and high BLUPs. However, these three conditions could be met only for a few lines having average yield performance (Figure 4). Some lines such as Icarachaz, 129080, and 142074 (Cham5*3/T. dicoccoides) combined higher yields with high Bi. In addition, Icarachaz was regarded as unstable according to S2di, as it had high variance (Table 6). Plotting Bi versus BLUPs identified an interesting group of lines which combined high productivity and high stability (Figure 4). This group included three checks (Marzak, Louiza and Faraj), the recurrent parent Cham5, and three of its derivatives. Marzak combined the highest yield (2952 kg/ha) with a regression coefficient of 0.96. The two derivatives 142009 and 142061 had yields of 2699 and 2597 kg/ha paired with regression coefficients of 1.09 and 1.05, respectively. They are derived from the same three backcrosses of Cham5 with T. aegilopoides. The derivative line 142005 (Cham5*4/Ae. speltoides) combined a yield of 2677 kg/ha with a Bi of 1.13. The landrace Haurani and its derivatives showed specific adaptation to unfavorable environments; they had low yields paired with low regression coefficients. The line 141972 (Haurani*2/T. urartu) had the lowest Bi (0.41) and was ranked 72 according to the BLUPs. Two Haurani derivative lines showed a significant yield improvement compared to their recurrent parent. One of these two derivatives (142001) was ranked the most stable according to its S2di. Since a lower S2di is associated with more predictable performance, adding the yield suggested that the lines 141995, 141966, 142071 and 142070 are desirable (Table 6, Figure 4). The S2di did not succeed in selecting genotypes combining high yields with broad adaptation. For instance, the lines 142003 and 142062 were ranked high according to the S2di, but their BLUPs and Bi suggested they were poorly adapted to all environments.
The CV showed high efficiency to be used for negative selection to discard the low yielding unstable genotypes (Figure 5). Some lines, such as 141979, 142062 and 142039, were among the lowest yielding, and had high CVs (67%, 65% and 60%, respectively). Marzak was ranked fifth with a CV of 42%, while the first ranked line 142015 (Cham5*2/T. urartu) combined a CV of 38% with a BLUP of 2316 kg/ha. The two lines 142001 and 141792 had yields below average, coupled with respective CVs of 40% and 41%. These two lines, derived from the same cross of Haurani and T. urartu with two backcrosses, were also selected as stable using the EV. However, the EV showed more affinity to select for the biological concept of stability than the CV. Eight of the best ten lines selected using EV had yields below average and only two were above average (142015 and 142055). High yielding lines like Icarachaz (3rd BLUP) and 129080 (2nd BLUP) were considered unstable, and were ranked 70 and 72 for EV, respectively (Table 6).
The selection intensity of Shukla stability variance (σi2) was centered around the genotypes having an average yield performance coupled with low variance. The accession 141995 (Cham5*4/Ae. speltoides) was ranked first, followed by the lines 141966 and 142000, which are derived from Cham5 crossed to T. dicoccoides with two and three backcrosses, respectively. Shukla variance attributed lower stability to the genotypes with high and low yields such as Icarachaz and 141972 (Table 6).
The superiority index (Pi) and the geometric adaptation index (GAI) selected similar genotypes for stability. Nine genotypes were included in the best ten lines using both GAI and Pi, among which were five checks, the recurrent parent Cham5 and four of its derivatives. The stable derivatives were issued from crosses with T. aegilopoides (142009 and 142060), T. dicoccoides (142074) and Aegilops speltoides (142005). Pi and GAI tended to select genotypes with high yield potential, as most of the low yielding genotypes were regarded as unstable (Table 6).
By giving the same weight to productivity and stability, the superiority index from the weighed average of absolute scores (WAASY) balanced productivity and general adaptation for the ranking of genotypes (Table 6). The lines 141986 (Cham5*3/T. dicoccoides) and 142045 (Cham5*3/T. urartu) were the most stable, followed by Louiza and line 141966. WAASY also included the two highest yielding checks, Marzak and 129080, within the most stable genotypes. Interestingly, derivatives from crosses/backcrosses of Cham5 with the four wild species (Ae. speltoides, T. urartu, T. aegilopoides and T. dicoccoides) had superior stability/productivity compared to the recurrent parent. It was also noticeable that the same crosses resulted in genotypes with contrasting performance in yield and stability. This was the case for lines 141984 and 142074, both derived from Cham5*3/T. dicoccoides (Table 6).

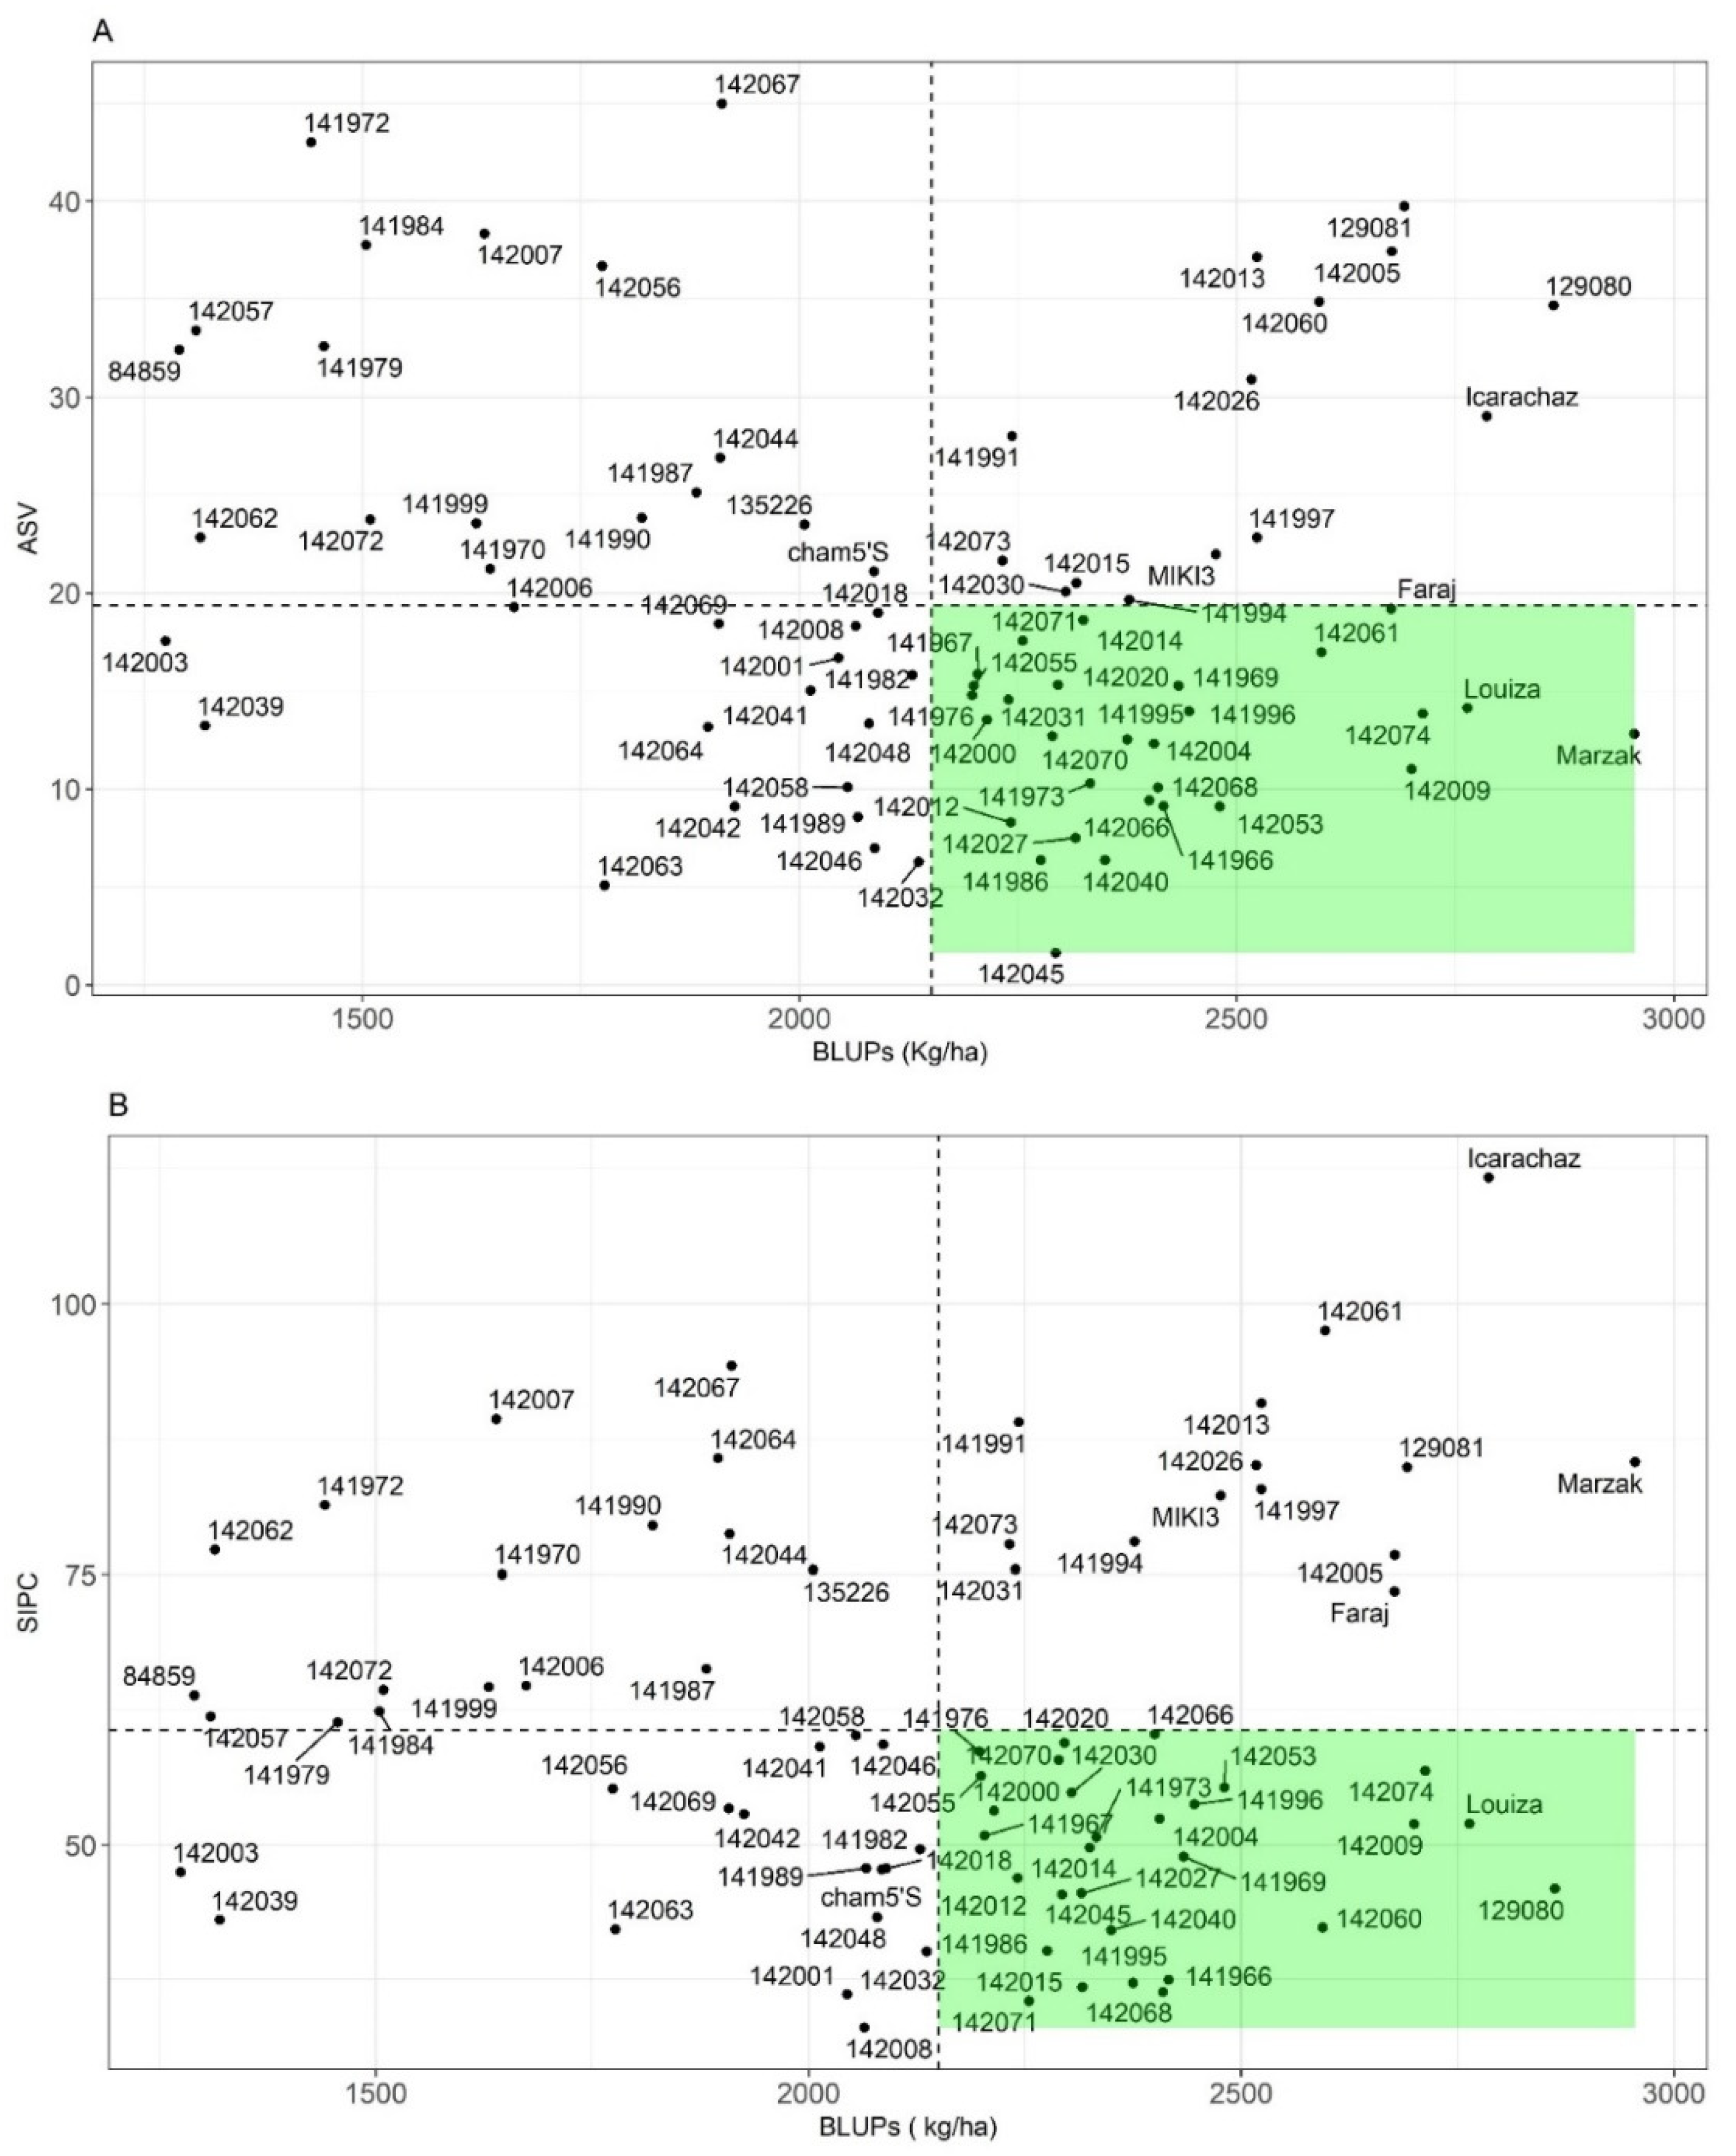
3.3.2. Non-Parametric Stability Indices

Despite the differences in the ranking of genotypes between the four non-parametric stability parameters, some lines were identified as stable by all of them. Si1, Si2, Si3 and Si6 ranked the line 142053 (Cham5*2/T. dicoccoides) among the most stable, and the lines 141995 and 141966 were selected based on three of these parameters (Si2, Si3 and Si6) (Table 7). Si3 and Si6 selected similar lines for stability while Si6 had more affinity for the selection of high yielding genotypes (129080, 142053, Marzak). The lines selected by Si1 and Si2 could have low and high yields; this resulted in lower ability to differentiate superior from poorly adapted genotypes based on these indices (Table 7).

3.3.3. AMMI Derived Stability

The two stability parameters derived from the AMMI model selected average performance lines with low contribution to GEI as stable (Figure 6). The most stable lines with low SIPC were 142008 (Cham5*3/T. dicoccoides), and 142071 and 142001, both derived from T. urartu crossed with Cham5 and Haurani. The lines 142045 (Cham5*3/T. urartu), 142063 (Cham5*3/T. dicoccoides) and 142032 (Cham5*3/T. aegilopoides) had the lowest contribution to GEI according to the ASV and were therefore the most stable. The inclusion of BLUPs with SIPC and ASV resulted in the identification of desirable lines with high yield potential (Figure 6). The checks Louiza and the derivative lines 142074, 142009, 142060 can be recommended for combining stability with high productivity. ASV and SIPC showed some difference for the highest yielding lines, with Marzak and 129080 ranked differently by the two parameters.

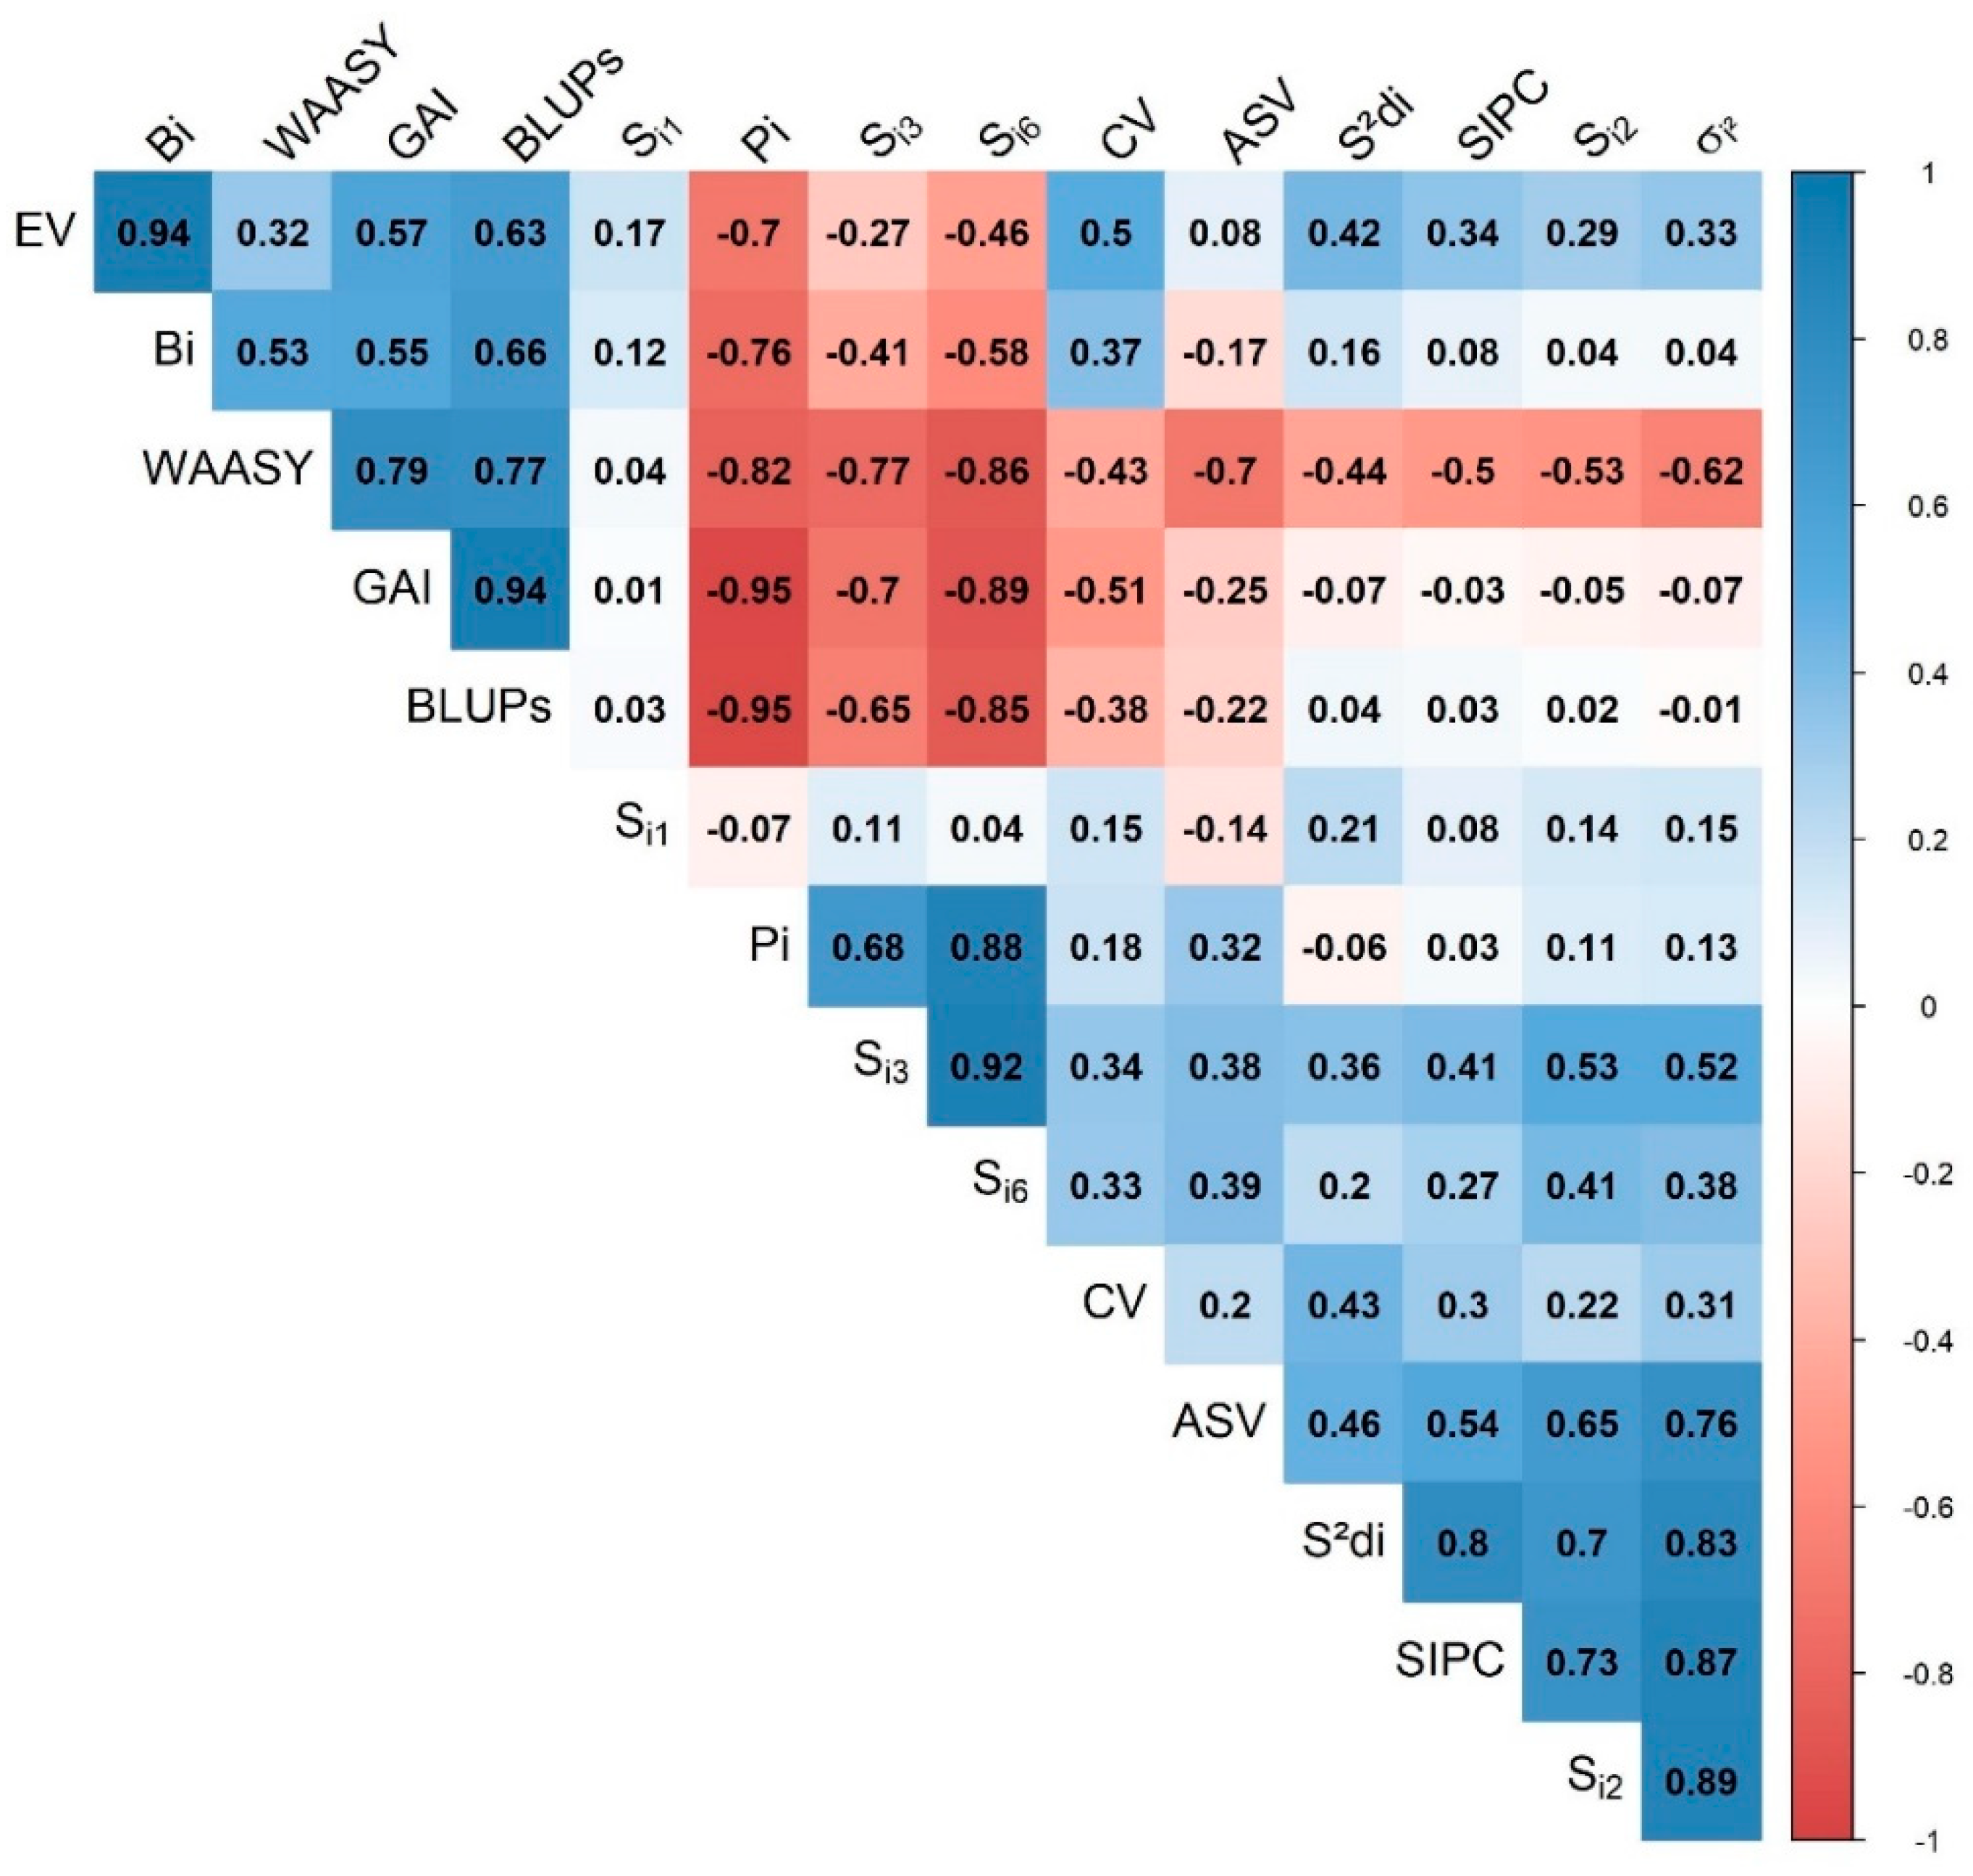
3.3.4. Association of the Stability Indices

The correlation between stability parameters formed two major groups of positively correlated parameters and ranged from r2 = −0.95 (BLUPs and Pi) to r2 = 0.94 (BLUPs and GAI; EV and Bi). The first group was formed by BLUPs, WAASY, GAI, Bi and EV, with all indices positively correlated with the BLUPs. However, considering the interpretation of different parameters, the lines selected by EV will have low yields. The second group included the variance parameters (S2di and σi2), the two AMMI-derived stability indices, and the non-parametric index Si2 (Figure 7). ASV showed moderate correlation with the other parameters of the second cluster, ranging from 0.46 with Si2 to 0.76 with σi2. As they have the same interpretation, the parameters in this group would select similar lines for stability. A strong positive correlation was found between Pi, Si3 and Si6. These parameters were negatively associated with the second cluster and showed low to moderate correlation with the first group of parameters (Figure 7). WAASY was significantly correlated with all the other parameters except with Si1, which itself did not correlate with any other parameter.
Pi, Superiority index; EV, Environment variance; GAI, Geometric adaptability index; σi2, Shukla variance; BLUPs, Best linear unbiased predictions; Bi, Regression coefficients; S2di, Squared deviation from the regression; CV, coefficient of variation; WAASY, superiority index from the weighed average of absolute scores; ASV, AMMI stability value; SIPC, sums of the absolute values of the IPCA scores, Si1, Mean of absolute rank difference over environment; Si2, Variance of the ranks; Si3, Sum of absolute deviations; Si6, Relative sum of squares of rank for genotype.

4. Discussion

4.1. Dissection of the Genotype by Environment Interaction

The analysis of variance showed the complexity of the GEI and the crossover interaction, meaning that genotypes responded differently to the changes in environment. High GEI is common in multi-environment trials [68,71,72], which reduces selection accuracy and genetic gains [18]. The dissection of the GEI and proper characterization of the environments and germplasm is therefore essential to improve genetic gains [73]. In this study, the genetic correlation allowed us to understand the relationships between pairs of environments and their interaction. The small contribution of Marchouch to the GEI showed its suitability for efficient selection of superior genotypes for other environments. Despite the climatic differences between years, the same superior genotypes can be selected for the three seasons at Marchouch, and also for other locations. The crossover interaction due to year effects was more pronounced in the other locations; these effects were mainly associated with the total and distribution of rainfall and temperature for rainfed trials. These findings confirm previously reported effects of weather conditions on the GEI in durum wheat in the Mediterranean basin [3,74,75]. Annoceur was characterized by low heritability during both seasons, and it was among the locations where low genetic gain for durum wheat was achieved [76]. The testing environments exposed durum wheat to favorable conditions, drought, and heat stresses, in addition to disease pressure, mainly leaf rust at Allal Tazi and tan spot at Annoceur. In addition, the contrasting environments at Tessaout and Melk Zher showed their effectiveness to select for drought tolerance [77]. The genetic correlation showed that some genotypes can be selected simultaneously for drought and heat tolerance. This approach of using different environments was reported to be useful to select for productivity and tolerance to major biotic and abiotic stresses simultaneously [42].

4.2. Considerations for the Use of Durum Wheat Wild Relatives

Much of the progress in durum wheat breeding and genetic gains was achieved at the cost of a reduction in genetic diversity [76]. Maintaining the level of genetic gains requires a diverse gene pool for the breeders to select for adaptive traits [78]. The use of crop wild relatives (CWR), therefore, is strategic as it allows several traits to be increase simultaneously, while recovering lost diversity [79]. In this context, the present study investigated the potential contribution of wild relatives to yield stability in durum wheat. The choice of wild parents from the primary gene pool was of high importance, as several barriers are associated with the use of species from the secondary and tertiary gene pool [80,81]. The primary gene pool allows a higher frequency of recombination, which can be useful for quantitative traits [82]. Interestingly, the performance of the derivative lines from the four wild parents was not affected by the number of backcrosses, which suggests the possibility of maintaining a certain level of diversity while using these species by reducing the backcrossing. Instead, more care should be given to the selection scheme and intensity to reduce the frequency of undesirable linkages. Our results showed that the same crosses with T. dicoccoides and T. aegilopoides produced lines outperforming the recurrent parents, but also lines with very low yields. El Haddad et al. [83] reported that no linkage drag on agronomic performance was associated with the use of wild relatives in durum wheat. In the case of bread wheat, the adoption of an appropriate selection strategy resulted in the elimination of unfavorable traits and the release of high-yielding and stable varieties from synthetic hexaploid-derived lines [84]. This is where pre-breeding becomes crucial in the process of gene introgression from CWR. Pre-breeding should retain favorable alleles while returning the background of the elite parent through reasonable top crossing [78].

4.3. Impact of Wild Relatives on Yield Potential

The use of two contrasting recurrent parents, the landrace Haurani with low yield potential and high tolerance to drought, and Cham 5, a high yielding cultivar released in several countries, was useful. Haurani derivatives showed an important advantage in both yield and stability, and they overpassed their recurrent parent in most of the environments. For instance, line 142001, derived from T. Urartu, had significantly higher BLUPs associated with higher stability, according to both Bi and S2di. The same line showed a yield increase under drought stress, combined with earliness and cooler canopy under heat stress [77,85]. Under favorable conditions, some Haurani derivatives (142064 for example) can yield twice as much as the recurrent parent, which indicates a high contribution to yield potential. In the case of Cham5, which is high yielding, the expected contribution of wild relatives can be more pronounced under stressed environments. The top yielding lines under drought stress at TSRF-17 were Cham5 derivatives crossed with the four wild parents. In fact, line 142026 (Cham5*3/T. urartu) outyielded Cham5 under optimal conditions (TSIR-17) and was subject to lower yield losses due to drought. Similarly to our results, a significant increase in yield and stability was also reported using T. dicoccoides and T. monococcum under drought and terminal stress [42]. The value of CWR in Cham5 derivatives was even greater under heat stress during both seasons. The contribution to heat tolerance was observed at the level of yield and its components (T. dicoccoides and T. urartu), phenology (T. urartu) and physiological response (T. aegilopoides, T. urartu, and T. dicoccoides) [77,85,86,87]. The results from MCH-18, which was the most favorable environment, were interesting. Cham5 had the highest yield, followed by four of its derivatives, with yields above 9 tones/ha. This finding showed that the use of CWR from the primary gene pool does not always come with a penalty on yield. These findings confirm that the increase in yield from crosses with wild relatives is mainly attributed, but not restricted, to the improvement of resistance/tolerance to biotic and abiotic stresses [25,26].

4.4. Yield Stability of the Durum Wheat Derivatives

Our study used different stability approaches to select stable genotypes for both biological (static) and agronomic (dynamic) stability. It was not surprising that most of the checks had high agronomic stability, especially that Cham1 (syn. 129080), Cham5 (syn. 129081), Louiza and Marzak had wide adaptation combined with moderate to high yield potential. When balancing productivity and stability, several lines derived from crosses with T. aegilopoides, T. dicoccoides, T. urartu and Ae. speltoides were identified. For example, lines 141995 (Cham5*4/Ae. speltoides) and 141966 (Cham5*2/T. dicoccoides) had yields above average, lower variance (σi2) and deviation from regression (S2di). In addition, they were highly stable according to SIPC, WAASY and the non-parametric indices (Si2, Si3 and Si6). These lines are desirable under unpredictable weather conditions, as they can maintain average performance during poor seasons and respond positively to favorable conditions. The line 142074 (Cham5*3/T. dicoccoides) can also be recommended for its dynamic stability, as it was highly ranked for Pi, BLUPs, GAI, Si6 and had average stability for WAASY. These findings are in line with the reported contribution of T. dicoccoides and Ae. speltoides to yield stability while conserving high yield potential [83,88]. Simmonds et al. [89] reported the release of a bread wheat variety derived from a cross with T. dicoccoides, which exhibited high stability under different environments and cultural practices. The contribution of CWR to yield stability can be the result of the simultaneous improvement of yield and its components under unfavorable environments [90,91,92,93,94,95,96]. Our results showed that the use of wild relatives can supply lines with wide adaptation, and lines specifically adapted to unfavorable or favorable environments.

4.5. Association between Different Stability Parameters

Selection from multi-environment trials is an important component for plant breeders, and the adoption of appropriate statistical analysis is crucial to improve the selection accuracy. The use of a linear mixed model provided a significant advantage as it accounted for the heterogeneity of the variance between environments. The advantage of mixed models in increasing the prediction accuracy has been reported in other studies [59,97]. Interestingly, BLUPs did not correlate significantly with the SIPC and ASV from the AMMI model. The reason behind this is that these indices select lines with low contribution to GEI, which will favor lines with average yield performance. This also explains why SIPC and ASV were clustered with the S2di and σi2 and confirms the positive association previously reported by Sneller et al. [56]. The negative correlation between CV and BLUPs was useful, as it allowed the elimination of the less stable lines combining low yield potential with high variation. The value of the regression coefficient to select for agronomic stability was confirmed by its correlation with Pi, BLUPs and GAI. Different and sometimes opposite correlations between the stability statistics have been reported by other studies [21,68,98,99,100]. These correlations varied based on the population structures and environmental characteristics. In this view, flexible stability statistics such as the superiority index WAASY can be more useful. The weights of productivity and stability can be adjusted depending the yield, size of the population, and the environment to select superior genotypes.

5. Conclusions

The backcrossing population of durum wheat provided a view on the performance of different lines derived from similar crosses with regard to linkage drag. Many lines can be selected for the unpredictable climatic conditions of the Mediterranean region. These lines combine high productivity and stability. It was concluded that it is possible to develop diverse adapted high-yielding germplasm using CWR. This can be achieved by deploying the proper selection schemes at the pre-breeding level. WAASY can be recommended as a flexible stability index to select for stable and highly productive germplasm.

Supplementary Materials

The following are available online at https://www.mdpi.com/article/10.3390/agronomy11101992/s1, Table S1: List of accessions and checks used in the trials with accession number, DOIs and pedigree.

Author Contributions

Conceptualization and methodology, H.A. and A.A.; Germplasm development, J.V.; statistical analysis, H.A. and Z.K.; data curation, H.A.; writing—original draft preparation, H.A.; writing—review and editing, H.A., A.A., B.B., Z.K., A.F.-M. and J.V. All authors have read and agreed to the published version of the manuscript.

Funding

This research was supported financially by the Wheat CRP and GIZ-funding attributed to ICARDA gene bank.

Institutional Review Board Statement

Not applicable.

Informed Consent Statement

Not applicable.

Data Availability Statement

Not applicable.

Acknowledgments

The authors would like to thank A. Tsivelikas for providing the germplasm, R. Youssef and M. Bounagua, and the INRA station managers for the technical support in conducting field trials in Morocco, I. Tahir and S. Meheesi for field trials and data from Wad Medani in Sudan.

Conflicts of Interest

The authors declare no conflict of interest.

References

  1. Beres, B.L.; Rahmani, E.; Clarke, J.M.; Grassini, P.; Pozniak, C.J.; Geddes, C.M.; Porker, K.D.; May, W.E.; Ransom, J.K. A Systematic Review of Durum Wheat: Enhancing Production Systems by Exploring Genotype, Environment, and Management (G × E × M) Synergies. Front. Plant Sci. 2020, 11, 568657. [Google Scholar] [CrossRef]
  2. Sissons, M. Role of Durum Wheat Composition on the Quality of Pasta and Bread. Food 2008, 2, 75–90. [Google Scholar]
  3. Lidon, F.; Almeida, A.; Leitao, A.; Silva, M.; Pinheiro, N.; Macas, B.; Costa, R. A Synoptic Overview of Durum Wheat Production in the Mediterranean Region and Processing Following the European Union Requirements. Emir. J. Food Agric. 2014, 26, 693. [Google Scholar] [CrossRef] [Green Version]
  4. Able, J.; Sissons, M. Durum Wheat for the Future: Challenges, Research and Prospects in the 21st Century. Crop Pasture Sci. 2014, 65. [Google Scholar] [CrossRef]
  5. Lhaloui, S.; Buschman, L.; Bouhssini’, M.E.; Starks, K.; Kfith, D.; Houssaini, K.E. Control of Mayetiola Species (Diptera: Cecidomyiidae) with Carbofuran in Bread Wheat, Durum Wheat and Barley, with Yield Loss Assessment and Its Economic Analysis. Awamia 1992, 77, 55–73. [Google Scholar]
  6. Bassi, F.M.; Brahmi, H.; Sabraoui, A.; Amri, A.; Nsarellah, N.; Nachit, M.M.; Al-Abdallat, A.; Chen, M.S.; Lazraq, A.; El Bouhssini, M. Genetic Identification of Loci for Hessian Fly Resistance in Durum Wheat. Mol. Breed. 2019, 39, 24. [Google Scholar] [CrossRef] [Green Version]
  7. Rajaram, S.; Saari, E.E.; Hettel, G.P.; International Maize and Wheat Improvement Center (Eds.) Durum Wheats: Challenges and Opportunities. In Proceedings of the International Workshop, Ciudad Obregon, Mexico, 23–25 March 1992; International Maize and Wheat Improvement Center: Ciudad Obregon, Mexico, 1992. ISBN 978-968-6127-77-5. [Google Scholar]
  8. Marasas, C.N.; Smale, M.; Singh, R.P. The Economic Impact in Developing Countries of Leaf Rust Resistance Breeding in CIMMYT-Related Spring Bread Wheat; Economics Program Paper 04-01; CIMMYT: México, Mexico, 2003. [Google Scholar]
  9. Herrera-Foessel, S.A.; Singh, R.P.; Huerta-Espino, J.; Crossa, J.; Yuen, J.; Djurle, A. Effect of Leaf Rust on Grain Yield and Yield Traits of Durum Wheats with Race-Specific and Slow-Rusting Resistance to Leaf Rust. Plant Dis. 2006, 90, 1065–1072. [Google Scholar] [CrossRef]
  10. Ordoñez, M.E.; Kolmer, J.A. Virulence Phenotypes of a Worldwide Collection of Puccinia triticina from Durum Wheat. Phytopathology 2007, 97, 344–351. [Google Scholar] [CrossRef] [PubMed] [Green Version]
  11. Vergara-Diaz, O.; Kefauver, S.C.; Elazab, A.; Nieto-Taladriz, M.T.; Araus, J.L. Grain Yield Losses in Yellow-Rusted Durum Wheat Estimated Using Digital and Conventional Parameters under Field Conditions. Crop J. 2015, 3, 200–210. [Google Scholar] [CrossRef] [Green Version]
  12. Li, Y.; Ye, W.; Wang, M.; Yan, X. Climate Change and Drought: A Risk Assessment of Crop-Yield Impacts. Clim. Res. 2009, 39, 31–46. [Google Scholar] [CrossRef]
  13. Lobell, D.B.; Schlenker, W.; Costa-Roberts, J. Climate Trends and Global Crop Production Since 1980. Science 2011, 333, 616–620. [Google Scholar] [CrossRef] [Green Version]
  14. Asseng, S.; Ewert, F.; Martre, P.; Rötter, R.P.; Lobell, D.B.; Cammarano, D.; Kimball, B.A.; Ottman, M.J.; Wall, G.W.; White, J.W.; et al. Rising Temperatures Reduce Global Wheat Production. Nat. Clim Chang. 2015, 5, 143–147. [Google Scholar] [CrossRef]
  15. Turner, N.C.; Blum, A.; Cakir, M.; Steduto, P.; Tuberosa, R.; Young, N. Strategies to Increase the Yield and Yield Stability of Crops under Drought—Are We Making Progress? Funct. Plant Biol. 2014, 41, 1199. [Google Scholar] [CrossRef]
  16. Zhang, A.; Hochman, Z.; Horan, H.; Navarro, J.G.; Das, B.T.; Waldner, F. Socio-Psychological and Management Drivers Explain Farm Level Wheat Yield Gaps in Australia. Agron. Sustain. Dev. 2019, 39, 10. [Google Scholar] [CrossRef] [Green Version]
  17. Padovan, G. Understanding Effects of Genotype × Environment × Sowing Window Interactions for Durum Wheat in the Mediterranean Basin. Field Crop. Res. 2020, 259, 107969. [Google Scholar] [CrossRef]
  18. Xiong, W.; Reynolds, M.; Crossa, J.; Payne, T.; Schulthess, U.; Sonder, K.; Addimando, N.; Singh, R.; Ammar, K.; Gerard, B. Climate Change Has Increased Genotype-Environment Interactions in Wheat Breeding. Res. Sq. 2020. In Review. [Google Scholar]
  19. De Vita, P.; Mastrangelo, A.M.; Matteu, L.; Mazzucotelli, E.; Virzì, N.; Palumbo, M.; Storto, M.L.; Rizza, F.; Cattivelli, L. Genetic Improvement Effects on Yield Stability in Durum Wheat Genotypes Grown in Italy. Field Crop. Res. 2010, 119, 68–77. [Google Scholar] [CrossRef]
  20. Cattivelli, L.; Franco, M.; Alessandro, Z.; Fulvia, R.; Mastrangelo, A.M.; Pasquale, D.V.; Elisabetta, M. Adaptation of Durum Wheat to a Changing Environment. In Proceedings of the International Symposium on Genetics and Breeding of Durum Wheat; CIHEAM: Bari, Italy, 2014; pp. 279–282. [Google Scholar]
  21. Mohammadi, R.; Amri, A. Genotype x Environment Interaction Implication: A Case Study of Durum Wheat Breeding in Iran. In Advances in Plant Breeding Strategies: Agronomic, Abiotic and Biotic Stress Traits; Al-Khayri, J.M., Jain, S.M., Johnson, D.V., Eds.; Springer International Publishing: Cham, Switzerland, 2016; pp. 515–558. ISBN 978-3-319-22517-3. [Google Scholar]
  22. Cattivelli, L.; Rizza, F.; Badeck, F.-W.; Mazzucotelli, E.; Mastrangelo, A.M.; Francia, E.; Marè, C.; Tondelli, A.; Stanca, A.M. Drought Tolerance Improvement in Crop Plants: An Integrated View from Breeding to Genomics. Field Crop. Res. 2008, 105, 1–14. [Google Scholar] [CrossRef]
  23. Mickelbart, M.V.; Hasegawa, P.M.; Bailey-Serres, J. Genetic Mechanisms of Abiotic Stress Tolerance That Translate to Crop Yield Stability. Nat. Rev. Genet. 2015, 16, 237–251. [Google Scholar] [CrossRef] [PubMed]
  24. Arnold, P.A.; Nicotra, A.B.; Kruuk, L.E.B. Sparse Evidence for Selection on Phenotypic Plasticity in Response to Temperature. Phil. Trans. R. Soc. B 2019, 374, 20180185. [Google Scholar] [CrossRef] [PubMed] [Green Version]
  25. Hajjar, R.; Hodgkin, T. The Use of Wild Relatives in Crop Improvement: A Survey of Developments over the Last 20 Years. Euphytica 2007, 156, 1–13. [Google Scholar] [CrossRef]
  26. Mondal, S.; Rutkoski, J.E.; Velu, G.; Singh, P.K.; Crespo-Herrera, L.A.; Guzmán, C.; Bhavani, S.; Lan, C.; He, X.; Singh, R.P. Harnessing Diversity in Wheat to Enhance Grain Yield, Climate Resilience, Disease and Insect Pest Resistance and Nutrition Through Conventional and Modern Breeding Approaches. Front. Plant Sci. 2016, 7, 991. [Google Scholar] [CrossRef] [Green Version]
  27. Anikster, Y.; Manisterski, J.; Long, D.L.; Leonard, K.J. Leaf Rust and Stem Rust Resistance in Triticum dicoccoides Populations in Israel. Plant Dis. 2005, 89, 55–62. [Google Scholar] [CrossRef] [PubMed] [Green Version]
  28. Peleg, Z.; Saranga, Y.; Yazici, A.; Fahima, T.; Ozturk, L.; Cakmak, I. Grain Zinc, Iron and Protein Concentrations and Zinc-Efficiency in Wild Emmer Wheat under Contrasting Irrigation Regimes. Plant Soil 2008, 306, 57–67. [Google Scholar] [CrossRef] [Green Version]
  29. Suneja, Y.; Gupta, A.K.; Bains, N.S. Stress Adaptive Plasticity: Aegilops tauschii and Triticum dicoccoides as Potential Donors of Drought Associated Morpho-Physiological Traits in Wheat. Front. Plant Sci. 2019, 10, 211. [Google Scholar] [CrossRef] [Green Version]
  30. Marais, G.F.; Pretorius, Z.A.; Wellings, C.R.; McCallum, B.; Marais, A.S. Leaf Rust and Stripe Rust Resistance Genes Transferred to Common Wheat from Triticum dicoccoides. Euphytica 2005, 143, 115–123. [Google Scholar] [CrossRef]
  31. Vikal, Y.; Chhuneja, P.; Singh, R.; Dhaliwal, H.S. Tagging of an Aegilops speltoides Derived Leaf Rust Resistance Gene Lr 28 with a Microsatellite Marker in Wheat. J. Plant Biochem. Biotechnol. 2004, 13, 47–49. [Google Scholar] [CrossRef]
  32. Tanguy, A.-M.; Coriton, O.; Abélard, P.; Dedryver, F.; Jahier, J. Structure of Aegilops ventricosa Chromosome 6N, the Donor of Wheat Genes Yr17, Lr37, Sr38, and Cre5. Genome 2005, 48, 541–546. [Google Scholar] [CrossRef] [PubMed]
  33. Marais, G.F.; McCallum, B.; Snyman, J.E.; Pretorius, Z.A.; Marais, A.S. Leaf Rust and Stripe Rust Resistance Genes Lr54 and Yr37 Transferred to Wheat from Aegilops kotschyi. Plant Breed. 2005, 124, 538–541. [Google Scholar] [CrossRef]
  34. Hovhannisyan, N.A.; Dulloo, M.E.; Yesayan, A.H.; Knüpffer, H.; Amri, A. Tracking of Powdery Mildew and Leaf Rust Resistance Genes in Triticum boeoticum and T. urartu, Wild Relatives of Common Wheat. Czech J. Genet. Plant Breed. 2011, 47, 45–57. [Google Scholar] [CrossRef] [Green Version]
  35. Rouse, M.N.; Olson, E.L.; Gill, B.S.; Pumphrey, M.O.; Jin, Y. Stem Rust Resistance in Aegilops tauschii Germplasm. Crop Sci. 2011, 51, 2074–2078. [Google Scholar] [CrossRef]
  36. Millet, E.; Manisterski, J.; Ben-Yehuda, P.; Distelfeld, A.; Deek, J.; Wan, A.; Chen, X.; Steffenson, B.J. Introgression of Leaf Rust and Stripe Rust Resistance from Sharon Goatgrass (Aegilops sharonensis Eig) into Bread Wheat (Triticum aestivum L.). Genome 2014, 57, 309–316. [Google Scholar] [CrossRef] [PubMed]
  37. Cruz, C.D.; Peterson, G.L.; Bockus, W.W.; Kankanala, P.; Dubcovsky, J.; Jordan, K.W.; Akhunov, E.; Chumley, F.; Baldelomar, F.D.; Valent, B. The 2NS Translocation from Aegilops Ventricosa Confers Resistance to the Triticum Pathotype of Magnaporthe oryzae. Crop Sci. 2016, 56, 990–1000. [Google Scholar] [CrossRef] [Green Version]
  38. El Bouhssini, M.; Benlhabib, O.; Nachit, M.M.; Houari, A.; Bentika, A.; Nsarellah, N.; Lhaloui, S. Identification in Aegilops Species of Resistant Sources to Hessian Fly (Diptera: Cecidomyiidae) in Morocco. Genet. Resour. Crop Evol. 1998, 45, 343–345. [Google Scholar] [CrossRef]
  39. Nsarellah, N.; Amri, A.; Nachit, M.M.; El Bouhssini, M.; Lhaloui, S. New Durum Wheat with Hessian Fly Resistance from Triticum araraticum and T. carthlicum in Morocco. Plant Breed. 2003, 122, 435–437. [Google Scholar] [CrossRef]
  40. Gororo, N.N.; Eagles, H.A.; Eastwood, R.F.; Nicolas, M.E.; Flood, R.G. Use of Triticum tauschii to Improve Yield of Wheat in Low-Yielding Environments. Euphytica 2001, 123, 241–254. [Google Scholar] [CrossRef]
  41. Pradhan, G.P.; Prasad, P.V.V.; Fritz, A.K.; Kirkham, M.B.; Gill, B.S. High Temperature Tolerance in Aegilops Species and Its Potential Transfer to Wheat. Crop Sci. 2012, 52, 292–304. [Google Scholar] [CrossRef] [Green Version]
  42. Nachit, M.M.; Elouafi, I. Durum Wheat Adaptation in the Mediterranean Dryland: Breeding, Stress Physiology, and Molecular Markers. In CSSA Special Publications; Rao, S.C., Ryan, J., Eds.; Crop Science Society of America and American Society of Agronomy: Madison, WI, USA, 2004; pp. 203–218. ISBN 978-0-89118-611-3. [Google Scholar]
  43. Dreisigacker, S.; Kishii, M.; Lage, J.; Warburton, M. Use of Synthetic Hexaploid Wheat to Increase Diversity for CIMMYT Bread Wheat Improvement. Aust. J. Agric. Res. 2008, 59, 413. [Google Scholar] [CrossRef]
  44. Finlay, K.; Wilkinson, G. The Analysis of Adaptation in a Plant-Breeding Programme. Aust. J. Agric. Res. 1963, 14, 742. [Google Scholar] [CrossRef] [Green Version]
  45. Eberhart, S.A.; Russell, W.A. Stability Parameters for Comparing Varieties. Crop Sci. 1966, 6, 36–40. [Google Scholar] [CrossRef] [Green Version]
  46. Wricke, G. On a Method of Understanding the Biological Diversity in Field Research. Z. Pfl.-Zucht 1962, 92–146. [Google Scholar]
  47. Shukla, G.K. Some Statistical Aspects of Partitioning Genotype-Environmental Components of Variability. Heredity 1972, 29, 237–245. [Google Scholar] [CrossRef] [PubMed]
  48. Becker, H.C.; Leon, J. Stability Analysis in Plant Breeding. Plant Breed. 1988, 101, 1–23. [Google Scholar] [CrossRef]
  49. Francis, T.R.; Kannenberg, L.W. Yield stability studies in short-season maize. I. A descriptive method for grouping genotypes. Can. J. Plant Sci. 1978, 58, 1029–1034. [Google Scholar] [CrossRef]
  50. Roemer, J. Sinde Die Ertagdreichen Sorten Ertagissicherer? Mitt DLG 1917, 32, 87–89. [Google Scholar]
  51. Lin, C.S.; Binns, M.R. A superiority measure of cultivar performance for cultivar × location data. Can. J. Plant Sci. 1988, 68, 193–198. [Google Scholar] [CrossRef]
  52. Huehn, M. Beitrage Zur Erfassung Der Phanotypischen Stabilitat. EDV Med. Biol. 1979, 10, 112–117. [Google Scholar]
  53. Nassar, R.; Huhn, M. Studies on Estimation of Phenotypic Stability: Tests of Significance for Nonparametric Measures of Phenotypic Stability. Biometrics 1987, 43, 45. [Google Scholar] [CrossRef]
  54. Zobel, R.W.; Wright, M.J.; Gauch, H.G. Statistical Analysis of a Yield Trial. Agron. J. 1988, 80, 388–393. [Google Scholar] [CrossRef]
  55. Gauch, H.G. Model Selection and Validation for Yield Trials with Interaction. Biometrics 1988, 44, 705. [Google Scholar] [CrossRef]
  56. Sneller, C.H.; Kilgore-Norquest, L.; Dombek, D. Repeatability of Yield Stability Statistics in Soybean. Crop Sci. 1997, 37, 383–390. [Google Scholar] [CrossRef]
  57. Purchase, J.L.; Hatting, H.; van Deventer, C.S. Genotype × Environment Interaction of Winter Wheat (Triticum aestivum L.) in South Africa: II. Stability Analysis of Yield Performance. S. Afr. J. Plant Soil 2000, 17, 101–107. [Google Scholar] [CrossRef]
  58. Zali, H.; Farshadfar, E.; Sabaghpour, S.; Karimizadeh, R. Evaluation of Genotype × Environment Interaction in Chickpea Using Measures of Stability from AMMI Model. Ann. Biol. Res. 2012, 3, 3126–3136. [Google Scholar]
  59. Olivoto, T.; Lúcio, A.D.C.; Silva, J.A.G.; Marchioro, V.S.; Souza, V.Q.; Jost, E. Mean Performance and Stability in Multi-Environment Trials I: Combining Features of AMMI and BLUP Techniques. Agron. J. 2019, 111, 2949–2960. [Google Scholar] [CrossRef]
  60. Covarrubias-Pazaran, G. Genome-Assisted Prediction of Quantitative Traits Using the R Package Sommer. PLoS ONE 2016, 11, e0156744. [Google Scholar] [CrossRef] [PubMed] [Green Version]
  61. R Core Team. R: A Language and Environment for Statistical Computing; R Foundation for Statistical Computing: Vienna, Austria, 2021. [Google Scholar]
  62. Olivoto, T.; Lúcio, A.D. Metan: An R Package for Multi-Environment Trial Analysis. Methods Ecol. Evol. 2020, 11, 783–789. [Google Scholar] [CrossRef]
  63. Alvarado, G.; Rodríguez, F.M.; Pacheco, A.; Burgueño, J.; Crossa, J.; Vargas, M.; Pérez-Rodríguez, P.; Lopez-Cruz, M.A. META-R: A Software to Analyze Data from Multi-Environment Plant Breeding Trials. Crop J. 2020, 8, 745–756. [Google Scholar] [CrossRef]
  64. Yan, W.; Hunt, L.A.; Sheng, Q.; Szlavnics, Z. Cultivar Evaluation and Mega-Environment Investigation Based on the GGE Biplot. Crop Sci. 2000, 40, 597–605. [Google Scholar] [CrossRef]
  65. Dumble, S. GGEBiplots: GGE Biplots with “Ggplot2”. R Package Version 0.1.1. 2017. Available online: https://CRAN.R-project.org/package=GGEBiplots (accessed on 1 September 2021).
  66. Cooper, M.; DeLacy, I.H. Relationships among Analytical Methods Used to Study Genotypic Variation and Genotype-by-Environment Interaction in Plant Breeding Multi-Environment Experiments. Theoret. Appl. Genet. 1994, 88, 561–572. [Google Scholar] [CrossRef]
  67. Cheshkova, A. Agrostab: Stability Analysis for Agricultural Research. R Package Version 0.1.0. 2019. Available online: https://CRAN.R-Project.Org/Package=agrostab (accessed on 1 September 2021).
  68. Mohammadi, R.; Amri, A. Comparison of Parametric and Non-Parametric Methods for Selecting Stable and Adapted Durum Wheat Genotypes in Variable Environments. Euphytica 2008, 159, 419–432. [Google Scholar] [CrossRef]
  69. Harrell, F.; Dupont, C. Hmisc: Harrell Miscellaneous. R Package Version 4.4-1. 2020. Available online: https://CRAN.R-Proj.Org/Package=Hmisc (accessed on 1 September 2021).
  70. Wei, T.; Simko, V. R Package “Corrplot”: Visualization of a Correlation Matrix. R Package Version 0.90. 2021. Available online: https://github.com/taiyun/corrplot (accessed on 1 September 2021).
  71. Ceccarelli, S.; Erskine, W. Genotype by Environment Interaction and International Breeding Programs. Exp. Agric. 1994, 30, 177–187. [Google Scholar] [CrossRef]
  72. Oliveira, I.C.M.; Guilhen, J.H.S.; de Ribeiro, P.C.O.; Gezan, S.A.; Schaffert, R.E.; Simeone, M.L.F.; Damasceno, C.M.B.; de Carneiro, J.E.S.; Carneiro, P.C.S.; da Parrella, R.A.C.; et al. Genotype-by-Environment Interaction and Yield Stability Analysis of Biomass Sorghum Hybrids Using Factor Analytic Models and Environmental Covariates. Field Crop. Res. 2020, 257, 107929. [Google Scholar] [CrossRef]
  73. de Leon, N.; Jannink, J.-L.; Edwards, J.W.; Kaeppler, S.M. Introduction to a Special Issue on Genotype by Environment Interaction. Crop Sci. 2016, 56, 2081–2089. [Google Scholar] [CrossRef] [Green Version]
  74. Ferrise, R.; Toscano, P.; Pasqui, M.; Moriondo, M.; Primicerio, J.; Semenov, M.; Bindi, M. Monthly-to-Seasonal Predictions of Durum Wheat Yield over the Mediterranean Basin. Clim. Res. 2015, 65, 7–21. [Google Scholar] [CrossRef] [Green Version]
  75. Chairi, F.; Aparicio, N.; Serret, M.D.; Araus, J.L. Breeding Effects on the Genotype × Environment Interaction for Yield of Durum Wheat Grown after the Green Revolution: The Case of Spain. Crop J. 2020, 8, 623–634. [Google Scholar] [CrossRef]
  76. Bassi, F.M.; Nachit, M.M. Genetic Gain for Yield and Allelic Diversity over 35 Years of Durum Wheat Breeding at ICARDA. Crop Breed. Genet. Genom. 2019, 1, e190004. [Google Scholar] [CrossRef] [Green Version]
  77. Aberkane, H.; Amri, A.; Belkadi, B.; Filali-Maltouf, A.; Kehel, Z.; Tahir, I.S.A.; Meheesi, S.; Tsivelikas, A. Evaluation of Durum Wheat Lines Derived from Interspecific Crosses under Drought and Heat Stress. Crop Sci. 2021, 61, 119–136. [Google Scholar] [CrossRef]
  78. Hao, M.; Zhang, L.; Ning, S.; Huang, L.; Yuan, Z.; Wu, B.; Yan, Z.; Dai, S.; Jiang, B.; Zheng, Y.; et al. The Resurgence of Introgression Breeding, as Exemplified in Wheat Improvement. Front. Plant Sci. 2020, 11, 252. [Google Scholar] [CrossRef] [Green Version]
  79. Warburton, M.L.; Crossa, J.; Franco, J.; Kazi, M.; Trethowan, R.; Rajaram, S.; Pfeiffer, W.; Zhang, P.; Dreisigacker, S.; Ginkel, M. van Bringing Wild Relatives Back into the Family: Recovering Genetic Diversity in CIMMYT Improved Wheat Germplasm. Euphytica 2006, 149, 289–301. [Google Scholar] [CrossRef]
  80. Kameswara Rao, N.; Reddy, L.J.; Bramel, P.J. Potential of Wild Species for Genetic Enhancement of Some Semi-Arid Food Crops. Genet. Resour. Crop Evol. 2003, 50, 707–721. [Google Scholar] [CrossRef]
  81. Kishii, M. An Update of Recent Use of Aegilops Species in Wheat Breeding. Front. Plant Sci. 2019, 10, 585. [Google Scholar] [CrossRef] [Green Version]
  82. Valkoun, J. Wheat Pre-Breeding Using Wild Progenitors. Euphytica 2001, 119, 17–23. [Google Scholar] [CrossRef]
  83. El Haddad, N.; Kabbaj, H.; Zaïm, M.; El Hassouni, K.; Tidiane Sall, A.; Azouz, M.; Ortiz, R.; Baum, M.; Amri, A.; Gamba, F.; et al. Crop Wild Relatives in Durum Wheat Breeding: Drift or Thrift? Crop Sci. 2021, 61, 37–54. [Google Scholar] [CrossRef]
  84. Li, J.; Wan, H.; Yang, W. Synthetic Hexaploid Wheat Enhances Variation and Adaptive Evolution of Bread Wheat in Breeding Processes. J. Sytemat. Evol. 2014, 52, 735–742. [Google Scholar] [CrossRef]
  85. Aberkane, H.; Belkadi, B.; Kehel, Z.; Filali-Maltouf, A.; Tahir, I.S.A.; Meheesi, S.; Amri, A. Assessment of Drought and Heat Tolerance of Durum Wheat Lines Derived from Interspecific Crosses Using Physiological Parameters and Stress Indices. Agronomy 2021, 11, 695. [Google Scholar] [CrossRef]
  86. Khanna-Chopra, R.; Viswanathan, C. Evaluation of Heat Stress Tolerance in Irrigated Environment of T. Aestivum and Related Species. I. Stability in Yield and Yield Components. Euphytica 1999, 106, 169–180. [Google Scholar] [CrossRef]
  87. Ullah, S.; Bramley, H.; Daetwyler, H.; He, S.; Mahmood, T.; Thistlethwaite, R.; Trethowan, R. Genetic Contribution of Emmer Wheat (Triticum dicoccon Schrank) to Heat Tolerance of Bread Wheat. Front. Plant Sci. 2018, 9, 1529. [Google Scholar] [CrossRef] [PubMed] [Green Version]
  88. Zaïm, M.; El Hassouni, K.; Gamba, F.; Filali-Maltouf, A.; Belkadi, B.; Sourour, A.; Amri, A.; Nachit, M.; Taghouti, M.; Bassi, F.M. Wide Crosses of Durum Wheat (Triticum durum Desf.) Reveal Good Disease Resistance, Yield Stability, and Industrial Quality across Mediterranean Sites. Field Crop. Res. 2017, 214, 219–227. [Google Scholar] [CrossRef]
  89. Simmonds, J.R.; Fish, L.J.; Leverington-Waite, M.A.; Wang, Y.; Howell, P.; Snape, J.W. Mapping of a Gene (Vir) for a Non-Glaucous, Viridescent Phenotype in Bread Wheat Derived from Triticum dicoccoides, and Its Association with Yield Variation. Euphytica 2008, 159, 333–341. [Google Scholar] [CrossRef]
  90. Farooq, S. Production of Low Input and Stress Tolerant Wheat Germplasm through the Use of Biodiversity Residing in the Wild Relatives. Hereditas 2004, 135, 211–215. [Google Scholar] [CrossRef] [Green Version]
  91. Peleg, Z.; Fahima, T.; Abbo, S.; Krugman, T.; Nevo, E.; Yakir, D.; Saranga, Y. Genetic Diversity for Drought Resistance in Wild Emmer Wheat and Its Ecogeographical Associations. Plant Cell Environ. 2005, 28, 176–191. [Google Scholar] [CrossRef]
  92. Reynolds, M.; Foulkes, M.J.; Slafer, G.A.; Berry, P.; Parry, M.A.J.; Snape, J.W.; Angus, W.J. Raising Yield Potential in Wheat. J. Exp. Bot. 2009, 60, 1899–1918. [Google Scholar] [CrossRef] [Green Version]
  93. Lopes, M.S.; Reynolds, M.P. Drought Adaptive Traits and Wide Adaptation in Elite Lines Derived from Resynthesized Hexaploid Wheat. Crop Sci. 2011, 51, 1617–1626. [Google Scholar] [CrossRef]
  94. Peng, J.; Sun, D.; Peng, Y.; Nevo, E. Gene Discovery in Triticum dicoccoides, the Direct Progenitor of Cultivated Wheats. Cereal Res. Commun. 2013, 41, 1–22. [Google Scholar] [CrossRef]
  95. Djanaguiraman, M.; Prasad, P.V.V.; Kumari, J.; Sehgal, S.K.; Friebe, B.; Djalovic, I.; Chen, Y.; Siddique, K.H.M.; Gill, B.S. Alien Chromosome Segment from Aegilops speltoides and Dasypyrum Villosum Increases Drought Tolerance in Wheat via Profuse and Deep Root System. BMC Plant Biol. 2019, 19, 242. [Google Scholar] [CrossRef] [PubMed] [Green Version]
  96. Kuzmanović, L.; Giovenali, G.; Ruggeri, R.; Rossini, F.; Ceoloni, C. Small “Nested” Introgressions from Wild Thinopyrum Species, Conferring Effective Resistance to Fusarium Diseases, Positively Impact Durum Wheat Yield Potential. Plants 2021, 10, 579. [Google Scholar] [CrossRef]
  97. Friesen, L.F.; Brûlé-Babel, A.L.; Crow, G.H.; Rothenburger, P.A. Mixed Model and Stability Analysis of Spring Wheat Genotype Yield Evaluation Data from Manitoba, Canada. Can. J. Plant Sci. 2016, 96, 305–320. [Google Scholar] [CrossRef]
  98. Mehari, M.; Alamerew, S.; Lakew, B.; Yirga, H.; Tesfay, M. Parametric Stability Analysis of Malt Barley Genotypes for Grain Yield in Tigray, Ethiopia. World J. Agric. Sci. 2014, 10, 210–215. [Google Scholar] [CrossRef]
  99. Temesgen, T.; Keneni, G.; Sefera, T.; Jarso, M. Yield Stability and Relationships among Stability Parameters in Faba Bean (Vicia Faba L.) Genotypes. Crop J. 2015, 3, 258–268. [Google Scholar] [CrossRef] [Green Version]
  100. Fasahat, P. An Overview on the Use of Stability Parameters in Plant Breeding. Biom. Biostat. Int. J. 2015, 2, 00043. [Google Scholar] [CrossRef] [Green Version]
Figure 1. Boxplot of best linear unbiased estimations (BLUEs) and heritability for grain yield (GY) of durum wheat genotypes in the 15 environments included in the stability analysis. The dashed horizontal line represents the grand mean across all environments. The number above each boxplot represents the heritability in that environment and the red dots represent the outliers.
Agronomy 11 01992 g001
Figure 2. Estimated pairwise genetic correlation between 14 environments of grain yield of durum wheat tested genotypes.
Agronomy 11 01992 g002
Figure 3. Genotype and genotype-by-environment (GGE) biplot for the ranking of the 15 testing environments based on their representativeness and discrimination ability. The green line with an arrow points to the smallest circle representing the average environment. The environments closer to the central circle are the best in terms of both discrimination and representativeness.
Agronomy 11 01992 g003
Figure 4. Plot of Best linear unbiased predictions (BLUPs) for grain yield plotted against the regression coefficient (Bi). Each point represents a single breeding line. Vertical and horizontal lines represents the grand mean ± 1 SD of BLUPs and Bi, respectively. Blue color represents the first ranked breeding lines according to Bi, red color represents the first ranked breeding lines according to the squared deviation from the regression (S2di). Some labels were repelled using black arrows to avoid overlapping.
Agronomy 11 01992 g004
Figure 5. Plot of Best linear unbiased predictions (BLUPs) for grain yield plotted against Francis and Kannenberg (1978) coefficient of variation (CV). The red area highlights the undesirable genotypes while the green area highlights the stable and desirable genotypes. Vertical and horizontal dashed lines represent the mean of BLUPs and CV, respectively. Some labels were repelled using black arrows to avoid overlapping.
Agronomy 11 01992 g005
Figure 6. Plot of the best linear unbiased predictions (BLUPs) for grain yield versus the AMMI stability value (ASV) stability (A) and sum of the absolute value of the IPC scores (SIPC) (B) of tested durum genotypes. Vertical dashed line represents the average of BLUPs while the horizontal dashed lines represent the average of ASV (A) and SIPC (B). The green area represents the most desirable lines. Some labels were repelled using black arrows to avoid overlapping.
Agronomy 11 01992 g006
Figure 7. Pearson coefficient correlation between parametric and non-parametric stability parameters for 77 durum wheat lines across 15 environments. Correlation coefficients >0.22 are significant at α = 0.05.
Agronomy 11 01992 g007
Table 1. Pedigree and number of derivative lines from each cross.
Pedigree/NameWild Parent GenomeNumber of Lines
Cham5*2/T. dicoccoides IG 118178AuAuBB6
Cham5*3/T. dicoccoides IG 118178AuAuBB11
Haurani*2/T. urartu IG 45489AuAu4
Cham5*3/T. urartu IG 45488AuAu2
Cham5*3/T. aegilopoides IG 118180AmAm19
Cham5*2/T. urartu IG 118184AuAu2
Cham5*3/T. aegilopoides IG 118181AmAm1
Cham5*4/Ae. speltoides IG 47843SS (BB)6
Cham5*2/T. aegilopoides IG 118180AmAm3
Cham5*3/T. dicoccoides IG 118179AuAuBB2
Haurani*2/T. aegilopoides IG 118185AmAm2
Haurani*2/T. urartu IG 45475AuAu2
Cham5*3/T. urartu IG 118182AuAu3
Cham5*3/T. urartu IG 118184AuAu1
Cham5*4/Ae. speltoides IG 47844SS (BB)1
Cham5*2/T. urartu IG 118182AuAu1
Haurani*3/T. dicoccoides IG 118178AuAuBB1
Checks -8
Recurrent parents-2
The IG refers to the accession number of the wild parent at the ICARDA genebank. The number following the Asterix (*) refers to the number of backcrosses.
Table 2. Location, seasons, and codes for the testing environments of durum wheat derivatives.
LocationCountryLongLatSeasonENVSowing DateTreatment
Allal
Tazi
Morocco34°31′ N6°14′ W2016–17AT-172016/11/12RFD
2017–18AT-182017/11/21RFD
AnnoceurMorocco33°41′ N4°51′ W2016–17AN-172016/12/02RFD
2017–18AN-182017/11/21RFD
MarchouchMorocco33°36′ N6°42′ W2015–16MCH-162015/12/16SIR
2016–17MCH-172016/11/19RFD
2017–18MCH-182017/11/29RFD
Melk
Zher
Morocco30°02′ N9°33′ W2015–16MZIR-162015/12/21FIR
2015–16MZRF-162015/12/21SIR
TessaoutMorocco31°49′ N7°25′ W2016–17TSIR-172016/12/14FIR
2016–17TSRF-172016/12/14RFD
2017–18TSIR-182017/12/22FIR
2017–18TSRF-182017/12/22RFD
Wad MedaniSudan14°24′ N33°31′ E2016–17WMD-172016/12/18FIR
2017–18WMD-182017/12/07FIR
RFD, Rainfed conditions; SIR; supplementary irrigation; FIR, Full irrigation; ENV, the combination of the location, the year, and the treatment.
Table 3. Combined analysis of variance from the linear mixed model of durum wheat lines derived from interspecific crosses and checks grown in contrasted environments in Morocco and Sudan.
Source of VariationDFVariance Component
ENV Mean Sq (f)14536,126,241 ***
Genotypic variance (r)-221,131 ***
GE interaction variance (r)-213,091 ***
AN-17 residuals (r)-264,403
AN-18 residuals (r)-314,508
AT-17 residuals (r)-466,464
AT-18 residuals (r)-722,924
MCH-16 residuals (r)-1,268,491
MCH-17 residuals (r)-332,655
MCH-18 residuals (r)-2,107,375
MZIR-16 residuals (r)-2,075,582
MZRF-16 residuals (r)-795,924
TSIR-17 residuals (r)-1,469,300
TSIR-18 residuals (r)-1,269,044
TSRF-17 residuals (r)-404,398
TSRF-18 residuals (r)-566,288
WMD-17 residuals (r)-297,060
WMD-18 residuals (r)-203,483
f, Fixed effects; r, Random effects; ***, significant at p < 0.001. AN, Annoceur; AT, Allal Tazi; MCH, Marchouch; MZIR, Melk Zher Irrigated; MZRF, Melk Zher Rainfed; TSIR, Tessaout Irrigated; TSRF, Tessaout Rainfed; WMD, Wad Medani; the numbers after the dash 16, 17 and 18 represent the cropping seasons 2015–2016, 2016–2017 and 2017–2018, respectively.
Table 4. Analysis of variance and significant interaction components from the AMMI model of durum wheat lines derived from interspecific crosses and checks grown in contrasted environments in Morocco and Sudan.
SourceDfMean Sq% TSSGEI Proportion (%)Accumulated
ENV14383,602,598 ***66.93--
REP(ENV)1510,556,057 ***1.973--
BLOCK(REP*ENV)3001,055,308 ***3.94--
GEN768,857,688 ***8.39--
GEN:ENV10611,417,790 ***18.74--
Residuals808716,543-
PC1893,871,018-22.622.6
PC2872,840,469-16.238.8
PC3852,148,503-1250.7
PC4831,854,171-10.160.8
PC5811,343,685-7.168
PC6791,361,599-775
PC7771,111,644-5.680.6
ENV, Environment; REP, Replication, GEN, Genotypes. ***, significant at p < 0.001.
Table 5. Precipitation (mm), maximum, minimum, and average temperature (°C) in the 15 testing environments.
ENVSowing DateTreatmentMax TMin TMean TPrec (mm)
AT-172016/11/12RFD---592
AT-182017/11/21RFD---602
AN-172016/12/02RFD23.877.1415.05306
AN-182017/11/21RFD26.66112.69611
MCH-162015/12/16SIR25.241014204.8
MCH-172016/11/19RFD32.23.6315.96275.9
MCH-182017/11/29RFD26.542.6814.38514.6
MZIR-162015/12/21FIR24.6310.8617.7585.8
MZRF-162015/12/21SIR
TSIR-172016/12/14FIR25.7610.1917.98207
TSRF-172016/12/14RFD
TSIR-182017/12/22FIR26.1710.3118.24294
TSRF-182017/12/22RFD
WMD-172016/12/18FIR3718270
WMD-182017/12/07FIR37.318.627.90
Max T, Average maximum temperature (°C); Min T, Average minimum temperature (°C); Mean T, Average temperature (°C); Prec (mm), precipitation; RFD, Rainfed conditions; SIR, Supplemental irrigation; FIR, Full irrigation. AN, Annoceur; AT, Allal Tazi; MCH, Marchouch; MZIR, Melk Zher Irrigated; MZRF, Melk Zher Rainfed; TSIR, Tessaout Irrigated; TSRF, Tessaout Rainfed; WMD, Wad Medani; the numbers after the dash 16, 17 and 18 represent the cropping seasons 2015–2016, 2016–2017 and 2017–2018, respectively.
Table 6. Ranking of the best ten stable and the least ten stable genotypes of durum wheat genotypes using parametric stability indices.
Desirable
Rank12345678910
Pi129080129081142005MarzakMIKI3FarajIcarachaz142060142074142009
EV14197284859141984142007142057142001142056142015142055142039
GAIMarzak129080129081142005FarajLouizaIcarachaz142009142074142060
σi2141995141966142000141986142071142048142027142039142045142040
BLUPsMarzak129080IcarachazLouiza142074142009129081142005Faraj142061
Bi142012142044142073142068142072141970142042Marzak142053141996
S2di142001142000141995141966142071142039142003141986142040142069
CV142015142001141972142000Marzak141969142055142066142014141976
WAASY141986142045Louiza141966142009142027141995Marzak142040129080
ASV142045142063142032142040141986142046142027142012141989142053
SIPC142008142071142001142068142015141995141966142032141986142040
Undesirable
Rank68697071727374757677
Pi14206714200714207214200314206214203914205714198484859141972
EV142005141994142064142060129081Icarachaz141997129080142026142013
GAI14197214205714203914207214206214200384859141999141970141979
σi2142005142061141990142007142026129081142067141972Icarachaz142013
BLUPs14199914207214198414197914197214203914206214205784859142003
Bi14205614199714198414201314200714200112908014205784859141972
S2di142064142026142044142073141999Icarachaz141990142061129081142067
CV135226141999142003142013141990142062142064141979142072141970
WAASY14197014198414206214199914197914205784859142067142007141972
ASV129080142060142056142013142005141984142007129081141972142067
SIPC129081142026Marzak142064141991142007142013142067142061Icarachaz
Pi, Superiority index; EV, Environment variance; GAI, Geometric adaptability index; σi2, Shukla variance; BLUPs, Best linear unbiased predictions; Bi, Regression coefficients; S2di, Squared deviation from the regression; CV, coefficient of variation; WAASY, superiority index from the weighed average of absolute scores; ASV, AMMI stability value; SIPC, sums of the absolute values of the IPCA scores.
Table 7. Ranking of the best ten stable and the least ten stable durum wheat genotypes identified using four non-parametric stability indices.
Desirable
Rank12345678910
Si1141984142044142053cham5’S142056142067142071141976142055141969
Si2141966141995142000142071141986141996142048142069142053142018
Si3141995142009129080Marzak142039Faraj141996142053142060142005
Si6129080Marzak142053142009141995142060Faraj142005141996141966
Undesirable
Rank68697071727374757677
Si1142040IcarachazMarzak142008142045142063142068141972141990142032
Si2142007142066129081141984141990142026Icarachaz141972142067142013
Si3142063142006141984142064142057142067142062142072142007141972
Si614200314199084859142067142057142072142062142007141972141984
Si1, Mean of absolute rank difference over environment; Si2, Variance of the ranks; Si3, Sum of absolute deviations; Si6, Relative sum of squares of rank for genotype.
Publisher’s Note: MDPI stays neutral with regard to jurisdictional claims in published maps and institutional affiliations.

