
Effects of Organic Energy Crop Rotations and Fertilisation with the Liquid Digestate Phase on Organic Carbon in the Topsoil


Abstract
:1. Introduction
2. Materials and Methods
2.1. Experimental Site
2.2. Digestate and Fertilisation
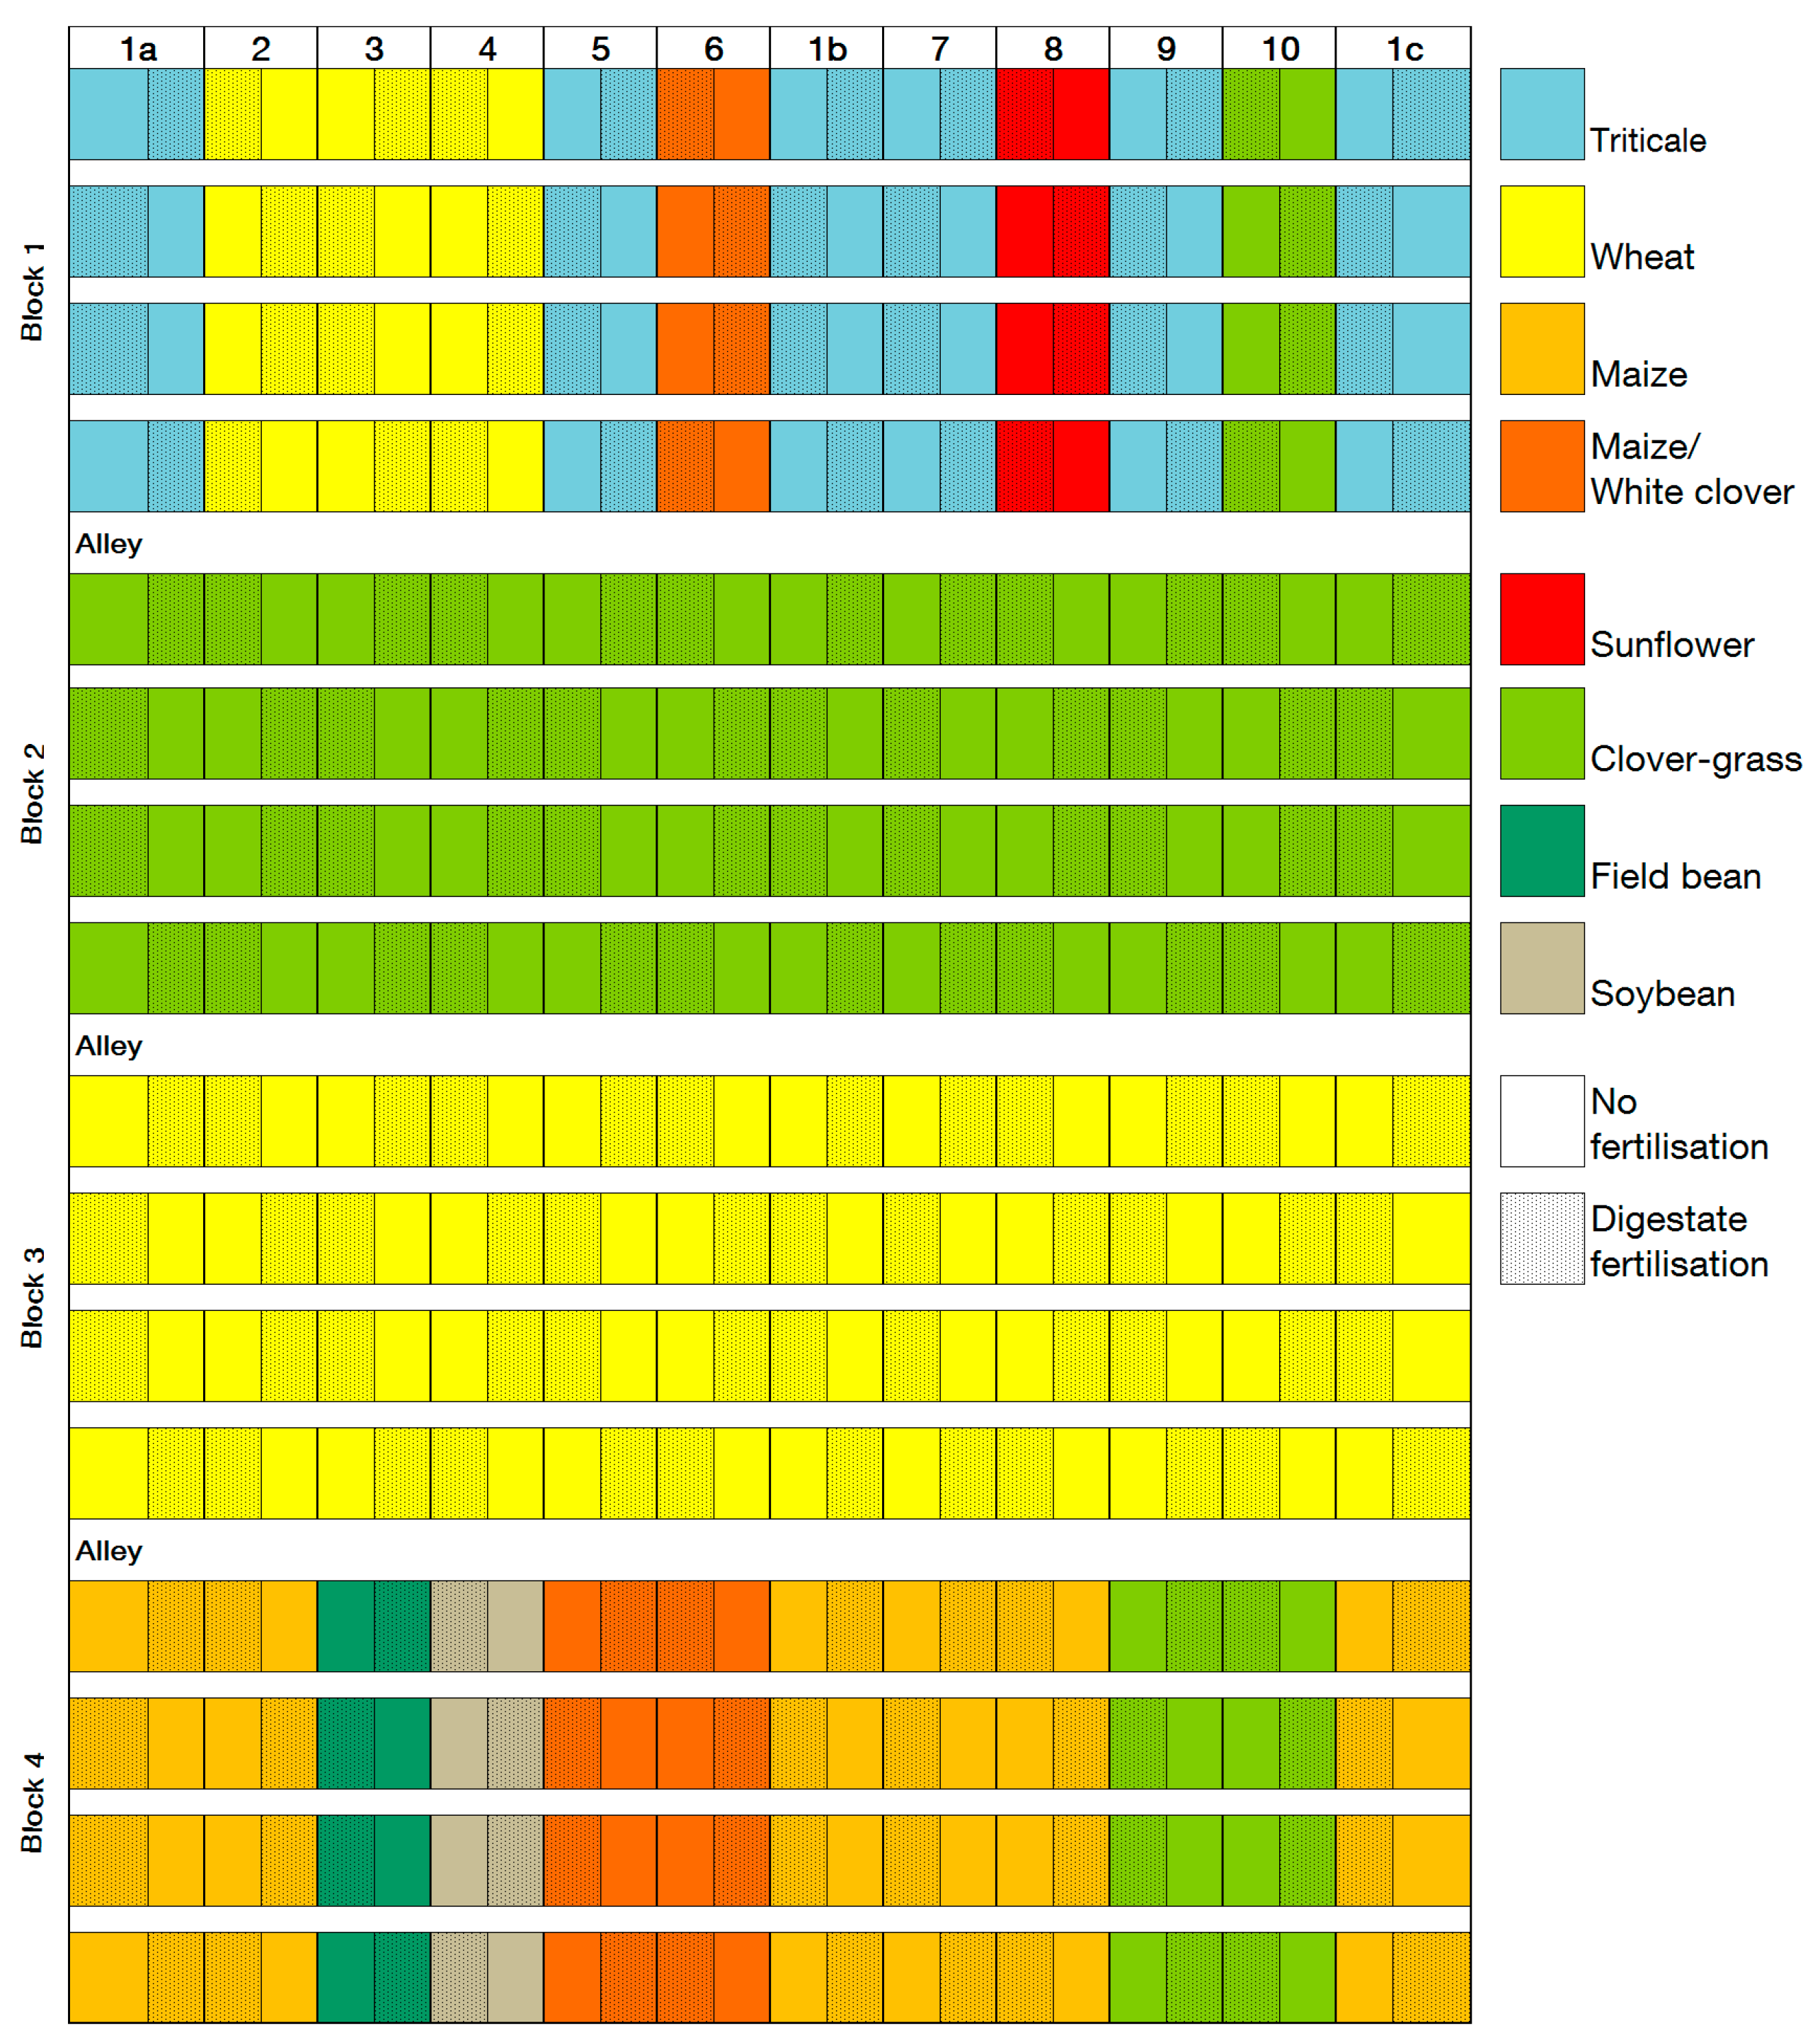
2.3. Experimental Design
2.4. Sampling
2.5. Modelling
2.6. Statistical Analysis
3. Results
4. Discussion
5. Conclusions
Author Contributions
Funding
Data Availability Statement
Acknowledgments
Conflicts of Interest
References
- Council Regulation (EC) No 834/2007 of 28 June 2007 on Organic Production and Labelling of Organic Products and Repealing Regulation (EEC) No 2092/91. Available online: https://eur-lex.europa.eu/eli/reg/2007/834/oj (accessed on 10 July 2021).
- Dahlin, S.; Kirchmann, H.; Kätterer, T.; Gunnarsson, S.; Bergström, L. Possibilities for improving nitrogen use from organic materials in agricultural cropping systems. AMBIO 2005, 34, 288–295. [Google Scholar] [CrossRef] [PubMed]
- Berry, P.M.; Stockdale, E.A.; Sylvester-Bradley, R.; Philipps, L.; Smith, K.A.; Lord, E.I.; Watson, C.A.; Fortune, S. N, P and K budgets for crop rotations on nine organic farms in the UK. Soil Use Manag. 2003, 19, 112–118. [Google Scholar] [CrossRef]
- Lal, R. Soil carbon sequestration impacts on global climate change and food security. Science 2004, 304, 1623–1627. [Google Scholar] [CrossRef] [PubMed] [Green Version]
- Aubert, P.-M.; Schwoob, M.-H.; Poux, X. Agroecology and Carbon Neutrality in Europe by 2050: What Are the Issues? Findings from the TYFA Modelling Exercise; Study 02/19; IDDRI: Paris, France, 2019. [Google Scholar]
- Sanders, J.; Klöble, U. Ökologischer Landbau in Deutschland. In Faustzahlen für den Ökologischen Landbau, new ed.; Kuratorium für Technik und Bauwesen in der Landwirtschaft: Darmstadt, Germany, 2015; pp. 23–39. ISBN 9783945088050. [Google Scholar]
- Serdjuk, M.; Bodmer, U.; Hülsbergen, K.-J. Integration of biogas production into organic arable farming systems: Crop yield response and economic effects. Org. Agr. 2018, 8, 301–314. [Google Scholar] [CrossRef]
- Möller, K.; Stinner, W. Effects of different manuring systems with and without biogas digestion on soil mineral nitrogen content and on gaseous nitrogen losses (ammonia, nitrous oxides). Eur. J. Agron. 2009, 30, 1–16. [Google Scholar] [CrossRef]
- Heuwinkel, H. Symbiontische N2-Fixierung im ökologischen Landbau: Ansätze zur Verbesserung der Schätzwerte. In Bewertung ökologischer Betriebssysteme: Bodenfruchtbarkeit, Stoffkreisläufe, Biodiversität; Kuratorium für Technik und Bauwesen in der Landwirtschaft, e.V., Ed.; KTBL: Darmstadt, Germany, 2007; pp. 70–83. ISBN 9783939371342. [Google Scholar]
- Möller, K.; Müller, T. Effects of anaerobic digestion on digestate nutrient availability and crop growth: A review. Eng. Life Sci. 2012, 12, 242–257. [Google Scholar] [CrossRef]
- Berry, P.M.; Sylvester-Bradley, R.; Philipps, L.; Hatch, D.J.; Cuttle, S.P.; Rayns, F.W.; Gosling, P. Is the productivity of organic farms restricted by the supply of available nitrogen? Soil Use Manag. 2002, 18, 248–255. [Google Scholar] [CrossRef]
- Kong, A.Y.Y.; Six, J.; Bryant, D.C.; Denison, R.F.; van Kessel, C. The relationship between carbon input, aggregation, and soil organic carbon stabilization in sustainable cropping systems. Soil Sci. Soc. Am. J. 2005, 69, 1078–1085. [Google Scholar] [CrossRef]
- Enríquez, S.; Duarte, C.M.; Sand-Jensen, K. Patterns in decomposition rates among photosynthetic organisms: The importance of detritus C:N:P content. Oecologia 1993, 94, 457–471. [Google Scholar] [CrossRef] [PubMed]
- Zhang, D.; Hui, D.; Luo, Y.; Zhou, G. Rates of litter decomposition in terrestrial ecosystems: Global patterns and controlling factors. J. Plant Ecol. 2008, 1, 85–93. [Google Scholar] [CrossRef] [Green Version]
- Hatton, P.-J.; Castanha, C.; Torn, M.S.; Bird, J.A. Litter type control on soil C and N stabilization dynamics in a temperate forest. Glob Chang Biol. 2015, 21, 1358–1367. [Google Scholar] [CrossRef] [PubMed]
- Risberg, K.; Cederlund, H.; Pell, M.; Arthurson, V.; Schnürer, A. Comparative characterization of digestate versus pig slurry and cow manure—Chemical composition and effects on soil microbial activity. Waste Manag. 2017, 61, 529–538. [Google Scholar] [CrossRef] [PubMed]
- Alburquerque, J.A.; de la Fuente, C.; Bernal, M.P. Chemical properties of anaerobic digestates affecting C and N dynamics in amended soils. Agr. Ecosyst. Environ. 2012, 160, 15–22. [Google Scholar] [CrossRef]
- Coban, H.; Miltner, A.; Elling, F.J.; Hinrichs, K.-U.; Kästner, M. The contribution of biogas residues to soil organic matter formation and CO2 emissions in an arable soil. Soil Biol. Biochem. 2015, 86, 108–115. [Google Scholar] [CrossRef]
- Ernst, G.; Müller, A.; Göhler, H.; Emmerling, C. C and N turnover of fermented residues from biogas plants in soil in the presence of three different earthworm species (Lumbricus terrestris, Aporrectodea longa, Aporrectodea caliginosa). Soil Biol. Biochem. 2008, 40, 1413–1420. [Google Scholar] [CrossRef]
- Manyi-Loh, C.E.; Mamphweli, S.N.; Meyer, E.L.; Okoh, A.I. Microbial anaerobic digestion: Process dynamics and implications from the renewable energy, environmental and agronomy perspectives. Int. J. Environ. Sci. Technol. 2019, 16, 3913–3934. [Google Scholar] [CrossRef]
- Ahlberg-Eliasson, K.; Liu, T.; Nadeau, E.; Schnürer, A. Forage types and origin of manure in codigestion affect methane yield and microbial community structure. Grass Forage Sci. 2018, 73, 740–757. [Google Scholar] [CrossRef]
- Wentzel, S.; Joergensen, R.G. Quantitative microbial indices in biogas and raw cattle slurries. Eng. Life Sci. 2016, 16, 231–237. [Google Scholar] [CrossRef]
- Thomsen, I.K.; Olesen, J.E.; Møller, H.B.; Sørensen, P.; Christensen, B.T. Carbon dynamics and retention in soil after anaerobic digestion of dairy cattle feed and faeces. Soil Biol. Biochem. 2013, 58, 82–87. [Google Scholar] [CrossRef]
- Tambone, F.; Scaglia, B.; D’Imporzano, G.; Schievano, A.; Orzi, V.; Salati, S.; Adani, F. Assessing amendment and fertilizing properties of digestates from anaerobic digestion through a comparative study with digested sludge and compost. Chemosphere 2010, 81, 577–583. [Google Scholar] [CrossRef]
- Insam, H.; Gómez-Brandón, M.; Ascher, J. Manure-based biogas fermentation residues–Friend or foe of soil fertility? Soil Biol. Biochem. 2015, 84, 1–14. [Google Scholar] [CrossRef]
- Möller, K. Effects of anaerobic digestion on soil carbon and nitrogen turnover, N emissions, and soil biological activity. A review. Agron. Sustain. Dev. 2015, 35, 1021–1041. [Google Scholar] [CrossRef]
- Stockdale, E.A.; Lampkin, N.H.; Hovi, M.; Keatinge, R.; Lennartsson, E.K.M.; Macdonald, D.W.; Padel, S.; Tattersall, F.H.; Wolfe, M.S.; Watson, C.A. Agronomic and environmental implications of organic farming systems. Adv. Agron. 2001, 70, 261–327. [Google Scholar]
- Jarvis, N.; Forkman, J.; Koestel, J.; Kätterer, T.; Larsbo, M.; Taylor, A. Long-term effects of grass-clover leys on the structure of a silt loam soil in a cold climate. Agr. Ecosyst. Environ. 2017, 247, 319–328. [Google Scholar] [CrossRef]
- Soussana, J.-F.; Loiseau, P.; Vuichard, N.; Ceschia, E.; Balesdent, J.; Chevallier, T.; Arrouays, D. Carbon cycling and sequestration opportunities in temperate grasslands. Soil Use Manag. 2004, 20, 219–230. [Google Scholar] [CrossRef]
- Loges, R.; Bunne, I.; Reinsch, T.; Malisch, C.; Kluß, C.; Herrmann, A.; Taube, F. Forage production in rotational systems generates similar yields compared to maize monocultures but improves soil carbon stocks. Eur. J. Agron. 2018, 97, 11–19. [Google Scholar] [CrossRef]
- Börjesson, P.; Prade, T.; Lantz, M.; Björnsson, L. Energy crop-based biogas as vehicle fuel—the impact of crop selection on energy efficiency and greenhouse gas performance. Energies 2015, 8, 6033–6058. [Google Scholar] [CrossRef] [Green Version]
- Brandão, M.; Milà i Canals, L.; Clift, R. Soil organic carbon changes in the cultivation of energy crops: Implications for GHG balances and soil quality for use in LCA. Biomass Bioenergy 2011, 35, 2323–2336. [Google Scholar] [CrossRef]
- Prays, N.; Dominik, P.; Sänger, A.; Franko, U. Biogas residue parameterization for soil organic matter modeling. PLoS ONE 2018, 13, e0204121. [Google Scholar] [CrossRef] [PubMed] [Green Version]
- Franko, U. Modellierung des Umsatzes der organischen Bodensubstanz. Arch. Agron. Soil Sci. 1997, 41, 527–547. [Google Scholar] [CrossRef]
- Johnston, A.E.; Poulton, P.R. The importance of long-term experiments in agriculture: Their management to ensure continued crop production and soil fertility; the Rothamsted experience. Eur. J. Soil Sci. 2018, 69, 113–125. [Google Scholar] [CrossRef] [PubMed] [Green Version]
- Soil Survey Staff. Illustrated Guide to Soil Taxonomy, Version 2.0; U.S. Department of Agriculture, Natural Resources Conservation Service, National Soil Survey Center: Lincoln, NE, USA, 2015.
- IUSS Working Group WRB. World Reference Base for Soil Resources 2014: International Soil Classification System for Naming Soils and Creating Legends for Soil Maps; FAO: Rome, Italy, 2014; ISBN 978-92-5-108369-7. [Google Scholar]
- Verband Deutscher Landwirtschaftlicher Untersuchungs- und Forschungsanstalten. Die Untersuchung von Böden, 4th ed.; VDLUFA-Verlag: Darmstadt, Germany, 2016; ISBN 978-3-941273-21-4. [Google Scholar]
- Reents, H.J.; Simon, A.; Levin, K.; Hülsbergen, K.-J. Wirkungen von Biogassystemen auf Bodenfruchtbarkeit, Ertrag und Produktqualität unter den Bedingungen des ökologischen Landbaus: BOFRUBIOGAS; Project Report; Technische Universität München: Freising, Germany, 2018. [Google Scholar]
- Küstermann, B.; Kainz, M.; Hülsbergen, K.-J. Modeling carbon cycles and estimation of greenhouse gas emissions from organic and conventional farming systems. Renew. Agr. Food Syst. 2008, 23, 38–52. [Google Scholar] [CrossRef] [Green Version]
- R Core Team. R: A Language and Environment for Statistical Computing; R Foundation for Statistical Computing: Vienna, Austria, 2018. [Google Scholar]
- Simon, A.I.L. Langzeitwirkungen von Gärresten in Energiepflanzenfruchtfolgen auf Bodeneigenschaften und Bodenprozesse unter den Bedingungen des ökologischen Landbaus, 1st ed.; Verlag Dr. Köster: Berlin, Germany, 2021; ISBN 9783968310138. [Google Scholar]
- Meurer, K.H.E.; Bolinder, M.A.; Andrén, O.; Hansson, A.-C.; Pettersson, R.; Kätterer, T. Shoot and root production in mixed grass ley under daily fertilization and irrigation: Validating the N productivity concept under field conditions. Nutr. Cycl. Agroecosys. 2019, 115, 85–99. [Google Scholar] [CrossRef] [Green Version]
- Cong, W.-F.; Christensen, B.T.; Eriksen, J. Soil nutrient levels define herbage yield but not root biomass in a multispecies grass-legume ley. Agr. Ecosyst. Environ. 2019, 276, 47–54. [Google Scholar] [CrossRef]
- Garg, R.N.; Pathak, H.; Das, D.K.; Tomar, R.K. Use of flyash and biogas slurry for improving wheat yield and physical properties of soil. Environ. Monit. Assess. 2005, 107, 1–9. [Google Scholar] [CrossRef] [PubMed]
- Gunnarsson, A.; Bengtsson, F.; Caspersen, S. Use efficiency of nitrogen from biodigested plant material by ryegrass. J. Plant Nutr. Soil Sci. 2010, 173, 113–119. [Google Scholar] [CrossRef]
- Wentzel, S.; Joergensen, R.G. Effects of biogas and raw slurries on grass growth and soil microbial indices. J. Plant Nutr. Soil Sci. 2016, 179, 215–222. [Google Scholar] [CrossRef]
- Andruschkewitsch, M.; Wachendorf, C.; Wachendorf, M. Effects of digestates from different biogas production systems on above and belowground grass growth and the nitrogen status of the plant-soil-system. Grassl. Sci. 2013, 59, 183–195. [Google Scholar] [CrossRef]
- Hupfauf, S.; Bachmann, S.; Fernández-Delgado Juárez, M.; Insam, H.; Eichler-Löbermann, B. Biogas digestates affect crop P uptake and soil microbial community composition. Sci. Total Environ. 2016, 542, 1144–1154. [Google Scholar] [CrossRef]
- Cavalli, D.; Cabassi, G.; Borrelli, L.; Geromel, G.; Bechini, L.; Degano, L.; Marino Gallina, P. Nitrogen fertilizer replacement value of undigested liquid cattle manure and digestates. Eur. J. Agron. 2016, 73, 34–41. [Google Scholar] [CrossRef]
- Balesdent, J.; Chenu, C.; Balabane, M. Relationship of soil organic matter dynamics to physical protection and tillage. Soil Till. Res. 2000, 53, 215–230. [Google Scholar] [CrossRef]
- Freibauer, A.; Rounsevell, M.D.A.; Smith, P.; Verhagen, J. Carbon sequestration in the agricultural soils of Europe. Geoderma 2004, 122, 1–23. [Google Scholar] [CrossRef]
- Jensen, L.S.; Mueller, T.; Bruun, S.; Hansen, S. Application of the DAISY model for short- and long-term simulation of soil carbon and nitrogen dynamics. In Modeling Carbon and Nitrogen Dynamics for Soil Management; Shaffer, M.J., Ma, L., Hansen, S., Eds.; Lewis Publishers: Boca Raton, FL, USA, 2001; pp. 483–509. ISBN 1566705290. [Google Scholar]
- Paustian, K.; Parton, W.J.; Persson, J. Modeling soil organic matter in organic-amended and nitrogen-fertilized long-term plots. Soil Sci. Soc. Am. J. 1992, 56, 476–488. [Google Scholar] [CrossRef]
- Morais, T.G.; Teixeira, R.F.M.; Domingos, T. Detailed global modelling of soil organic carbon in cropland, grassland and forest soils. PLoS ONE 2019, 14, e0222604. [Google Scholar] [CrossRef] [PubMed] [Green Version]
- Hu, T.; Sørensen, P.; Wahlström, E.M.; Chirinda, N.; Sharif, B.; Li, X.; Olesen, J.E. Root biomass in cereals, catch crops and weeds can be reliably estimated without considering aboveground biomass. Agr. Ecosyst. Environ. 2018, 251, 141–148. [Google Scholar] [CrossRef]
- Acharya, B.S.; Rasmussen, J.; Eriksen, J. Grassland carbon sequestration and emissions following cultivation in a mixed crop rotation. Agr. Ecosyst. Environ. 2012, 153, 33–39. [Google Scholar] [CrossRef] [Green Version]
- Melzer, M. Influence of Zea mays in Rotations on Isotopic Composition of Soil Organic Matter. Master’s Thesis, Technische Universität München, Freising, Germany, 2019. [Google Scholar]


| Variable | Content (%, Dry Weight Basis) |
|---|---|
| Loss on ignition | 71.4 (1.9) |
| Total carbon | 39.2 (0.9) |
| Total nitrogen | 6.1 (0.9) |
| Ammonium nitrogen | 3.4 (0.7) |
| Phosphate (as P2O5) | 2.2 (0.2) |
| Potassium (as K2O) | 8.9 (0.9) |
| Sulphur | 0.47 (0.04) |
| Crop Rotation | Year 1 | Year 2 | Year 3 Cover Crop | Year 3 | Year 4 |
|---|---|---|---|---|---|
| CR1a | Lucerne- clover-grass | Wheat (40) | Rye (16) | Maize (55) | Triticale (38) |
| CR2 | Lucerne- clover-grass | Wheat (30) | Rye (16) | Maize (53) | Wheat (31) |
| CR3 | Lucerne- clover-grass | Wheat (28) | Legume/ non-legume mixture | Field bean | Wheat (29) |
| CR4 | Lucerne- clover-grass | Wheat (31) | Legume/ non-legume mixture | Soybean | Wheat (29) |
| CR5 | Lucerne- clover-grass | Wheat (45) | White clover (3) | Maize and white clover (45) | Triticale (40) |
| CR6 | Clover-grass | Wheat (43) | White clover (3) | Maize and white clover (42) | Maize and white clover (44) |
| CR1b | Lucerne- clover-grass | Wheat (40) | Rye (16) | Maize (55) | Triticale (38) |
| CR7 | Lucerne- clover-grass | Wheat (38) | Legume/ non-legume mixture (8) | Maize (38) | Triticale (40) |
| CR8 | Lucerne- clover-grass | Wheat (45) | Legume/ non-legume mixture (8) | Maize (36) | Sunflower and undersown lucerne- clover-grass (34) |
| CR9 | Lucerne- clover-grass (40) | Wheat (69) | Lucerne- clover-grass | Lucerne- clover-grass | Triticale (45) |
| CR10 | Lucerne- clover-grass (50) | Wheat (77) | Lucerne- clover-grass | Lucerne- clover-grass | Lucerne- clover-grass (20) |
| CR1c | Lucerne- clover-grass | Wheat (40) | Rye (16) | Maize (55) | Triticale (38) |
| Crop | Mean Yield | |||
|---|---|---|---|---|
| Biomass (DM, t ha−1 a−1) | Grain (86% DM, t ha−1 a−1) | |||
| Unfertilised | Fertilised | Unfertilised | Fertilised | |
| Clover-grass | 12.6 | 14.3 | ||
| Field bean | 2.4 | 2.8 | ||
| Maize (silage) | 6.8 | 11.6 | ||
| Rye (wholecrop) | 3.9 | 6.0 | ||
| Soybean | 3.2 | 3.3 | ||
| Sunflower (wholecrop) | 5.2 | 8.2 | ||
| Triticale (wholecrop) | 6.7 | 13.0 | ||
| Wheat | 4.2 | 6.9 | ||
| Crop | KRHR (dt ha−1) | FRHR (dt dt−1) | S (dt dt−1) |
|---|---|---|---|
| Clover-grass | 26.0 | 0.45 | |
| Cover crops | 5.0 | 0.60 | |
| Field bean | 10.0 | 0.55 | |
| Lucerne-clover-grass | 24.0 | 0.014 | 0.45 |
| Maize | 10.4 | 0.005 | 0.45 |
| Rye | 4.5 | 0.004 | 0.45 |
| Sorghum 1 | 10.4 | 0.005 | 0.45 |
| Soybean | 10.0 | 0.55 | |
| Sunflower | 9.2 | 0.014 | 0.50 |
| Triticale | 4.5 | 0.004 | 0.45 |
| Wheat | 4.0 | 0.08 | 0.55 |
| Digestate | 0.60 | ||
| Green manure | 0.35 | ||
| Straw | 0.45 |
| Soil Organic Carbon (%) | ||
|---|---|---|
| 2010 | 2017 | |
| Unfertilised plots | 1.08 a | 1.24 c |
| Fertilised plots | 1.12 b | 1.38 d |
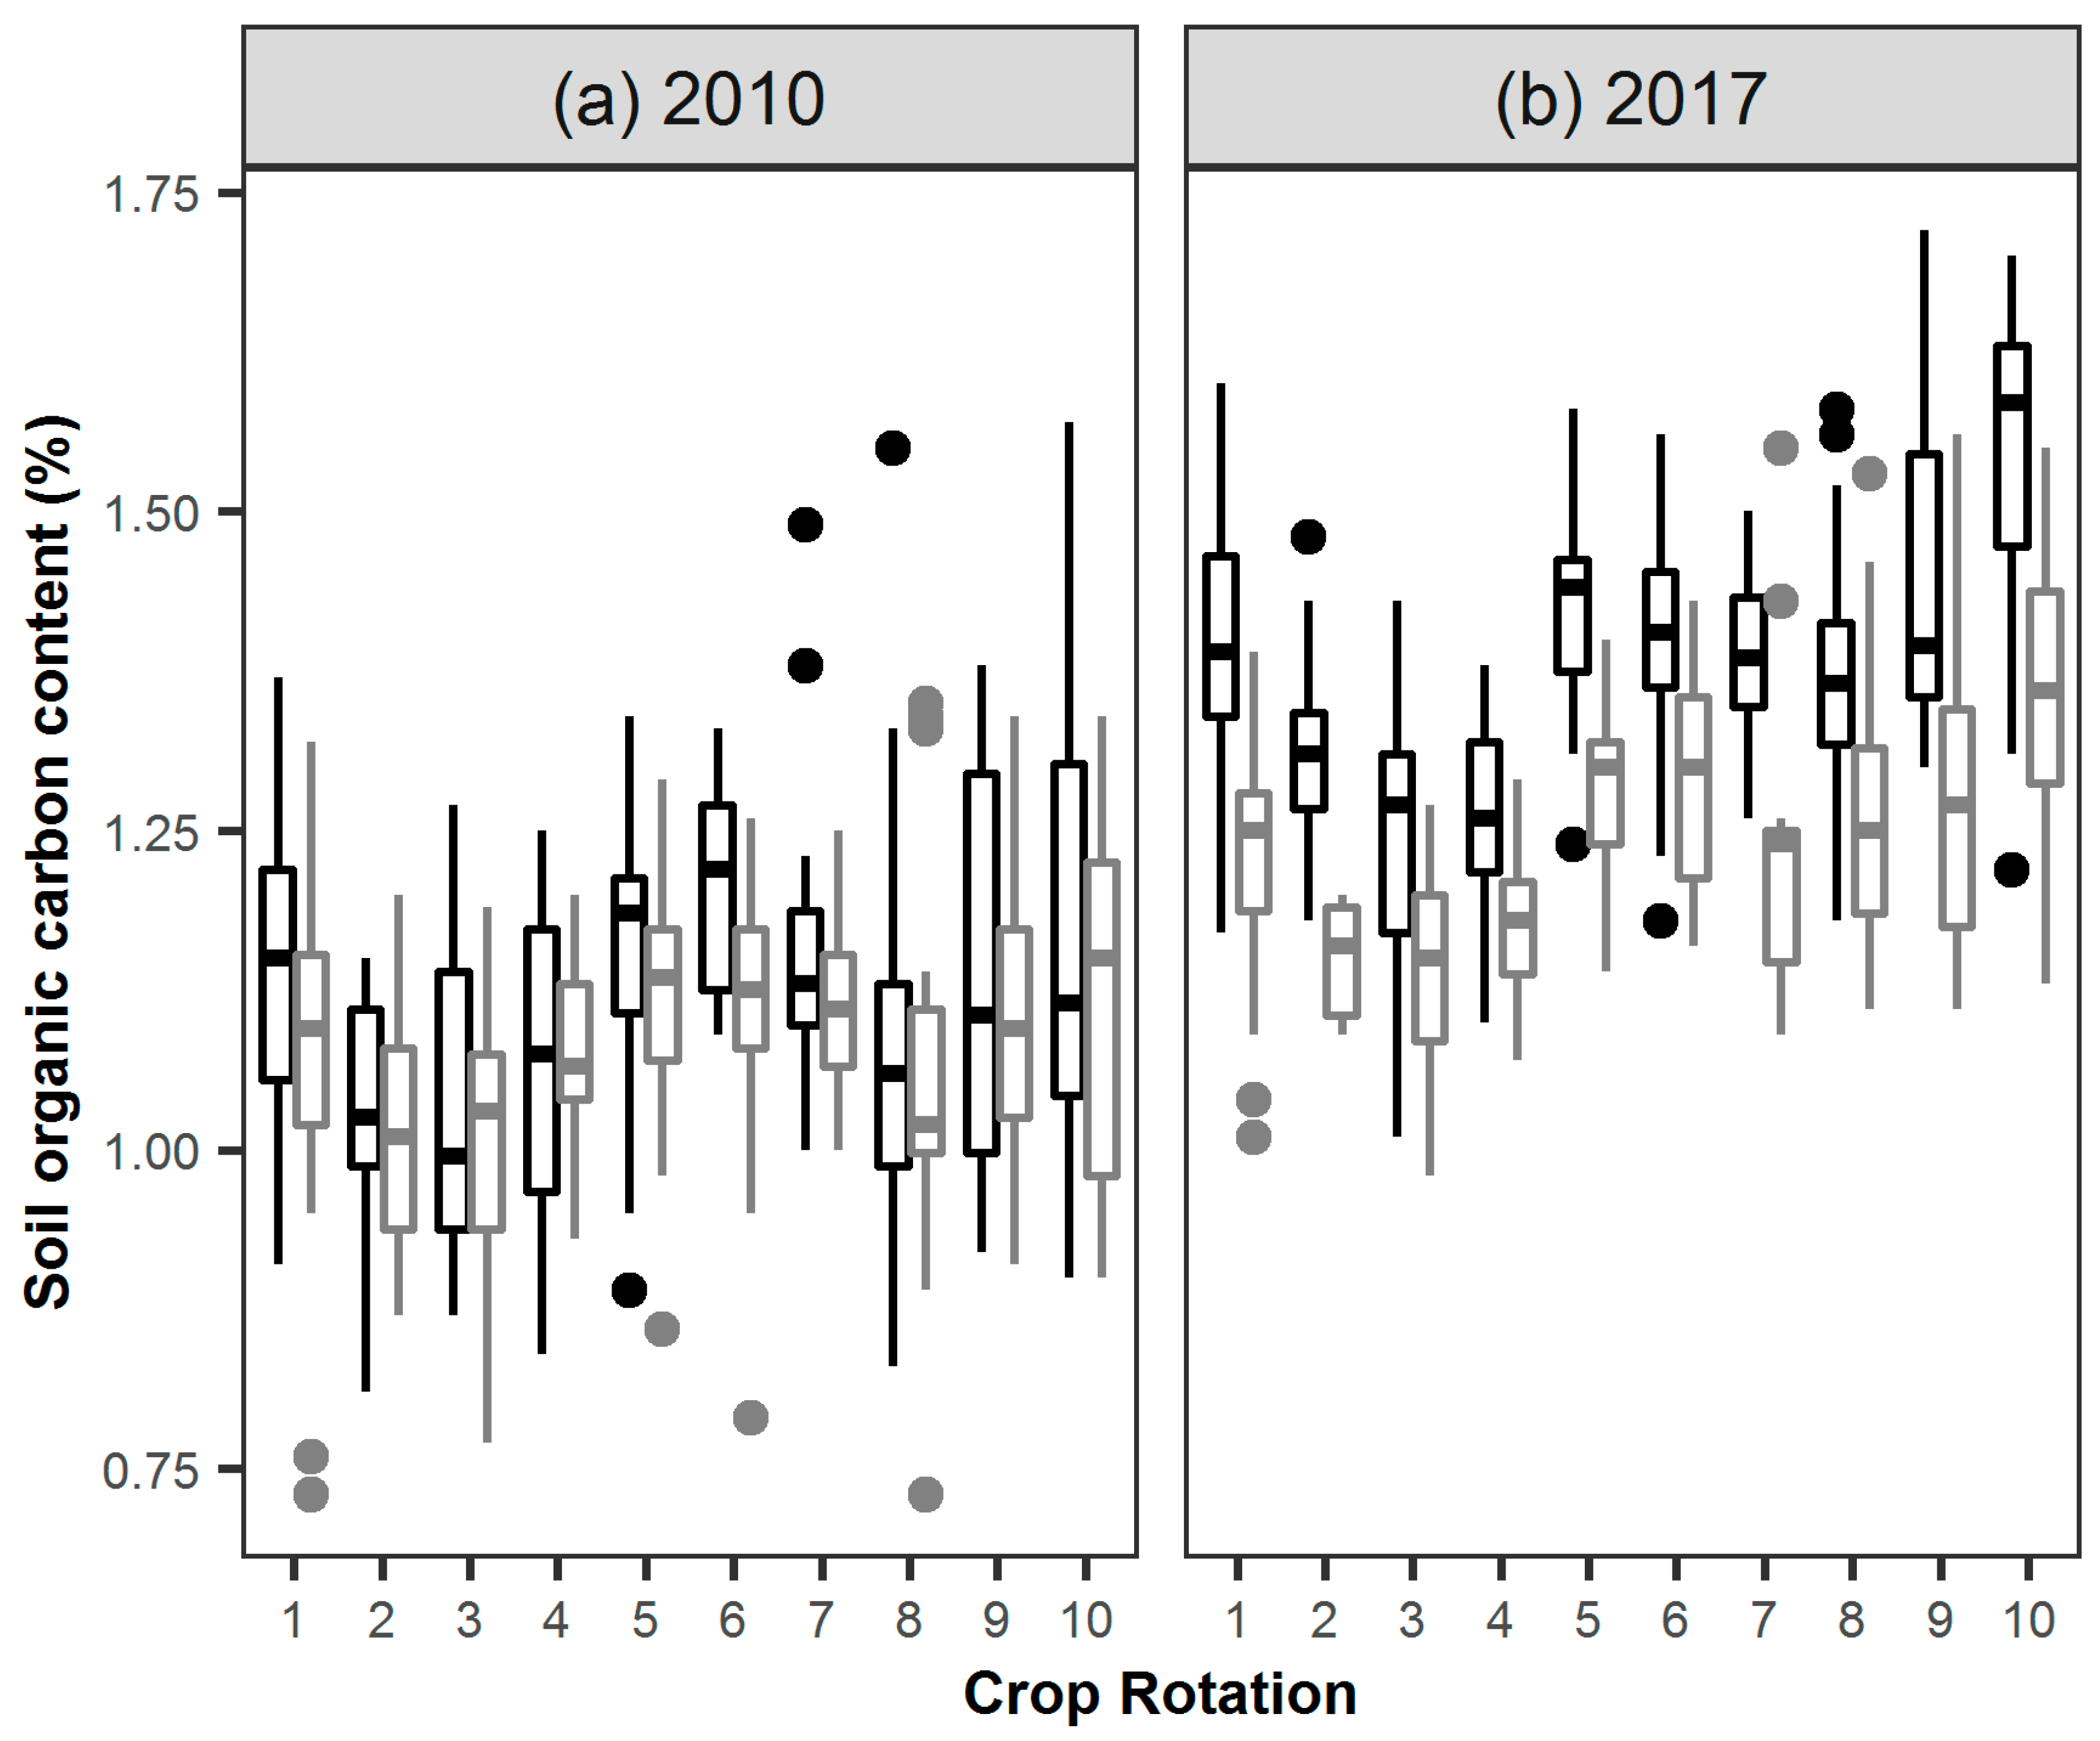
| Crop Rotation | 2010 | 2017 |
|---|---|---|
| Soil Organic Carbon (%) | Soil Organic Carbon (%) | |
| CR1 | 1.11 abcd | 1.32 fg |
| CR2 | 1.02 ab | 1.23 defg |
| CR3 | 1.00 a | 1.21 cdef |
| CR4 | 1.04 abc | 1.25 defg |
| CR5 | 1.14 abcde | 1.35 fg |
| CR6 | 1.15 abcde | 1.35 fg |
| CR7 | 1.12 abcd | 1.33 fg |
| CR8 | 1.09 abcd | 1.30 efg |
| CR9 | 1.14 abcde | 1.34 fg |
| CR10 | 1.19 bcdef | 1.39 g |
Publisher’s Note: MDPI stays neutral with regard to jurisdictional claims in published maps and institutional affiliations. |
© 2021 by the authors. Licensee MDPI, Basel, Switzerland. This article is an open access article distributed under the terms and conditions of the Creative Commons Attribution (CC BY) license (https://creativecommons.org/licenses/by/4.0/).
Share and Cite
Levin, K.S.; Auerswald, K.; Reents, H.J.; Hülsbergen, K.-J. Effects of Organic Energy Crop Rotations and Fertilisation with the Liquid Digestate Phase on Organic Carbon in the Topsoil. Agronomy 2021, 11, 1393. https://doi.org/10.3390/agronomy11071393
Levin KS, Auerswald K, Reents HJ, Hülsbergen K-J. Effects of Organic Energy Crop Rotations and Fertilisation with the Liquid Digestate Phase on Organic Carbon in the Topsoil. Agronomy. 2021; 11(7):1393. https://doi.org/10.3390/agronomy11071393
Chicago/Turabian StyleLevin, Karin S., Karl Auerswald, Hans Jürgen Reents, and Kurt-Jürgen Hülsbergen. 2021. "Effects of Organic Energy Crop Rotations and Fertilisation with the Liquid Digestate Phase on Organic Carbon in the Topsoil" Agronomy 11, no. 7: 1393. https://doi.org/10.3390/agronomy11071393
APA StyleLevin, K. S., Auerswald, K., Reents, H. J., & Hülsbergen, K.-J. (2021). Effects of Organic Energy Crop Rotations and Fertilisation with the Liquid Digestate Phase on Organic Carbon in the Topsoil. Agronomy, 11(7), 1393. https://doi.org/10.3390/agronomy11071393