Article

Genotypic and Environmental Effect on the Concentration of Phytochemical Contents of Lentil (Lens culinaris L.)

by
Maria Irakli
1,
Anastasia Kargiotidou
2,
Evangelia Tigka
2,
Dimitrios Beslemes
3,
Maria Fournomiti
4,
Chrysanthi Pankou
4,
Kostoula Stavroula
5,
Nektaria Tsivelika
5 and
Dimitrios N. Vlachostergios
2,*
1
Institute of Plant Breeding and Genetic Resources, Hellenic Agricultural Organization—DEMETER, Thermi, 57001 Thessaloniki, Greece
2
Institute of Industrial and Forage Crops, Hellenic Agricultural Organization—DEMETER, Theophrastou Street 1, 41335 Larissa, Greece
3
ALFA SEEDS SA, 10th Kil. Mesorhaxis—Agriculture Georgiou, 41500 Larissa, Greece
4
Department of Agricultural Development, Democritus University of Thrace, 68200 Orestiada, Greece
5
Laboratory of Genetics & Plant Breeding, Faculty of Agriculture, Aristotle University of Thessaloniki, 54124 Thessaloniki, Greece
*
Author to whom correspondence should be addressed.
Agronomy 2021, 11(6), 1154; https://doi.org/10.3390/agronomy11061154
Submission received: 29 April 2021 / Revised: 1 June 2021 / Accepted: 2 June 2021 / Published: 4 June 2021

Abstract

:
The health-promoting effects of lentil seeds due to phenolic compounds and other antioxidants make lentils a potential source of functional food or feed ingredients. The objective of this study was to evaluate the effects of genotype and growing environment on the phytochemical contents and antioxidant activities such as ABTS (2′-azino-bis-3-ethylbenzothiazoline-6-sulfonic acid), DPPH (2,2-diphenyl-1-picrylhydrazyl) and FRAP (ferric reducing antioxidant power) assays of soluble extracts from five lentil cultivars grown in ten diverse locations over a 2-year experimental period. Total phenolic content (TPC), total flavonoid content (TFC), total proanthocyanidin content (TPAC), total hydrolyzed tannin content (TNC), tocopherols and carotenoids were investigated. The major proanthocyanidins and individual polyphenols were quantified by high-performance liquid chromatography. Our results indicated that flavanols were the main phenolic compounds in hydrophilic extracts, followed by phenolic acids. Concerning lipophilic extracts, tocopherols and carotenoids were the main components, with γ-tocopherol and lutein being the predominant isomers, respectively. In general, both genetic and environmental effects had a strong impact on all bioactive components tested. Greater variation due to environmental effects was found for phenolic compounds (TPC, TFC and TPAC) and antioxidant activities; however, tocopherols and carotenoids revealed a high genotypic dependence. The principal component analysis highlighted the genotypes with higher content of antioxidants and stability across environments. The red lentil population “03-24L” was characterized as a promising genetic material due to its high phenolic contents and antioxidant capacity values across environments and is suggested for further investigation. In conclusion, multi-environmental trials are essential for a better understanding of the genotypic and environmental effect on phytochemical profiles of lentils and provide important information for breeding or cultivating lentil varieties of high-bioactive value.

1. Introduction

Lentil (Lens culinaris L.) is an ancient crop that originated in the Near East [1] but is now consumed worldwide. It is one of the most important crops in many countries, as it has an excellent nutritional value as human food [2] or animal feed [3]; rich in proteins, carbohydrates (dietary fiber), minerals and vitamins. Furthermore, lentil seeds have been gaining increasing attention for health benefits in the human diet or as functional feed ingredients, as they contain a wide range of bioactive phytochemicals including phenolics, tocopherols and carotenoids, that possess high antioxidant capacities and other bioactivities [4,5,6].
Previous reports have shown that the major sub-classes of phenolic compounds found in lentil seeds are phenolic acids, stilbenes, and flavonoids (flavan-3-ols, flavanones, flavones, flavonols, anthocyanidins, isoflavones) and tannins, including condensed tannins or proanthocyanidins [6,7,8,9,10,11,12]. Phenolics in lentils occur in free form, however, the insoluble or bound forms are present at considerable levels, accounting for approximately 30% of the total extractable phenolic contents [11]. These phenolic compounds are found primarily in the seed hull and are responsible for the seed-coat color [11,13]. It has been reported that lentils featuring green and gray seed coats contained higher amounts of flavan-3-ols, proanthocyanidins, and flavonols and might be more promising as health-promoting foods [14]. Epidemiological studies have shown the association between legume consumption and positive effects on chronic diseases such as obesity, cardiovascular diseases, type 2 diabetes, cancers neural disorders such as Alzheimer’s and Parkinson’s disease [15]. Specifically, the consumption of lentils was associated with a lower incidence of breast cancer [16], reduced blood pressure and body weight [17]. In addition, lentils also contain some lipophilic nutrients, including essential fatty acids, carotenoids and tocopherols that have been found to contribute considerably to the antioxidant activity of lentil seeds [4,11,18]. Tocopherols behave as potent antioxidants, since they are associated with mortality from cardiovascular disease and play a putative role in the prevention of Alzheimer’s disease and cancer [19,20]. Lutein and zeaxanthin being dominant carotenoids in lentils, could promote eye and skin health [4,21].
Lentil is grown in Mediterranean, subtropical, temperate and nontropical dry environments globally. As lentils are cultivated in Greece from North to South, significant differences regarding daily mean temperature, soil profile and field practices are recorded. Cultivar, location, and growing conditions play important role in the production of bioactive compounds in legumes. Variation in both agronomic and grain quality attributes in lentils might be owing either to genetic or environmental factors [22,23,24,25,26,27,28]. Data on the investigation of the phenolic compounds and antioxidants in lentils have been reported [5,6,7,8,9,29], however, most of them have been focused on genetic diversity [5,29]. No information has been found about the effect of climatic growing conditions in different locations on the health-promoting compounds of lentil cultivars. Differences in phytochemical characteristics as a function of genotype and growing location may serve as a powerful economic strategy to food marketing, helps consumers in selecting non-adulterated and high-quality food. In addition, lentil seeds draw significant interest in the animal feed sector for the production of natural antioxidants of high quality, as alternatives to synthetics [30].
Therefore, the objective of the present work was to investigate in detail the phytochemical screening and differentiation of the five lentil genotypes grown in ten diverse locations in Greece for two consecutive years. The study is based on the colorimetric measurements of total phenolics, total flavonoids, total tannins, total proanthocyanidins, and high-performance liquid chromatography analysis of lentil seeds for the determination of polyphenolics, tocopherols and carotenoids contents as well as their antioxidant activity. The understanding of the genotypic, environmental and their interaction effects on lentil health properties could be exploited by breeding projects aiming to develop lentil varieties rich in bioactive components to meet market needs for high-quality food or feed products.

2. Materials and Methods

2.1. Chemicals

Folin-ciocalteau reagent, 2,5,7,8-tetramethylchroman-2-carboxylic acid (Trolox), 2,2′-azino-bis (3-ethylbenzothiazoline-6-sulfonic acid diammonium salt (ABTS), 2, 2-diphenyl-1-picrylhydrazyl (DPPH), poly(vinylpolypyrrolidone) (PVPP) and the standards of phenolics were obtained from Sigma–Aldrich (St. Louis, MO, USA); tocopherols isomers were purchased from Supelco (Belefonte, Pennsylvania, PA, USA), whereas carotenoid standards were supplied by Extrasynthese (Genay, France). All others chemicals were of analytical or HPLC grade.

2.2. Plant Materials

Seeds of five lentil genotypes (Lens culinaris L.) produced in ten locations in Greece in the 2018/2019 and 2019/2020 growing seasons were analyzed. The genetic material studied consisted of four commercial cultivars named “Samos”, “Dimitra”, “Elpida” and “Thessalia”, and one red lentil population named “03-24L”. The test locations were situated in two municipalities from the region of Central Macedonia (CM), two from Thrace (THR), two from Western Macedonia (WM), two from Thessaly (THE) and two from Central Greece (CG). CM-locations were Thessaloniki (THE), and Patriki (PAT), THR-locations were Komotini (KOM) and Orestiada (ORE), WM-locations were Petrana (PET) and Anatoliko (ANA), THE-locations were Larissa (LAR) and Agioi Anargiri (ANI) and CG-locations were Domokos (DOM) and Ipato (IPA).
At each location, the genotypes were arranged in randomized complete block design with four replications. Sowing was performed in the last week of November except at location “Anatoliko” that was performed in the last week of February. The experiments were established for both growing seasons on the same position of the field or in a nearby position of the same field (Domokos, Anatoliko, Thessaloniki). Descriptions of Greek locations are given in Table 1. After harvest, the seeds from each genotype per plot at a given location were bulked and a total of 100 g lentils seed samples were collected and analyzed for phytochemical compounds and antioxidant capacities. Approximately 30–40 g of dry lentil seeds (13% moisture) was cleaned and ground into a fine powder using a Retsch ZM 1000 (Heistenbach, Germany) laboratory mill equipped with a 0.50 mm sieve and were stored at 4 °C until analysis.

2.3. Sample Preparation

2.3.1. Extraction of Free Phenolics

Phenolic compounds from the ground material were extracted from the powdered samples according to the method described previously [31], with some modifications. Briefly, 0.2 g dried powder was extracted in 3 mL of 70% aqueous acetone, vortexed for 30 s and then sonicated for 15 min at room temperature. After centrifugation at 2200 rpm for 10 min, the supernatant was collected and the extraction was repeated twice. The obtained phenolic extracts were divided into two portions. One was used for the colorimetric methods and the other was evaporated to dryness under a gentle flow of nitrogen at 40 °C, re-suspended in 400 μL of methanol/water (50:50, v/v), filtered through a 0.22 μm nylon membrane and aliquots of 20 μL were injected into the HPLC system for phenolic compounds identification.

2.3.2. Extraction of Lipophilic Antioxidants

The lipophilic fraction of lentil powdered seeds was extracted according to a modified method described previously [32], as follows: 0.2 g of lentil seed flour was sonicated with 4 mL ethanol and the extract was collected after centrifugation at 1500× g for 10 min. The residue was re-extracted twice using the same solvent and followed the same procedure. The combined supernatant was then evaporated under a nitrogen stream at 40 °C, re-suspended in 200 μL of acetonitrile/methanol (85:15, v/v), filtered through a 0.22 μm nylon membrane and aliquots of 20 μL were injected into HPLC system for tocopherols and carotenoids analysis.

2.4. Determination of Total Phenolic Content

Total phenolic content (TPC) was determined by the Folin–Ciocalteu method [33] as described above: 200 μL phenolic extract was reacted with 800 μL of Folin-Ciocalteu reagent, followed by the addition of 2 mL of 7.5% Na2CO3 and 7 mL distilled water. The absorption reading was recorded after incubation for 60 min in the dark at 765 nm. TPC was expressed as mg of gallic acid equivalents per g of dry weight (mg GAE/g).

2.5. Determination of Hydrolyzed Tannin Content

The hydrolyzed tannin content (TNC) was determined as the PVPP-bound phenolics, according to Makkar et al. [34]. 400 μL of phenolic extracts were mixed with 400 mg PVPP. After 20 min centrifugation at 10,000 rpm at 4 °C, aliquots of the supernatant (0.2 mL) were transferred into test tubes to determine the non-phenolics, as above, by the Folin–Ciocalteu method. Total tannins were calculated by subtracting non-tannin phenolics from total phenolics and TNC was expressed as mg of gallic acid equivalents per g of dry weight (mg GAE/g).

2.6. Determination of Total Flavonoid Content

Total flavonoid content (TFC) was quantified using the colorimetric assay with aluminum chloride [35]. Briefly, 300 μL phenolic extract was mixed with 225 μL 5% NaNO2, followed by the addition of 225 μL 10% AlCl3·6H2O and 750 μL 2N NaOH. The absorption was recorded after incubation for 20 min in the dark at 765 nm. TFC was expressed as mg of catechin equivalents per g of dry weight (mg CATE/g).

2.7. Determination of Total Proanthocyanidin Content

Total proanthocyanidins content (TPAC) was measured according to the butanol-acid assay [36], as follows: 500 μL diluted phenolic extract (1:5, v/v) were mixed with 3 mL of the reagent n-butanol/HCl (95:5, v/v), followed by 100 μL 2% ferric ammonium sulfate in 2N HCl. The absorbance of boiled mixtures for 60 min was recorded at 550 nm after cooling. The absorbance of the unheated tubes was considered as a control. TPAC was expressed as mg of procyanidin B2 equivalents per g dry weight (mg PCBE/g).

2.8. Determination of Antioxidant Capacity

2.8.1. ABTS Radical Scavenging Assay

Radical scavenging activity of lentils phenolic extracts against ABTS radical cations was determined according to Re et al. [37]. Briefly, 100 μL phenolic extract was mixed with 3.9 mL of the ABTS+ solution and the absorbance recorded at 734 nm after 4 min against a control. The ABTS results were expressed as mg Trolox equivalents (TE) per g dry weight (mg TE/g).

2.8.2. DPPH (2,2-Diphenyl-1-Picrylhydrazyl) Assay

The antiradical activity of phenolic extracts was measured according to a previous report [38] with slight modifications. Briefly, an aliquot of 2.85 mL of 0.1 mM DPPH in methanol was mixed with 100 μL of phenolic extracts and the decrease in absorbance was measured at 516 nm after 5 min of reaction. The ABTS values were expressed as mg TE/g.

2.8.3. Ferric Reducing Antioxidant Power (FRAP) Assay

FRAP activity of lentils phenolic extracts was evaluated based on the method of Benzie and Strain [39]; 100 μL of phenolic extract was mixed for exactly 4 min with 3 mL of FRAP solution at 37 °C. The absorbance at 593 nm of the colored product was measured against a control, and the FRAP values were expressed as mg TE/g.

2.9. Analysis of Phenolics by HPLC

An Agilent 1200 series HPLC system (Urdorf, Switzerland) equipped with a degasser, a quaternary pump, a diode-array detector (DAD) and a Nucleosil 100 C18 column (250 mm × 4.6 mm, i.d. 5 μm) was used to analyze the free phenolics as described previously [40], with slight modification. Mobile phase consists of three solvents: (A) 1% acetic acid in water, (B) acetonitrile and (C) methanol and the following gradient program was performed: at 0 min, the A:B:C proportion was 90:0:0; at 10 min, 80:4:16; at 25 min, 75:5:20; at 30 min, 65:5:30; at 31 min, 40:0:60; at 37 min, 35:20:45 and at 50 min, 20:80:0. The system was allowed to run for another 5 min at 100% B in order to clean the column before re-equilibrating it at the initial phase. The flow rate was set at 1.3 mL/min and the column temperature was controlled at 30 °C. The DAD recorded the spectra at 260 nm (protocatechuic acid, vanillic acid), 280 nm (gallic acid, catechin, gallocatechin, catechin gallate, procyanidin B2), 320 nm (p-coumaric acid) and the chromatograms were analysed using the Agilent Chemstation software (version B.04.01, Agilent Technologies).
Each phenolic compound in the lentil seed extract was identified by comparison of their retention times to those of external standards with the exception of procyanidin dimer I, due to the lack of available commercial standards. The quantification was based on calibration curves generated by the external standard method. Procyanidin dimer I was expressed in catechin equivalents.

2.10. Analysis of Tocopherols and Carotenoids

An Agilent 1200 series HPLC system (Urdorf, Switzerland) equipped with a degasser, a quaternary pump, a DAD and a fluorescence detector (FLD) equipped with a YMC C30 column (250 × 4.6 mm id, 3 μm, MZ Analysentechnik, Mainz, Germany). The mobile phase consisted of acetonitrile (A), methanol (B), and dichloromethane (C) with a gradient profile as follows: 85–65% A/15–35% B (0–5 min), 65–10% A/35–85% B (5–10 min), 10–30% A/85–40% B (10–15 min) as described by Irakli et al. [32]. The flow rate was 1.5 mL/min and the injection volume was 20 μL. Tocopherol isomers, named α-tocopherol (α-T), β-tocopherol (β-T), γ-tocopherol (γ-T) and δ-tocopherol (δ-T) were detected by FLD with excitation and emission wavelengths at 290 and 320 nm, respectively, whereas carotenoids (lutein, zeaxanthin and β-carotene) were detected by DAD at 450 nm. External calibration curves were constructed using standard solutions and the results were expressed as μg per g of lentil extracts (μg/g).

2.11. Statistical Analysis

All samples were analyzed in three replicates. The effects of genotype, location, environment (combined year and location) and their interaction effect on phytochemical components and antioxidant capacity were determined by two-way analysis of variance (ANOVA), applying the general linear model procedure. Tukey’s test was used to determine differences between means at p ≤ 0.05. Connections between traits were analyzed by Pearson correlation coefficient (r). Principal component analysis (PCA) was performed to evaluate associations among genotype × environment, year, genotype × year and genotype × location as well as among the bioactive traits by considering the average value of each factor [41]. All statistical analyses were performed using Minitab Version 17 software (Minitab Inc., State College, PA, USA).

3. Results and Discussion

3.1. Phytochemical Compounds of Lentil Genotypes

3.1.1. TPC, TFC, TPAC, TNC and Antioxidant Activity

Phenolic compounds are considered to be an important bioactive compound found in plants due to their various potential biological activities, such as antioxidant, anticancer and anti-inflammatory actions [42]. Five lentil genotypes grown for two consecutive years at ten different locations in Greece were tested for their phytochemical compounds and antioxidant activity. Table 2 presents the mean values of TPC, TFC, TNC, TPAC and antioxidant activity as measured by ABTS, DPPH and FRAP methods, taking into account the genotype and location effects. Significant differences (p ≤ 0.05) in all bioactive components were observed between genotypes and locations taking into account the average of the two growing seasons.
TPC and TFC varied significantly among tested lentils, ranging from 5.66 to 6.38 mg GAE/g and 4.65 to 5.31 mg CATE/g, respectively, with mean values of 5.90 mg GAE/g and 4.95 mg CATE/g. Among all the genotypes studied, the red lentil “03-24L” had the highest amount of TPC and “Samos” the greatest amount of TFC, whereas the cultivars “Dimitra” and “Thessalia” showed the lowest values TPC and TFC, respectively. Other cultivars had moderate TPC (5.89–5.90 mg GAE/g) and TFC values (4.77–4.80 mg CATE/g). The TPC of the Greek lentils in the present study were similar to those reported by others [5,11], whereas the TFC values were approximately five times higher than those reported by Zhang et al. [5]. This discrepancy in TFC could be attributed to a different determination method. Similar to the TPC and TFC results, genotype “03-24L” had the highest TNC (Table 2), whereas cultivar “Thessalia” had the lowest; while the mean value of TNC of all lentils samples was 3.04 mg GAE/g. Similar TNC values were reported by Menga et al. [43], studying the effect of organic farming on bioactive compounds.
Proanthocyanidins are oligomers of catechin and epicatechin molecules that are primarily present in lentils having colored seed coats [1]. The TPAC of lentil genotypes ranged from 7.27 to 8.93 mg PCBE/g, with a mean value of 7.93 mg PCBE/g (Table 2). Cultivar “Samos” had the highest TPAC, known as condensed tannins, followed by “03-24L”, “Dimitra”, “Elpida” and “Thessalia”. A high content of TPAC (10.4–16.1 mg CATE/g) was already reported for lentils [11], which is much higher than those reported in our study, however, Menga et al. [43], reported much lower TPAC values. This discrepancy could be explained by the use of a different standard compound to express the results. In the previous study, the results were expressed as CATE, however, in our study the calibration curve was based on PCBE measurements.
Significant antioxidant levels have been found in lentils, indicating its importance in a healthy diet to reduce the risk of many chronic diseases, as well as its potential as a source of functional food ingredients. Significant differences were found in the antioxidant activity (ABTS, DPPH and FRAP methods), per genotype averaged across locations, as well as per location regardless of the genotype (Table 2). Similar to the phenolic compound contents, ”03-24L” genotype had the highest antioxidant activity as evaluated by all three ABTS, DPPH and FRAP assays, while cultivars “Dimitra” and “Thessalia” exhibited the lowest antioxidant activity among all the studied cultivars. However, “Samos” had the lowest antioxidant activity as evaluated by the FRAP method among all the genotypes.
TPC was highest in Thessaloniki (6.19 mg GAE/g), followed by Petrana, Anatoliko and Komotini, with non-significant (p > 0.05) differences among these locations. Patriki had the lowest TPC of 5.62 mg GAE/g, followed by Ipato, Ag. Anargiri, Larissa, Orestiada and Domokos, with non-significant differences among them (Table 2). Variations in TFC and TPAC were also observed among locations, where Ag. Anargiri and Anatoliko had the highest TFC and TPAC, respectively. It is worth mentioning that Larissa presented the lowest TPAC among all locations. Concerning TNC, Anatoliko had the highest value, while Ag. Anargiri the lowest one. The antioxidant activity (as evaluated by the three methods) of lentils grown in Larissa and Petrana were significantly higher than that of other locations, whereas lentils grown in Orestiada had the lowest antioxidant activity as measured by ABTS and FRAP methods. Several authors have concluded that the antioxidant properties of lentils are significantly influenced by the genotype [11,12], however, as far as our knowledge is concerned, there are no published studies reporting the variations of antioxidant activity in lentils grown in different locations.

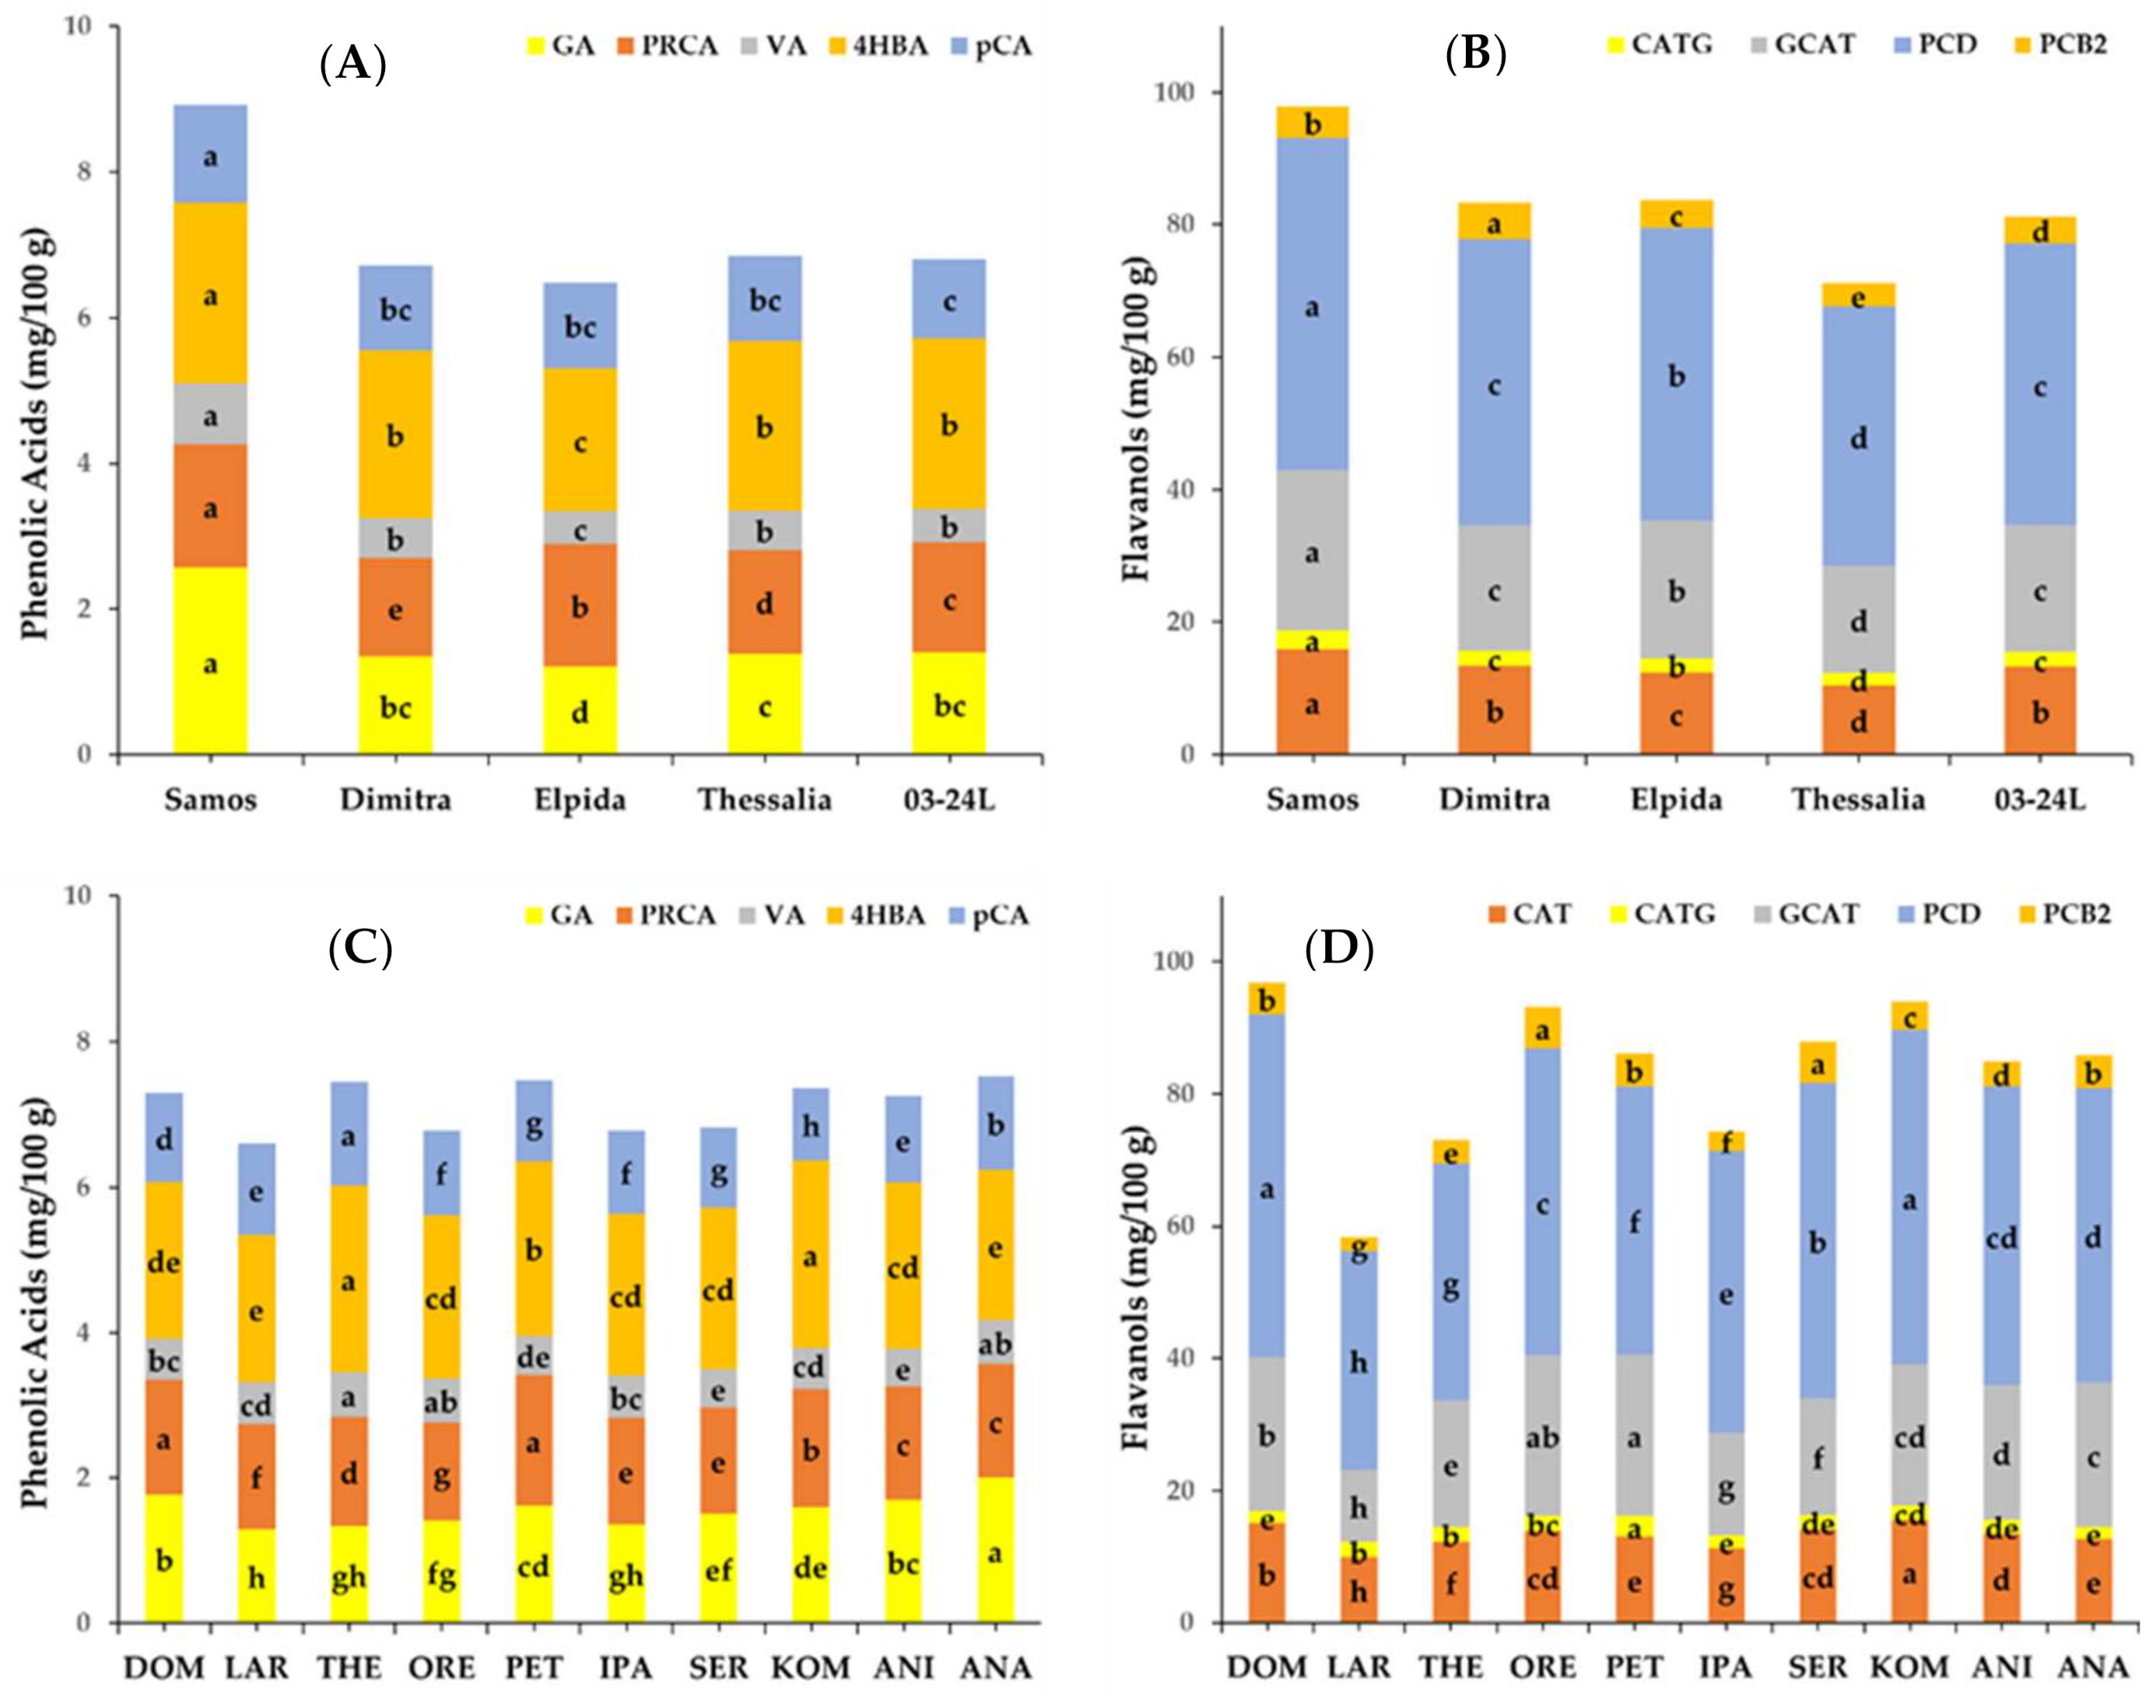
3.1.2. Quantification of Phenolic Compounds

HPLC-DAD is generally used for the separation and quantification of phenolic compounds present in legumes. Phenolic compounds in lentils are divided into subgroups of phenolic acids and flavonoids, including flavanols and proanthocyanidins [42]. The concentrations of individual phenolics (phenolic acids and flavanols) in the free phenolic fraction of the lentil are illustrated in Figure 1, for the five genotypes and ten locations tested. Flavanols, including their monomers and oligomers, were the dominant free phenolics in lentils, followed by phenolic acids at much lower concentrations. The mean values of flavanols and phenolic acids across all lentil genotypes and locations were 83.45 and 7.64 mg/100 g, respectively. The predominant flavanol in lentil extracts was procyanidin dimer I (PCD), followed by gallocatechin (GCAT), catechin (CAT), procyanidin B2 (PCB) and catechin gallate (CATG), whereas the main phenolic acids quantified were 4-hydroxy-benzoic acid (4HBA), followed by gallic acid (GA), protocatechuic acid (PRCA), p-coumaric acid (pCA) and vanillic acid (VA). Findings in the present study are similar to other reports for phenolic compounds found in lentils using LC-MS [11,12]. The content of PCD represented the highest percentage (53%) of identified phenolics (43.83 mg/100 g), while the contents of CAT and CATG represented 40% of identified phenolics (33.00 mg/100 g) and in all lentil genotypes. 4HBA was the main phenolic acid in lentil genotypes (2.28 mg/100 g), followed by PRCA (1.57 mg/100 g) and GA (1.55 mg/100 g).
Among the studied genotypes, ‘Samos’ had the highest flavanols and phenolic acids contents, at 97.86 and 9.47 mg/100 g, respectively, while “Thessalia” had the lowest values of flavanols content (41.14 mg/100 g) (Figure 1A,B). Regarding locations, lentil genotypes grown in Domokos (96.84 mg/100 g), Komotini (94.00 mg/100 g) and Orestiada (92.75 mg/100 g) indicated the highest value of flavanols than the other locations (58.49–87.95 mg/100 g), while Larissa gave the lowest value of flavanols (Figure 1C,D).

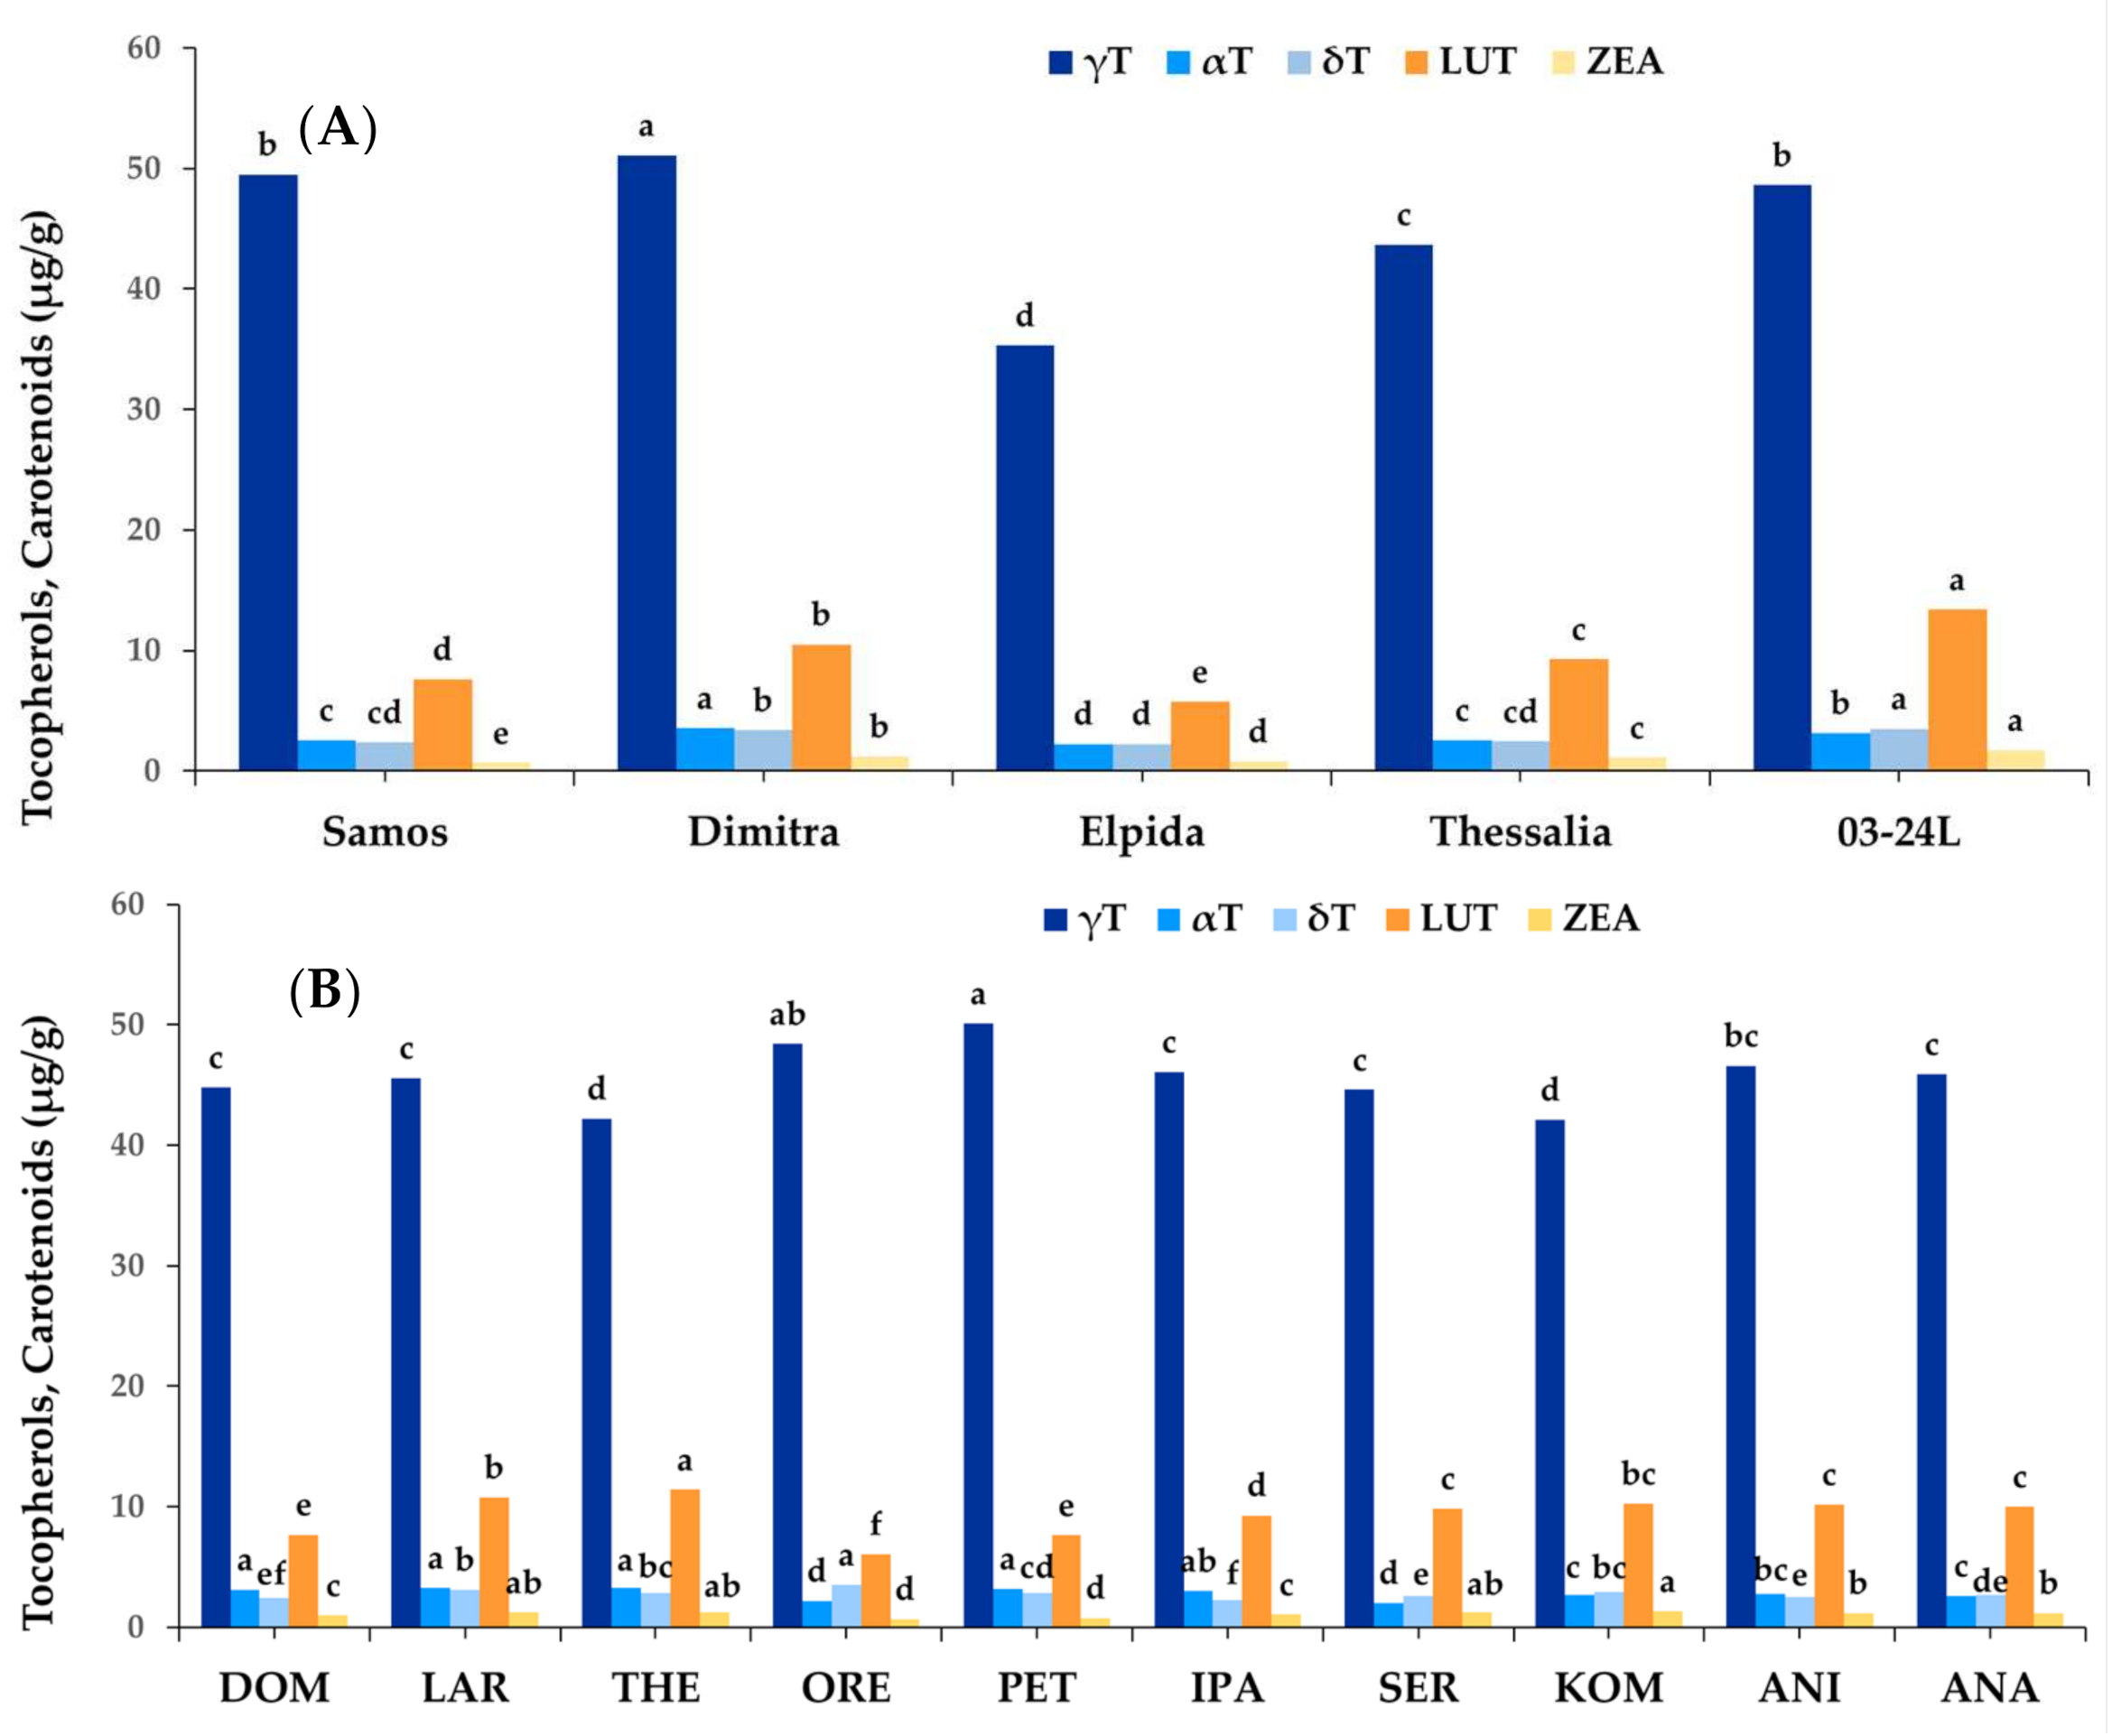
3.1.3. Tocopherols and Carotenoids

In the present study, three tocopherol isomers (α, γ- and δ-T) were detected in lentil seeds (Figure 2A). γ-T was the predominant tocopherol isomer in all lentil genotypes, accounting for on average 93% of the total tocopherol content, followed by α-T and δ-T. The total tocopherols (sum of all isomers) contents of lentil genotypes ranged from 38.43 to 54.83 μg/g, observing significant differences between genotypes and locations. “Dimitra” exhibited the highest value of total tocopherol among all the cultivars, whereas “Elpida” the lowest one. The tocopherol profile and concentrations were similar to those reported for whole lentil seeds [11,18].
Carotenoids are fat-soluble pigments responsible for yellow, orange, and red colors in plants, playing an important role in human nutrition as precursors of vitamin A and antioxidants. In the present study, lutein and zeaxanthin were identified as the major carotenoids in lentil seeds (Figure 2B). The total carotenoids’ content across the genotypes and locations ranged from 4.90 to 18.61 μg/g, with the red genotype “03-24L” showing the highest content, while cultivar “Elpida” indicated the lowest one. The carotenoids range was similar to that of Zhang et al. [4] and Lee et al. [44], however, they found no statistically significant difference between the two color groups (red and green). The levels of lutein varied significantly (p ≤ 0.05) among genotypes and locations were 6–13 times higher than those of zeaxanthin. No β-carotene was detected in any of the lentil genotypes. The highest concentration of total carotenoids was found in lentils grown in location Thessaloniki (12.66 μg/g) and the lowest in location Orestiada (6.70 μg/g).

3.2. Effect of Genotype and Environment on Phytochemical Components

Table 3 displays the results of two-way ANOVA for five lentil genotypes grown in twenty environments (environment was determined as location per year). The statistical analysis revealed highly significant effects for genotype (G), environment (E) and their interactions G×E (p ≤ 0.001) for phytochemical components including TPC, TFC, TNC, TPAC, phenolic acids and flavanols, tocopherols and carotenoids as well as their antioxidant activity evaluated by ABTS, DPPH and FRAP methods.
Genotype showed low to moderate contribution to total variations of TPC, TFC, TPAC, TNC and flavanols and antioxidant activity (2–24%). However, genotype contributed to a large portion of the total variance in phenolic acids (56%), tocopherols (60%) and carotenoids (62%). On the other hand, environment contributed to a high portion of the total variance in TNC (73%), TFC (49%), flavanols (41%) and antioxidant activity as determined by ABTS and FRAP methods (51–58%), whereas in tocopherols (10%), and phenolic acids (8%), the contribution was the lowest among the sources of variations. However, the contributions of their interaction G×E to total variations were high in TPC (53%), TPAC (66%) and antioxidant activity by DPPH method (53%), whereas in TFC, TAN, phenolic acids, tocopherols, flavanols and antioxidant activity by ABTS and FRAP methods was moderate (24–38%).
In this study, we found that the genotype contributed to the lowest portions of total variations for most of the hydrophilic phenolic components like phenolics, flavonoids, tannins and proanthocyanidins, although genotype was significantly different for all the traits (Table 3). However, tannins and total flavonoids were mostly subject to environmental variation, whereas the high contribution of G×E interaction for the total phenolics and proanthocyanidins indicated that the genotypes performed differently across environments. Similarly, it has been reported that the environment had high effects on phytochemicals related to antioxidants in cereals [45].
It has been reported that environmental factors, such as sunny days, soil type and precipitation had an effect on the phenolic contents of plants [46]. Moreover, high altitudes and prolonged exposure to sunlight with UV radiation positively affect the synthesis of phenolic compounds [47], and the cultivation site was a major factor affecting the composition of phenolic compounds rather than cultivation technique in black currants [48]. Hence, it is to be noted that even though a genotype produces a high level of phenolic compounds, its final concentration can be environment-dependent.
Both genetic and environmental factors had a strong and important impact on tocopherols and carotenoids in lentil genotypes, however, greater variation due to the genotype was found in this study. The importance of genotypic variation over the environment and G×E for the tocopherols and carotenoids was also found in previous studies on maize [49]. The antioxidant capacity showed different variation patterns of genotype, environment, and G×E effects. The environment variance in ABTS and FRAP was higher than genotypic variance, however, the G×E interaction variance in DPPH was higher than the genotypic variance, similar to the phenolic compounds. Previous studies have shown greater variation due to the genotype in DPPH methods than in ABTS [45].

3.3. Correlation Coefficients among Phytochemicals Compounds

Significant positive correlations (p ≤ 0.001) were observed between several of the bioactive components (Table 4), which indicated that when selection is applied for one of these traits, an indirect improvement could be observed in the other traits. TPC was moderately correlated with TFC, DPPH and FRAP (r = 0.41–0.51, p ≤ 0.001), but it had low correlations with the ABTS, TNC, tocopherols and carotenoids (r = 0.19–0.29, p ≤ 0.001). In the present study, no significant correlation was observed between TPC and TPAC (r = 0.15, p > 0.05)), in contrast to other studies, where high correlation was recorded between TPC and TPAC. This discrepancy may be due to the complexity of the phenolic profile of the lentils in contrast to other legumes, as stated by Xu and Chang [29] and Menga et al. [43].
In addition, TFC was moderately correlated with TPAC (r = 0.45, p ≤ 0.001), but highly with the antioxidant activity measured by all methods (r = 0.51–0.67, p ≤ 0.001), showing that total flavonoids contribute to a high extent to antioxidant activity of lentils. TPAC was moderately correlated with phenolic acids (r = 0.49, p ≤ 0.001), but low correlations were observed with TNC, flavanols and tocopherols (r = 0.17–0.27, p ≤ 0.001). Moreover, TPAC had weak correlations with antioxidant activity (r = 0.11–0.25). According to Xu and Chang [29], the antioxidant activities of 11 cultivars of lentils as estimated by DPPH assay did not correlate with TPAC. Similarly, Menga et al. [43] found no correlation between antioxidant activity as measured by the ABTS method and TPAC. The relationship between DPPH, ABTS and FRAP was positive and significant (r = 0.50–0.60, p ≤ 0.001). Phenolic acids were moderately correlated with TPAC and flavanols (r = 0.49–0.59, p ≤ 0.001), but they had low with TNC and ABTS (r = 0.19, p ≤ 0.05). In contrast, there was no correlation between the flavanols and the antioxidant activity values; this finding is agreed with previous work [12]. It is well-known that nonflavonoid compounds show less antioxidant activity than flavonoids [50].
Furthermore, tocopherols were positively and moderately correlated with carotenoids (r = 0.35, p ≤ 0.001), but they had weak, but significant, correlation with antioxidant capacity as measured by ABTS (r = 0.21, p ≤ 0.05), DPPH (r = 0.19, p ≤ 0.05) and FRAP (r = 0.23, p ≤ 0.01). Similarly, carotenoids had low correlations with ABTS (r = 0.23, p ≤ 0.01), but moderate with DPPH and FRAP (r = 0.33–0.39, p ≤ 0.001). This suggests that carotenoids in lentils contribute to a greater extent in the antioxidant in contrast to tocopherols. Similar observations have been found by Zhang et al. [4], who reported correlated tocopherol and carotenoid contents in lentils by the DPPH method.
These findings clearly suggest that total phenol content may be an important contributor to the antioxidant activity in lentils, in agreement with the earlier reports [11]. Negative and significant correlations (p ≤ 0.01) were observed between TNC-ABTS (r = −0.25, p ≤ 0.01) and TNC–FRAP (r = −0.33, p ≤ 0.01), but no significant correlations were observed between TNC and flavanols, tocopherols and DPPH.

3.4. Multivariate Statistical Analyses

The overall variation and the relationships among different variables were investigated by principal component analysis (PCA) to assess and classify the phytochemical components and antioxidant capacity data among lentil genotypes. PCA, including 11 constituents analyzed in this study (TPC, TFC, TNC, TPAC, tocopherols, carotenoids, phenolic acids, flavanols, ABTS, DPPH and FRAP), genotype and environmental factors (year and location), produced a loading plot with ten factors that accounted for 99.2% of the total variance (Figure 3). The first component (PC1), accounting for 35.6% of total variance, had large, approximately equal positive loadings for TPC (0.419), TFC (0.418), FRAP (0.413), DPPH (0.411) and ABTS (0.397). The second component (PC2, 19.6%) was primarily influenced by positive loadings of carotenoids (0.294), FRAP (0.192), and DPPH (0.187) and a negative loading for flavanols (−0.549), phenolic acids (−0.500) and TPAC (−0.454). Although smaller variation was assigned to PC3 (10.7%), it was influenced by carotenoids (0.427), tocopherols (0.399), TNC (−0.701), and TPC (−0.272).

3.4.1. Variation among Genotypes × Locations

The score plot of the first two principal components accounting for 55.2% of the total variance (Figure 3) showed a high variation within the genotypes and locations and were thus not completely distinguishable in phytochemical compounds compositions and antioxidant activity between lentil genotypes. The overlapping of clusters is reflecting similarities in composition. When analyzing this plot for the discrete variable, “genotype”, it was clear that only the genotype “03-24L”, stands out from the rest. Thus, the red genotype “03-24L2 grown in most test locations (except Orestiada, Komotini and Anatoliko), with high positive loadings on both PC1 and PC2 grouped to the upper right quadrant (positive) of the plot, indicating that it had higher content of phytochemical compounds, in general, and also had a tendency for a relatively high antioxidant activity. The PCA plot grouped most of the lentil samples of Thessalia in the upper left quadrant, except those grown in Orestiada, Petrana and Anatoliko. Lentils of “Dimitra” and “Elpida” grouped close to the middle of the plot and overlapped with other lentil genotypes, while lentils from “Samos” were grouped in the lower part of the plot and thus were considered as more sensitive to environmental factors than other genotypes. The variation within each location and the difficulties in the distinction of the genotypes, clearly indicated that environmental factors are important in the cultivation of lentils when focusing on the content of phytochemical compounds.
When analyzing the score plot with respect to the discrete variable, “location”, the positive side of PC1 (Figure 3), in particular the upper right quadrant, included most of the genotypes grown in Petrana. Most genotypes grown in Larissa, Komotini, Patriki, Anargiri and Ipato had high phytochemical contents, grouped in the upper left quandrant, whereas those grown in Orestiada had low phytochemicals and grouped in the lower left quandrant. The aforementioned showed that the variance within genotypes was explained foremost by the differences in the geographical location of the experimental fields.

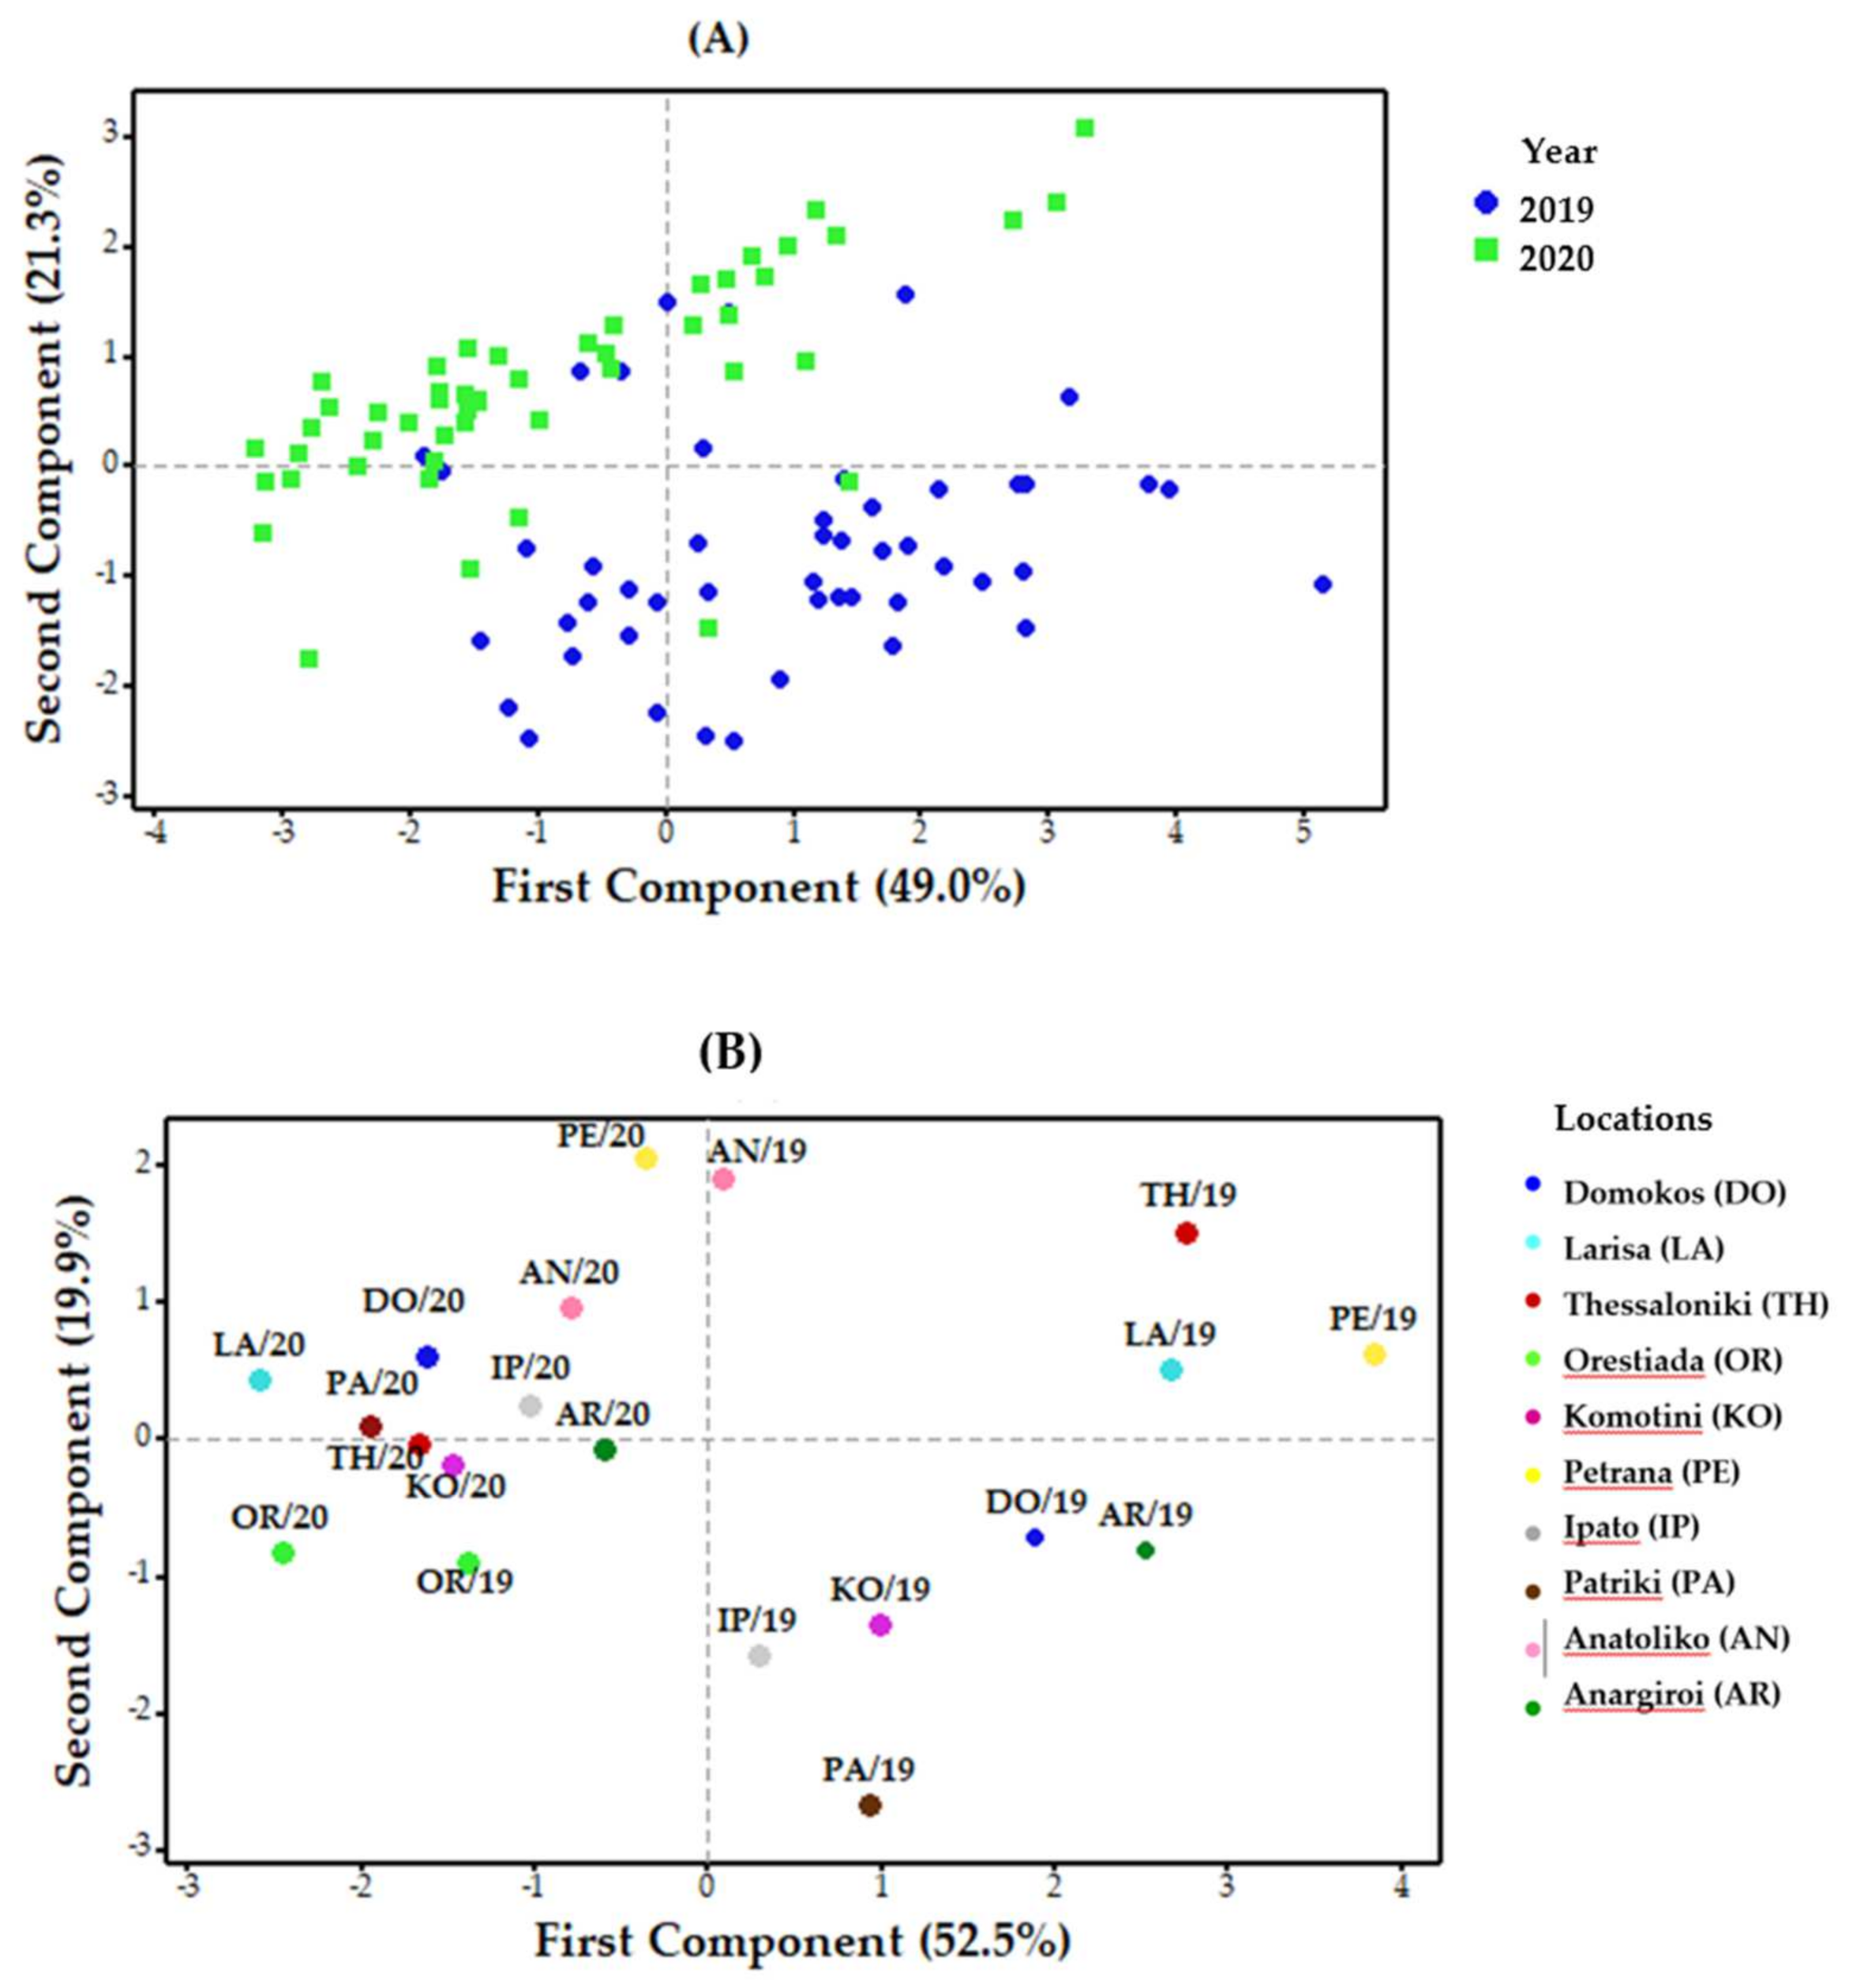
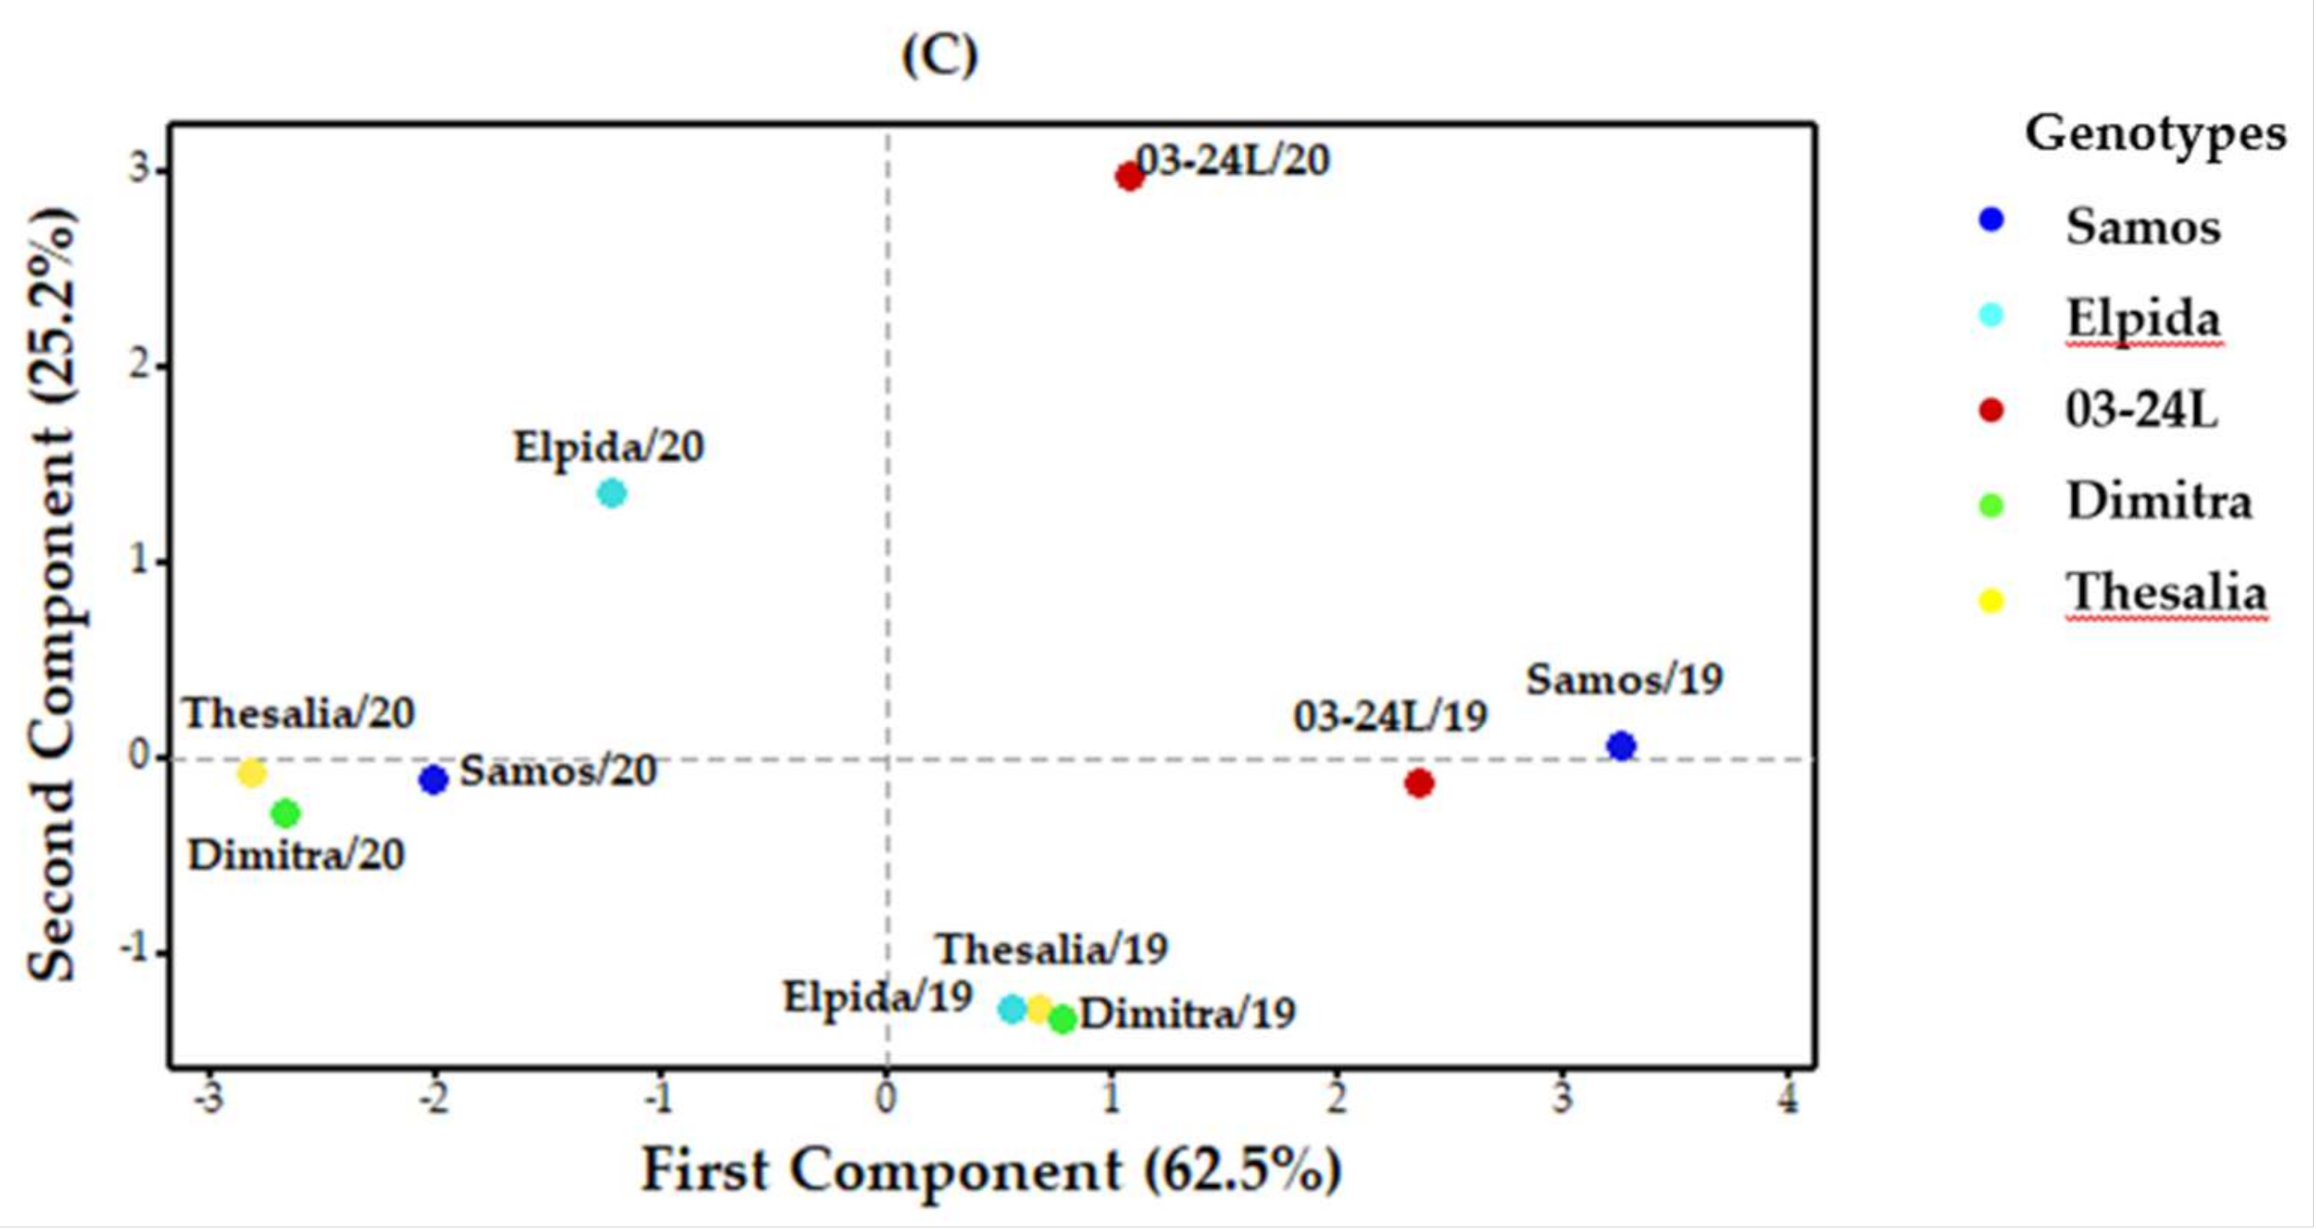
3.4.2. Variation Caused by Year

When analysing the score plot based on TPC, TFC, TPAC, TNC and antioxidant activity, with respect to the discrete variable, “year”, PC1 vs. PC2 displayed the most distinctive aggregation, explaining 70.3% of the total variation in the data set (Figure 4A). A clear tendency for clustering of the different years was easily recognized in the plot. It was evident that the samples of lentils were separated between the two years, while the year 2020 had a higher content of TPC, TFC and antioxidant activity than the year 2019. This showed that the factor “year” had a great influence on the polyphenol content and antioxidant activity of lentils. These differences may be ascribed to the different agroclimatic conditions such as temperature and amount of rainfall before harvest [51]. Previous studies have also mentioned a year-to-year variation in the content of phenolic compounds in durum wheat [52] and black currants [53].

3.4.3. Variation Caused by Location

When analysing the PCA model of the entire sample set with respect to the discrete variable, “location” per year, PC1 vs. PC2 indicated the most distinctive aggregation and explains 72.4% of the total variation within the sample set (Figure 4B). It was clear that the location where the lentils where grown was not a key factor in the TPC, TFC and antioxidant activity for the genotypes studied since most of the growing locations tended not to be grouped, except Orestiada and Anatoliko. Although there were differences in phenolic compounds and antioxidant activity between years for each location, it was shown that the locations Anatoliko and Petrana separated from the rest regardless of year, presenting the highest phenolic compounds and antioxidant activity. On the other hand, lentils grown in Orestiada had the lowest phenolic contents in both years among the studied locations. The great variations in phenolic compounds across locations might be due to pedoclimatic differences, especially between northern and southern Greece, but it may also be attributable to different genetic backgrounds of the plant material [53].

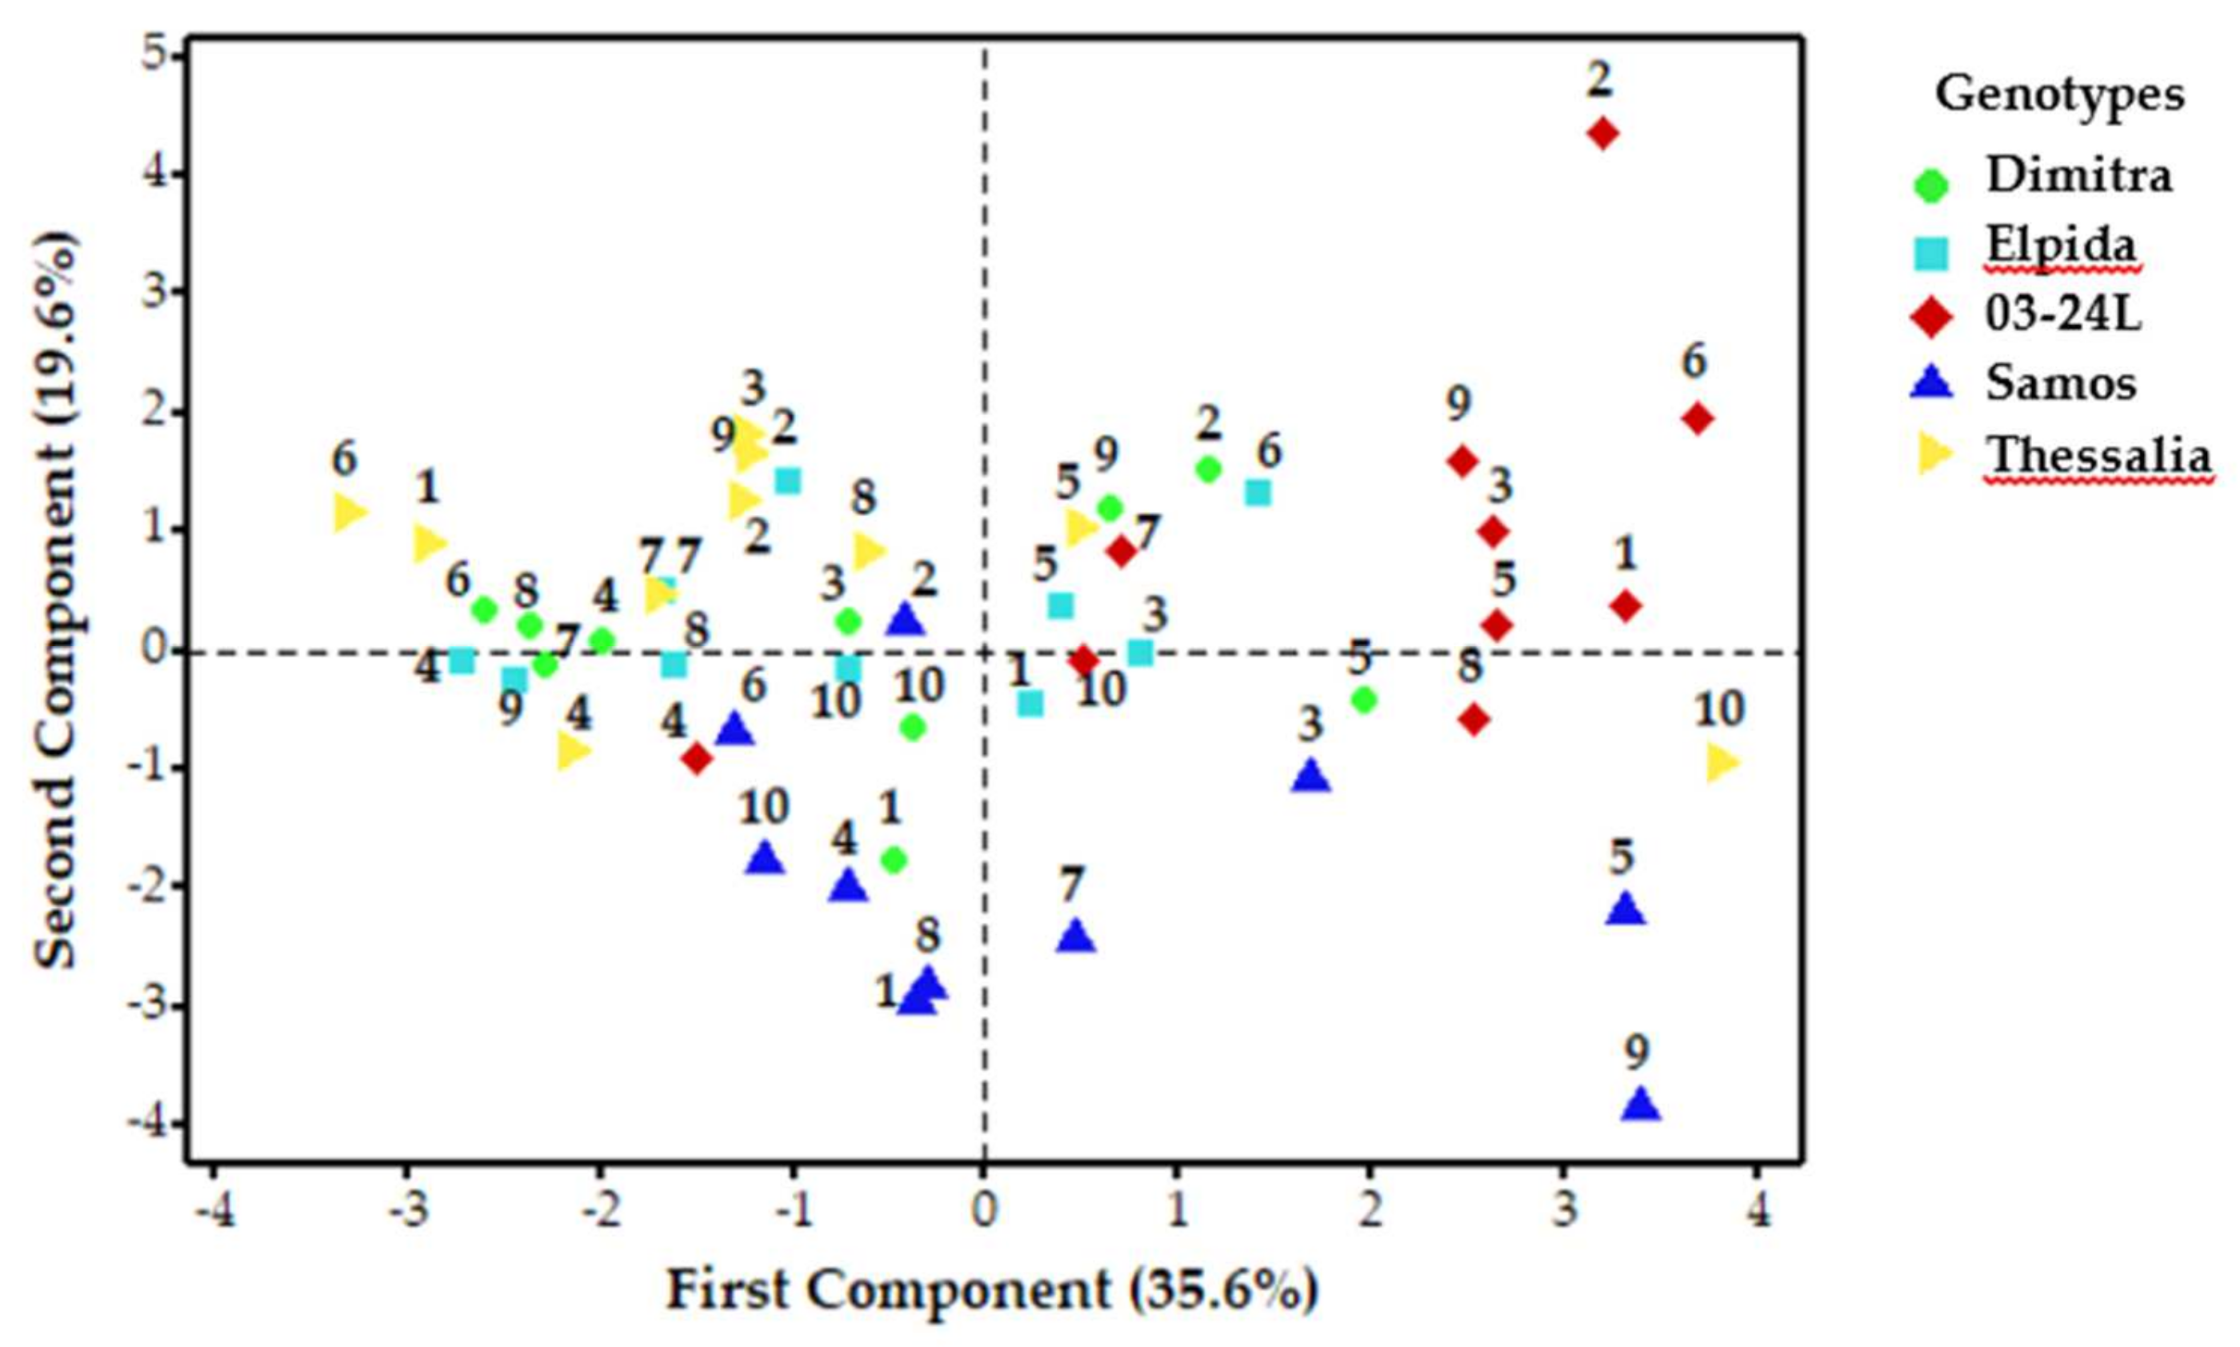
3.4.4. Variation Caused by Genotype

When analysing the PCA model of the entire sample set with respect to the discrete variable, “genotype” per year, PC1 vs. PC2 showed the most distinctive aggregation and explained 87.7% of the total variation within the sample set (Figure 4C). It was clear that the genotype “03-24L” separated from the rest by the greatest content of TPC for both years. In addition, it was observed that the phenolic profile of genotype “Samos” was highly influenced by year, as its data points were spread out over most of the common plot area. On the other hand, the genotypes “Dimitra” and “Thessalia” were grouped together in the lower part of the common area, spread out downwards by presenting the lowest content of phenolic compounds and antioxidant activity within each year. Moreover, high variation between years was observed for genotype “Elpida” regarding polyphenols, indicating that year was the main contributor with respect to polyphenolic content variation. According to our results, the content of polyphenols in lentil was less sensitive to genotypic factors than previous studies, however, it is remarkable that the PCA model in our study was build on only five lentil genotypes compared to other studies that investigated a larger number of varieties such as a similar study conducted in Saudi Arabia with 35 genotypes [54]. Nevertheless, the red lentil “03-24L” exhibited an interesting bioactive profile and therefore could be exploited as source material in order to develop cultivars with a multiple combination of superior quality traits and bioactive merit.

4. Conclusions

Evaluation of important phytochemical components of five lentil cultivars grown in ten locations in Greece for two consecutive growing seasons demonstrated that both the genotype and environment, evaluated over locations and years, exhibited significant effect in all phytochemical components evaluated. Environment effects were greater for TPC, TFC and TPAC concentrations and antioxidant activity than genotypic effects, while carotenoids and tocopherols were mainly genotypic-dependent. Moreover, a significant yearly variation was observed in the composition of the phenolic compounds analyzed. Flavanols were the main phenolic compounds in hydrophilic extracts of the lentil genotypes, followed by phenolic acids. Concerning lipophilic extracts, tocopherols and carotenoids were the main components, with γ-tocopherol and lutein being the predominant isomers, respectively. The red lentil genotype “03-24L” was highlighted for its high phenolic compound contents and antioxidant capacity values. Therefore, it was considered as a promising genetic material that may be used in genetic improvement programs for the development of lentil varieties with specific traits to be consumed as functional food or used as feed ingredients. On the basis of this study, further investigation with a higher number of genotypes is suggested to better understand the role of the considered factors on the occurrence of bioactive compounds and antioxidant properties in lentils.

Author Contributions

Conceptualization, D.N.V. and M.I.; methodology, M.I.; formal analysis, M.I.; investigation, A.K., E.T., D.B., M.F., C.P., K.S. and N.T.; data curation, M.I.; writing—original draft preparation, M.I.; writing—review and editing, D.N.V.; visualization, M.I.; supervision, D.N.V.; project administration, D.N.V., M.I., A.K. and D.B.; funding acquisition, D.N.V. All authors have read and agreed to the published version of the manuscript.

Funding

This research was co-financed by the European Regional Development Fund of the European Union and Greek national funds through the Operational Program Competitiveness, Entrepreneurship and Innovation, under the call RESEARCH—CREATE—INNOVATE (project code: Τ1EDK-04633).

Institutional Review Board Statement

Not applicable.

Informed Consent Statement

Not applicable.

Data Availability Statement

The data presented in this study are available on request from the corresponding author.

Acknowledgments

The authors would like to acknowledge the technician personnel of the Hellenic Agricultural Organization—DEMETER, the Aristotle University of Thessaloniki and the Department of Agricultural Development of Democritus University of Thrace for their assistance in the establishment of field experiments and the pretreatment of the lentil samples.

Conflicts of Interest

The authors declare no conflict of interest.

References

  1. Liber, M.; Duarte, I.; Maia, A.T.; Oliveira, H.R. The history of lentil (Lens culinaris subsp. culinaris) domestication and spread as revealed byg enotyping-by-sequencing of wild and landrace accessions. Front. Plant Sci. 2021, 12, 1–18. [Google Scholar] [CrossRef] [PubMed]
  2. Rochfort, S.; Panozzo, J. Phytochemicals for health, the role of pulses. J. Agric. Food Chem. 2007, 55, 7981–7994. [Google Scholar] [CrossRef] [PubMed]
  3. Ajila, C.M.; Brar, S.K.; Verma, M.; Rao, U.P. Sustainable Solutions for Agro Processing Waste Management: An Overview. In Environmental Protection Strategies for Sustainable Development; Malik, A., Grohmann, E., Eds.; Springer: Dordrecht, The Netherlands, 2012; pp. 65–109. [Google Scholar]
  4. Zhang, B.; Deng, Z.; Tang, Y.; Chen, P.; Liu, R.; Ramdath, D.D.; Liu, Q.; Hernandez, M.; Tsao, R. Fatty acid, carotenoid and tocopherol compositions of 20 Canadian lentil cultivars and synergistic contribution to antioxidant activities. Food Chem. 2014, 161, 296–304. [Google Scholar] [CrossRef]
  5. Zhang, B.; Deng, Z.; Amdath, D.D.; Tang, Y.; Chen, P.X.; Liu, R.; Liu, Q.; Tsao, R. Phenolic profiles of 20 Canadian lentil cultivars and their contribution to antioxidant activity and inhibitory effects on α-glucosidase and pancreatic lipase. Food Chem. 2015, 172, 862–872. [Google Scholar] [CrossRef] [PubMed]
  6. Baojun, X.; Chang, S.K.C. Phytochemical profiles and health-promoting effects of cool-season food legumes as influenced by thermal processing. J. Agric. Food Chem. 2009, 57, 10718–10731. [Google Scholar]
  7. Amarowicz, R.; Estrella, I.; Hernández, T.; Dueñas, M.; Troszyńska, A.; Kosińska, A.; Pegg, R.B. Antioxidant activity of a red lentil extract and its fractions. Int. J. Mol. Sci. 2009, 10, 5513–5527. [Google Scholar] [CrossRef] [Green Version]
  8. Amarowicz, R.; Estrella, I.; Hernández, T.; Robredo, S.; Troszynska, A.; Kosinska, A.; Pegg, R.B. Free radical-scavenging capacity, antioxidant activity, and phenolic composition of green lentil (Lens culinaris). Food Chem. 2010, 121, 705–711. [Google Scholar] [CrossRef]
  9. Fratianni, F.; Cardinale, F.; Cozzolino, A.; Granese, T.; Albanese, D.; Matteo, M.D.; Zaccardelli, M.; Coppola, R.; Nazzaro, F. Polyphenol composition and antioxidant activity of different grass pea (Lathyrus sativus), lentils (Lens culinaris), and chickpea (Cicer arietinum) ecotypes of the Campania region (Southern Italy). J. Funct. Foods 2014, 7, 551–557. [Google Scholar] [CrossRef]
  10. Duenas, M.; Sarmento, T.; Aguilera, Y.; Benitez, Y.V.; Molla, E.; Esteban, R.M.; Martín-Cabrejas, M.A. Impact of cooking and germination on phenolic composition and dietary fibre fractions in dark beans (Phaseolus vulgaris L.) and lentils (Lens culinaris L.). LWT Food Sci. Technol. 2016, 66, 72–78. [Google Scholar] [CrossRef]
  11. Sun, Y.; Deng, Z.; Liu, R.; Zhang, H.; Zhu, H.; Jiang, L.; Tsao, R. A comprehensive profiling of free, conjugated and bound phenolics and lipophilic antioxidants in red and green lentil processing by-products. Food Chem. 2020, 325, 126925–126937. [Google Scholar] [CrossRef] [PubMed]
  12. Aguilera, Y.; Duenas, M.; Estrella, I.; Hernandez, T.; Benitez, V.; Esteban, R.M.; Martin-Cabrejas, M.A. Evaluation of phenolic profile and antioxidant properties of pardina lentil as affected by industrial dehydration. J. Agric. Food Chem. 2010, 58, 10101–10108. [Google Scholar] [CrossRef]
  13. Yeo, J.; Shahidi, F. Identification and quantification of soluble and insoluble-bound phenolics in lentil hulls using HPLC-ESI-MS/MS and their antioxidant potential. Food Chem. 2020, 315, 126202–126210. [Google Scholar] [CrossRef]
  14. Mirali, M.; Purves, R.W.; Vandenberg, A. Profiling the phenolic compounds of the four major seed coat types and their relation to color genes in lentil. J. Nat. Prod. 2017, 80, 1310–1317. [Google Scholar] [CrossRef] [PubMed]
  15. Kushi, L.H.; Meyer, K.A.; Jacobs, D.R. Cereal, legumes, and chronic disease risk reduction: Evidence from epidemiologic studies. Am. J. Clin. Nutr. 1999, 70, 451s–458s. [Google Scholar] [CrossRef] [PubMed] [Green Version]
  16. Adebamowo, C.A.; Cho, E.; Sampson, L.; Katan, M.B.; Spiegelman, D.; Willett, W.C.; Holmes, M.D. Dietary flavonols and flavonol-rich foods intake and the risk of breast cancer. Intern. J. Cancer 2005, 114, 628–633. [Google Scholar] [CrossRef]
  17. Papanikolaou, Y.; Fulgoni, V.L. Bean consumption is associated withgreater nutrient intake, reduced systolic blood pressure, lower body weight, and a smaller waist circumference in adults: Results from the National Health and Nutrition Examination Survey 1999–2002. J. Am. Coll. Nutr. 2008, 27, 569–576. [Google Scholar] [CrossRef]
  18. Boschin, G.; Arnoldi, A. Legumes are valuable sources of tocopherols. Food Chem. 2011, 127, 1199–1203. [Google Scholar] [CrossRef]
  19. Knekt, P.; Reunanen, A.; Jarvinen, R.; Seppanen, R.; Heliovaara, M.; Aromaa, A. Antioxidant vitamin intake and coronarymortality in a longitudinal population study. Am. J. Epidemiol. 1994, 139, 1180–1189. [Google Scholar] [CrossRef]
  20. Tucker, J.M.; Townsend, D.M. Alpha-tocopherol: Roles inprevention and therapy of human disease. Biomed. Pharmacother. 2005, 59, 380–387. [Google Scholar] [CrossRef] [PubMed]
  21. Padhi, E.M.T.; Liu, R.; Hernandez, M.; Tsao, R.; Ramdath, D.D. Total polyphenol content, carotenoid, tocopherol and fatty acid composition of commonly consumed Canadian pulses and their contribution to antioxidant activity. J. Funct. Foods 2017, 38, 602–611. [Google Scholar] [CrossRef]
  22. Erskine, W.; Williams, P.C.; Nakkoul, H. Genetic and environmental variation in the seed size, protein, yield, and cooking quality of lentils. Field Crop. Res. 1985, 12, 153–161. [Google Scholar] [CrossRef]
  23. Biçer, N.T.; Sakar, D. Evaluation of some lentil genotypes at different locations in Turkey. Int. J. Agric. Biol. 2004, 6, 317–320. [Google Scholar]
  24. Shrestha, R.; Rizvi, A.H.; Sarker, A.; Darai, R.; Paneru, R.B.; Vandenberg, A.; Singh, M. Genotypic variability and genotype × environment interaction for iron and zinc content in lentil under Nepalese environments. Crop Sci. 2018, 58, 2503–2510. [Google Scholar] [CrossRef]
  25. Thavarajah, D.; Thavarajah, P.; Wejesuriya, A.; Rutzke, M.; Glahn, R.P.; Combs, G.F.; Vandenberg, A. The potential of lentil (Lens culinaris L.) as a whole food for increased selenium, iron, and zinc intake: Preliminary results from a 3 year study. Euphytica 2011, 180, 123–128. [Google Scholar] [CrossRef]
  26. Boudjou, S.; Oomah, B.D.; Zaidi, F.; Hosseinian, F. Phenolics content and antioxidant and anti-inflammatory activities of legume fractions. Food Chem. 2012, 138, 1543–1550. [Google Scholar] [CrossRef] [PubMed]
  27. Ninou, E.; Papathanasiou, F.; Vlachostergios, D.N.; Mylonas, I.; Kargiotidou, A.; Pankou, C.; Papadopoulos, I.; Sinapidou, E.; Tokatlidis, I. Intense breeding within lentil landraces for high-yielding pure lines sustained the seed quality characteristics. Agriculture 2019, 9, 175. [Google Scholar] [CrossRef] [Green Version]
  28. Vlachostergios, D.N.; Tzantarmas, C.; Kargiotidou, A.; Ninou, E.; Pankou, C.; Gaintatzi, C.; Mylonas, I.; Papadopoulos, I.; Foti, C.; Chatzivassiliou, E.K.; et al. Single-plant selection within lentil landraces at ultra-low density: A short-time tool to breed high yielding and stable varieties across divergent environments. Euphytica 2018, 214, 58–73. [Google Scholar] [CrossRef]
  29. Xu, B.; Chang, S.K.C. Phenolic substance characterization and chemical and cell-Based antioxidant activities of 11 lentils grown in the Northern United States. J. Agric. Food Chem. 2010, 58, 1509–1517. [Google Scholar] [CrossRef]
  30. Dave, B.; Caspar, O.F.; Malcolmson, L.J.; Bellido, A.-S. Phenolics and antioxidant activity of lentil and pea hulls. Food Res. Int. 2011, 44, 436–441. [Google Scholar]
  31. Tsialtas, I.Τ.; Irakli, M.; Lazaridou, A. Traits related to bruchid resistance and its parasitoid in vetch seeds. Euphytica 2018, 214, 238–250. [Google Scholar] [CrossRef]
  32. Irakli, M.; Chatzopoulou, P.; Kadoglidou, K.; Tsivelika, N. Optimization and development of a high-performance liquid chromatography method for the simultaneous determination of vitamin E and carotenoids in tomato fruits. J. Sep. Sci. 2016, 39, 3348–3356. [Google Scholar] [CrossRef]
  33. Singleton, V.L.; Orthofer, R.; Lamuela-Raventοs, R.M. Analysis of total phenols and other oxidation substrates and antioxidants by means of folin-ciocalteu reagent. Methods Enzymol. 1998, 299, 152–178. [Google Scholar]
  34. Makkar, H.P.S.; Bluemmel, M.; Borowy, N.K.; Becker, R.K. Gravimetric determination of tannins and their correlate ions with chemical and protein precipitation methods. J. Sci. Food Agric. 1993, 61, 161–165. [Google Scholar] [CrossRef]
  35. Bao, J.S.; Cai, Y.; Sun, M.; Wang, G.Y.; Corke, H. Anthocyanins, flavonols, and free radical scavenging activity of Chinese bayberry (Myrica rubra) extracts and their color properties and stability. J. Agric. Food Chem. 2005, 53, 2327–2332. [Google Scholar] [CrossRef] [PubMed]
  36. Porter, L.J.; Hrstich, L.N.; Chan, B.G. The conversion of procyanidins and prodelphinidins to cyanidin anddelphinidin. Phytochemistry 1986, 25, 223–230. [Google Scholar] [CrossRef] [Green Version]
  37. Re, R.; Pellegrini, N.; Proteggente, A.; Pannala, A.; Yang, M.; Rice-Evans, C.A. Antioxidant activity applyingan improved ABTS radical cation decolorization assay. Free Radic. Biol. Med. 1999, 26, 1231–1237. [Google Scholar] [CrossRef]
  38. Yen, G.C.; Chen, H.Y. Antioxidant activity of various tea extracts in relation to their antimutagenicity. J. Agric. Food Chem. 1995, 43, 27–32. [Google Scholar] [CrossRef]
  39. Benzie, F.; Strain, J. Ferric reducing/antioxidant power assay: Direct measure of total antioxidant activityof biological fluids and modified version for simultaneous measurement of total antioxidant power andascorbic acid concentration. Methods Enzymol. 1999, 299, 15–23. [Google Scholar]
  40. Skendi, A.; Irakli, M.; Chatzopoulou, P. Analysis of phenolic compounds in Greek plants of Lamiaceae family by HPLC. J. Appl. Res. Med. Aromat. Plants 2017, 6, 62–69. [Google Scholar] [CrossRef]
  41. Steel, R.G.D.; Torrie, J.H.; Dickey, D. Principles and Procedures of Statistics: A Biometrical Approach, 3rd ed.; McGraw Hill: New York, NY, USA, 1980; p. 672. [Google Scholar]
  42. Singh, B.; Singh, J.P.; Kaur, A.; Singh, N. Phenolic composition and antioxidant potential of grain legume seeds: A review. Food Res. Int. 2017, 101, 1–16. [Google Scholar] [CrossRef]
  43. Menga, V.; Codianni, P.; Fares, C. Agronomic management under organic farming may affect the bioactive compounds of lentil (Lens Culinaris L.) and grass pea (Lathyrus Communis L). Sustainability 2014, 6, 1059–1075. [Google Scholar] [CrossRef] [Green Version]
  44. Lee, Y.; Yeo, Y.S.; Park, S.Y.; Lee, S.G.; Lee, S.M.; Cho, H.S.; Chung, N.J.; Oh, S.W. Compositional analysis of lentil (Lens culinaris) cultivars related to colors and their antioxidative activity. Plant Breed. Biotechnol. 2017, 5, 192–203. [Google Scholar] [CrossRef] [Green Version]
  45. Shao, Y.; Xu, F.; Chen, Y.; Huang, Y.; Beta, T.; Bao, J. Analysis of genotype, environment, and their interaction effects on the phytochemicals and antioxidant capacities of red rice (Oryza sativa L.). Cereal Chem. 2014, 92, 204–210. [Google Scholar] [CrossRef]
  46. Manach, C.; Augustin, S.; Morand, C.; Remesy, C.; Jimenez, L. Polyphenols: Food sources and bioavailability. Am. J. Clin. Nutr. 2004, 79, 727–747. [Google Scholar] [CrossRef] [Green Version]
  47. Kishore, G.; Ranjan, S.; Pandey, A.; Gupta, S. Influence of altitudinal variation on the antioxidant potential of tartar buckwheat of western Himalaya. Food Sci. Biotechnol. 2010, 19, 1355–1363. [Google Scholar] [CrossRef]
  48. Anttonen, M.J.; Karjalainen, R.O. High-performance liquid chromatography analysis of black currant (Ribes nigrum L.) fruit phenolics grown either conventionally or organically. J. Agric. Food Chem. 2006, 54, 7530–7538. [Google Scholar] [CrossRef] [PubMed]
  49. Muzhingi, T.; Palacios-Rojas, N.; Miranda, A.; Cabrera, M.L.; Yeum, K.J.; Tang, G. Genetic variation of carotenoids, vitamin E and phenolic compounds in Provitamin A biofortified maize. J. Sci. Food Agric. 2016, 97, 793–801. [Google Scholar] [CrossRef] [PubMed]
  50. Baderschneider, B.; Winterhalter, P. Isolation and characterization of novel benzoates, cinnamates, flavonoids and lignans from Riesling wine and screening for antioxidant activity. J. Agric. Food Chem. 2001, 49, 2788–2798. [Google Scholar] [CrossRef]
  51. Heimler, D.; Vignolini, P.; Isolani, L.; Arfaioli, P.; Ghiselli, L.; Romani, A. Polyphenol content of modern and old varieties of triticum aestivuml. And t. durum. Desf. grains in two years of production. J. Agric. Food Chem. 2010, 58, 7329–7334. [Google Scholar] [CrossRef] [PubMed]
  52. Martini, D.; Taddei, F.; Nicoletti, I.; Ciccoritti, R.; Corradini, D.; Degidio, M.G. Effects of genotype and environment on phenolic acids content and total antioxidant capacity in durum wheat. Cereal Chem. 2014, 91, 310–317. [Google Scholar] [CrossRef]
  53. Vagiri, M.; Ekholm, A.; Öberg, E.; Johansson, E.; Andersson, S.C.; Rumpunen, K. Phenols and ascorbic acid in black currants (Ribes nigrum L.): Variation due to genotype, location, and year. J. Agric. Food Chem. 2013, 61, 9298–9306. [Google Scholar] [CrossRef] [PubMed]
  54. Alghamdi, S.S.; Khan, A.M.; Ammar, M.H.; El-Harty, E.H.; Migdadi, H.M.; El-Khalik, S.M.A.; Al-Shameri, A.M.; Javed, M.M.; Al-Faifi, S.A. Phenological, nutritional and molecular diversity assessment among 35 introduced lentil (Lens culinaris Medik.) genotypes grown in Saudi Arabia. Int. J. Mol. Sci. 2014, 15, 277–295. [Google Scholar] [CrossRef] [PubMed] [Green Version]
Figure 1. Quantification of individual phenolic acids (A,C) and flavanols (B,D) in lentil seeds for genotypes (Samos, Dimitra, Elpida, Thessalia and 03-24L) and locations (DOM, Domokos; LAR, Larissa; THE, Thessaloniki; ORE, Orestiada; PET, Petrana; IPA, Ipato; SER, Serres; KOM, Komotini; ANI, Agioi Anargiri; ANA, Anatoliko) tested (Phenolic compounds: GA, gallic acid; PRCA, protocatechuic acid; VA, vanillic acid; 4HBA, 4-hydroxybenzoic acid; pCA, p-coumaric acid; CAT, catechin; CATG, catechin gallate; GCAT, gallocatechin; PCD, procyanidin dimer I; PCB2, procyanidin B2). Bars followed by the same letter in the same assay are not significantly different (p ≤ 0.05).
Agronomy 11 01154 g001
Figure 2. Quantification of tocopherols and carotenoids in lentil seeds for (A) genotypes (Samos, Dimitra, Elpida, Thessalia and 03-24L) and (B) locations (DOM, Domokos; LAR, Larissa; THE, Thessaloniki; ORE, Orestiada; PET, Petrana; IPA, Ipato; SER, Serres; KOM, Komotini; ANI, Agioi Anargiri; ANA, Anatoliko) tested. (αΤ, α-tocopherol; γΤ, γ-tocopherol; δΤ, δ-tocopherol; LUT, lutein; ZEA, zeaxanthin). Bars followed by the same letter in the same assay are not significantly different (p ≤ 0.05).
Agronomy 11 01154 g002
Figure 3. Score plot of lentil genotypes grown under ten different locations in 2019 and 2020 for phytochemical compounds (total phenolic content, total flavonoids content, total proanthocyanidins content, total hydrolyzed tannin content, phenolic acids, flavanols, tocopherols and carotenoids) and antioxidant activity as evaluated by ABTS, DPPH and FRAP methods (N = 150) by location codes (1, Domokos; 2, Larissa; 3, Thessaloniki; 4, Orestiada; 5, Petrana; 6, Ipato; 7, Patriki; 8, Komotini; 9, Ag. Anargiri; 10, Anatoliko).
Agronomy 11 01154 g003
Figure 4. Principal component analysis loading plots of the phytochemical variables (total phenolic content, total flavonoids content, total proanthocyanidins content, total hydrolyzed tannin content) and antioxidant activity as evaluated by ABTS, DPPH and FRAP methods of the lentil seeds grown under twenty different environments (N = 150), (A) in respect to year, (B) in respect to growing location per year and (C) in respect to genotype per year.
Agronomy 11 01154 g004aAgronomy 11 01154 g004b
Table 1. Pedoclimatic characteristics of the test locations.
LocationsLatitiude/
Longitude
AltitudeMT 1
(°C)
AP 2
(mm)
Soil
Type
pHOM 3
(%)
Domokos39°1′13″ N/22°19′74″ E50011.4625.4C/CL7.11.7
Ipato38°22′49″ N/23°22′11″ E11814.6704.1C/CL7.81.5
Orestiada41°30′14″ N/26°32′99″ E2612.6399.9C/SiCL7.51.7
Patriki40°53′90″ N/23°36′57″ E5013.7538.1C/CL8.01.3
Anatoliko39°36′81″ N/22°25′94″ E62410.6480.4C/CL7.21.3
Larissa39°36′81″ N/22°25′94″ E7714.3466.2C/C7.41.2
Ag. Anargiri39°29′89″ N/22°21′20″ E12114.1500.5C/CL7.41.5
Komotini41°5′31″ N/25°20′64″ E3213.8558.4C/SC8.11.3
Thessaloniki40°32′69″ N/22°59′83″ E514.2462.2CL/CL8.11.0
Petrana40°15′59″ N/21°52′70″ E47611.9476.6C/CL7.92.2
1 MT, 2-years mean temperature in the growing season (November to July); 2 AP, 2-years mean annual precipitation during the growing season (November to July); 3 OM, organic matter; C, clay; CL, clay-loam; SC, sandy clay; SiCL, silty clay loam.
Table 2. Variation in phytochemical components and antioxidant activity of (i) five lentil genotypes averaged across locations and years, (ii) ten locations averaged across genotypes and years.
TPCTFCTNCTPACABTSDPPHFRAP
Genotypes
Samos5.90 ± 0.50 b5.31 ± 1.12 a3.07 ± 0.72 b8.93 ± 2.30 a19.25 ± 2.61 b11.63 ± 1.23 bc12.10 ± 3.13 c
Dimitra5.66 ± 0.35 c4.77 ± 0.71 b2.96 ± 0.87 c7.76 ± 1.10 c18.47 ± 2.14 d11.19 ± 1.33 d12.12 ± 2.43 c
Elpida5.89 ± 0.50 b4.80 ± 0.57 b3.11 ± 1.02 b7.75 ± 0.98 c18.93 ± 1.67 c11.82 ± 1.40 b12.35 ± 1.92 b
Thessalia5.70 ± 0.62 c4.65 ± 0.77 c2.86 ± 1.09 d7.27 ± 1.69 d18.44 ± 2.37 d11.50 ± 1.56 c12.23 ± 2.22 bc
03-24L6.38 ± 0.44 a5.24 ± 0.65 a3.20 ± 1.04 a7.94 ± 1.42 b20.02 ± 1.84 a13.05 ± 1.60 a13.84 ± 2.54 a
Mean5.90 ± 0.504.95 ± 0.833.04 ± 0.967.93 ± 1.6619.03 ± 2.2211.82 ± 1.5512.53 ± 2.55
Locations
Domokos5.89 ± 0.506 bcd5.09 ± 0.74 a3.00 ± 0.98 bcd8.28 ± 0.94 ab18.50 ± 2.54 bc11.89 ± 1.87 bc12.71 ± 2.68 a–d
Larissa5.87 ± 0.42 bcd4.76 ± 0.90 cd3.13 ± 0.74 bc6.83 ± 1.30 d20.18 ± 3.20 a12.30 ± 1.52 ab13.12 ± 2.79 abc
Thes-niki6.19 ± 0.67 a5.31 ± 0.92 ab3.06 ± 1.00 bcd7.95 ± 1.43 abc18.61 ± 1.90 bc11.99 ± 1.04 bc12.91 ± 3.23 abc
Orestiada5.87 ± 0.52 cd4.34 ± 0.34 d3.44 ± 0.32 ab7.55 ± 0.87 bcd17.50 ± 1.41 c11.50 ± 1.08 c10.93 ± 1.92 d
Petrana6.12 ± 0.40 ab5.28 ± 1.13 ab2.99 ± 0.92 bcd8.46 ± 1.98 a20.65 ± 1.98 a13.05 ± 0.84 a14.04 ± 2.10 a
Ipato5.67 ± 0.85 cd4.66 ± 0.42 cd2.92 ± 0.99 bcd7.19 ± 0.72 cd19.75 ± 2.06 ab11.68 ± 2.33 bc12.72 ± 2.17 a–d
Patriki5.62 ± 0.37 d4.75 ± 0.45 cd2.67 ± 1.22 cd8.31 ± 1.50 ab18.44 ± 1.53 bc11.36 ± 1.45 cd12.02 ± 2.06 bcd
Komotini5.91 ± 0.40 abc4.87 ± 0.59 bc2.84 ± 0.99 bcd8.24 ± 1.30 ab18.56 ± 1.51 bc11.12 ± 1.29 cd12.15 ± 2.45 bcd
Ag. Anargiri5.80 ± 0.48 cd5.42 ± 1.14 a2.42 ± 0.89 d7.84 ± 3.18 abc19.62 ± 2.23 ab11.97 ± 0.20 bc13.28 ± 2.75 ab
Anatoliko6.10 ± 0.44 ab5.04 ± 0.64 abc3.98 ± 0.27 a8.65 ± 1.08 a18.39 ± 1.28 bc12.41 ± 0.24 ab11.36 ± 1.44 cd
Mean5.90 ± 0.554.95 ± 0.823.04 ± 0.967.93 ± 1.6519.02 ± 2.2211.83 ± 1.5612.53 ± 2.55
TPC, total phenolic content (mg GAE/g); TFC, total flavonoid content (mg CATE/g); TNC, total tannins content (mg GAE/g); TPAC, total proanthocyanidins content (mg PCBE/g); ABTS, 2,2′-azino-bis-(3-ethylbenzothiazoline-6-sulfonic acid) (mg TE/g); DPPH, 2,2-diphenyl-1-picrylhydrazyl radical scavenging ability (mg TE/g); FRAP, ferric reducing antioxidant activity (mg TE/g); Values in each column with different letters are significantly different p ≤ 0.05.
Table 3. Mean squares (SS) and percentage of the sum of the squares (%) for phytochemical components and antioxidant capacity (determined by DPPH, ABTS and FRAP methods) of five lentil genotypes evaluated across twenty environments (ten locations for two consecutive years) in Greece.
Genotype (G)Environment (E)G×EError
SS%SS%SS%SS%
Degree of Freedom4 19 76 200
Bioactive Components
TPC, mg GAE/g20.12218.62048.6534.15
TFC, mg CATE/g21.510101.34941.55385.43
TPAC, mg PCB/g89.911176.121539.36614.42
TNC, mg GAE/g4.22201.87366.5243.11
Phenolic acids, mg/100 g128.25617.1877.7345.12
Flavanols, mg/100 g10,929.82418,391.94115,013.333661.32
Tocopherols, μg/g5260.560873.3102306.226385.44
Carotenoids, μg/g1308.361474.723314.81526.31
*** *** ***
Antioxidant Capacity
ABTS102.17746.751562.83858.04
DPPH123.617162.022387.45353.88
FRAP133.171122.458663.73430.61
*** *** ***
TPC, total phenolic content; TFC, total flavonoid content; TNC, total tannins content; TPAC, total proanthocyanidins content; ABTS, 2,2′-azino-bis-(3-ethylbenzothiazoline-6-sulfonic acid); DPPH, 2,2-diphenyl-1-picrylhydrazyl radical scavenging ability; FRAP, ferric reducing antioxidant activity; *** all bioactive components and antioxidant activity values are significant across G, E and their interaction (G×E) at p ≤ 0.001.
Table 4. Correlation coefficients (r) of all phytochemical components studied and antioxidant capacity of lentils genotypes across ten locations for two growing years in Greece.
ParametersTPCTFCTPACTNCPasFosTsCarsABTSDPPHFRAP
TPC10.51 ***0.150.29 ***0.23 **0.18 *0.26 ***0.26 ***0.19 *0.46 ***0.41 ***
TFC 10.45 ***−0.140.35 ***0.150.34 ***0.22 **0.51 ***0.63 ***0.67 ***
TPAC 10.17 *0.49 ***0.27 ***0.26 ***−0.19 *0.110.25 **0.21 **
TNC 10.19 *−0.080.09−0.16 *−0.25 **0.05−0.33 **
Pas 10.59 ***0.20 *−0.21 **0.19 *0.28 ***0.05
Fos 10.16 *−0.15−0.00−0.050.01
Ts 10.35 ***0.21 *0.19 *0.23 **
Cars 10.23 **0.33 ***0.39 ***
ABTS 10.51 ***0.60 ***
DPPH 10.50 ***
FRAP 1
TPC, total phenolic content; TFC, total flavonoid content; TPAC, total proanthocyanidins; TNC, total tannins content; Pas, phenolic acids; Fos, flavanols; Ts, tocopherols; Cars, carotenoids; ABTS, 2,2′-azino-bis-(3-ethylbenzothiazoline-6-sulfonic acid); DPPH, 2,2-diphenyl-1-picrylhydrazyl radical scavenging ability; FRAP, ferric reducing antioxidant activity; *** indicates significant at p ≤ 0.001, ** at p ≤ 0.01 and * at p ≤ 0.05.
Publisher’s Note: MDPI stays neutral with regard to jurisdictional claims in published maps and institutional affiliations.

