Article

Analysis of the Viability of a Photovoltaic Greenhouse with Semi-Transparent Amorphous Silicon (a-Si) Glass

by
José-Ramón Aira
1,
Sara Gallardo-Saavedra
2,
Marcia Eugenio-Gozalbo
3,
Víctor Alonso-Gómez
4,
Miguel-Ángel Muñoz-García
5 and
Luis Hernández-Callejo
2,*
1
Department of Construction and Architectural Technology, Escuela Técnica Superior de Arquitectura, Universidad Politécnica de Madrid, Avda. Juan de Herrera 4, 28040 Madrid, Spain
2
Department of Agricultural and Forestry Engineering, Campus Duques de Soria, Universidad de Valladolid, 42004 Soria, Spain
3
Department of Didactics of Experimental, Social and Mathematical Sciences, Campus Universitario Duques de Soria, Universidad de Valladolid, 42004 Soria, Spain
4
Department of Applied Physics, Campus Universitario Duques de Soria, Universidad de Valladolid, 42004 Soria, Spain
5
Department of Agroforestry Engineering, Escuela Técnica Superior de Ingeniería Agronómica, Alimentaria y de Biosistemas, Universidad Politécnica de Madrid, Av. Puerta de Hierro 2, 28040 Madrid, Spain
*
Author to whom correspondence should be addressed.
Agronomy 2021, 11(6), 1097; https://doi.org/10.3390/agronomy11061097
Submission received: 24 March 2021 / Revised: 24 May 2021 / Accepted: 27 May 2021 / Published: 28 May 2021
(This article belongs to the Special Issue Photovoltaics and Electrification in Agriculture)

Abstract

:
For decades, society has been changing towards an energy mix that enhances the use of renewable sources and a more distributed generation of energy. The agricultural sector is included in this trend, which is why several studies are currently being carried out focused on the use of solar energy in greenhouses. This article aims to demonstrate the viability of a greenhouse that integrates, as a novelty, semi-transparent amorphous silicon photovoltaic (PV) glass (a-Si), covering the entire roof surface and the main sides of the greenhouse. The designed prototype is formed by a simple rectangular structure 12 m long and 2.5 m wide, with a monopitch roof, oriented to the southwest, and with a 35° inclination. The greenhouse is divided into two contiguous equal sections, each with an area of 15 m2, and physically separated by an interior partition transparent wall. The surface enclosure of one of the sections is made of conventional glass, and the one of the other, of PV glass. How the presence of semitransparent PV glass influences the growth of horticultural crops has been studied, finding that it slightly reduces the production of vegetal mass and accelerates the apical growth mechanism of heliophilic plants. However, from a statistical point of view, this influence is negligible, so it is concluded that the studied technology is viable for horticultural production. The energy balance carried out indicates that the energy produced by the PV system is greater than the energy consumed by the greenhouse, which shows that the greenhouse is completely viable and self-sufficient for sites with the adequate solar resource.

1. Introduction

Currently, most of the energy used in the world comes from fossil fuels [1]. The building sector is responsible for 40% of emissions of greenhouse gases and 38% of the global energy demand [2], mainly consumed for maintaining thermal comfort conditions [3].
The application of renewable energy technologies in buildings can effectively help reduce the consumption of fossil fuels and thus contribute to a more sustainable global energy model [4]. The goal of independence from fossil fuels makes most countries encourage renewable energy generation, thus, having a more diversified energy mix.
Among renewable energy generation technologies, solar photovoltaic (PV) is presented as one of the most interesting, since solar energy is available anywhere in the world [5]. Furthermore, it should be noted that in the last decade the cost of PV modules has fallen by more than 80%, while the cost of fossil fuels, such as gasoline or diesel, which compete with renewable energies in electricity generation, have increased more 250% [6]. This technology has been implemented progressively in materials and constructing structures, giving way to what today is known as integration of PV solar energy in buildings or building-integrated PV technology (BIPV) [7]. Combined with distributed generation (DG), breaking the paradigm of centralized generation (in which energy is generated away from consumption points), a very interesting BIPV concept is achieved, being the one proposed in this article.
The farming community is also aware of this change in the energy mix production, so many researchers are carrying out studies focused on the use of solar energy in agro-industrial buildings, and specifically in greenhouses. Thus, there are several studies focused specifically on the state of the art of solar energy applied in greenhouses [8,9,10]. Other research analyzes the influence of solar panel orientation and shading on electricity or horticultural production [11,12,13,14], or the way solar radiation is distributed indoors and its influence on horticultural production [15].
The overall cumulative radiation inside the greenhouse decreases depending on the coverage rate (PVR, or ratio of the horizontal surface of the greenhouse that is covered by solar panels placed on the roof) so that the reduction is equal to 0.8% for each 1% increase in PVR [16]. In a recent study, the most suitable PVR coverage ratio was analyzed according to the type of crop in 14 greenhouses in southern Europe [17]. The structures with a PVR of 25% were compatible with the cultivation of all the considered species, including those with a high light demand (tomato, cucumber, sweet pepper), with an estimated insignificant or limited yield reduction (less than 25%). Low light species (such as asparagus) and low light crops can be grown with a maximum PVR of up to 60%. Limiting the roof coverage with opaque solar panels has promoted numerous investigations in recent years on semitransparent PV cells in BIPV applications, particularly in greenhouses, forming a research line with increasing scientific interest [18,19,20,21], even with the implementation of organic PV cells [22,23,24].
Moreover, some crops require different light intensities depending on their vegetative cycle (during germination, flowering, the fruiting, etc.). Some research in recent years has focused on the use of PV panels that are capable of modifying their inclination to allow more or less light to enter the greenhouse [25,26,27].
This article aims to demonstrate the technical, economic and environmental feasibility of a greenhouse in which semi-transparent amorphous silicon (a-Si) PV glass panels are integrated on the entire surface of the roof, and of the main sides of the greenhouse (south west and northeast). How the greenhouse performs its horticultural production functions, while it recovers the electrical energy necessary to be able to supply the needs of the microgrid that makes it up, will be analyzed. These needs should be adjusted, at all times, to the climatic conditions of the site, trying to make sure that the demanded energy can be covered with the available PV DG, while trying to maintain horticultural production at optimal levels. As stated, this paper presents two novel points in relation to other related research. On the one hand, amorphous silicon semi-transparent glasses technology is used for power generation, which to our knowledge has never been used in greenhouses and on the other hand, photovoltaic glass is placed on the entire surface of the greenhouse, i.e., PVR of 100%.

2. Materials and Methods

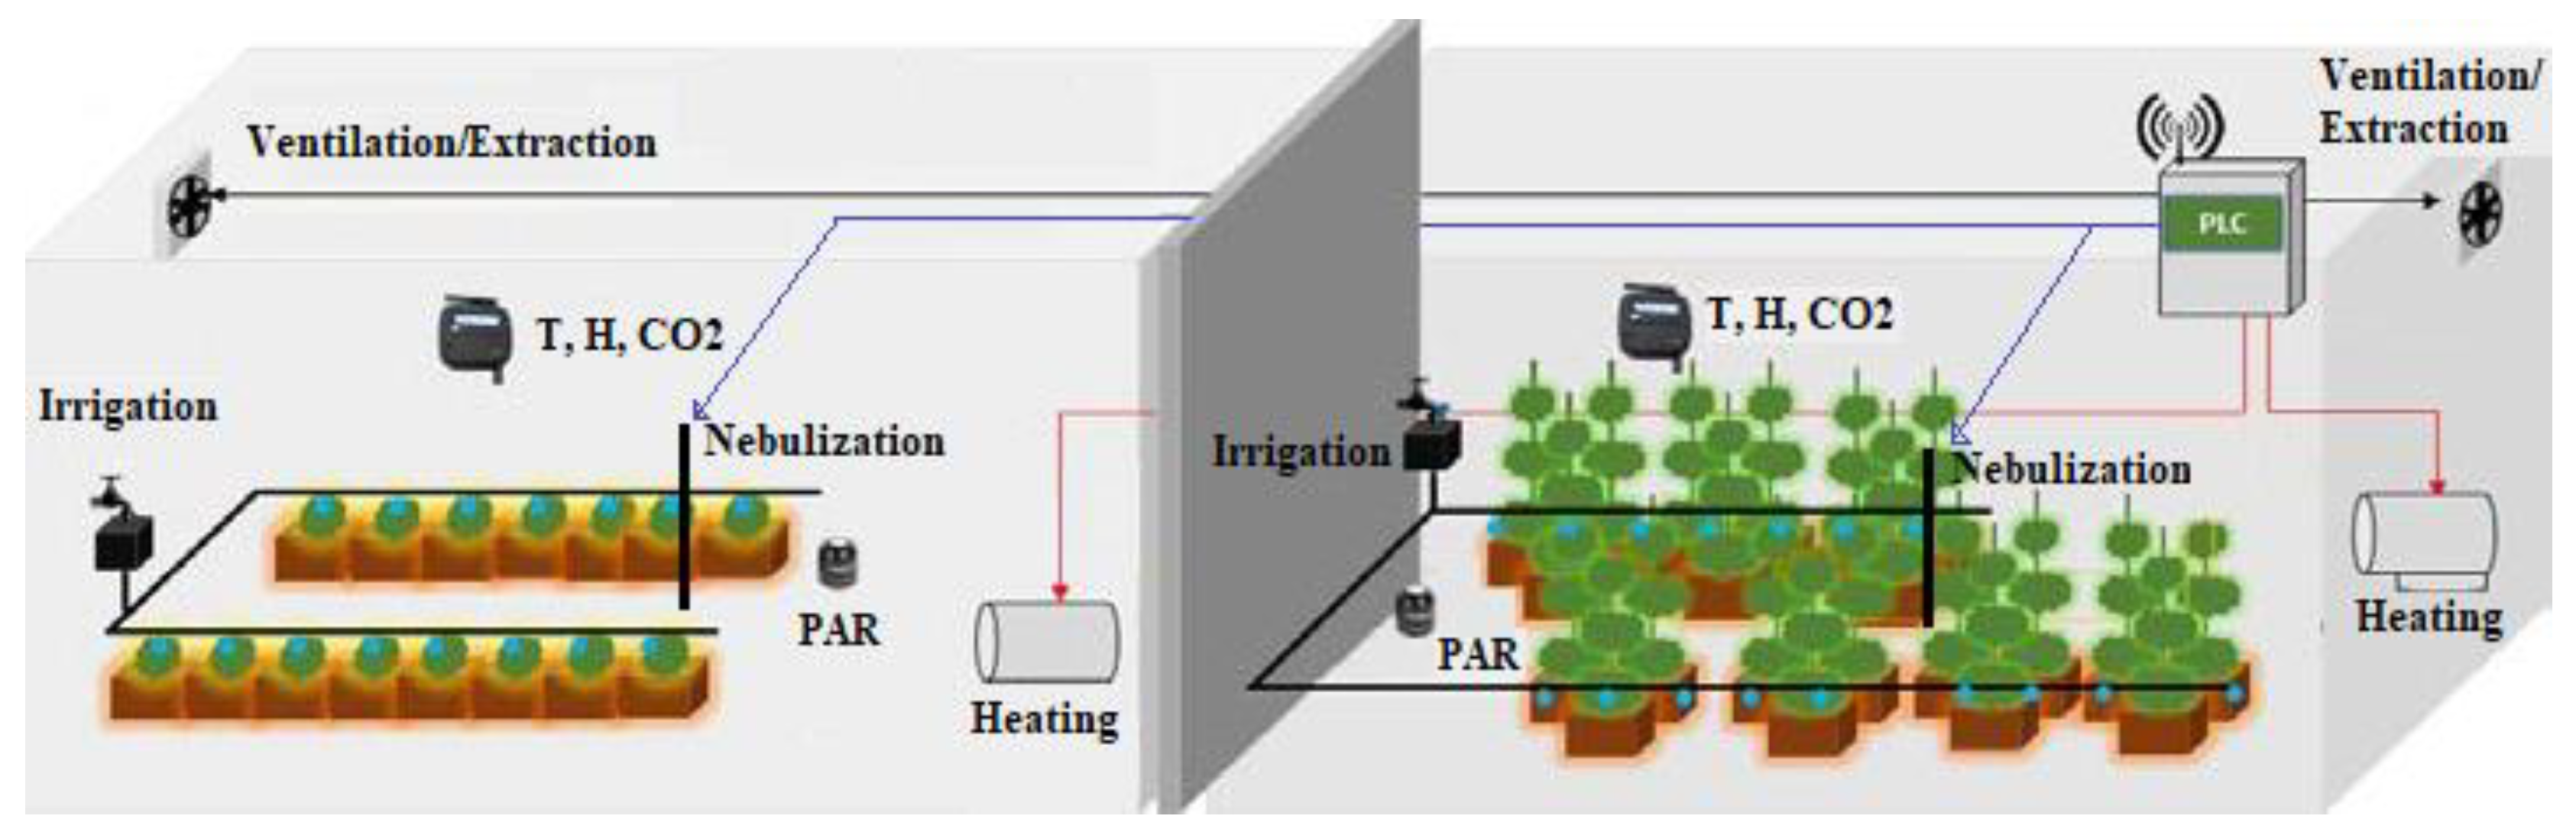
2.1. Prototype Description

The greenhouse prototype is formed by a simple rectangular structure with a length of 12 m and a width of 2.5 m, with a monopitch roof, oriented to the southwest, and with an inclination of 35°, with the objective of receiving the greatest solar radiation. The site is located at the European Center for the Training, Research and Development of Alternative Energies of the Campus Duques de Soria of the University of Valladolid (UVa). The elements of the structure are made of pine lumber Soria (Pinus sylvestris L.) with protective treatment for outdoor use without ground contact, Figure 1. Wood is a material in high demand today in sustainable construction because it acts as a sink for CO2, keeping it captured in its plant structures throughout the lifetime of the infrastructure [28].
The greenhouse is divided into two equal and contiguous sections, each with an area of 15 m2, physically separated by a transparent interior partition wall. The enclosure surface of the sections are made of conventional glass (not PV active) in one section, and PV amorphous silicon (a-Si) glass in the other. The dimensions, mechanical properties (strength and rigidity), and thermal (thermal transmittance) of conventional and PV glasses are similar, so that they do not interfere with the study. This partition has the purpose of being able to compare the horticultural production obtained in both sections in order to evaluate the viability of PV glasses. The PV glass chosen for the design was 034-BN-12450635-30-1, whose main characteristics are described in Table 1.
Initially the control parameters (temperature, relative humidity of the air and CO2 concentration) were determined. Sensors were installed for their monitoring, both inside and outside the greenhouse. A triple sensor (which measures these three parameters simultaneously) was placed outside the greenhouse, another triple sensor inside the greenhouse in the conventional glass section, and another triple sensor inside the PV glass section.
Depending on the desired type of cultivation, it is necessary that the control parameters remain within specific value ranges for optimal horticultural production. To modify and thus correct control parameters, the following actuators or control systems were installed: bidirectional fans to cause ventilation or extraction as required, heating to warm up, and nebulizers to produce water steam.
In addition, two more sensors were installed to measure PAR radiation inside the greenhouse, one in the conventional glass section and the other in the PV glass section; as well as a drip irrigation system in each section controlled by a clock which is totally independent of the installed sensors.
The electricity consumption is measured by three network analyzers, a general one to record the total consumption, including the consumption of the Programmable Logic Controller (PLC) and the data concentrator; and one for each of the greenhouse sections. Thus, each section contains the equipment shown in Figure 2:
  • Temperature, relative humidity and CO2 sensor.
  • PAR radiation sensor.
  • Fan to ventilate/extract.
  • Heater for warming up with a power of 1800 W.
  • 2-nozzle telescopic nebulizer.
  • Drip irrigation system.
  • Network analyzer for energy consumption analysis.
The modular monitoring system of the prototype consists of the following elements:
  • Power: power module made up of power supplies and transformers, responsible for feeding all the components of the system.
  • Sensors: room sensorization module.
  • Data concentrator: information storage module.
  • Wireless gateway: wireless communication module for receiving data from wireless sensors.
  • PLC: control module.
  • Actuators: module made up of the actuators or control elements of the system.
Figure 3 shows a summary block diagram of the monitoring system. The sensors communicate with the data concentrator through a wireless platform, while the actuators and the irrigation system do it directly by buried cable.
The main element of the control system is the PLC. This device is in charge of establishing the rules and sending orders to the actuators so that the control parameters are kept within the optimal value ranges for horticultural production. The control is based on threshold values of the parameters of control which should not be exceeded inside of the greenhouse: maximum temperature (Tmax), minimum temperature (Tmin) maximum relative humidity (Hmax), minimum relative humidity (Hmin) and minimum concentration of CO2 (CO2 min). In this way, the PLC receives information from the sensors, with a frequency of 1 min, and acts by sending commands to the actuators so that the control parameters do not exceed the previously programmed thresholds. These thresholds can be modified based on the real needs of each crop. Figure 4, Figure 5, Figure 6, Figure 7 and Figure 8 show the control loops that the PLC uses to determine the actions that must be performed.
Both the data concentrator and the PLC are housed in the same electrical control panel that also includes:
  • Protection against electrical overloads.
  • The system’s power supplies.
  • The power supply transformers of the solenoid valves.
  • Network analyzers.
  • The communication gateway with the wireless sensors.
  • Contactors to control the loads of the control system of both greenhouses.
  • Connectors for sensors.
  • Connectors for the actuators.
As previously detailed, three of the four sides of the PV greenhouse section are covered with PV glass: the southwest side of the greenhouse, the northeast side of the greenhouse and the roof. By having three PV production zones, the PV devices were grouped into three different arrays. The southwest façade (12° to the West from South) is made up of 15 vertical PV modules in an array of five columns and three rows with an installed power of 330 Wp. The northeast façade (12° to the East from North) is made up of 25 vertical modules in an array of five columns and five rows with an installed power of 550 Wp. The roof has a southwest orientation (12° to the West from South), it is composed of 20 modules inclined 35° (with respect to the terrain) in an array of five columns and four rows with an installed power of 440 Wp. In this way, the total power of the installation is 1320 Wp.
Figure 9 shows the configuration and interconnection of the three zones. For design reasons of the PV regulator, each glass is connected to its own fuse, to later make the appropriate groups according to the array. The diagram also shows the interconnection with the PV regulator, and from this device to the available electrical storage set (batteries). Two batteries are installed in series and two branches, of this association, in parallel. In this way, one has a 24 VDC bus, since each battery is 12 V, and C 100 is 250 Ah. Finally, an inverter is placed to feed the alternating loads, constituted by the consumption of the greenhouse itself.
The devices selected for this project have different technologies and therefore they generate different outputs. The MPC-374 data concentrator is capable of simultaneously acquiring signals from sensors that produce analog outputs, as well as from sensors that work under communication protocols. In the following Table 2, the inputs and outputs of the system devices are shown.
Digital sensors and network analyzers are connected to an RTU Modbus communication port, specifically to the UART2. The data is acquired by a physical RS485 interface. A client RTU Modbus is configured on this interface. The sensors are interrogated according to the standard set by this protocol. Actuators are connected to the analog outputs port of the MPC-374. It is a port formed by potential-free control outputs. These outputs reach the coil of each of the contactors that turn on/off the actuators as ordered by the PLC. The coils are attacked with 24 VDC. This turning on/off process is carried out according to the control rules programmed in the PLC. The nebulizers are managed directly by the digital output port included in the ILC-131 PLC.
As previously mentioned, drip irrigation is not part of the actuators. It is controlled directly by the discrete output port of the MPC-374, with an hourly programming time configured in the MPC-374.
Once the measurements of the sensors are stored in the MPC-374, they are already available to be interrogated by the PLC, SCADA or any software that makes the function of master of the Modbus network. The MP C-374, in addition to being able to be interrogated, has been configured to periodically send the information stored by FTP.
The relationship between the energy demanded from all devices of the greenhouse and the PV glass generation was studied at the end of the period of horticultural production by analyzing net balance, comparing energy consumption and actual production.

2.2. Type of Crop

The planting framework depends on the type of crop, and this, in turn, on whether the cycle is spring-summer or autumn-winter. In this project, the study period began on 18 October 2019, looking for an autumn-winter cycle in which lettuce (Lactuca sativa L.) and broad beans (Vicia faba L.) were planted. The study was concluded on 29 November 2019, coinciding with the collection of lettuces. The complete vegetative cycle of the broad beans had not ended by the time the study concluded, but the recorded growth measurements were sufficient to obtain the first results. Broad beans are common in the Mediterranean diet and are usually grown in greenhouses during the autumn-winter cycle. In addition, broad beans are very compatible with lettuces, so they are often grown together. However, as already stated the main aim of this research was to verify the feasibility of amorphous silicon semitransparent glass technology, rather than a study of the optimum type of crop.
Beans are considered crops improvers because their cultivation has the additional advantage of fixing atmospheric nitrogen in the soil when their roots are symbiotic with Rhizobium bacteria. Beans are best cultivated in mild climates. Temperatures above 30 °C, between flowering and fruit setting, can cause flowers and immature pods to fall off, increasing their hardness with the consequent loss of quality. They tolerate moderate frosts, and even strong ones of short duration, as long as they do not occur while in flower. Beans have no tendrils, or terminals or leaf, so they are not a branch plant, i.e., their angular and strong stems keep the plants upright without support. The cultivation is simple, without tutors or support, as long as one takes care that the long pods are not in contact with the ground.
Lettuces prefer uniform warm-temperate temperatures. The seeds do not germinate above 20 °C. Temperatures above 30 °C, during the period between flowering and fruit setting of the pods, can cause abortions of both flowers and immature pods, increasing their fibrosity. They are very sensitive to a lack of water, especially from flowering to pod filling. It is common to associate lettuce with other horticultural species, given its tolerance to shading and its rapid growth, which allows it to be cultivated among larger plants without significant competition for nutrients or causing other harmful effects.
As for the planting frame, a central corridor was set to allow passage and the manipulation of the plants. Beans seeds were spaced about 40 cm apart, as well as lettuce seedlings. To exploit to the maximum the available space, the quincunx schema shown in Figure 10 was created.
Considering the characteristics of both types of crops and to ensure optimal horticultural production, the following thresholds were programmed: Tmin = 10 °C, Tmax = 30 °C, Hmin = 50%, Hmax = 90%, CO2 min = 300 ppm.
After harvesting lettuces, about 1.5 months after planting, they were weighed to characterize the growth of both sections and to discern if there were any statistically significant differences between them.
The entire vegetative cycle of beans is much longer than that of lettuces, so it made more sense to monitor their growth rather than their plant production during the study period. Thus, the heights of the seedlings were periodically measured, making the first measurement on 25 October, and the subsequent ones on 6, 22 and 29 November 2019.

3. Results

In order to subsequently be able to study the behavior of the prototype during the growth of the crops, it was necessary to know the behavior and the relationship between the variables that were measured (T, H, CO2 and PAR) without the corrective action of the actuators (ventilation/extraction, heating and fogging), and without the presence of horticultural crops, that is, before planting. On the other hand, with a minute recording frequency, the amount of data that would be needed to be handle since the greenhouse implementation was immense. Therefore, two representative intervals were selected for data treatment, one before and one after planting. The interval before planting started on 27 August and finished 2 September 2019. The interval after planting started on 25 November and ended 29 November 2019.

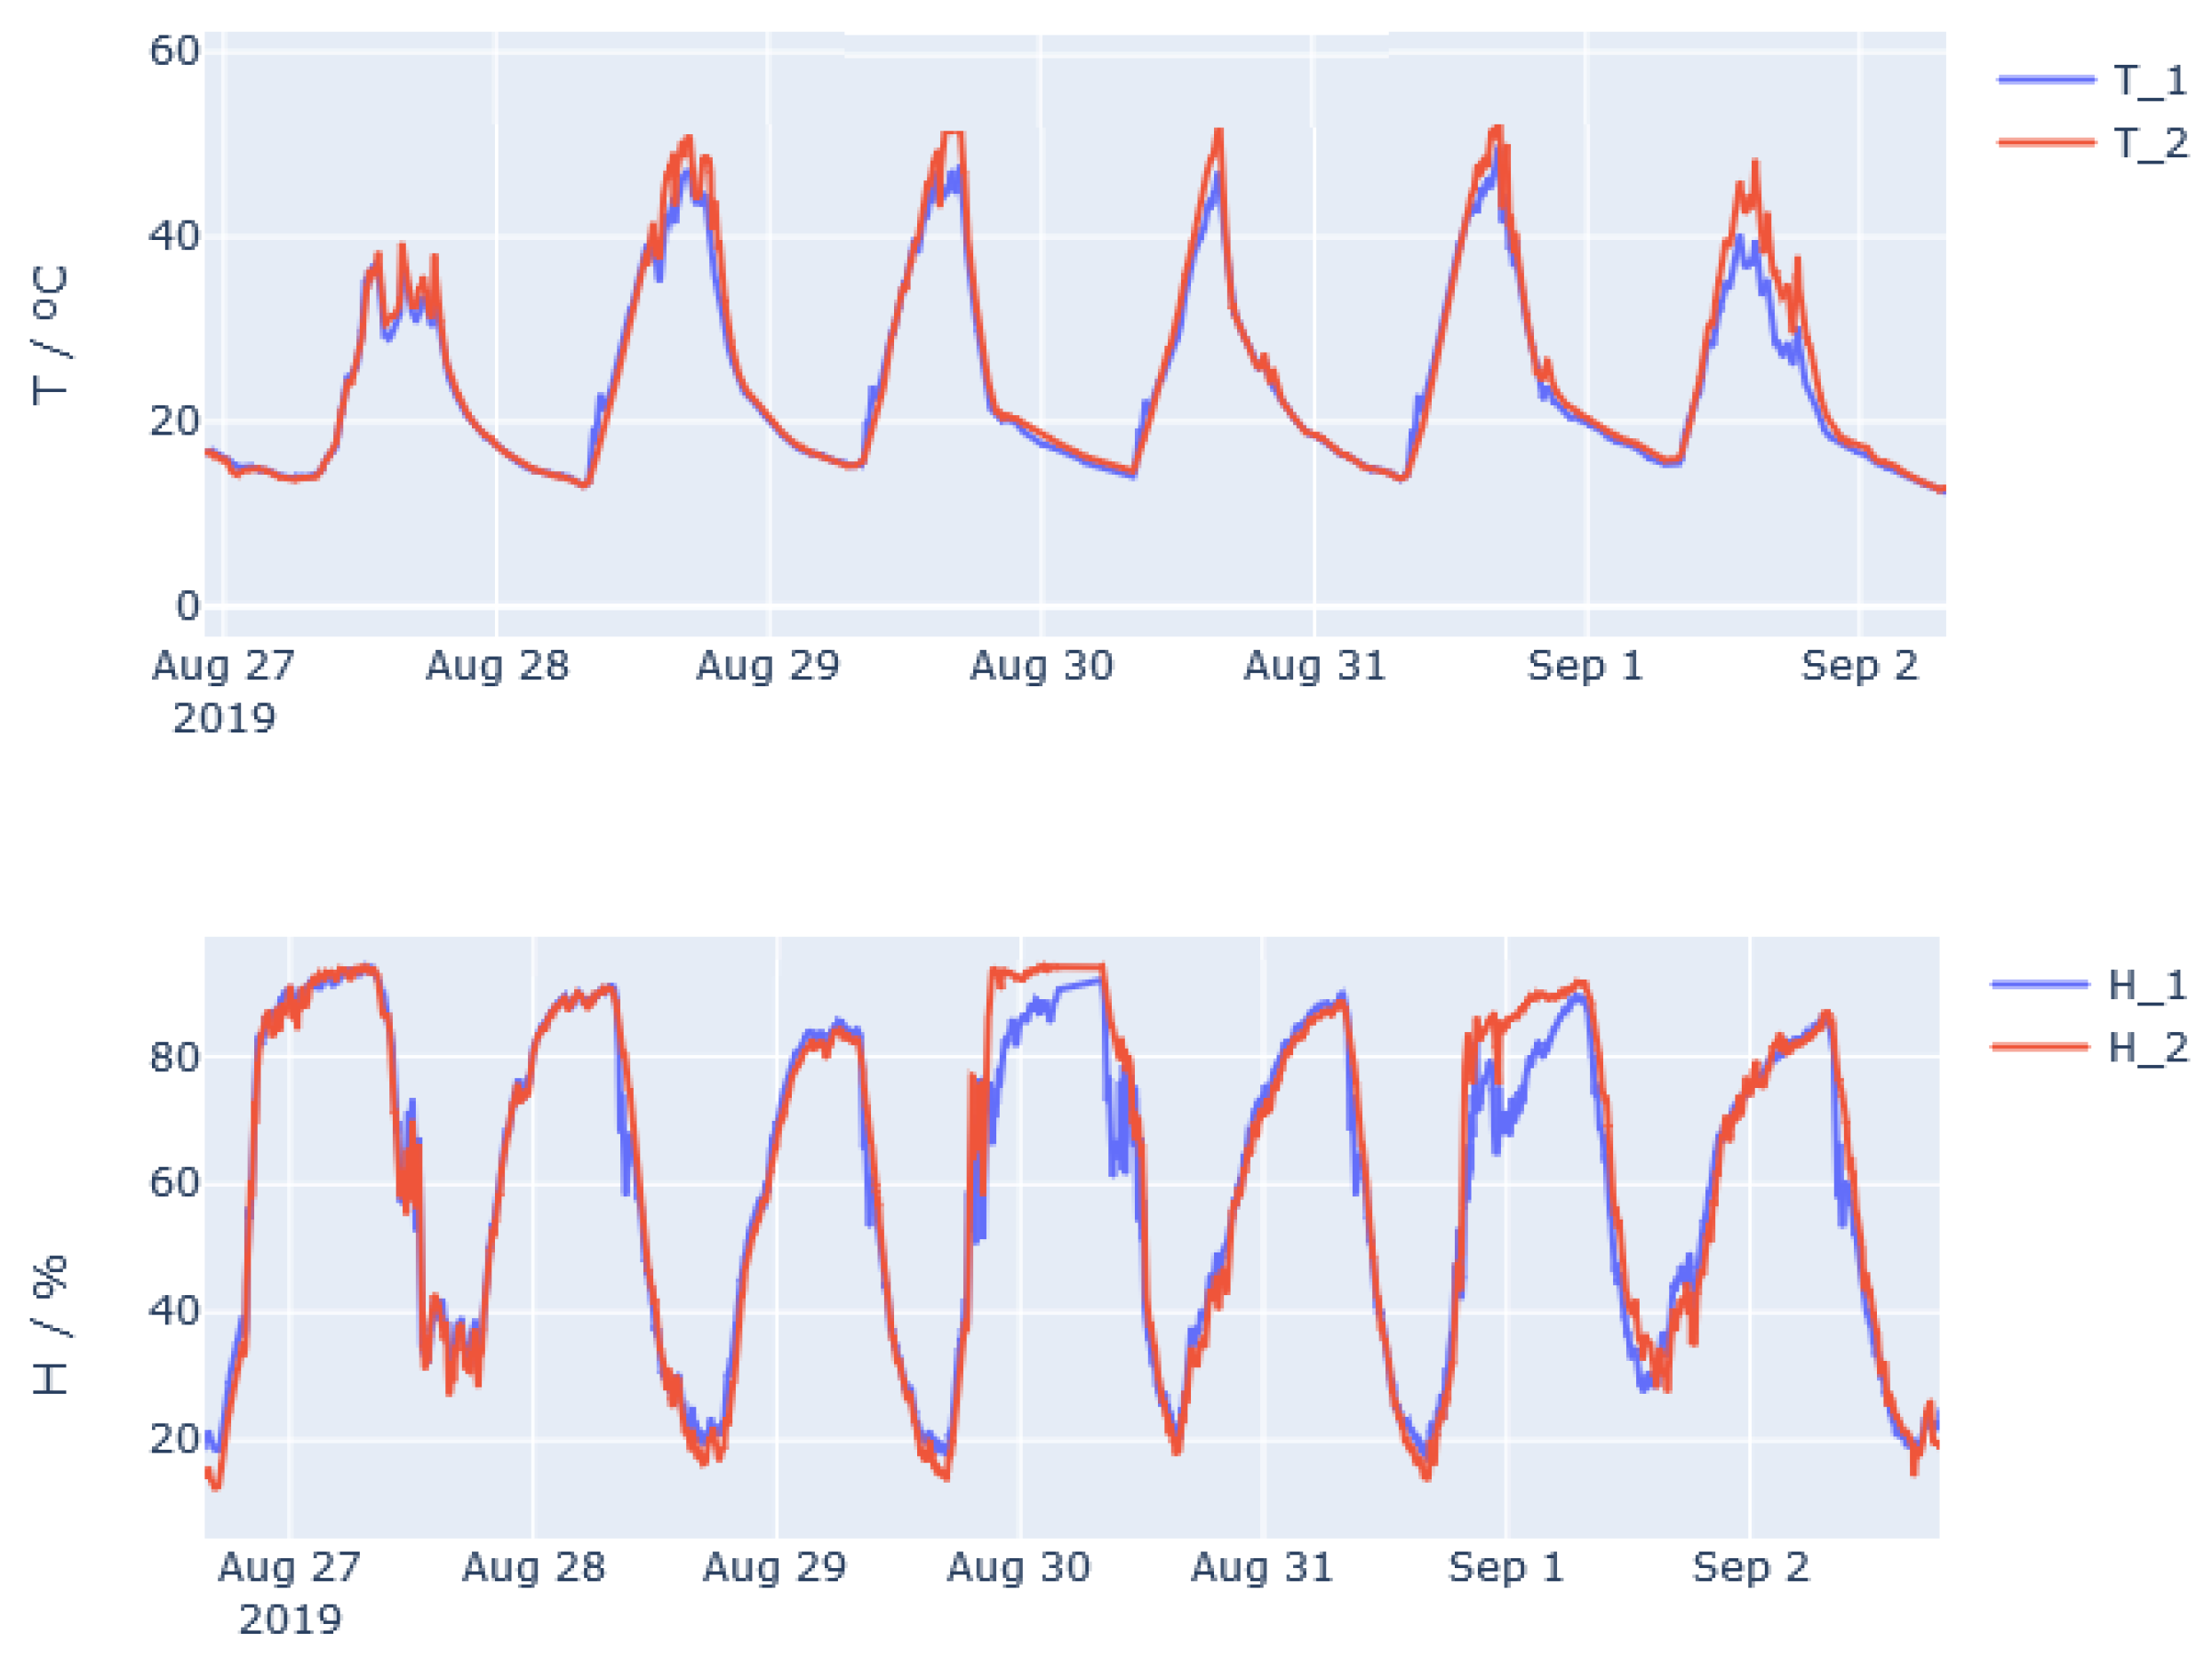
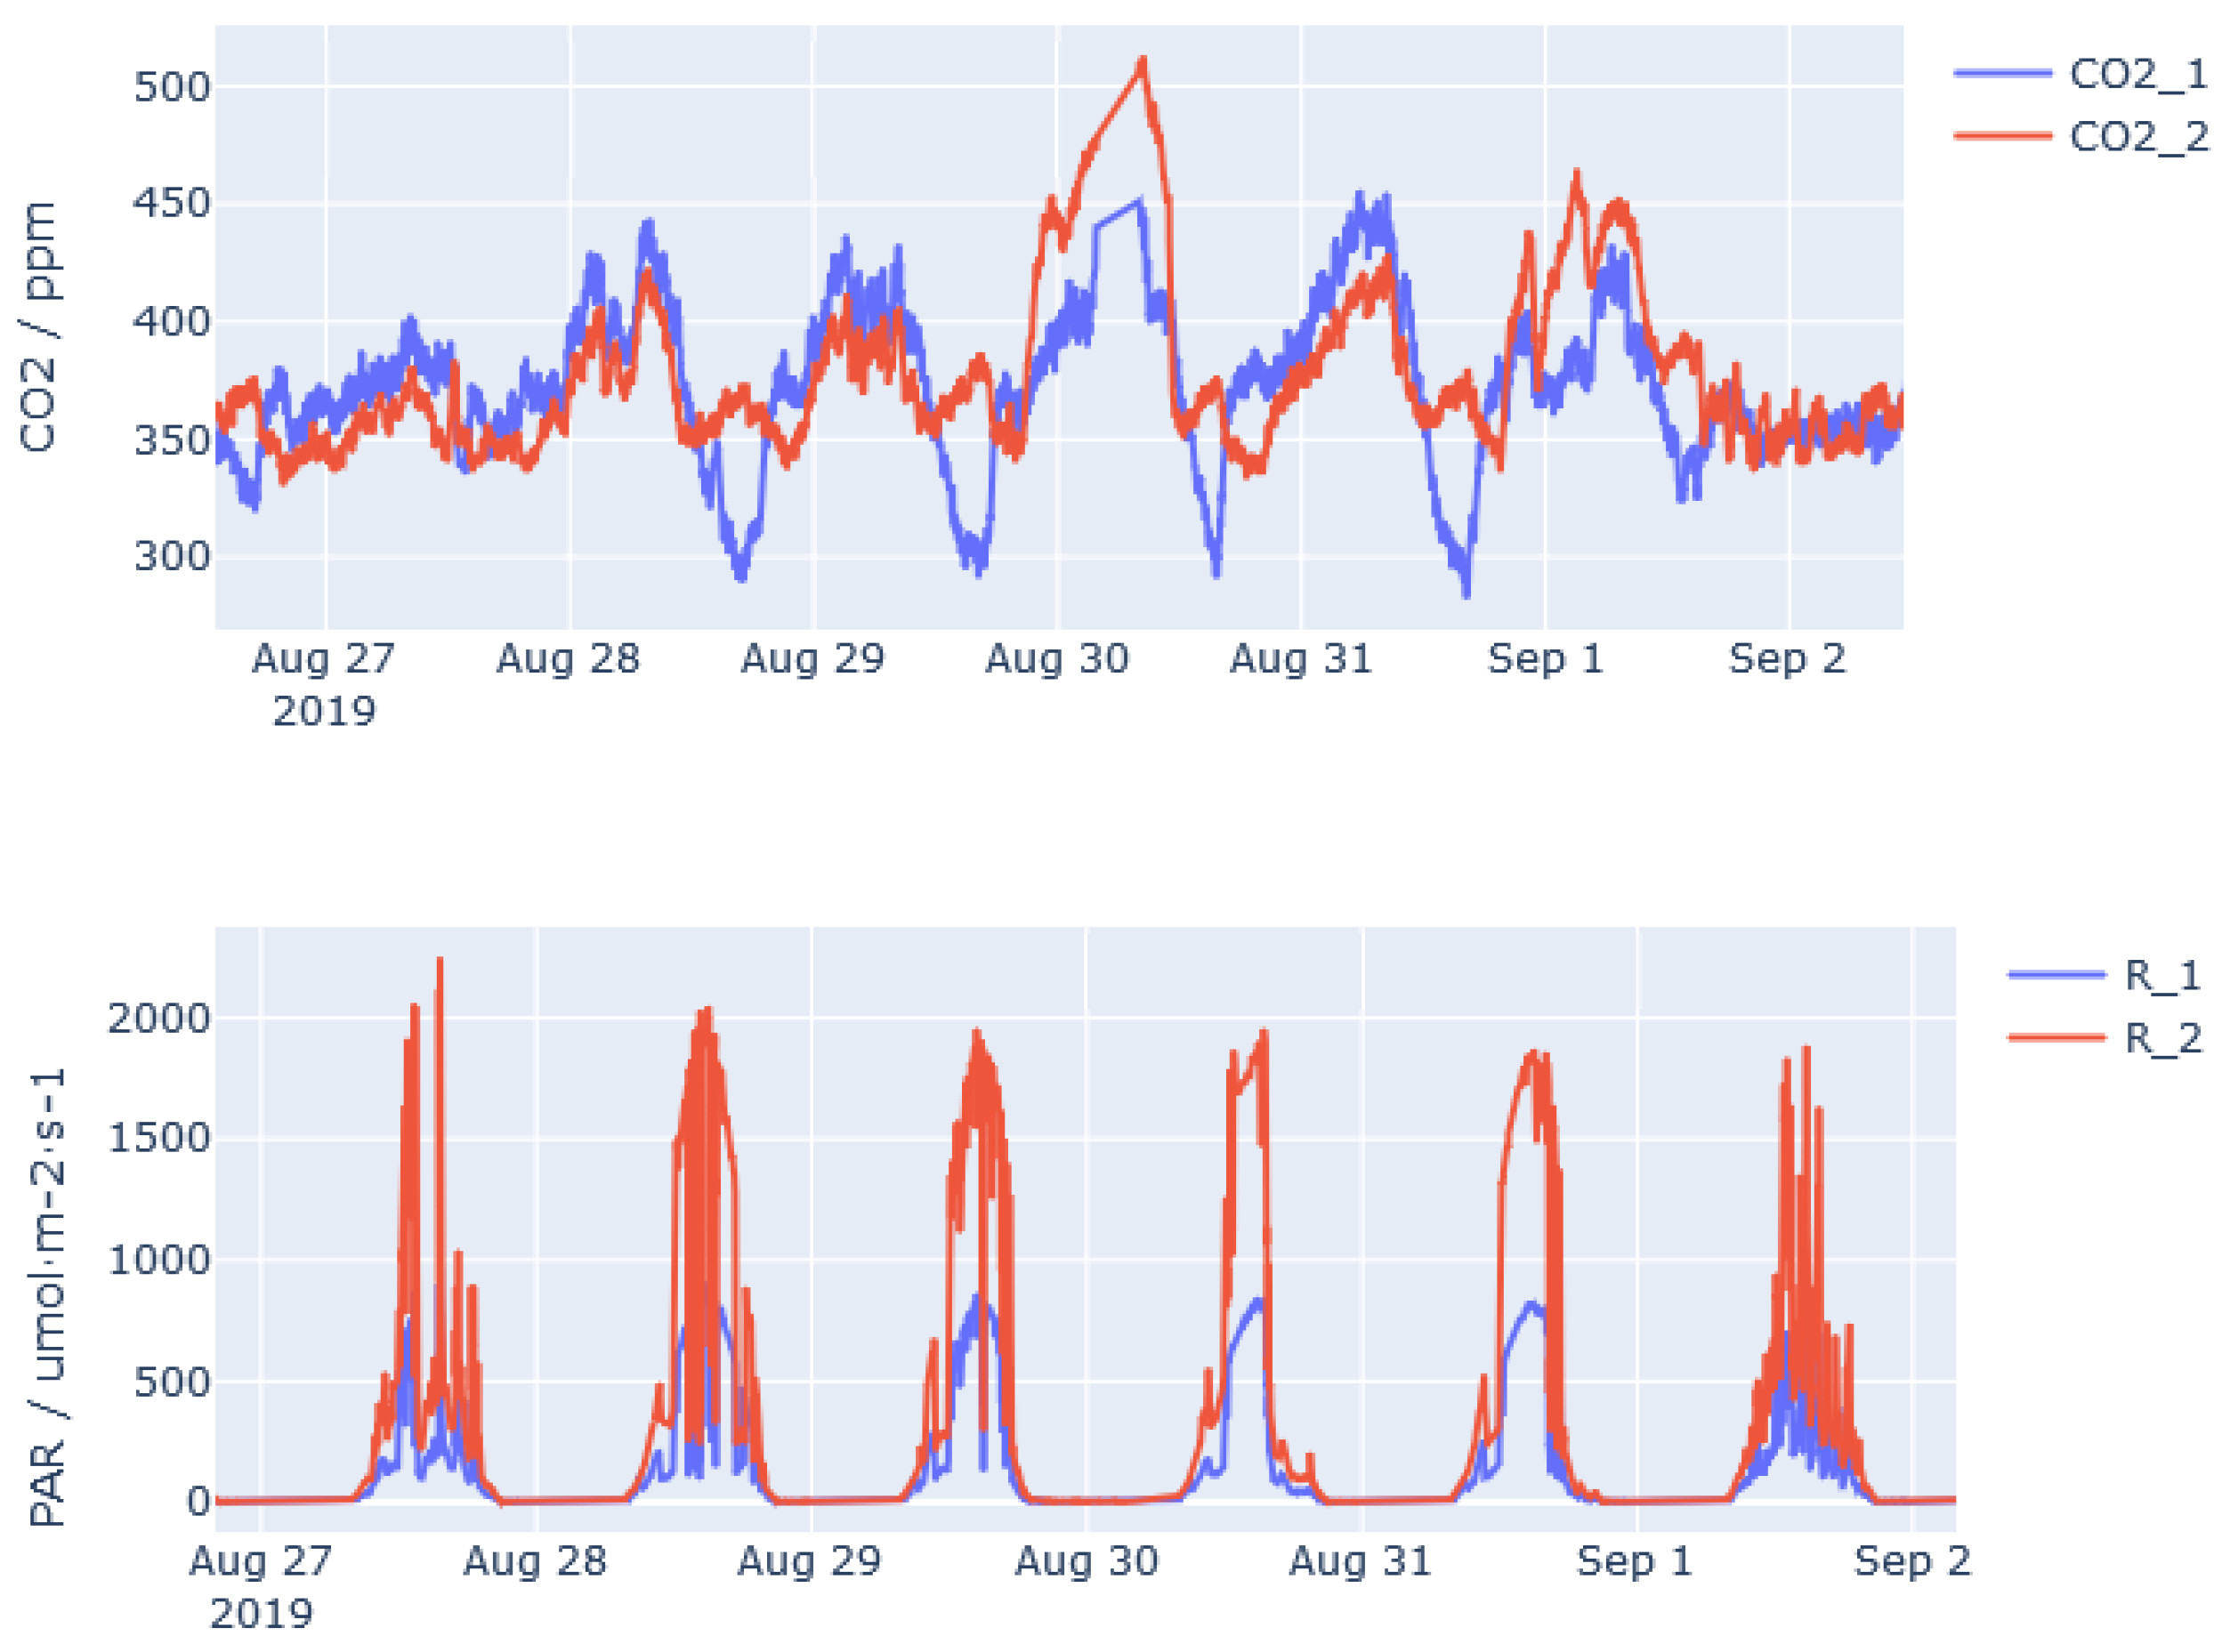
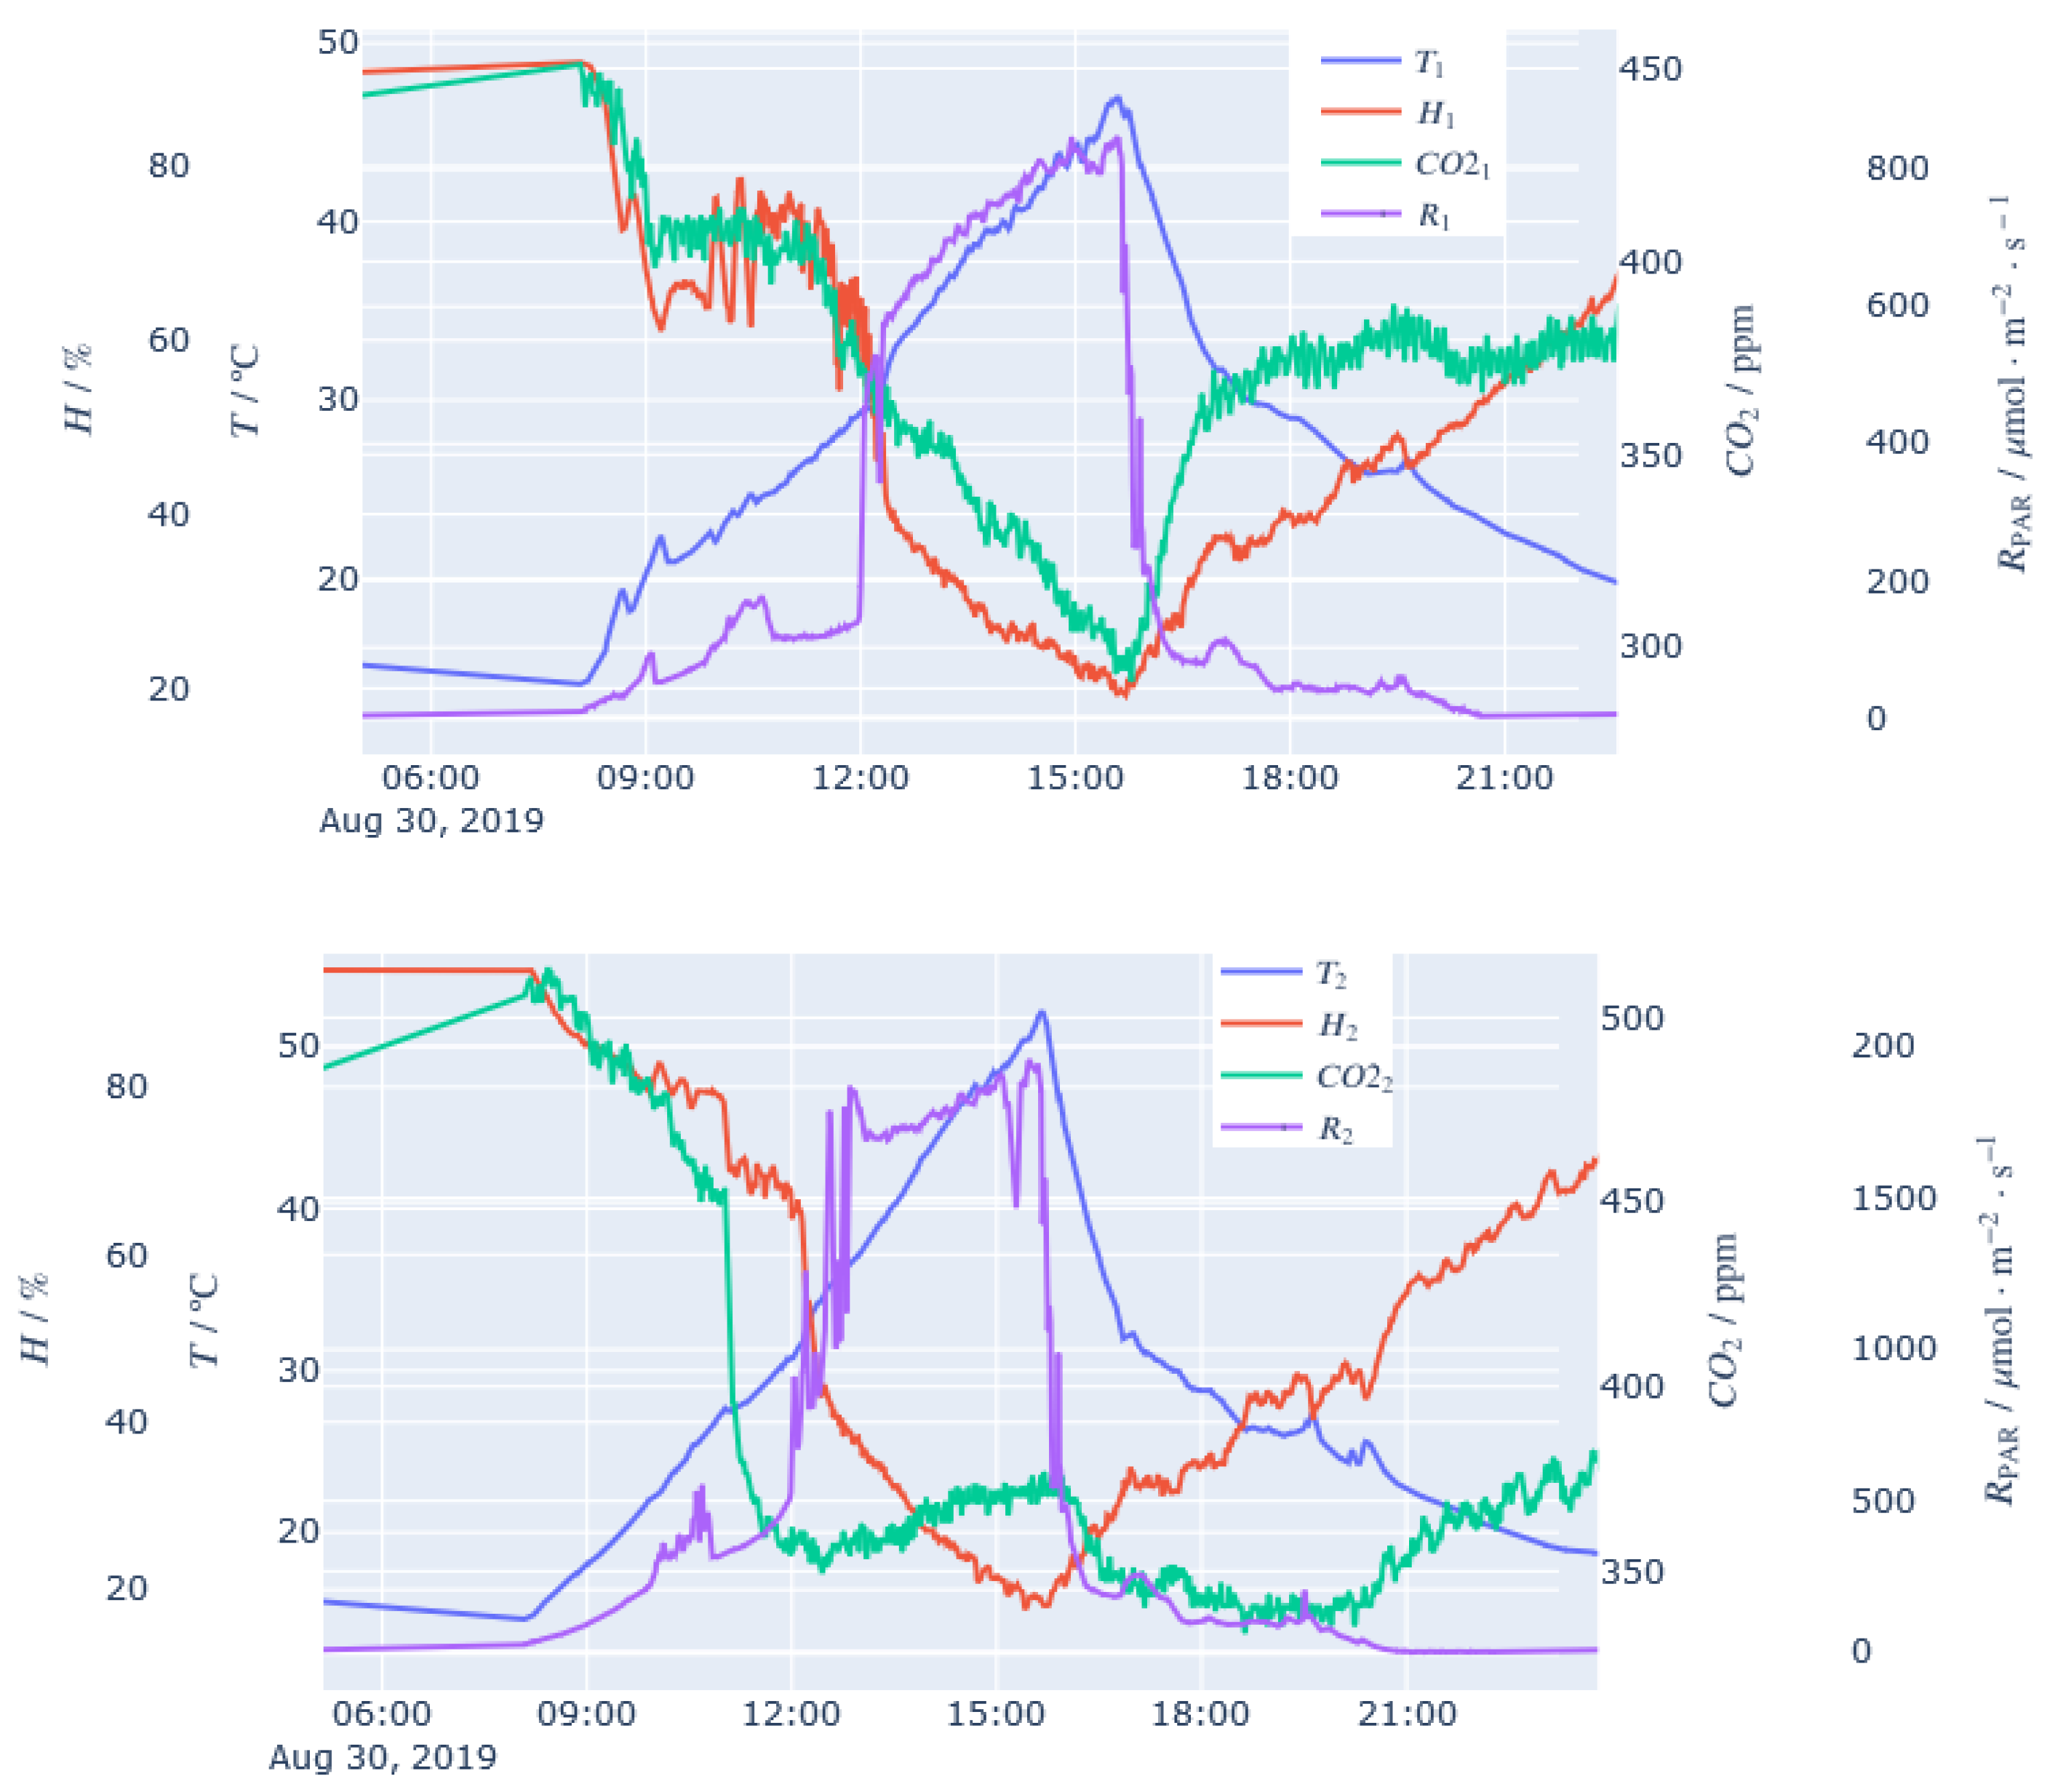
3.1. Monitoring Before Planting

The chosen interval corresponds to the course of warm days characterized, at this location, by reaching high temperatures and high radiation. Figure 11 shows the evolution of the control parameters and the PAR radiation, in both sections of the greenhouse. In the figure, 1 refers to the section with PV glass, and 2 to the conventional glass section.
It is observed how the section with PV glass slightly delays the increase in temperature and reaches slightly lower maximum values than the section with conventional glass. Other authors report similar results [29]. This fact is reasonable and desired since PV glass filters a large part of the solar radiation received, allowing less energy to pass into the greenhouse.
Considering that at higher temperature, absolute humidity in the air per unit volume is higher too, the relative humidity follows a reverse curve to that of the temperature, i.e., when the temperature is high, the relative humidity is minimum, and vice versa. The minima of relative humidity occur in the conventional glass section, a logical result because they coincide with the moments of maximum temperatures. Sudden changes in relative humidity are also observed, decreasing a lot during the day and increasing a lot overnight. This is due to the fact that inside the greenhouse there is almost no contribution or extraction of humidity, and the temperature also varies a lot, by up to 30 °C, between day and night.
Regarding the concentration of CO2, the evolution has displays a reasonable behavior. During the day, it is reduced due to the photosynthesis of some herbs that had grown spontaneously inside the greenhouse, and at night, it increases with their respiration process. It is curious that in the section with PV glass there were, in general, lower levels of CO2 during the day. This is due to the fact that a greater amount of spontaneous plant mass was developed due to the damping effect of PAR radiation and temperature, which are clearly excessive on those dates and in the chosen location.
PAR radiation is a more complex parameter to evaluate since the sensors are fixed and the Sun moves on the horizon throughout the day, varying the angle of incidence on the sensor. It can be seen that the PAR radiation that the PV glass let through is never greater than 50% of the PAR radiation present in the other section of the greenhouse. This data is consistent with the data provided by the manufacturer (30% transparency).
Figure 12 shows the evolution of the control parameters and PAR radiation on 30 August 2019, in both sections of the greenhouse. Of course, all the variables are related to each other and to the amount of radiation that penetrates the interior.
In both sections, logical behaviors of all variables are obtained. At night, with the abrupt cessation of radiation, the temperature decreases and the relative humidity and concentration of CO2 increase. At the beginning of the day, with the onset of radiation, the temperature rises while the relative humidity and CO2 decrease. However, it is observed how the CO2 concentration in the conventional glass section rises more slowly at night. This is because, as discussed above, in this section less herbs grew spontaneously due to the high values of radiation and temperature.

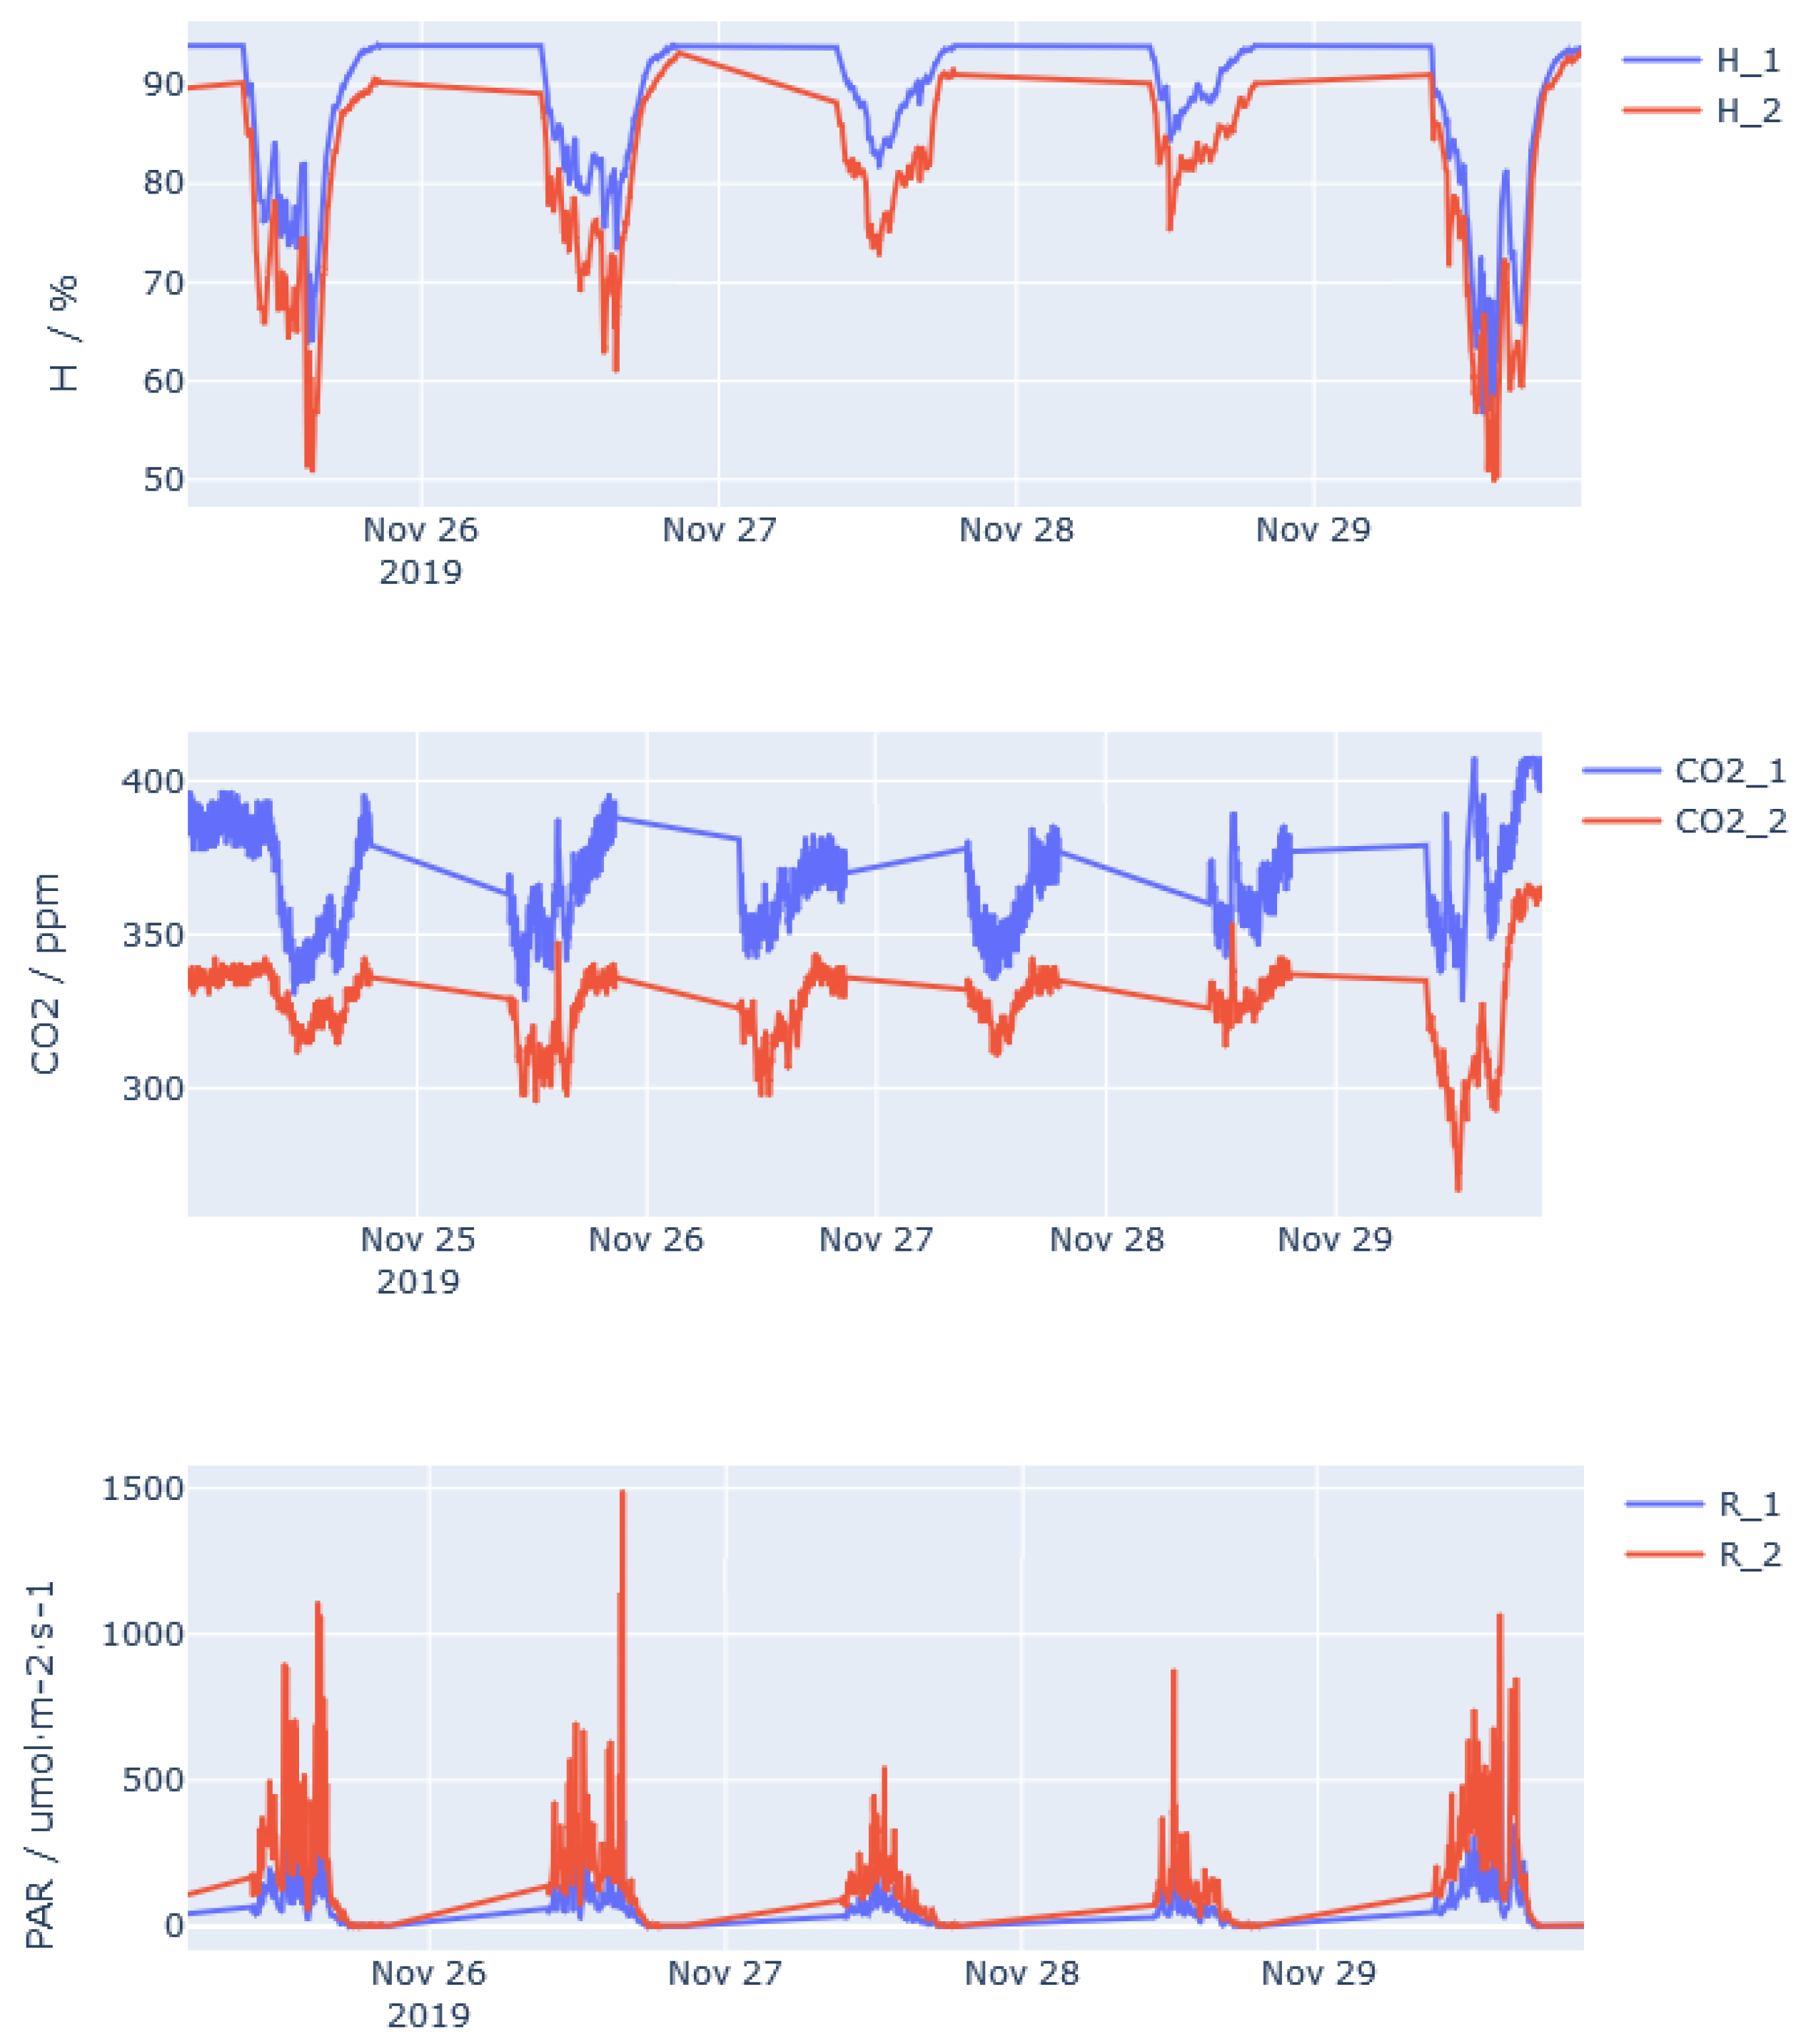
3.2. Monitoring After Planting

The chosen interval corresponds to the course of cold days characterized, in this location, by reaching low temperatures and moderate radiation. Figure 13 shows the evolution of the control parameters and PAR radiation in both sections of the greenhouse. The section with PV glass has been labelled as 1, and the section with conventional glass as 2.
It is seen that practically all the time the action of actuators maintains the temperature at values between 10 °C and 30 °C, the relative humidity between 50% and 90%, and the CO2 concentration above 300 ppm. This means that the programming of the PLC and its communication with the sensors and actuators is adequate.
The evolution of the temperature curves is practically the same in both sections of the greenhouse due to the temperature correction of the actuators, however, the relative humidity is constantly lower in the part with conventional glass, as in the CO2 concentration. The explanation, in both cases, must be found in the PAR radiation. It should be noted that the maximum radiation in this period of cold days is around half of that in the warm days period analyzed. This reduction in radiation, in intensity and duration, implies a significant reduction in the photosynthetic capacity of plants, which is why it is a limiting factor that should influence the behavior of the rest of the variables.
Obviously, PAR radiation is higher in the conventional glass section, especially during the central hours of the day. After receiving radiation, plants start the photosynthesis process using water absorbed by the roots and capturing the CO2, which they incorporate into their plant structures. Consequently, the higher the PAR radiation, the lower the CO2 concentration in the air.
However, the fact that the humidity is always lower in the conventional glass section does not have such an obvious immediate explanation. It is due to the effect of plant perspiration or loss of water in the form of water vapor. A large amount of water absorbed by the roots reaches the leaves, but only a small part is used in photosynthesis, the rest is lost through transpiration. The plants are being drip watered for their growth, in the same proportion in both sections of the greenhouse, so that the section with the least photosynthetic activity will also be the one that loses the most water through transpiration and, therefore, has the highest relative humidity in the air. As the section with PV glasses receives less PAR radiation, it will have lower photosynthetic activity and higher relative humidity.
Similarly, Figure 14 shows the evolution of the control parameters and PAR radiation on 26 November 2019, in both sections of the greenhouse. The same behavior pattern can be seen in both sections. CO2 and relative humidity increase at night, when radiation ceases. With the beginning of the day, they decrease again, while the temperature rises with the increase of radiation.

3.3. Horticultural Production

The average mass of the lettuce in the section with conventional glass (mean weight: 510.6 g, CoV: 0.24) was slightly higher than the average mass in the section with PV glass (weight mean: 423.6 g, CoV: 0.37). The mass of lettuces in both sections after harvesting are shown in Figure 15. This is a reasonable result because in the autumn-winter cycle dates there is not much Sun available and the reduced radiation can result in a lower photosynthetic capacity and, therefore, production of plant tissues. Although the difference in means seems significant, statistically it does not reach a value that allows us to affirm with a 95% probability that it is not due to mere chance.
Regarding the production of beans, in Table 3 the heights of the plants is measured vertically from the ground to the upper end thereof. In all measurements made it is observed that the plants are higher in the section with PV glass. It is also seen that the difference in height between both sections is increasing, due to an increase in the growth speed in the section with PV glass. This result is logical and it is a consequence of the lower amount of incident radiation. If not enough radiation is received, the natural survival mechanisms of the plant react as if there were a competition for light in the environment, giving priority to growth in height.
In research carried out by other authors on the growth of lettuces with semitransparent monocrystalline silicon PV panels that occupied 20% of the roof surface and that reduced radiation by 35–40%, similar results were obtained with the same level of significance (α = 0.05) [30]. In other studies carried out in southern China on the cultivation of tomatoes with integrated semi-transparent solar panels, it was determined that the reduction of radiation surface reduces the diameter and weight of the tomatoes produced, but not significantly. Furthermore, the tomato plants that were in the shaded area had a greater height and a greater number of leaves to compensate the loss of solar radiation, as well as a higher chlorophyll content [31].
Therefore, it is interesting to note that the crops, both lettuce and broad beans, have been able to develop correctly despite the fact part of the incident PAR radiation was subtracted, with part of the light being used for electricity generation.

3.4. Net Energy Balance

In addition to the environmental variables, the monitoring system also recorded the electrical variables related to the consumption of each of the sections separately, and of the sum of both plus the necessary consumption of the control panel electronics (PLC and data concentrator).
During the study period (18 October 2019–29 November 2019), the installed PV system produced 90.15 kWh. In the same period, the energy demanded by the PV section was 56.21 kWh, while the energy demanded by the complete installation was 133.07 kWh. Comparing the produced and the consumed energies, exclusively in the PV section, a positive net balance is obtained which means that PV panels are able to provide 100% of the energy demand. It shows, therefore, that the greenhouse is completely self-sufficient for the studied site. The energy balance also indicates that there is a surplus of excess energy (33.94 kWh), which means that it would not be necessary for the entire greenhouse surface to be covered by PV glasses.
This result is very interesting because in different systems analyzed by other researchers, where radiation was reduced by 35–40%, the PV installation was able to provide only 20% of the energy demanded by the greenhouse [30].

4. Discussion

The use of shading techniques is a very economical solution when trying to protect crops from excessive sunlight and reduce the temperature inside the greenhouse [30]. In research carried out in the south of Spain, with flexible integrated solar panels that covered 9.8% of the surface, the payback of the investment was calculated at 18 years [32]. In other research carried out in southern China, with integrated semi-transparent panels covering 20% of the surface, the payback was 9 years [31]. Based on the indicated references, the payback of investment for the semitransparent amorphous silicon (a-Si) panels, covering 100% of the surface of the roof and major sides of the greenhouse is attractive, which would make the implementation of this technology in those sites with sufficient resources feasible.
The semitransparent PV cell devices provide good light conditions for photosynthesis and plant growth [33]. However, depending on the type of crop, the vegetative period in which it is found, the location or the time of year, the shading caused by semi-transparent glasses can be beneficial or detrimental to horticultural development. The shade used in this article may be a more suitable solution to crops that do not have high solar radiation requirements (leaf crops: lettuce, chard, endive or spinach; root crops: beet, carrot, celery, leek or radish; crop fruits: broad bean, pea or strawberry; aromatic crops: mint, spearmint or parsley). However, it must be taken into account that when working with living beings the data has a lot of variability even within the same section of the greenhouse. For this reason, it is important to continue the investigation, collecting more data from different crops and in different cycles, in order to draw more relevant conclusions. The authors expect to analyze different crop types and cycles with this technology in subsequent studies.
On the other hand, the analysis of the transmittance of PV glass as a function of the wavelength constitutes a key field of research for the plants’ growth, depending on whether or not the maximum absorption coincides with the wavelengths at which the photosynthetic molecules absorb the most. Thus, depending on the plant species, there are different photosynthetic molecules, which have different absorption spectra for the conversion of sunlight photons into the generation of organic matter.

5. Conclusions

BIPV applied to horticultural production constitutes a research and development completely in line with the latest trends in sustainable building, which advocate the incorporation of urban gardens in the building for the consumption of unprocessed ecological products.
The PV glass semitransparent amorphous silicon (a-Si) placement, covering the whole surface of the roof (PVR of 100%) and of the main sides of the greenhouse, influences the growth of horticultural crops, slightly reducing the biomass production of the plants and accelerating the apical growth mechanism of heliophilic plants. However, from a statistical point of view, this influence is negligible so the studied technology is viable for horticultural production. Nevertheless, to obtain results with a greater scope and practical application, it is necessary to extend the study to other crops and growing seasons.
The energy balance carried out indicates that the energy produced by the PV section is greater than the energy demand, which shows that the greenhouse is completely viable and self-sufficient when installed at a site with the adequate solar resource.

Author Contributions

Conceptualization, J.-R.A. and L.H.-C.; methodology, J.-R.A., L.H.-C., S.G.-S., M.E.-G., V.A.-G. and M.-Á.M.-G.; software, V.A.-G.; validation, L.H.-C. and M.E.-G.; formal analysis, M.E.-G. and V.A.-G.; investigation, J.-R.A., L.H.-C., S.G.-S., M.E.-G., V.A.-G. and M.-Á.M.-G.; resources, J.-R.A., L.H.-C. and M.-Á.M.-G.; data curation, M.E.-G. and V.A.-G.; writing—original draft preparation, L.H.-C., S.G.-S. and V.A.-G.; writing—review and editing, J.-R.A., S.G.-S. and L.H.-C.; visualization, L.H.-C., M.E.-G. and M.-Á.M.-G.; supervision, J.-R.A. and L.H.-C.; project administration, L.H.-C.; funding acquisition, L.H.-C. and M.-Á.M.-G. All authors have read and agreed to the published version of the manuscript.

Funding

The project “Aplicación de la tecnología fotovoltaica integrada en edificios (BIPV) para invernaderos agrícolas” with file number 04/16/AV/0001 has been carried out within the framework of the “Proyectos de I + D en PYMES” program. This project has been funded by the Fondo Europeo de Desarrollo Regional (FEDER) of the European Union and the Junta de Castilla y León, through the Institute for Business Competitiveness of Castilla y León (ICE), with the aim of promoting research, technological development and innovation. The project has been led by Onyx Solar and the UVa has participated in this project.

Institutional Review Board Statement

Not applicable.

Informed Consent Statement

Not applicable.

Data Availability Statement

Confidential data.

Acknowledgments

Authors thank the company Onyx Solar Energy SL. The financing of this project.

Conflicts of Interest

The authors declare no conflict of interest. The funders had no role in the design of the study; in the collection, analyses, or interpretation of data; in the writing of the manuscript, or in the decision to publish the results.

Abbreviations

a-Siamorphous silicon.
BIPVbuilding-integrated photovoltaic technology.
CO2 extoutdoor CO2 concentration.
CO2 intindoor CO2 concentration.
CO2 min.minimum CO2 concentration.
DCdirect current.
DGdistributed generation.
FTPfile transfer protocol.
Hextoutdoor air humidity.
Hintindoor air humidity.
Hmaxmaximum air humidity.
Hminminimum air humidity.
MPPTmaximum power point tracker.
PARphotosynthetically active radiation.
PLCprogrammable logic controller.
PVphotovoltaic.
PVRratio of horizontal surface covered by solar panels placed on the roof.
SCADAsupervisory control and data acquisition.
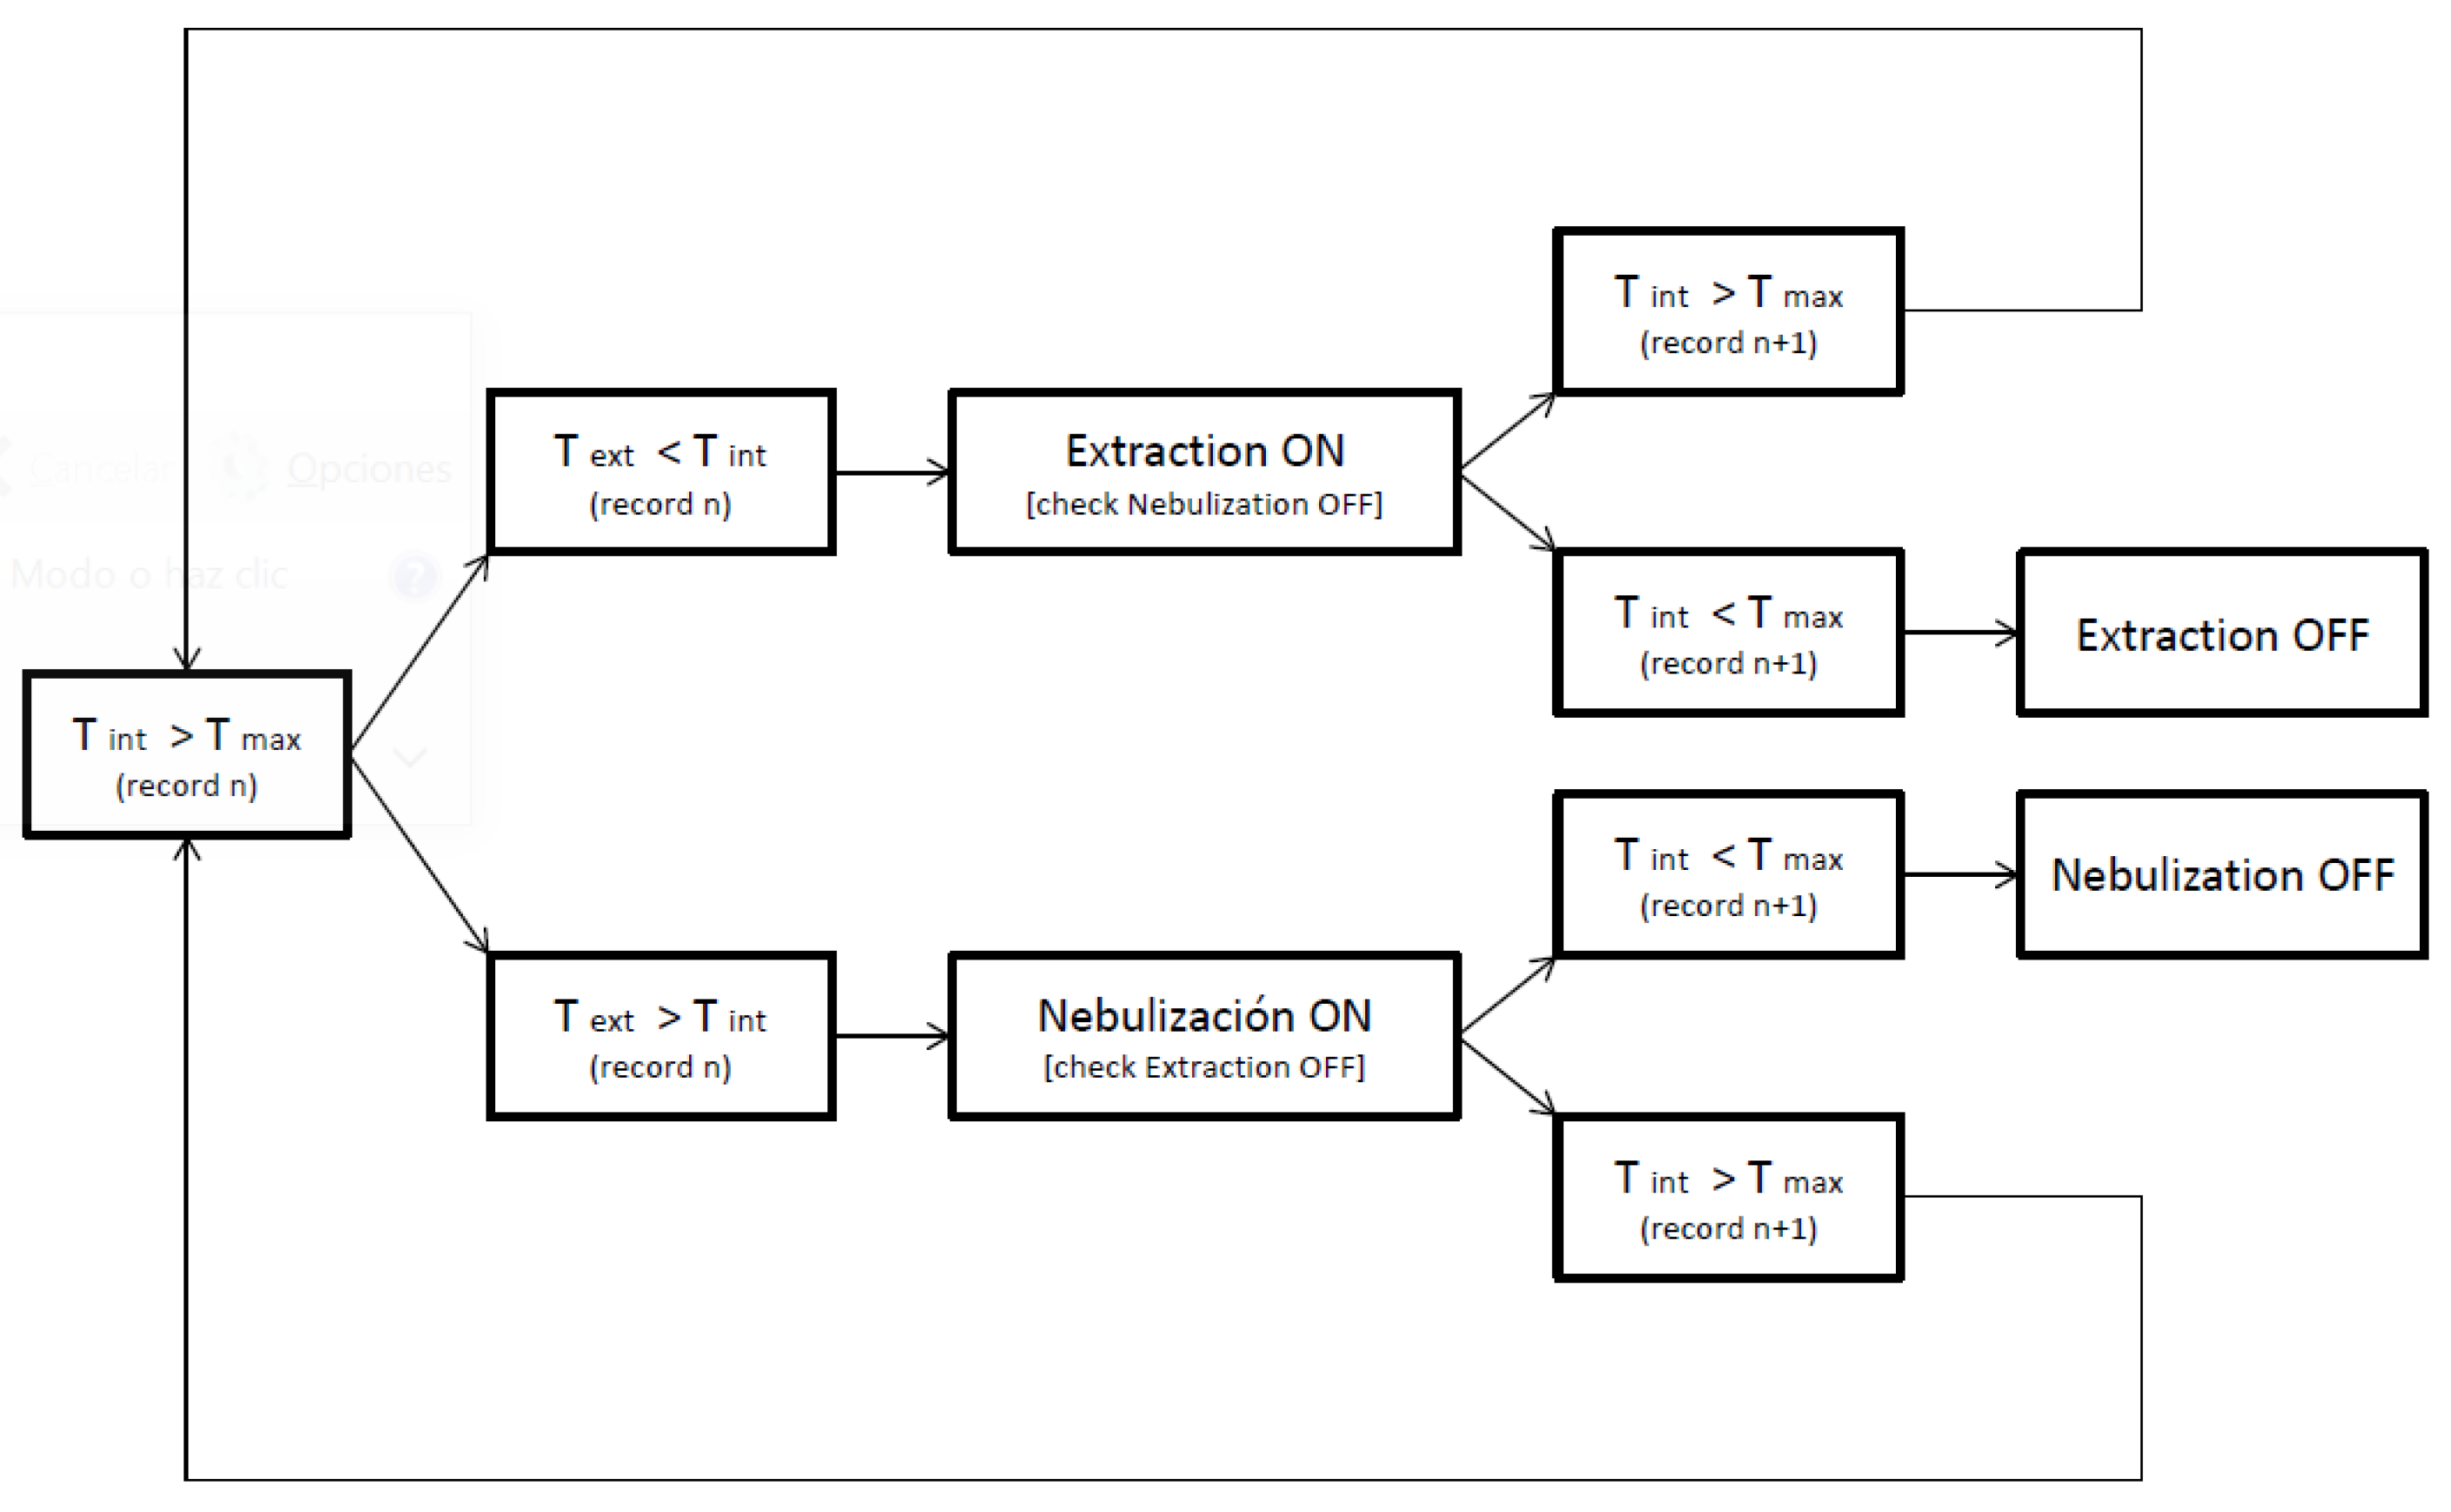
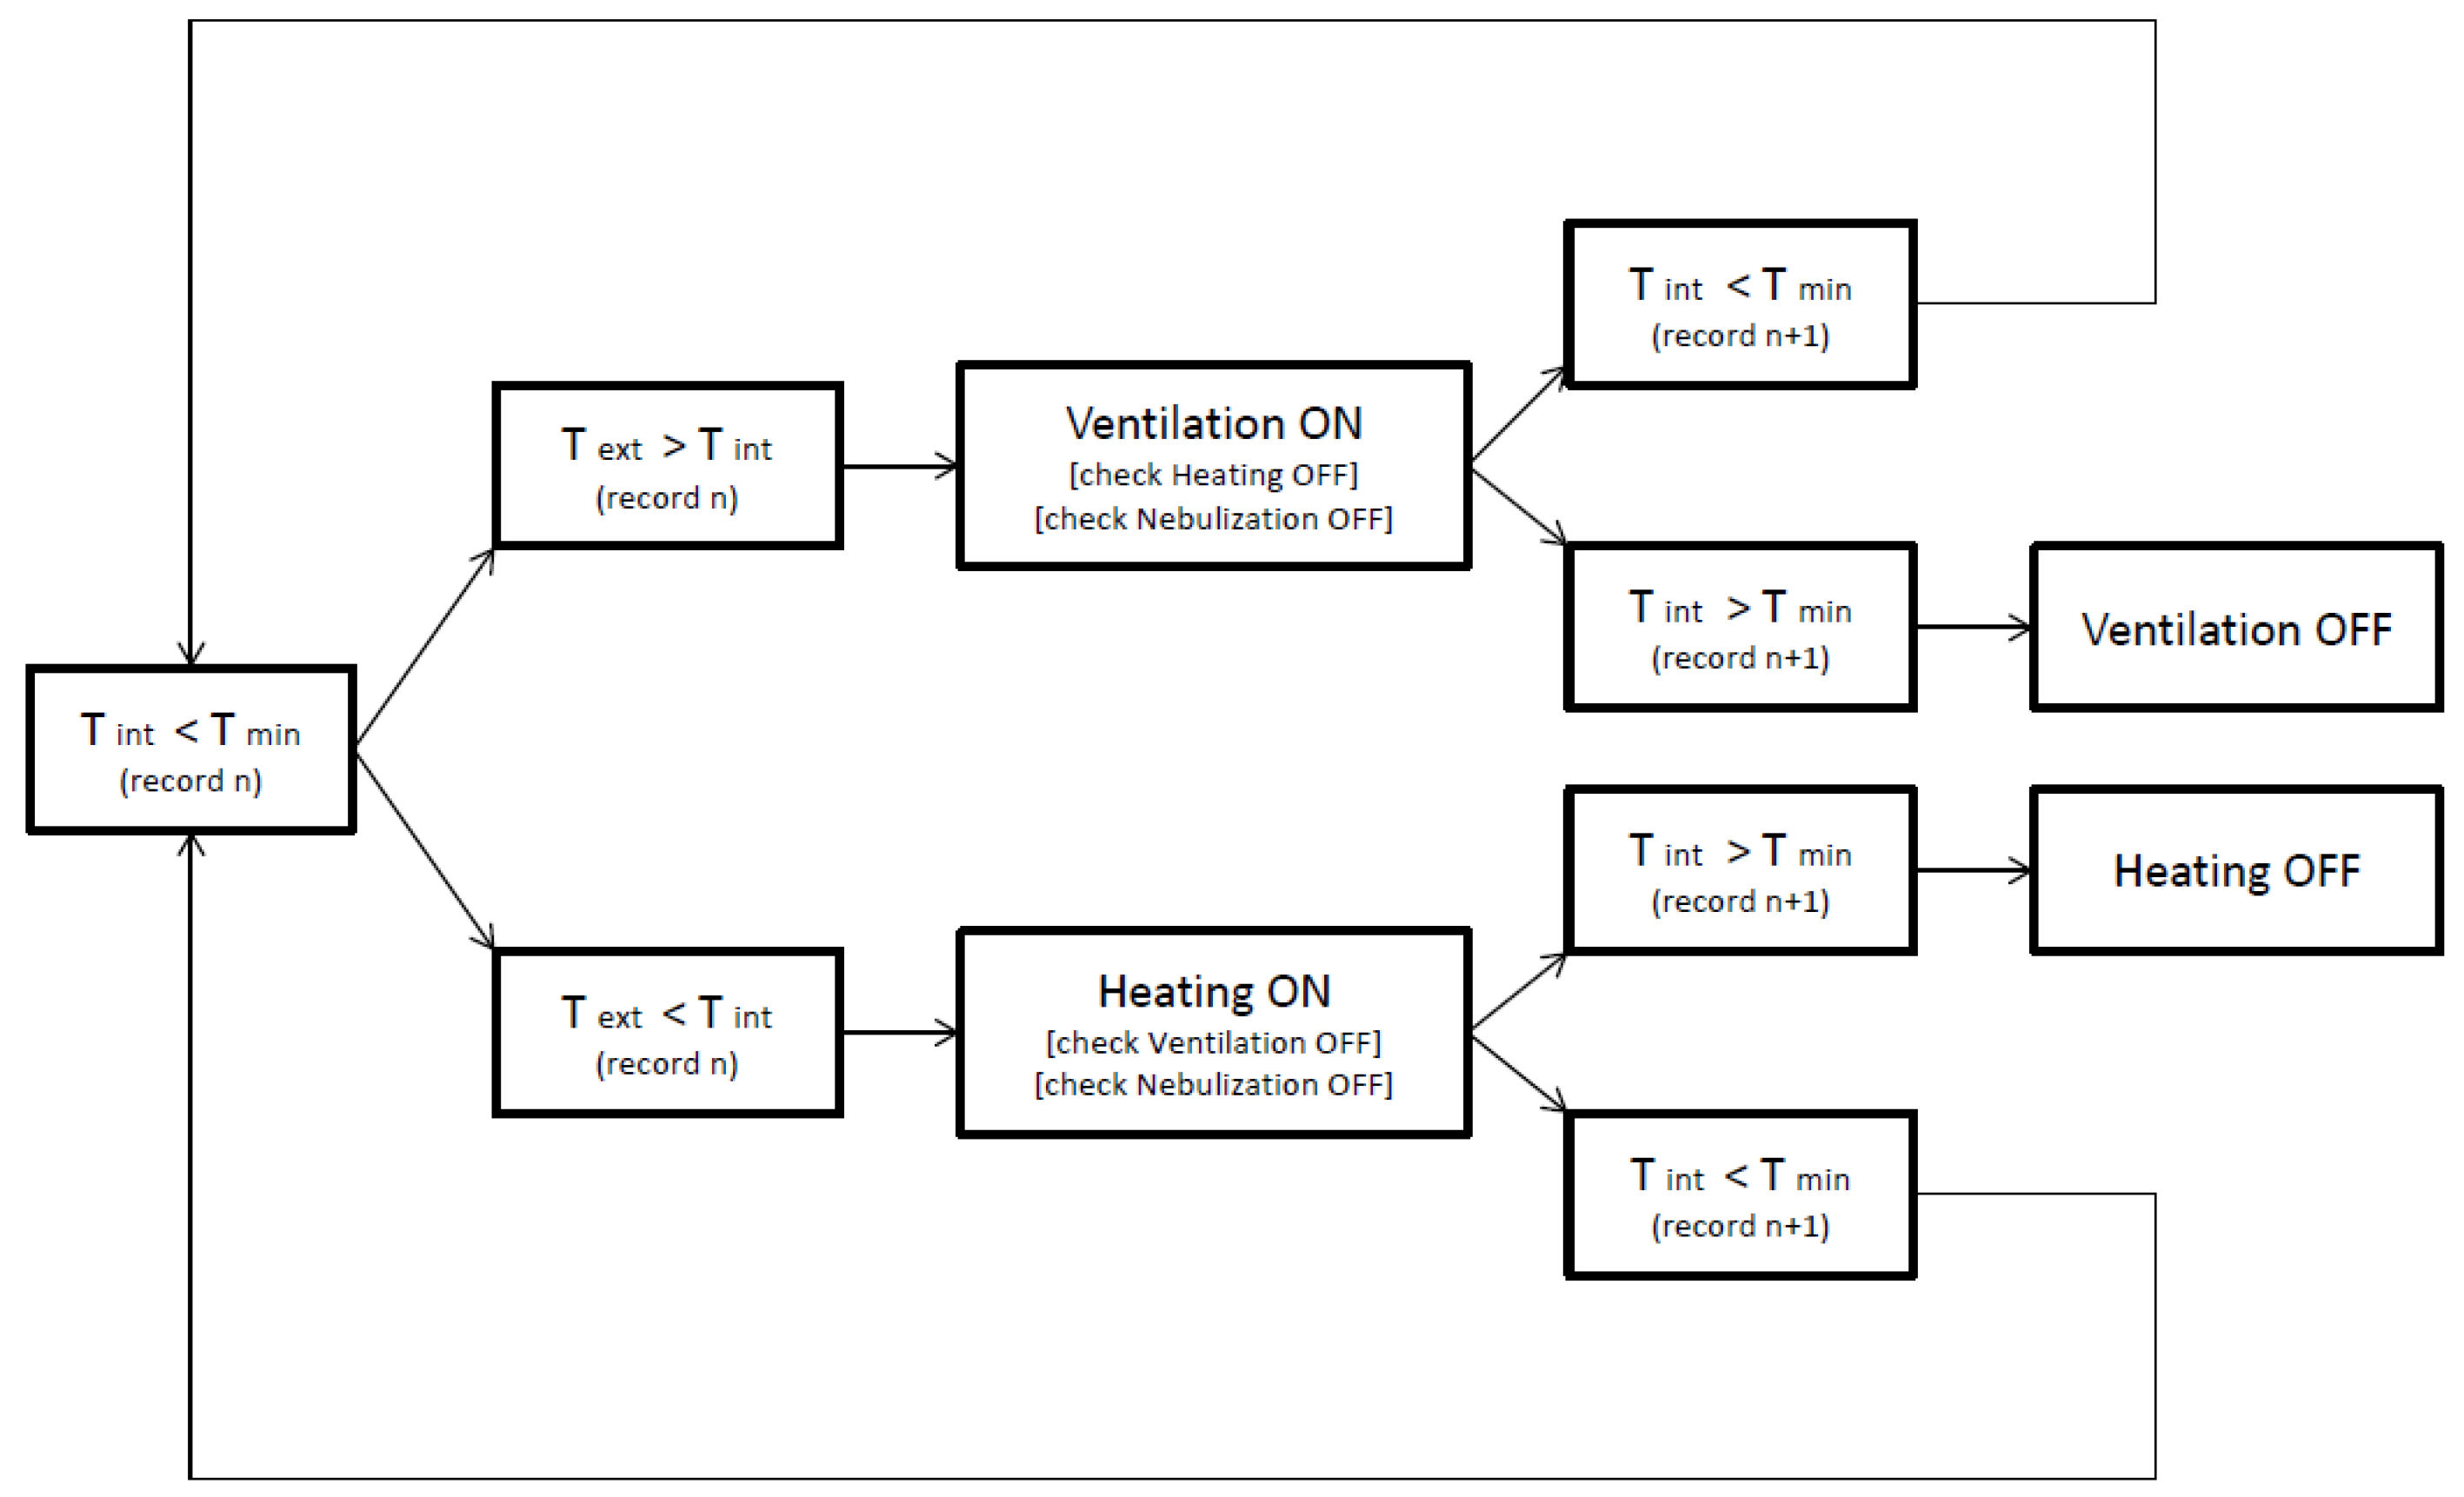
Textoutdoor temperature.
Tintindoor temperature.
Tmaxmaximum temperature.
Tminminimum temperature.
UVaUniversity of Valladolid.

References

  1. Aryanpur, V.; Atabaki, M.S.; Marzband, M.; Siano, P.; Ghayoumi, K. An overview of energy planning in Iran and transition pathways towards sustainable electricity supply sector. Renew. Sustain. Energy Rev. 2019, 112, 58–74. [Google Scholar] [CrossRef]
  2. Locker, C.R.; Torkamani, S.; Laurenzi, I.J.; Jin, V.L.; Schmer, M.R.; Karlen, D.L. Field-to-farm gate greenhouse gas emissions from corn stover production in the Midwestern U.S. J. Clean. Prod. 2019, 226, 1116–1127. [Google Scholar] [CrossRef] [Green Version]
  3. WBCSD. Energy Efficiency in Buildings Transforming the Market; WBCSD: Washington, DC, USA, 2009; ISBN 978-3-940388-44-5. [Google Scholar]
  4. Lu, Y.; Zhang, X.P.; Huang, Z.; Lu, J.; Wang, D. Impact of introducing penalty-cost on optimal design of renewable energy systems for net zero energy buildings. Appl. Energy 2019, 235, 106–116. [Google Scholar] [CrossRef]
  5. Hernández-Callejo, L.; Gallardo-Saavedra, S.; Alonso-Gómez, V. A review of photovoltaic systems: Design, operation and maintenance. Sol. Energy 2019, 188, 426–440. [Google Scholar] [CrossRef]
  6. Foster, R.; Cota, A. Solar water pumping advances and comparative economics. Energy Procedia 2014, 57, 1431–1436. [Google Scholar] [CrossRef] [Green Version]
  7. Chang, R.; Cao, Y.; Lu, Y.; Shabunko, V. Should BIPV technologies be empowered by innovation policy mix to facilitate energy transitions?-Revealing stakeholders’ different perspectives using Q methodology. Energy Policy 2019, 129, 307–318. [Google Scholar] [CrossRef]
  8. Bot, G.; Van De Braak, N.; Challa, H.; Hemming, S.; Rieswijk, T.; Straten, G.V.; Verlodt, I. The solar greenhouse: State of the art in energy saving and sustainable energy supply. In Acta Horticulturae: International Society for Horticultural Science; International Society for Horticultural Science: Leuven, Belgium, 2005; Volume 691, pp. 501–508. [Google Scholar]
  9. Hassanien, R.H.E.; Li, M.; Lin, W.D. Advanced applications of solar energy in agricultural greenhouses. Renew. Sustain. Energy Rev. 2016, 54, 989–1001. [Google Scholar] [CrossRef]
  10. Harjunowibowo, D.; Ding, Y.; Omer, S.; Riffat, S. Recent active technologies of greenhouse systems—A comprehensive review. Bulg. J. Agric. Sci. 2018, 24, 158–170. [Google Scholar]
  11. Yano, A.; Furue, A.; Kadowaki, M.; Tanaka, T.; Hiraki, E.; Miyamoto, M.; Ishizu, F.; Noda, S. Electrical energy generated by photovoltaic modules mounted inside the roof of a north-south oriented greenhouse. Biosyst. Eng. 2009, 103, 228–238. [Google Scholar] [CrossRef]
  12. Yano, A.; Kadowaki, M.; Furue, A.; Tamaki, N.; Tanaka, T.; Hiraki, E.; Kato, Y.; Ishizu, F.; Noda, S. Shading and electrical features of a photovoltaic array mounted inside the roof of an east-west oriented greenhouse. Biosyst. Eng. 2010, 106, 367–377. [Google Scholar] [CrossRef]
  13. Kadowaki, M.; Yano, A.; Ishizu, F.; Tanaka, T.; Noda, S. Effects of greenhouse photovoltaic array shading on Welsh onion growth. Biosyst. Eng. 2012, 111, 290–297. [Google Scholar] [CrossRef]
  14. Castellano, S. Photovoltaic greenhouses: Evaluation of shading effect and its influence on agricultural performances. J. Agric. Eng. 2014, 45, 168–175. [Google Scholar] [CrossRef]
  15. Cossu, M.; Murgia, L.; Ledda, L.; Deligios, P.A.; Sirigu, A.; Chessa, F.; Pazzona, A. Solar radiation distribution inside a greenhouse with south-oriented photovoltaic roofs and effects on crop productivity. Appl. Energy 2014, 133, 89–100. [Google Scholar] [CrossRef]
  16. Cossu, M.; Cossu, A.; Deligios, P.A.; Ledda, L.; Li, Z.; Fatnassi, H.; Poncet, C.; Yano, A. Assessment and comparison of the solar radiation distribution inside the main commercial photovoltaic greenhouse types in Europe. Renew. Sustain. Energy Rev. 2018, 94, 822–834. [Google Scholar] [CrossRef]
  17. Cossu, M.; Yano, A.; Solinas, S.; Deligios, P.A.; Tiloca, M.T.; Cossu, A.; Ledda, L. Agricultural sustainability estimation of the European photovoltaic greenhouses. Eur. J. Agron. 2020, 118, 126074. [Google Scholar] [CrossRef]
  18. Yano, A.; Onoe, M.; Nakata, J. Prototype semi-transparent photovoltaic modules for greenhouse roof applications. Biosyst. Eng. 2014, 122, 62–73. [Google Scholar] [CrossRef] [Green Version]
  19. Cossu, M.; Yano, A.; Li, Z.; Onoe, M.; Nakamura, H.; Matsumoto, T.; Nakata, J. Advances on the semi-transparent modules based on micro solar cells: First integration in a greenhouse system. Appl. Energy 2016, 162, 1042–1051. [Google Scholar] [CrossRef] [Green Version]
  20. Subhani, W.S.; Wang, K.; Du, M.; Wang, X.; Yuan, N.; Ding, J.; Liu, S.F. Anti-solvent engineering for efficient semitransparent CH3NH3PbBr3 perovskite solar cells for greenhouse applications. J. Energy Chem. 2019, 34, 12–19. [Google Scholar] [CrossRef] [Green Version]
  21. Gupta, N.; Tiwari, A.; Tiwari, G.N. A thermal model of hybrid cooling systems for building integrated semitransparent photovoltaic thermal system. Sol. Energy 2017, 153, 486–498. [Google Scholar] [CrossRef]
  22. Zisis, C.; Pechlivani, E.M.; Tsimikli, S.; Mekeridis, E.; Laskarakis, A.; Logothetidis, S. Organic photovoltaics on greenhouse rooftops: Effects on plant growth. In Materials Today: Proceedings; Elsevier Ltd.: Amsterdam, The Netherlands, 2020; Volume 21, pp. 65–72. [Google Scholar]
  23. Song, W.; Fanady, B.; Peng, R.; Hong, L.; Wu, L.; Zhang, W.; Yan, T.; Wu, T.; Chen, S.; Ge, Z. Foldable Semitransparent Organic Solar Cells for Photovoltaic and Photosynthesis. Adv. Energy Mater. 2020, 10. [Google Scholar] [CrossRef]
  24. Emmott, C.J.M.; Röhr, J.A.; Campoy-Quiles, M.; Kirchartz, T.; Urbina, A.; Ekins-Daukes, N.J.; Nelson, J. Organic photovoltaic greenhouses: A unique application for semi-transparent PV? Energy Environ. Sci. 2015, 8, 1317–1328. [Google Scholar] [CrossRef]
  25. Marucci, A.; Cappuccini, A. Dynamic photovoltaic greenhouse: Energy efficiency in clear sky conditions. Appl. Energy 2016, 170, 362–376. [Google Scholar] [CrossRef]
  26. Li, Z.; Yano, A.; Cossu, M.; Yoshioka, H.; Kita, I.; Ibaraki, Y. Electrical Energy Producing Greenhouse Shading System with a Semi-Transparent Photovoltaic Blind Based on Micro-Spherical Solar Cells. Energies 2018, 11, 1681. [Google Scholar] [CrossRef] [Green Version]
  27. Moretti, S.; Marucci, A. A photovoltaic greenhouse with variable shading for the optimization of agricultural and energy production. Energies 2019, 12, 2589. [Google Scholar] [CrossRef] [Green Version]
  28. Aira, J.R. Aprovechamiento y Valorización de la Madera. In Parques Naturales y Espacios Naturales Protegidos, La Gestión del Parque Natural de la Serranía de Cuenca; Universidad de Castilla-La Mancha: Toledo, Spain, 2016; pp. 17–56. ISBN 978-84-9044-224-1. [Google Scholar]
  29. Hernández-Callejo, L.; Alonso-Gómez, V.; Eugenio-Gozalbo, M.; Rico-Rodríguez, E.; Huerta-Illera, I.; del Caño-González, T. Invernadero Fotovoltaicoes. In Efficient, Sustainable, and Fully Comprehensive Smart Cities. II Ibero-American Congress of Smart Cities (ICSC-CITIES 2019); Leite, V., Callejo, L.H., Prieto, J., Cañón, C.L.Z., Ferreira, Â., Nesmachnow, S., Peña, F.C., Eds.; Editorial Universidad Santiago de Cali: Soria, Spain, 2019; pp. 434–455. [Google Scholar]
  30. Hassanien, R.H.E.; Li, M. Influences of greenhouse-integrated semi-transparent photovoltaics on microclimate and lettuce growth. Int. J. Agric. Biol. Eng. 2017, 10, 11–22. [Google Scholar] [CrossRef] [Green Version]
  31. Hassanien, R.H.E.; Li, M.; Yin, F. The integration of semi-transparent photovoltaics on greenhouse roof for energy and plant production. Renew. Energy 2018, 121, 377–388. [Google Scholar] [CrossRef]
  32. Ureña-Sánchez, R.; Callejón-Ferre, Á.J.; Pérez-Alonso, J.; Carreño-Ortega, Á. Greenhouse tomato production with electricity generation by roof-mounted flexible solar panels. Sci. Agric. 2012, 69, 233–239. [Google Scholar] [CrossRef]
  33. Shi, H.; Xia, R.; Zhang, G.; Yip, H.L.; Cao, Y. Spectral Engineering of Semitransparent Polymer Solar Cells for Greenhouse Applications. Adv. Energy Mater. 2019, 9. [Google Scholar] [CrossRef]
Figure 1. PV greenhouse located on the Duques de Soria University Campus of the UVa.
Agronomy 11 01097 g001
Figure 2. Sensors and actuators.
Agronomy 11 01097 g002
Figure 3. Block diagram of the general operation of the prototype.
Agronomy 11 01097 g003
Figure 4. Control loops when Tint > Tmax.
Agronomy 11 01097 g004
Figure 5. Control loops when Tint < Tmin.
Agronomy 11 01097 g005
Figure 6. Control loops when Hint > Hmax.
Agronomy 11 01097 g006
Figure 7. Control loops when Hint < Hmin.
Agronomy 11 01097 g007
Figure 8. Control loops when CO2 int < CO2 min.
Agronomy 11 01097 g008
Figure 9. Connection diagram of the PV system and connected to batteries by regulator and inverter.
Agronomy 11 01097 g009
Figure 10. Planting frame in each section of the greenhouse.
Agronomy 11 01097 g010
Figure 11. Evolution before planting of temperature, relative humidity, concentration of CO2 and PAR radiation (1: PV glasses, 2: conventional glasses).
Agronomy 11 01097 g011aAgronomy 11 01097 g011b
Figure 12. Relationship between temperature, relative humidity, CO2 concentration and PAR radiation before planting (1: PV glasses, 2: conventional glasses).
Agronomy 11 01097 g012
Figure 13. Evolution after planting of temperature, relative humidity, CO2 concentration and PAR radiation (1: PV glass, 2: conventional glass).
Agronomy 11 01097 g013aAgronomy 11 01097 g013b
Figure 14. Relationship between temperature, relative humidity, CO2 concentration and PAR radiation after planting (1: PV glass, 2: conventional glass).
Agronomy 11 01097 g014
Figure 15. Mass of lettuces after harvesting (1: PV glasses, 2: conventional glasses).
Agronomy 11 01097 g015
Table 1. Properties of PV glass.
Model034-BN-12450635-30-1
Setting:Glass-glass (without inert chamber)
Dimensions:1245 mm × 635 mm × 7.96 mm (3.2 glass + 0.76 PVB encapsulation + 4 glass)
Transparency:Colorless glass with 30% transparency
PV technology type:Amorphous silicon
Rated power:22 W per module//1320 W in total over the entire active area (60 modules)
Special treatments:No special treatments
Table 2. Inputs and outputs of system devices.
SensorDeparture
Outside temperature, humidity and CO 2Modbus RTU
Indoor temperature, humidity and CO 2Modbus RTU
PAR radiation0–10 VDC
Network analyzerModbus RTU
ActuatorsEntry
Extractor fan0–230 VAC
Heater0–230 VAC
Nebulizer0–230 VAC
OthersEntry
Drip irrigation0–230 VAC
Table 3. Height of broad bean plants.
25 October 201906 November 201922 November 201929 November 2019
Average Height (cm)CoVAverage Height (cm)CoVAverage Height (cm)CoVAverage Height (cm)CoV
PV glass section300.23490.2520.2570.19
Conventional glass section260.23440.25460.22500.2
Publisher’s Note: MDPI stays neutral with regard to jurisdictional claims in published maps and institutional affiliations.

