Article

LoRa-LBO: An Experimental Analysis of LoRa Link Budget Optimization in Custom Build IoT Test Bed for Agriculture 4.0

1
School of Electronics and Electrical Engineering, Lovely Professional University, Jalandhar 144001, India
2
Department of Management Systems and Logistics, Rzeszow University of Technology, 35-959 Rzeszow, Poland
3
National Institute of Technology, Warangal 506004, India
4
School of Computer Science and Engineering, Lovely Professional University, Jalandhar 144001, India
5
Canadian Institute for Cybersecurity, University of New Brunswick, Fredericton, NB E3B 5A3, Canada
*
Authors to whom correspondence should be addressed.
Agronomy 2021, 11(5), 820; https://doi.org/10.3390/agronomy11050820
Submission received: 7 March 2021 / Revised: 17 April 2021 / Accepted: 19 April 2021 / Published: 22 April 2021
(This article belongs to the Special Issue Photovoltaics and Electrification in Agriculture)

Abstract

:
The Internet of Things (IoT) is transforming all applications into real-time monitoring systems. Due to the advancement in sensor technology and communication protocols, the implementation of the IoT is occurring rapidly. In agriculture, the IoT is encouraging implementation of real-time monitoring of crop fields from any remote location. However, there are several agricultural challenges regarding low power use and long-range transmission for effective implementation of the IoT. These challenges are overcome by integrating a long-range (LoRa) communication modem with customized, low-power hardware for transmitting agricultural field data to a cloud server. In this study, we implemented a custom-based sensor node, gateway, and handheld device for real-time transmission of agricultural data to a cloud server. Moreover, we calibrated certain LoRa field parameters, such as link budget, spreading factor, and receiver sensitivity, to extract the correlation of these parameters on a custom-built LoRa testbed in MATLAB. An energy harvesting mechanism is also presented in this article for analyzing the lifetime of the sensor node. Furthermore, this article addresses the significance and distinct kinds of localization algorithms. Based on the MATLAB simulation, we conclude that hybrid range-based localization algorithms are more reliable and scalable for deployment in the agricultural field. Finally, a real-time experiment was conducted to analyze the performance of custom sensor nodes, gateway, and handheld devices.

1. Introduction

According to a United Nations report [1], the world population will reach 9.8 billion in 2050, representing a 25% increase over the current population. Additionally, the pattern of urbanization is anticipated to grow at a rapid pace, with approximately 70% of the world′s population expected to be residing in urban areas by 2050 [2]. As a result, the amount of food production will be required to double by 2050 [3]. The size of the area of the Earth’s surface remaining for agricultural usage is limited due to climate, temperature, soil quality, and topography [4]. Additionally, compared to past decades, the total utilization of agriculture for food production has declined. Thus, agriculture transformed into a means of living that was considerably more sustainable and able to generate food surpluses than hunting and gathering alone. Subsequently, agriculture has become an integral part of human life [5,6], and many advancements have since taken place in agriculture in terms of crops, fertilizers, pesticides, etc. Agriculture has become a means of survival and a key component of national economies. Hence, it can be said that the agricultural development of a nation speaks for the nation. Investments to improve agricultural activities also benefit the employees of the country.
In natural farming, farmers are required to visit fields to evaluate crop conditions. Moreover, 70% of farmers’ time is spent in understanding the condition and monitoring of crops [7]. However, farming concerns can be overcome with smart agriculture, which aims to provide a sustainable solution with a low environmental effect. The recent advancements in communication and sensor technology allows the implementation of remote monitoring of crop fields from any location. At present, the Internet of Things (IoT) provides an opportunity to implement real-time monitoring of the agriculture field from any remote location [8]. The wide scope of the Internet provides an opportunity to effectively implement precision agriculture. For implementing the IoT in agriculture, the wireless communication protocol plays a crucial role in connecting the IoT server′s agricultural fields. In addition, agricultural fields are generally located in areas with poor connectivity [9]. Thus, the IoT demands low power consumption and long-range transmission-based wireless communication protocols because the end devices are energy-constrained [10]. The evolution of the low power wide area network (LPWAN) is meeting the requirements of the IoT. Among LPWAN wireless technologies, long-range (LoRA) is delivering robust and advanced wireless connectivity for communicating data from sensor nodes to a cloud server with zero subscription charges [11,12]. Additionally, in the agriculture field, the deployment of nodes plays a significant role because it provides information regarding the number of nodes required in the field. The nodes should be embedded with a localization mechanism to send the data to the sink node and gateway using the shortest path. The localization of the sensor nodes in agriculture is also an important factor for identifying a node located within the large area of an agricultural field.
The contributions of the study are as follows:
  • An overview of LoRa and distinct localization algorithms, namely range-free and range-based, is provided in this article.
  • The customization of sensor nodes and the gateway was designed and implemented for monitoring agriculture.
  • LoRa and Wi-Fi communication for agriculture is also proposed.
  • Implementation of a localization algorithm for agriculture is presented, and we conclude that hybrid range-based localization algorithms are more reliable, scalable, and easy to deploy in the field.
  • The energy harvesting mechanism for the sensor nodes is presented, and was evaluated using the Cisco packet tracer.
  • To characterize the behavior of LoRa, we undertook a simulation using MATLAB.
  • A real-time experiment was performed using the customized sensor node and gateway. The sensor node was able to communicate with the cloud server through the LoRa-based gateway.
This paper is organized as follows: Section 2 provides the theoretical background with technical specifications of wireless communication protocols. Section 3 presents an overview of LoRa and localization algorithms. Section 4 discusses the customization of the sensor node and gateway, and the LoRa and Wi-Fi communication-enabled architecture for agriculture. Section 5 outlines the simulation of localization, energy harvesting, and MATLAB simulation. Section 6 describes the real-time experimental setup and discusses the results.

2. Theoretical Background

The Internet of Things (IoT) is a pioneering technology that provides an efficient and accurate automation solution for modernizing agriculture with minimal human interference [13]. The advancement of sensor technology, wireless communication technologies, and remote sensing technologies encourages precision agriculture (PA). In the attempt to enhance the yield and quality of crops, wireless transmission is necessary to transfer data to information processing centers. Wireless communication empowers the effective utilization of limited resources in agriculture, thereby allowing the development of agriculture in terms of reliable connectivity [14]. Generally, most agricultural fields are located in remote areas, where internet connectivity is unstable. To overcome these limitations, the implementation of a wireless sensor network (WSN) is required. In a WSN, open-licensed band communication protocols are embedded in the sensor node and the communication protocol for transmitting the agricultural field data to an area in which the internet connectivity is sufficiently strong to allow communication with the cloud server [15].
In [16], IoT- and WSN-based agriculture systems based on a CC3200 single chip for monitoring the humidity and temperature of the crop field were implemented. Additionally, a camera module was integrated with a CC3200 single chip to capture visuals and communicate a multimedia message (MMS) to a farmer. The WSN-based smart agriculture system was implemented by utilizing the Zigbee network and communicating the crops’ status to farmers and a cloud server [17,18]. A Wi-Fi, GSM, and WEMOS D1 controller-based agriculture monitoring system has been implemented for monitoring the parameters of crops, such as pH, soil moisture, soil type, and weather conditions, and communicate these to a cloud server [19]. A low-cost information-based system was implemented for agriculture using 2G GSM and orang-pi [20]. In the agriculture scenario, wireless communication protocols such as ZigBee, Wi-Fi, and GPRS have been implemented for transmitting data to processing centers. Sensor-based data acquisition has been achieved using Bluetooth, ZigBee, and cloud servers. Because sensor nodes are energy-constrained devices, the implementation of GPRS and Wi-Fi communication protocols is challenging because they consume large quantities of power, as shown in Table 1. Because its communication is characterized by low power consumption, ZigBee is also implemented in agriculture. However, its transmission range is limited. Of the above-mentioned communication options, LoRa is a reliable and feasible communication technology used in agriculture to implement the effective WSN-based IoT. To implement the WSN, LoRa communication is chosen because it can transmit data to an Internet-connected area [21]. LoRa communication has been integrated into agriculture to capture and communicate real-time images of farms [22].
A wireless sensor network includes small, low-energy consumption sensor nodes for various applications. The task of localization is to determine the physical coordinates of the sensors. Because each application has specific requirements, several localization algorithms are used. WSN localization plays a significant role in the agriculture IoT. Tiny and cheap devices with low energy consumption and limited computing resources are being heavily used in agriculture applications. To deploy sensor nodes in fields, localization algorithms, such as time on arrival (TOA), time difference of arrival (TDOA), and received signal strength indication (RSSI), are required to estimate the number of sensor nodes and their position in a particular field [23]. A statistical method has been implemented to identify the non-line of sight (NLOS) nodes in the WSN network [24,25]. A combination of range-based, range-free-based, and hybrid-based localizations can be emphasized. A combination of range-based and range-free algorithms has been studied concerning the sensor node distance, density, and reliability. As discussed earlier, selecting accurate wireless communication is critical for overcoming the problems of power consumption and transmission range. A study of various communication techniques is tabulated below according to frequency band, network size, network topology, etc.
Table 1 discusses three emerging LPWAN technologies, namely LoRa, narrow band-IoT (NB-IoT), and SigFox, regarding the requirements of the IoT for a wide range of applications. Of these LPWAN technologies, LoRa is considered to be an independent network and can utilize the frequency bands without any cost [27]. NB-IoT is a licensed band, and is also a dependent network that charges for the use of the bands. The Sigfox network is deployed by network operators, and users are subscription-based. LoRa is one of the best candidates for long distance and low power transmissions [28].

3. LoRa and Localization Algorithms

In this section, we provide an overview of LoRa and the localization algorithms of the WSN. In the Section 1, LoRa and its fundamental parameters are discussed. In the Section 2, the significance of localization and distinct types of localization algorithms are discussed.

3.1. Overview of LoRa

LoRa is a form of robust low-power wireless networking that is used for long-distance communication. LoRa utilizes chirp spread spectrum (CSS) modulation to modulate the Industrial, Scientific and Medical (ISM) bands [29]. Modulation of the chirp spread spectrum broadcasts a narrow band signal over broader channel bandwidth. LoRa operates on ISM bands such as 868 MHz in Europe, 995 MHz in North America, and 433 MHz in Asia [30]. LoRa can communicate over distances of between 10 and 40 km in rural areas, and urban area coverage is between 1 and 5 km. The LoRa protocol specification was developed by the LoRa Alliance, as shown in Figure 1. The LoRaWAN protocol comprises the MAC Layer and the Application Layer, and operates based on the LoRa physical layer. LoRaWAN is a network standard for telecom operators founded on the LoRa physical layer (PHY). It enables network services and encourages systems to transfer data to gateways wirelessly over a long range. LoRaWAN communicates between LoRa gateways and IoT devices via a star-network topology, and single hopping is allowed between a gateway and a LoRa device.
The analysis of LoRa communication in distinct applications can be undertaken based on the parameters of spreading factor (SF), link budget, signal-noise ratio (SNR), bandwidth (BW), link budget, receiver sensitivity, bit error rate (BER), and packet error rate (PER).

3.1.1. Spreading Factor

The initial frequency of the chirp is recognized as a symbol. The encoded bits in a symbol are configured by a unique parameter known as the spreading factor (SF). This indicates that a chirp with the spreading factor SF represents 2SF bits per symbol, which implies that one symbol is described by multiple chips that are spread spectrum code pulses. SF is expressed as:
S F = C h i r p   r a t e s y m b o l   r a t e

3.1.2. Signal-To-Noise Ratio (SNR)

SNR is the ratio of transmitted signal powers to the unwanted signal i.e., noise power. It is preferred that the SNR is minimized to ensure that demodulation at the receiver end is straightforward and the signal can be decoded correctly. To enhance LoRa performance, it uses forward error correction (FEC) techniques and the spreading factor, thus allowing significant SNR improvements. In particular, the SNR range is between −20 and +10 dB. The received signal is less distorted if the range is around +10 dB. LoRa has an SNR range of −7.5 to −20 dB.

3.1.3. Link Budget

The link budget cab be determined from transmitted power and node sensitivity, and is expressed as:
L i n k   B u d g e t ( d B m ) = ( A n t e n n a   t r a n s m i t t e d   p o w e r ( d B ) ) ( N o d e   s e n s i t v i t y ( d B ) )

3.1.4. Sensitivity (S)

Sensitivity is defined as the ability of the receiver to amplify the weak signals that are obtained by the receiver. In LoRa, the spreading factor, noise figure, and bandwidth are considered to be inputs for providing the sensitivity as output. Sensitivity (S) is calculated as:
S = 174 + 10 l o g 10   B W + N F + S N R
where BW is the band width of the channel, NF is the noise figure gain in dB, and SNR is the signal to noise ratio power in dB.
Bit Rate/data rate is defined as the rate at which bits are transferred from one location to another. The bit rate (Rbit) of LoRa is expressed as:
R b i t = S F B W 2 S F C R

3.1.5. Bit Error Rate (BER)

BER is the percentage of bits that have errors compared to the cumulative number of bits received in a transmission. BER is represented as 10−4. If BER is 10−4, then it indicates that 10,000 bits have been transferred, and one bit has an error. A higher BER indicates that network performance is poor.

3.1.6. Packet Error Rate (PER)

PER is the total number of received packets divided by the number of error packets after forward error correction (FEC). A packet is a data unit used in a radio transmission that is subject to FEC.

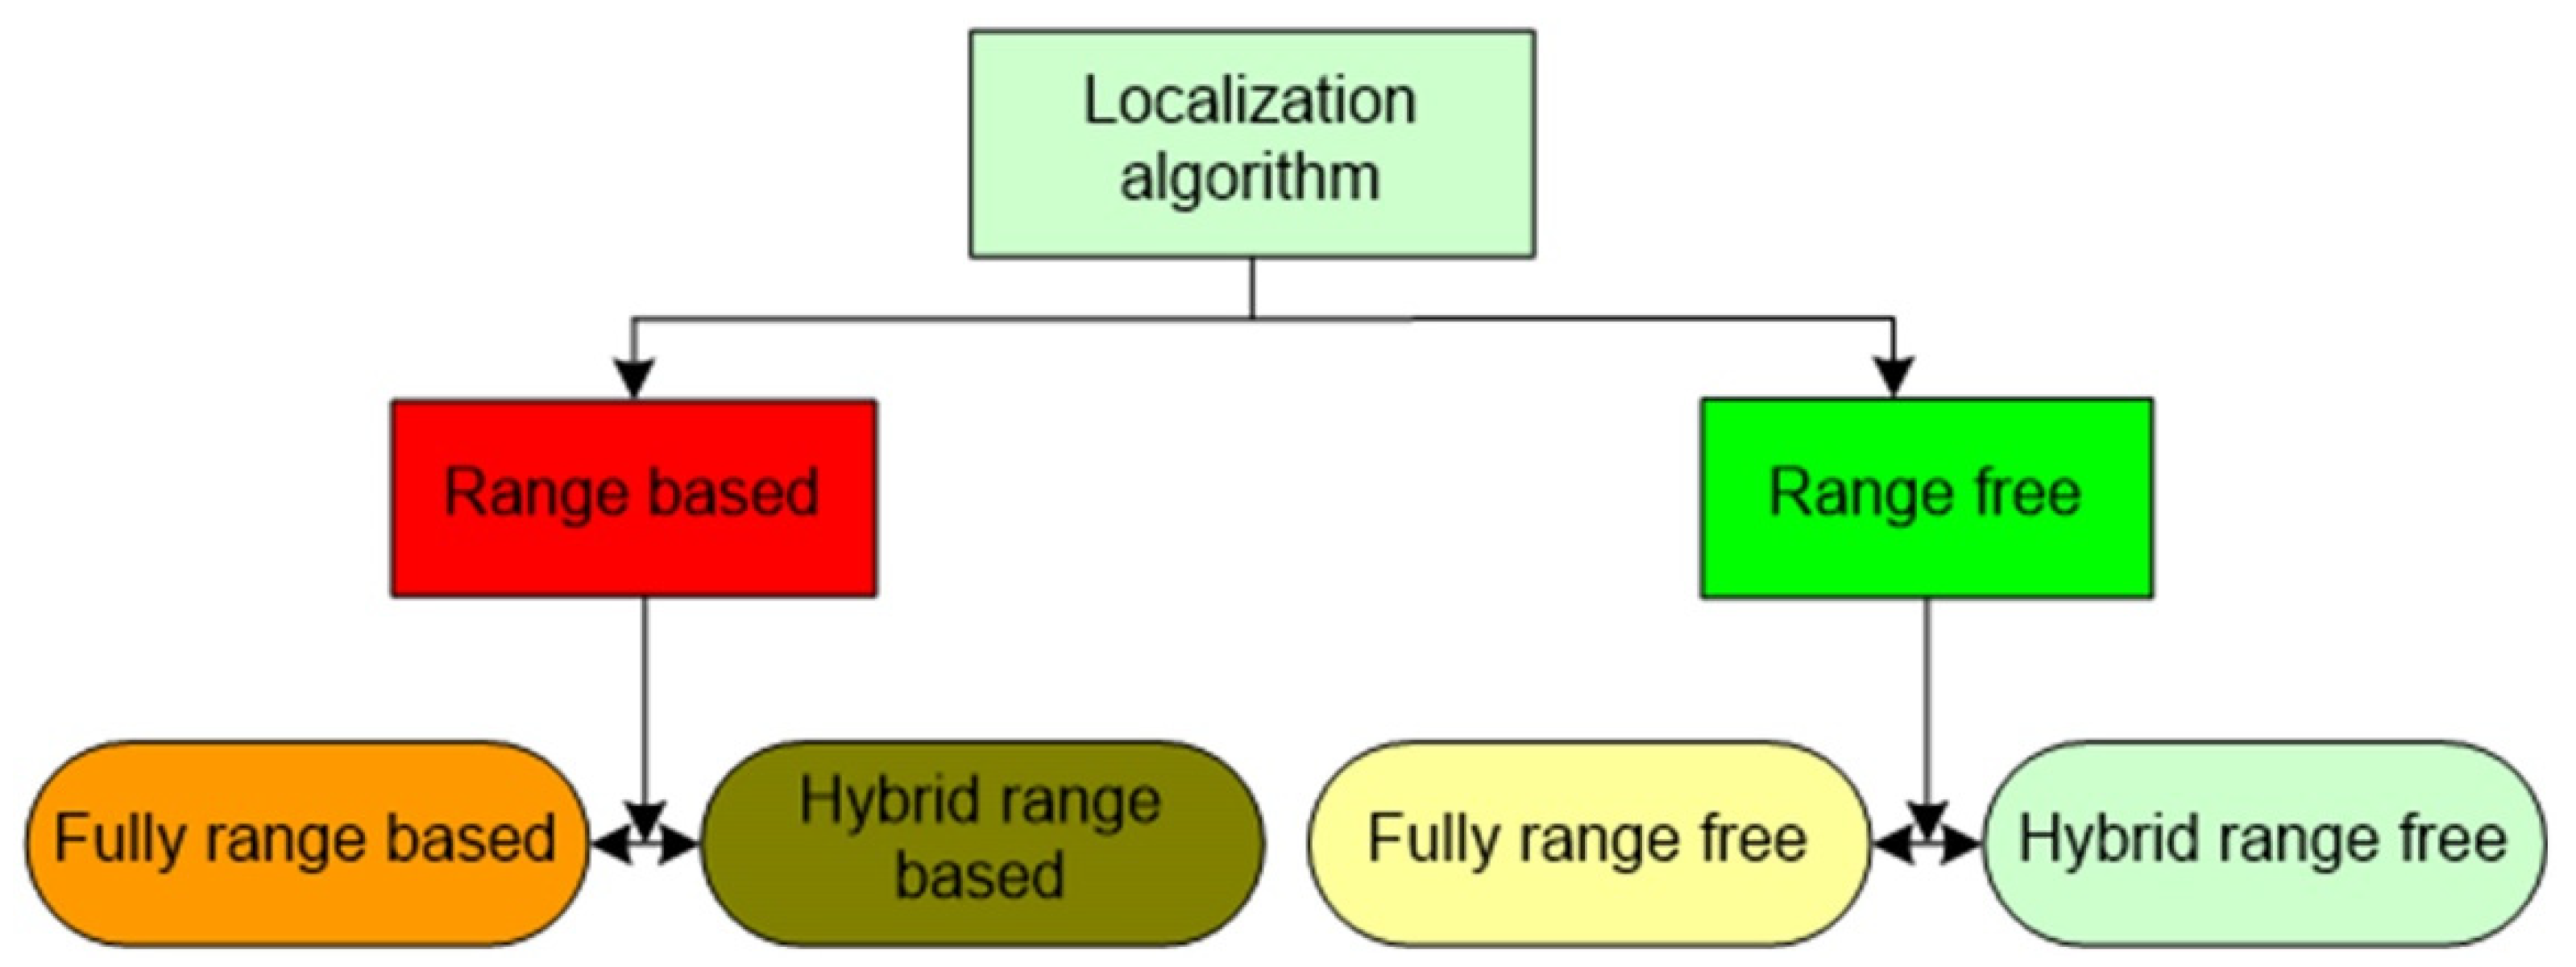
3.2. Localization Algorithm

Localization is crucial for identifying the physical locations of sensors in the deployment area. Concerning the deployment land in agriculture, it is important to identify the required number of sensor nodes and the distances at which they need to be positioned so that sensor nodes can establish communication links among themselves. Here, we discuss localization algorithms to determine a suitable node architecture for farm land. Various parameters are evaluated using these algorithms, such as accuracy, reliability, and scalability. Localization algorithms are broadly classified into two types, namely, range-based and range-free-based, as shown in Figure 2 [23]. Moreover, these two types are classified into two kinds, namely, fully range-based and hybrid range-based.
(a) 
Range-free localization algorithms
These algorithms determine the location of an unknown deployed sensor node [9]. Range-free methods utilize radio connectivity to communicate between nodes to identify their location. In range-free schemes, the angle of arrival (AOA), specific hardware, and distance measurement is not considered [31]. Range-free schemes comprise the centroid system, distance vector (DV) hop, approximate point in triangulation (APIT), and hop terrain, described as follows:
  • DV—hop localization:
  • In DV hop, the distance between the nodes is estimated using hop count, and the hop count of at least three anchor nodes is distributed across the network [32]. The hop count of a node is incremented by one when the neighbor node transmits the information to another neighbor node. The hop distance is evaluated as the distance between two nodes/number of hops.
  • Centroid localization: This is the most basic scheme that uses anchor beacons, containing location information (Xi, Yi) [31], where n is the number of the anchor nodes Ai.
    ( X , Y ) = ( i = 1 n x i n , i = 1 n Yi n )
  • APIT: In APIT, the location information is obtained by anchor nodes through a global positioning system (GPS) and the unlocalized node receives the location information via overlapped triangles [33].
  • Gradient: In the gradient algorithm, the unlocalized node utilizes the multilateration method to estimate the position of nodes. Moreover, it utilizes hop counting and the hop increment while being distributed to neighboring nodes.
(b) 
Range-based localization algorithms
Range-based localization is based on angle estimation and distance estimation. The main techniques in this form of localization are time of arrival (ToA), angle of arrival (AoA), time difference of arrival (TDoA), and received signal strength indication (RSSI):
  • ToA localization: This localization algorithm refers to the time of arrival, i.e., ToA, which refers to the time taken for the signal to travel from the sending node to the receiving node [34]. The distance is measured using roundtrip-time of flight (RTOF) to determine the distance between two nodes and is represented in Equation (6) as:
d = [ ( T 3 T 0 ) + ( T 2 T 1 ) ] ×   V 2
Sensor coordinates (x1,y1), (x2,y2), (x3,y3), and (x4,y4) determined using the response information and the TOA-based distance measurement method can be used to obtain the distances between them and the moving node S as d1,d2,d3, and d4, respectively. Given the coordinates of the moving node S, (x, y), the following equation can be used to calculate the location coordinates of the moving node:
d i = ( x x i ) 2 + ( y y i ) 2  
where i = 1, 2, 3, 4.
  • AODV localization: AODV is the routing protocol based on the distance-vector algorithm, which integrates the target serial number of DSDV and the on-demand routing discovery in DSR [35]. This protocol mainly includes routing discovery and routing maintenance, where the former is only requested to save the overdue routing.
  • AOA: The location of an unlocalized node is estimated through the angles at the points at which the anchor signals are obtained [36,37]. Here the unlocalized nodes implement a triangulation procedure for estimating the location.
  • RSSI: In this method, the estimation of the distance between receiver and transmitter is obtained by evaluating the signal strength at the receiver [38,39]. The power of the signal decreases when the distance between receiver and transmitter decreases.
A comparative analysis of fully range-based and hybrid range-based algorithms is shown in Table 2. Fully range-based algorithms are used to determine the distances or angles between nodes to allow an unknown node to be identified easily, whereas hybrid range-based algorithms use various distance and angle measuring methods. Different parameters, such as node density, range, scalability, and reliability of algorithms, are shown in Table 2. These exploit geometry to improve hybrid AOA/TDOA-based localization (EATL). Fusion of RSSI and TDOA measurements from the wireless sensor network provides robust and accurate indoor localization (FRTL). Hybrid range-based algorithms perform better than fully range-based algorithms. Table 2 shows that hybrid range-based algorithms perform better in range combinations using TOA, TDOA, and RSSI. Scalability and accuracy of the fully range-based algorithms are comparatively lower than those of hybrid range-based algorithms.
To design a reliable and scalable sensor network architecture for smart monitoring, we proposed an architecture in which data nodes are deployed on agricultural land and agricultural field node localization is used to establish proper sensor coordination. For the deployment of data nodes to establish suitable communication among sensors, i.e., temperature, humidity, rainfall, altitude, pressure, and fire sensors in open-field lands, hybrid range-based localization techniques are preferred. Data nodes transfer information to the gateway and from the gateway to the cloud platform. A data logger was designed in which all of the sensor data can be stored. For the storage of data, both the local server and cloud server are preferred. The user on a remote device can visualize the data. From remote devices, via the Internet a farmer or any user can operate motors, sprinklers, and blowers connected to farming land.

4. Methods and Materials

4.1. Hardware

The sensors are interfaced and powered from the solar panel. All data is gathered at the sink node and is transmitted to the destination via a gateway. The hardware can be operated on a rechargeable Li-Ion 2200 mAH battery. Figure 3 consists of sensor modules, ADC, LoRa modem, and a LoRa helical antenna. The device can be deployed to collect sensor data from the field and transmit it via the Internet to the receiver device through the gateway, which is a customized ATMEGA 328 p board with an inbuilt Wi-Fi module and it is shown in the Figure 4.
The block diagram (Figure 2) is a depiction of the components used in the entire project. The connections were made so that the main component Raspberry Pi board is connected to the Arduino Uno board through the standard pyfirmata. The remainder of the sensors are connected with both the Arduino and Raspberry Pi models. The digital sensors are attached to the Raspberry Pi, and the analog sensors are connected to the Arduino Uno board. The sensors gather data in real-time. All of the outputs are stored on the Thingspeak server/Blynk on the cloud, and can be accessed at any point in time.
A circuit diagram of a reference model of the interface connections made in real time is shown in Figure 5. Firstly, the Arduino is connected to the Raspberry Pi using a USB cable. The gas sensor is connected to the Arduino at the analog A0 pin. The ultrasonic sensor is connected to pin no. 9 of the Arduino for trigger, and echo at pin no. 10. DHT11 is connected to pin 2 of the Arduino. Soil moisture is connected to analog pin A3 of the Arduino. The motor pump is connected to pin no. 8 of the Arduino.

4.2. Proposed LoRa Architecture

A cloud-based agriculture field-monitoring scheme was implemented to precisely monitor the temperature, humidity, and other required parameters to operate end devices in an agriculture field. This scheme facilitates the conservation of water and energy in a field. Here, an open agriculture field was studied. Figure 6 shows the architecture of the LoRa network. The proposed protocol can be adapted to a greenhouse, hydroponic agriculture, and vertical farming. Devices provide numerous data on agriculture parameters from the field, and analysis of the data allows the farmer to work more effectively. A LoRa-enabled sensor network was deployed in the agriculture field. A LoRa-enabled architecture for precise irrigation and monitoring has been demonstrated in which LoRa enabled each sensor node and could establish a communication link with another LoRa-enabled receiver. LoRa is a low-power operating technique that enables transmission and reception with a wide range of communication. Although many other protocols exist, they have significant limitations compared to LoRa.

5. Simulation

5.1. Localized Algorithm Simulation

A flow diagram of the sensor node localization is illustrated in Figure 7. Initially, the type of node distribution is chosen as per the application, which may be uniform or random. Furthermore, node density is determined to check the number of nodes present in the area (measured in square meters). The algorithm computes these input data and results in sensor node distribution patterns. After confirming the communication link among the sensor nodes, a hybrid range-based localization technique was chosen because it is more effective. Localization is crucial to determine the sensor node target tracking location. Here, we first grouped the algorithms into free range-based and hybrid range-based. Furthermore, we analyzed the suitable localization techniques. Range free-based localization is preferred because of its low power consumption, whereas hybrid range-based localization is preferred depending on the applications. Because the land is not uniform in nature, hybrid range-based localization is widely preferred in agriculture. Most IoT-based applications require sensor node localization because these applications are easy and convenient to monitor. Simulation studies were carried out to compute the localization of algorithms. The effect of the node density, data rate, and signal strength was analyzed to develop the optimal algorithm for our application. Furthermore, we undertook a comparative analysis of the range-based agriculture applications, and concluded that range free-based localization was more suitable.

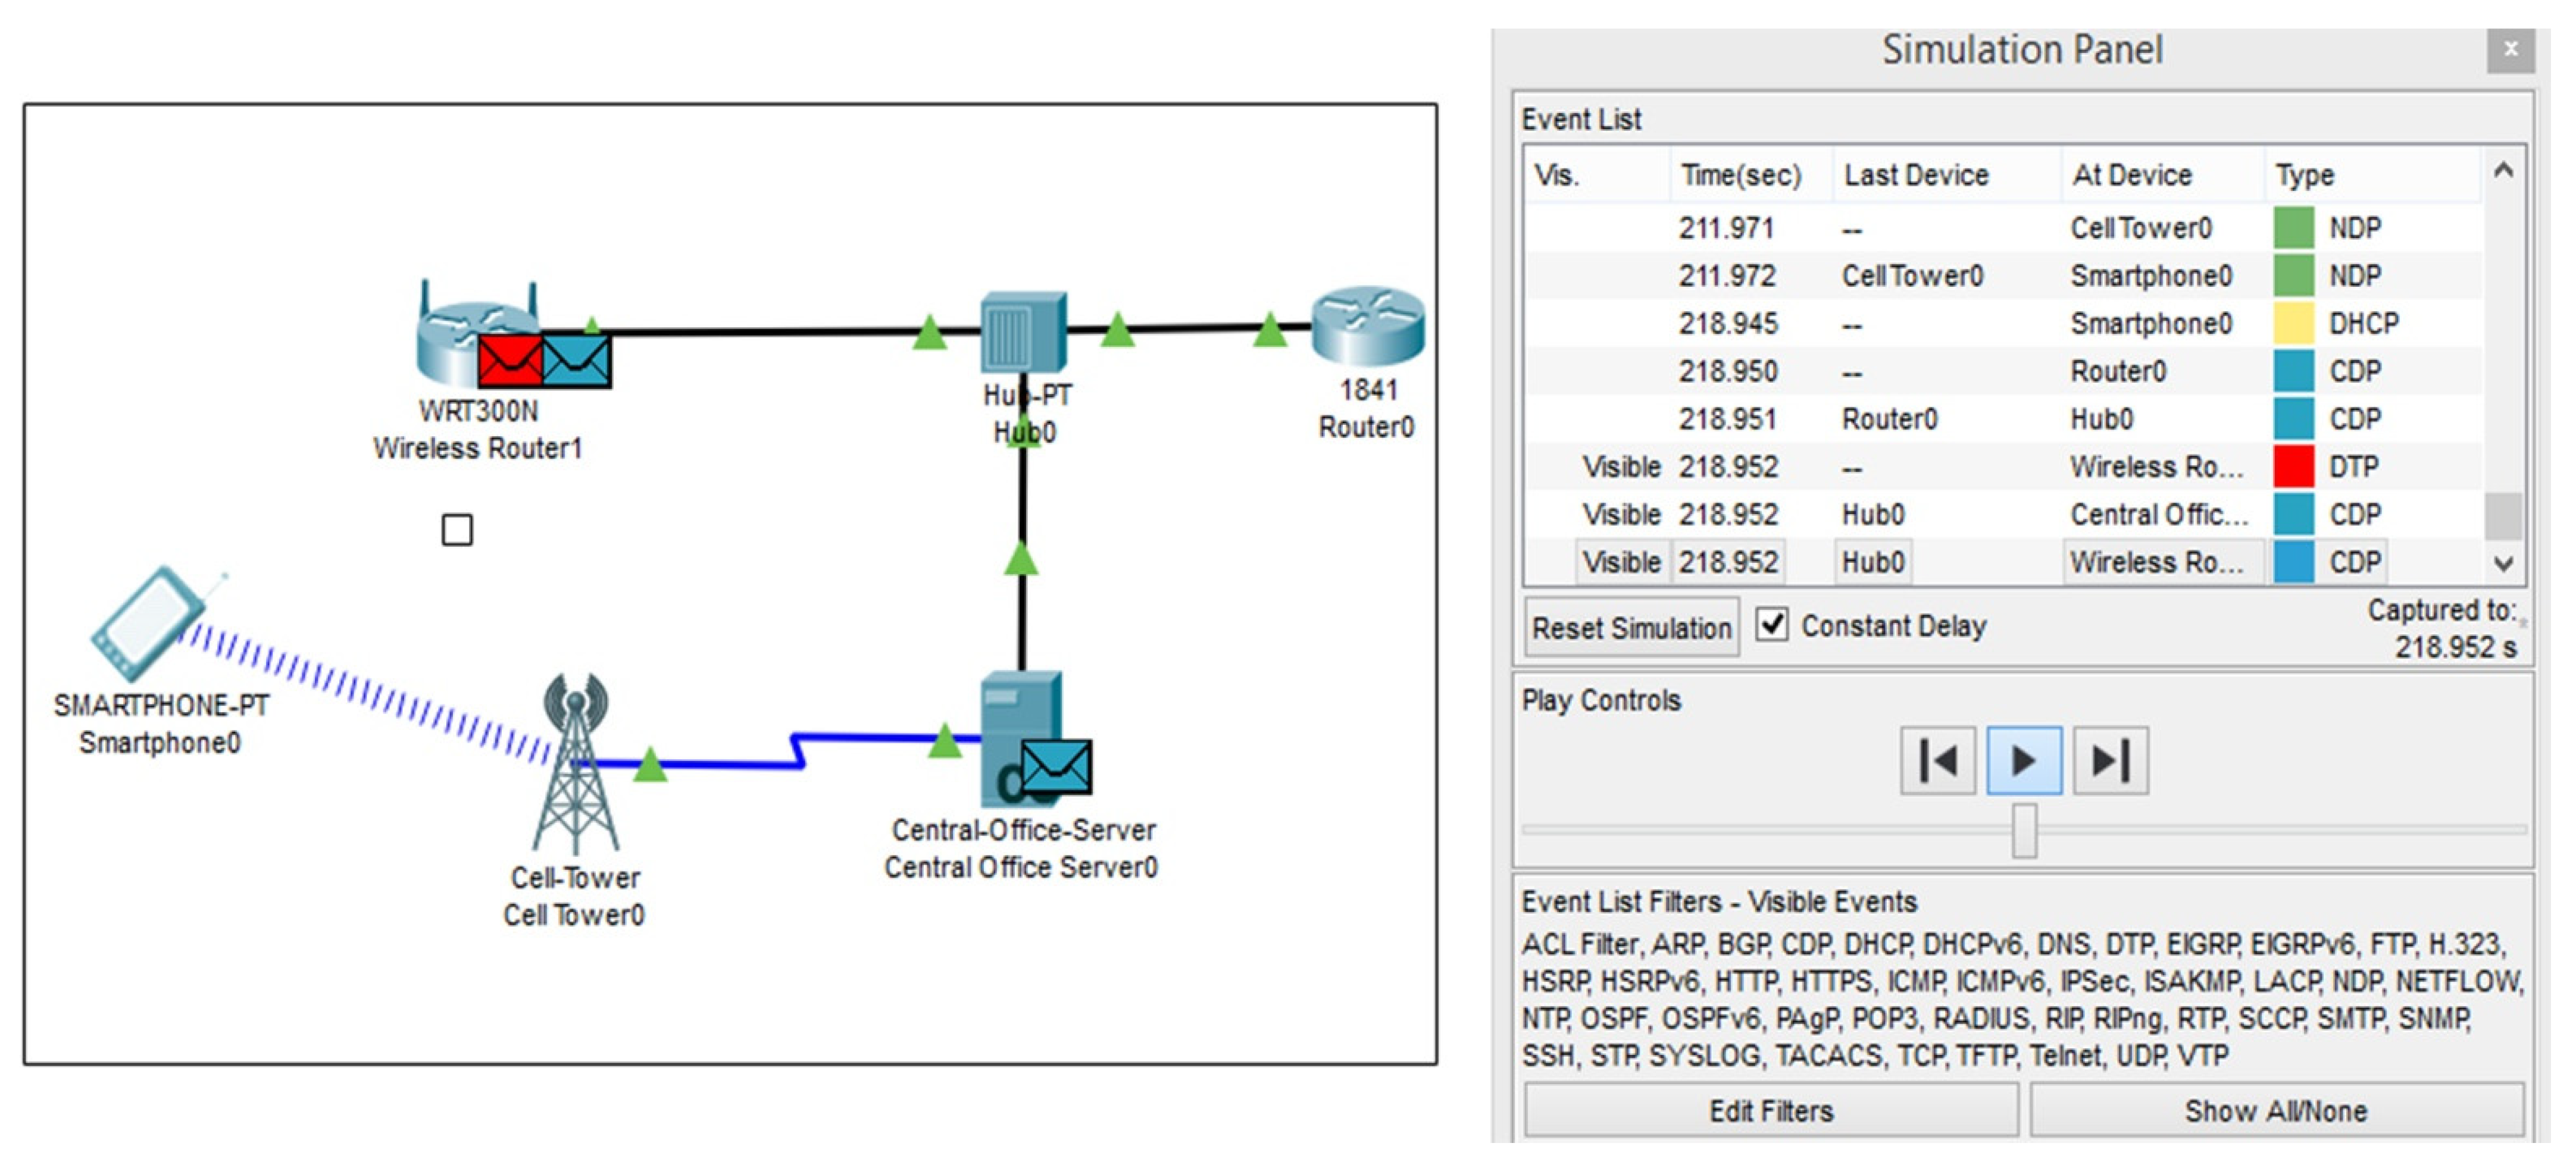
5.2. Simulation of Energy Harvesting

In agriculture, sensor nodes are deployed in an outdoor environment. Moreover, the sensor node′s battery life represents a challenge because the life of the battery drains due to distinct environmental conditions. Thus, the optimal solution for implementing energy harvesting for sensor nodes involves renewable energy sources. Energy harvesting is the optimal mechanism used to power the activities of the sensor nodes, including sensing, preprocessing, and transferring data. The evaluation of sensor node battery life using solar panels and wind turbines was performed using a Cisco packet tracer. The Cisco packet tracer is a visualized-based simulation tool that encourages the user to implement distinct network-based simulations. The simulation model for evaluating the sensor node′s energy through solar panels and wind turbine was implemented in the Cisco packet tracer environment and is shown in Figure 8.
The lifetime of the nodes is presented in the simulation, as shown in Figure 10. Data transmission occurs from end nodes to the hub, the hub to a central server, and from mobile phones via cell towers. The simulation panel in Figure 9 presents the number of IoT devices connected to the network. Each renewable resource is connected using a power meter for calculating the power consumption. Timestamp details of the IoT devices are represented in the time column; the IoT 2 device is connected to the network with a time of 0.129 s. Devices IoT0 and IoT1 are currently connected within 1.011 s. Total device connection time is 77.660 s with a specific time gap or delay. Further power is transferred to the battery for storage purposes. A sample scenario of power of 11 kWh in the case of a turbine and 78 watts with 82 Wh was considered.
The establishment of LoRa-based communication from the sensor node to the mobile phone is presented in Figure 10. The simulation model shown in Figure 8 signifies the communication link established among sensor end nodes and establishes a connection with the gateway to transmit the data to the central server. In the simulation panel, the data transmission time in seconds, from the router to the hub and the hub to smartphones, is displayed. The simulation signifies the on-air data transmission. Three events are noted as having a time of 218.952 s. Each of the three devices, i.e., wireless router, central office, and another wireless router, connected to the network at the same timestamp. This signifies, in LoRa communication, that the device synchronization time gap is extremely small, which is an additional advantage. As soon as the authentication key matches, the devices are synchronized and begin communicating.

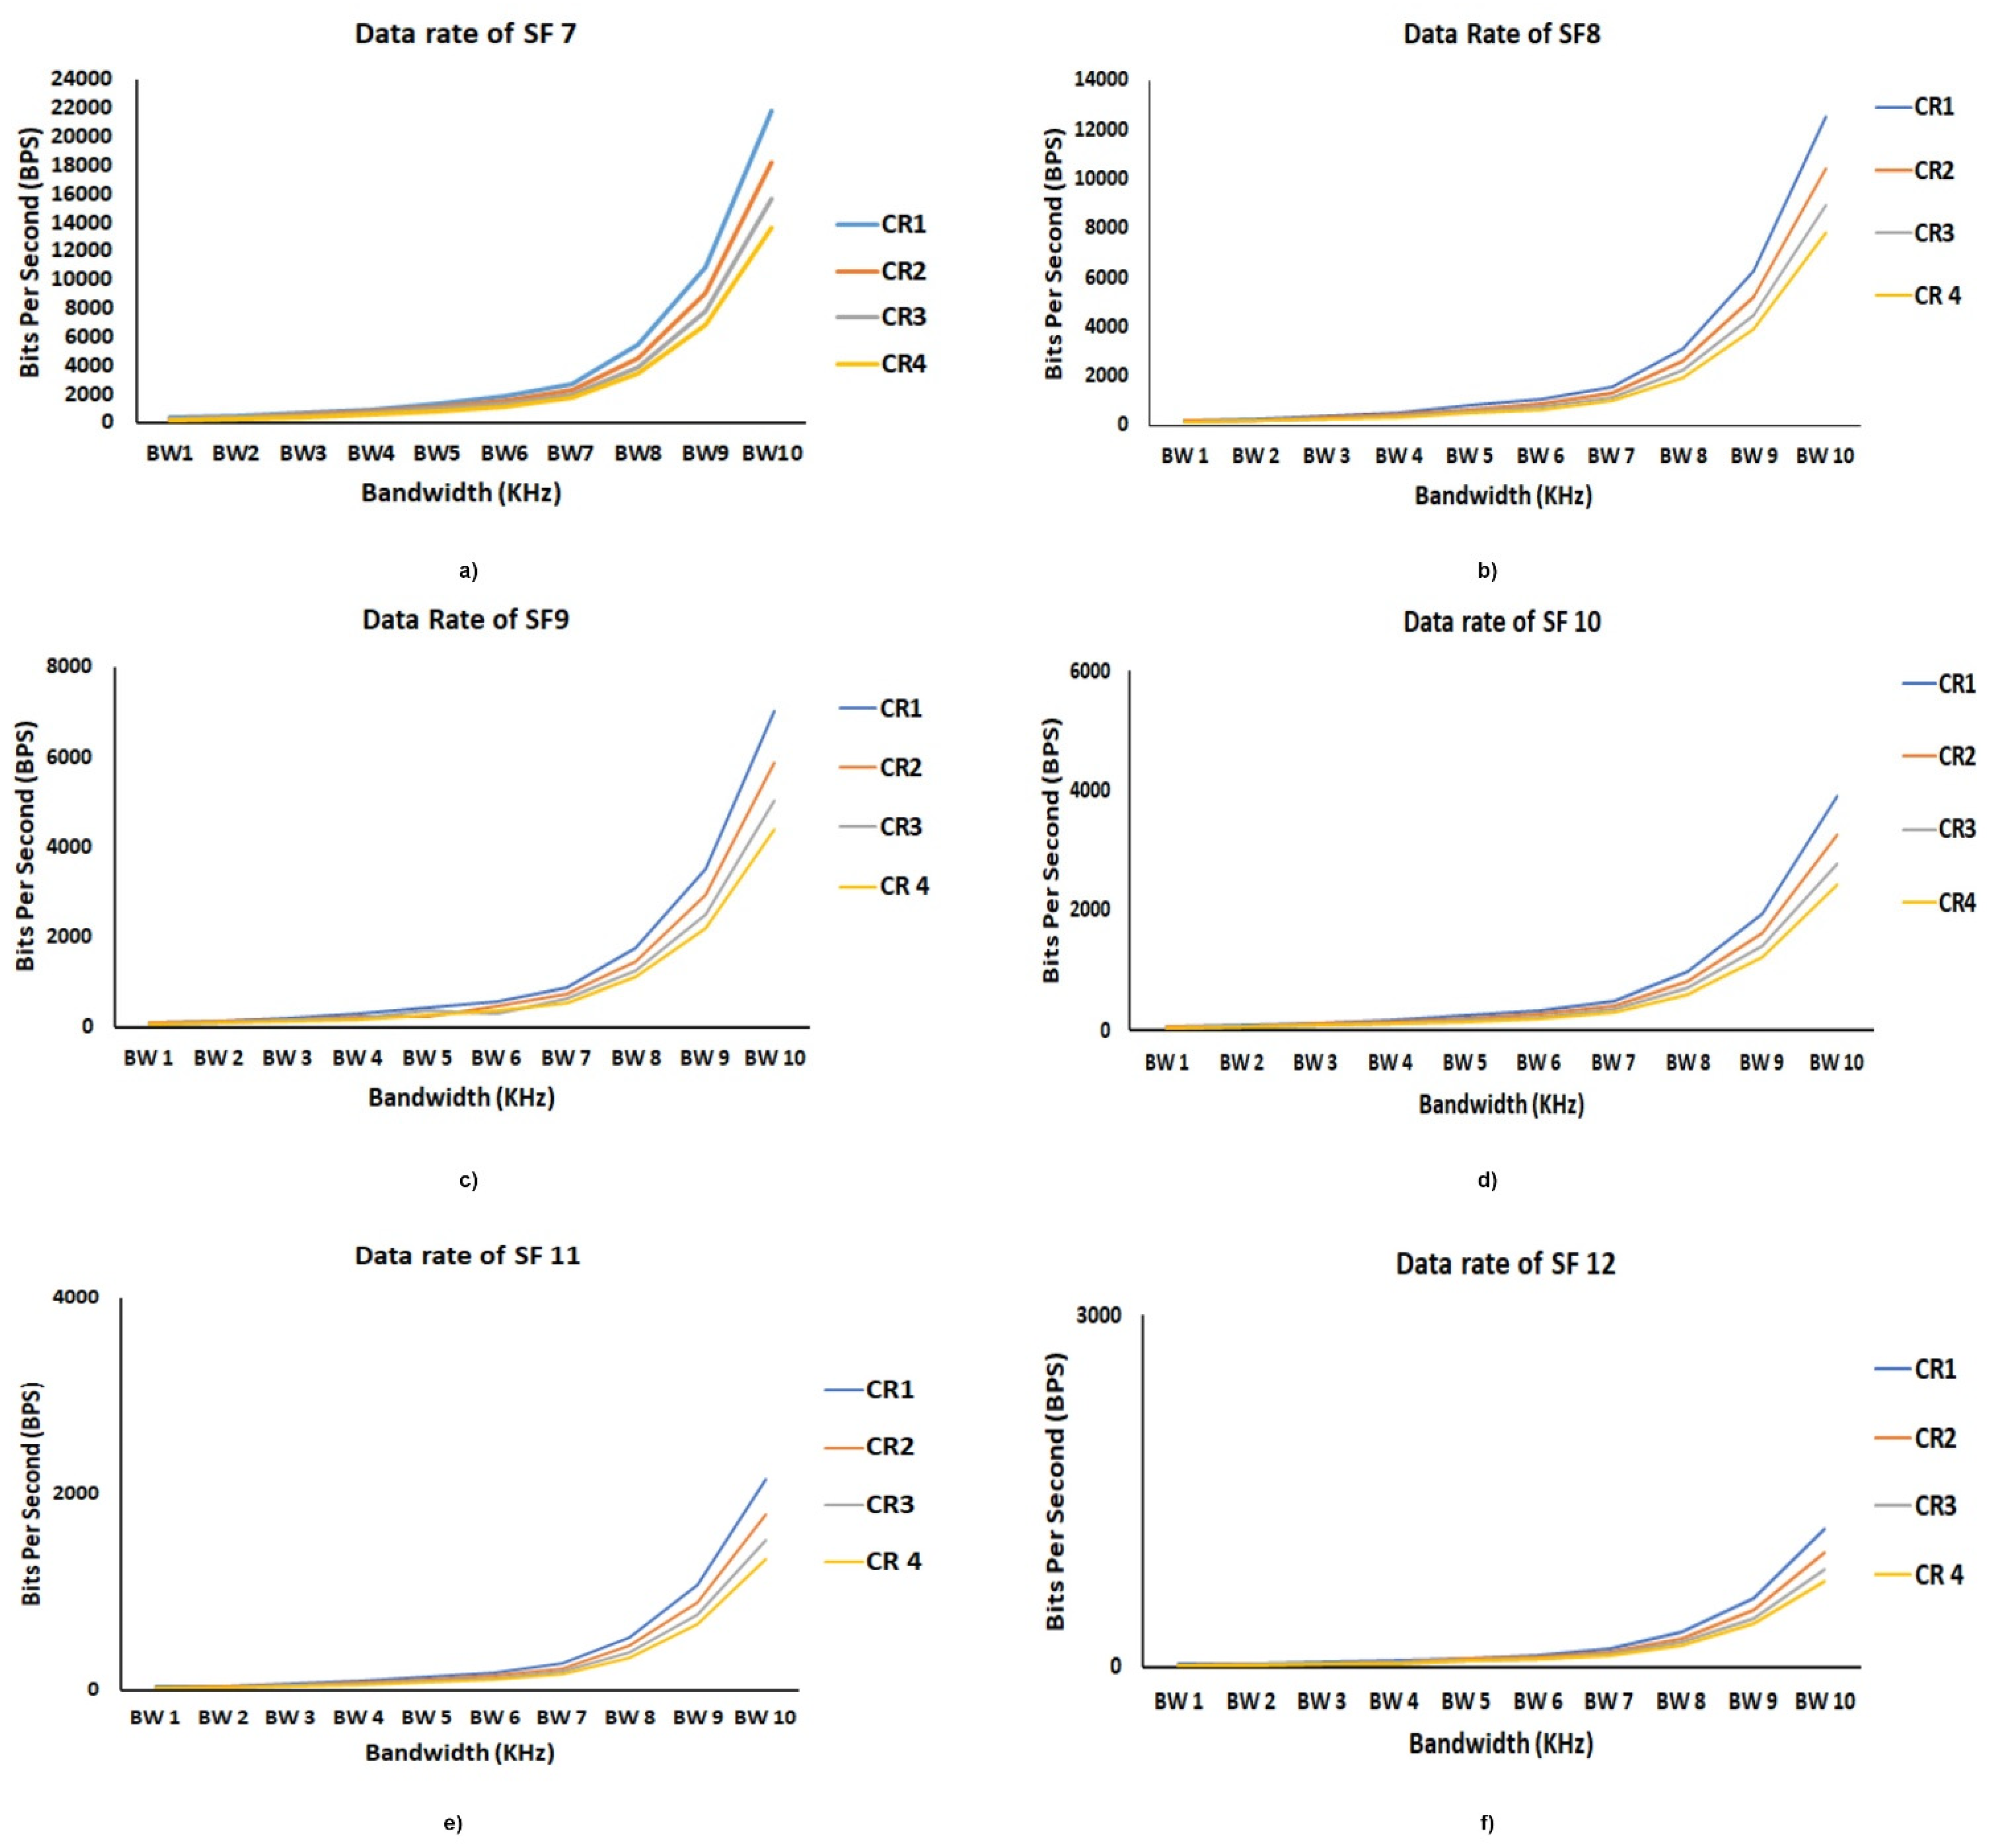
5.3. MATLAB Simulation

The MATLAB simulation platform was considered in this study for characterizing the behavior of the LoRaWAN network. A simulation model was developed in MATLAB for evaluating the effects of various parameters, such as SNR, bitrate, and SF. A sample LoRa testbed was developed on the MATLAB simulation platform. The simulation was implemented by considering the following features: a network with 10 to 100 nodes, one gateway, and one network server. The nodes were distributed both randomly and uniformly with a minimum period of 100 s. SF, transmission power, and gateway transmission power were defined as per the protocol. The SNR value was determined from the simulation result. We classified the simulation into cases as follows:
  • Case I:
LoRa trades the transmission and reception data rate for sensitivity within a given channel bandwidth. As shown in Table 3, LoRa implements an adaptive data rate by the utilization of orthogonal SFs. This allows the user to minimize the power consumption and optimize the network performance for a given bandwidth. The receiver maintains the mode of operation downlink, gate power at 27 dB, node sensitivity at −124 dB, operating frequency at 868 MHz, antenna gain at 10 dB, and node noise and node antenna gain at 30 dB. After performing the simulation, the obtained results are presented in Table 4. The results indicate that a change in antenna height from 1 to 7 m leads to significant changes in the coverage area.
For the parameters, such as frequency of 868 MHz, node sensitivity of −124 dBm, gateway node power of 10 dB, and antenna gain of 27 dB, a relationship between the height of gateway and node with range is plotted in Figure 11.
The experimental data shown in Table 5 provides a brief overview of the correlation between the height of the gateway, the height of end nodes, and the range. During data reception at the receiver, the data were interpreted; the table′s model signifies the downlink. The graph concludes that a constant link budget of 159 dBm range is directly proportional to the height of the end node and gateway. Thus, to achieve greater range coverage, it is considered that the end nodes should be mounted on cylindrical bars, as shown in Figure 11.
  • Case II
The establishment of the LoRa communication link significantly depends on the gateway height and the end node heights. Experimental data are presented in Table 5. Here the node sensitivity is −124 dBm and the operating frequency is 868 MHz, and it can be observed that the signal coverage area changes in addition to the variation in heights of the gateway and end nodes. The end node height is 2 m from the ground. If the gateway height is adjusted from 1 to 5 m, the coverage area and signal strength change drastically change from 1319 to 2946 m. This signifies that maintaining all of the parameters at a certain value will enhance the link budget strength increases because there is less interference.
  • Case III:
In this case, the following parameters were considered: node sensitivity at −137 dBm and operating frequency at 433 MHz. Now, changing the value of the gateway height significantly impacts the range. Maintained a link budget of 151 dBm, it is observed that SNR decreases because there is a low possibility of interference. The mode of operation during the experiment is downlink, i.e., data received at the receiver side. During the experiment, it was observed that at a fixed node sensitivity of −137 dBm and antenna gain of 10 dB, the custom-built sensor node varies the value of the link budget (in dB) with a change in the wide-area range coverage at a frequency of 433 MHz. This is shown in Table 6 and Figure 10. In Figure 12, a relationship between antenna gain, link budget, and range is plotted. The blue line graph shows increasing antenna gain increases the range, whereas the red line shows increasing the range in response to the link budget in LoRa. By maintaining all of the parameter values, antenna height is directly proportional to the coverage range. This signifies that deploying the LoRa receiver at a certain height can enable a strong communication link.
  • Case IV:
Transmission signal strength is optimized by setting the antenna gain from 1 to 25 dB. Here, the transmission range and link budget of the LoRa transmitter module were evaluated with a change in antenna gain. The mode of operation is uplink, as presented in Table 7. Antenna gain was changed by writing the MATLAB code for interpreting the signal strength at a frequency of 433 MHz. When gateway noise remains at 10 dB and node sensitivity at −137 dBm, the link budget increases from 141 to 166 dBm. Hence, it is concluded that by changing antenna gain, we can improve the coverage area. Thus, it is preferred to use an antenna with high gain.
Experimental parameters are presented in Table 8, and signify the importance of node sensitivity. We used a helical antenna in the design of the custom sensor node and gateway. Maintaining the uplink frequency at 433 MHz, by changing node sensitivity from −124 to −130 dBm, the sensor coverage distance increased from 945 to 3986 m. The data from Table 8 indicates that the change in node sensitivity is directly proportional to the range.
As the height of the gateway and sensor node changes, the range also varies. The variation in both gateway and end node height changes the range significantly during downlink mode at the receiver. In Figure 13, the red triangles denote the data rate, and black downward triangles signify the bit rate.
Figure 14a,b shows the relation of bit error rate, packet error rate, and symbol error rate with the spreading factor. As the spreading rate increases, there is an increase in the bit error rate. When the spreading factor is changed from 7 to 12, the bit error is minimized at SF = 6. Thus, there is a loss of data packets. It is preferred to send the data with the spreading factor so that bit error and packet error rate are minimized. To conclude, it is preferred to minimize the SF value to reduce the bit rate error. To maintain minimal collision among data packets, a lower value SF is preferred.
After computing all of the essential communication parameters of LoRa, it was found that increasing SNR affects the PER, SER, and BER. At −30 dB of SNR, BER is almost 1, which is not considered. It was also observed that with a decrease in the value of SNR to 0 dB, the error rate decreases.
To calculate the data rate of LoRa, the input parameters such as CR, SF and BW are included in the equation. Figure 15 presents the data rate of LoRa from SF 7 to SF 12. The data rate is denoted in terms of bits per second (bps). In each SF, the data rate increases at BW 7, then increases exponentially after BW 8, and reaches a limit at BW 10. We can observe that SF 7 has an inverse effect on the data rate, because the data rate steadily decreases from SF 7 to SF 12. In SF 7, the data rate of the LoRa reached 22,000 bps, and in SF 12, the data rate was limited to 2000 bps. An increase in SF will lead to transmission of a low amount of data; thus, SF 7 is the optimal SF that needs to be considered for sending a large amount of data.

6. Results of the Experimental Setup

This section discusses the deployment of sensor nodes and the gateway in a real-time environment. We also present the sensor data recorded on the cloud server and compare previous studies with the proposed research in detail. To evaluate the coverage of LoRa, we deployed the sensor nodes in a testbed located in our university center. The gateway was placed at a distance of 1 km from the sensor nodes. To analyze the customized sensor node and gateway for crop field monitoring, the sensor node was deployed in the crop field, as shown in Figure 16a,b. The sensor node was embedded with sensors for temperature, humidity, soil moisture, and fire. A 433 MHz-based LoRa was embedded in the sensor node and gateway. LoRa is a form of transceiver communication. The LoRa-based gateway was positioned 1 km from the two sensor nodes. The gateway showed effective results in terms of accurately receiving the sensory data. The gateway was also embedded with an 8266 Wi-Fi modem to communicate the data over the cloud server through the Internet. The sensory data is visible in Figure 16c.
Moreover, a hand-held device (or portable device) was also designed and implemented in real-time scenarios, shown in Figure 16d. This hand-held device will assist farmers in checking the field from a remote location and is easy to use. A hand-held device integrates LoRa communication and an ESP 8266 Wi-Fi module. These two communication modules assist in receiving the crop data regarding from the sensor node and gateway. The hand-held device is used to visualize the data of the crop field on a color LCD. The hand-held device shows the sensory data, including temperature, humidity, soil moisture, and fire detection. The gateway node logs the data on the cloud server through the Internet. Here, we used the Blynk cloud server to record the sensory data of the sensor node. The data regarding temperature and humidity can be seen in the Blynk dashboard, and is presented in Figure 17.
A comparative analysis of previous research on LoRa link budgets is depicted in Table 9. Evaluation parameters are the microcontroller unit (MCU), the communication protocol used, customized hardware designed for the sensor node, the gateway, proof of concepts, and simulation-based analysis used to validate the proposed study. The proposed study has the advantages of a communication protocol that uses both LoRa and Wi-Fi. This means the data can be collected on a local platform and the cloud platform. When designing sensor nodes, each sensor node and gateway were custom designed and built as per the requirements. Customization helped us to reduce the dimensions and architecture of the device. A simulation-based analysis was carried out to validate the proposed study, and further validated on the LoRa testbed.

7. Conclusions

IoT is transforming all applications due to its unique feature of real-time monitoring. In agriculture, IoT can enhance crop yields by integrating distance sensors and wireless communication protocols. In agriculture, implementing internet-based sensor nodes is challenging due to the unavailability of nearby agriculture fields. To overcome this, we proposed an IoT-based WSN architecture for real-time monitoring of agricultural fields. A custom sensor node and gateway were developed and implemented for sensing and communicating real-time agricultural data. In agriculture, the sensor node′s battery life plays a significant role. We implemented an energy harvesting mechanism using solar energy and a wind turbine. A MATLAB simulation was performed to evaluate the correlation of distinct parameters, such as link budget, spreading factor, and receiver sensitivity, in a custom-built LoRa testbed. Moreover, this article discusses the role of localization for deploying the sensor nodes in agricultural fields. The MATLAB simulation indicated that hybrid range-based localization algorithms are more reliable and are scalable for deployment in agricultural fields. Finally, a real-time experiment was performed to analyze the performance of the custom sensor node and gateway.

Author Contributions

M.S. and R.S. conceived the conception; M.S. and M.R. conducted literature collection and manuscript writing; D.Z., S.H., M.F.H. revised and polished the manuscript and provided valuable suggestions. All authors have read and agreed to the published version of the manuscript.

Funding

This research received no external funding.

Institutional Review Board Statement

Not Applicable.

Informed Consent Statement

Not Applicable.

Data Availability Statement

Not Applicable.

Conflicts of Interest

The authors declare no conflict of interest.

List of Abbreviations

AOAAngle of Arrival
APITApproximate Point in Triangulation
BERBit Error Rate
BWBandwidth
CRCode Rate
CSSChirp Spread Spectrum
DV hopDistance Vector hop
FECforward Error Correction
GPSGlobal Positioning System
GPRSGlobal Packet for Radios Service
IoTInternet of Things
ISMIndustrial, Scientific & Medical
LoRaLong Range
LoRaWANLoRa Wide Area Network
LPWANLow Power Wide Area Network
MCUMicrocontroller Unit
MMSMultimedia Message
NB-IoTNarrow Band-IoT
NCANeighbor Constraint Assisted
NLOSnon-line of sight
PERPacket Error rate
PAPrecision Agriculture
SFSpreading Factor
SNRSignal-to-Noise Ration
SINRSignal into Noise Ratio
RSSIReceived Signal Strength Indicator
RTOFRoundtrip-Time of Flight
TOATime on arrival
TDOATime difference of Arrival TDOA
WSNWireless Sensor Network
Wi-FiWireless-Fidelity

References

  1. World Population Projected to Reach 9.8 Billion in 2050 and 11.2 Billion in 2100. April 2021. Available online: https://www.un.org/development/desa/en/news/population/world-population-prospects-2017.html (accessed on 5 April 2021).
  2. 68% of the World Population Projected to Live in Urban Areas by 2050 Says UN. April 2021. Available online: https://www.un.org/development/desa/en/news/population/2018-revision-of-world-urbanization-prospects.html (accessed on 5 April 2021).
  3. Food Production Must Double by 2050 to Meet Demand From World’s Growing Population. April 2021. Available online: https://www.un.org/press/en/2009/gaef3242.doc.html (accessed on 5 April 2021).
  4. Ayaz, M.; Ammad-Uddin, M.; Sharif, Z.; Mansour, A.; Aggoune, E.H.M. Internet-of-Things (IoT)-based smart agriculture: Toward making the fields talk. IEEE Access 2019, 7, 129551–129583. [Google Scholar] [CrossRef]
  5. Trivelli, L.; Apicella, A.; Chiarello, F.; Rana, R.; Fantoni, G.; Tarabella, A. From precision agriculture to Industry 4.0: Unveiling technological connections in the agrifood sector. Br. Food J. 2019, 121, 1730–1743. [Google Scholar] [CrossRef]
  6. Horton, P.; Horton, P.; Horton, B.P.; Horton, B.P.; Horton, P.; Horton, P.; Horton, B.P.; Horton, B.P.; Horton, P.; Horton, P.; et al. Re-defining Sustainability: Living in Harmony with Life on Earth. One Earth 2019, 1, 86–94. [Google Scholar] [CrossRef] [Green Version]
  7. Navulur, S.; As, C.S.S.; Prasad, M.N.G. Agricultural Management through Wireless Sensors and Internet of Things. Int. J. Electr. Comput. Eng. 2017, 7, 3492–3499. [Google Scholar] [CrossRef] [Green Version]
  8. Goyat, R.; Rai, M.K.; Kumar, G.; Kim, H.J.; Lim, S.J. Improved DV-Hop Localization Scheme for Randomly Deployed WSNs. Int. J. Sens. Wirel. Commun. Control 2020, 10, 94–109. [Google Scholar] [CrossRef]
  9. Jondhale, S.R.; Deshpande, R.S. Self-recurrent neural network based target tracking in wireless sensor network using state observer. Int. J. Sens. Wirel. Commun. Control 2019, 9, 165–178. [Google Scholar] [CrossRef]
  10. Shafi, U.; Mumtaz, R.; García-Nieto, J.; Hassan, S.A.; Zaidi, S.A.R.; Iqbal, N. Precision agriculture techniques and practices: From considerations to applications. Sensors 2019, 19, 3796. [Google Scholar] [CrossRef] [Green Version]
  11. Antony, A.P.; Leith, K.; Jolley, C.; Lu, J.; Sweeney, D.J. A Review of Practice and Implementation of the Internet of Things (IoT) for Smallholder Agriculture. Sustainability 2020, 12, 3750. [Google Scholar] [CrossRef]
  12. Singh, R.K.; Aernouts, M.; De Meyer, M.; Weyn, M.; Berkvens, R. Leveraging LoRaWAN Technology for Precision Agriculture in Greenhouses. Sensors 2020, 20, 1827. [Google Scholar] [CrossRef] [Green Version]
  13. Haseeb, K.; Ud Din, I.; Almogren, A.; Islam, N. An energy efficient and secure IoT-based WSN framework: An application to smart agriculture. Sensors 2020, 20, 2081. [Google Scholar] [CrossRef]
  14. Farooq, M.S.; Riaz, S.; Abid, A.; Abid, K.; Naeem, M.A. A Survey on the Role of IoT in Agriculture for the Implementation of Smart Farming. IEEE Access 2019, 7, 156237–156271. [Google Scholar] [CrossRef]
  15. Feng, X.; Yan, F.; Liu, X. Study of Wireless Communication Technologies on Internet of Things for Precision Agriculture. Wirel. Pers. Commun. 2019, 108, 1785–1802. [Google Scholar] [CrossRef]
  16. Prathibha, S.R.; Hongal, A.; Jyothi, M.P. IoT based monitoring system in smart agriculture. In Proceedings of the 2017 International Conference on Recent Advances in Electronics and Communication Technology (ICRAECT), Bangalore, India, 16–17 March 2017; pp. 81–84. [Google Scholar]
  17. Prakash, S. Zigbee based Wireless Sensor Network Architecture for Agriculture Applications. In Proceedings of the 2020 Third International Conference on Smart Systems and Inventive Technology (ICSSIT), Tirunelveli, India, 20–22 August 2020; pp. 709–712. [Google Scholar]
  18. Saraf, S.B.; Gawali, D.H. IoT based smart irrigation monitoring and controlling system. In Proceedings of the 2017 2nd IEEE International Conference on Recent Trends in Electronics, Information & Communication Technology (RTEICT), Bangalore, India, 19–20 May 2017; pp. 815–819. [Google Scholar]
  19. Ramachandran, V.; Ramalakshmi, R.; Srinivasan, S. An automated irrigation system for smart agriculture using the Internet of Things. In Proceedings of the 2018 15th International Conference on Control, Automation, Robotics and Vision (ICARCV), Singapore, 18–21 November 2018; pp. 210–215. [Google Scholar]
  20. Saqib, M.; Almohamad, T.A.; Mehmood, R.M. A Low-Cost Information Monitoring System for Smart Farming Applications. Sensors 2020, 20, 2367. [Google Scholar] [CrossRef] [Green Version]
  21. Siddique, A.; Prabhu, B.; Chaskar, A.; Pathak, R. A review on intelligent agriculture service platform with lora based wireless sensor network. Life 2019, 100, 7000. [Google Scholar]
  22. Ji, M.; Yoon, J.; Choo, J.; Jang, M.; Smith, A. Lora-based visual monitoring scheme for agriculture iot. In Proceedings of the 2019 IEEE Sensors Applications Symposium (SAS), Sophia Antipolis, France, 11–13 March 2019; pp. 1–6. [Google Scholar]
  23. Alrajeh, N.A.; Bashir, M.; Shams, B. Localization Techniques in Wireless Sensor Networks. Int. J. Distrib. Sens. Netw. 2013, 9, 304628. [Google Scholar] [CrossRef] [Green Version]
  24. Aghaie, N.; Tinati, M.A. Localization of WSN nodes based on NLOS identification using AOAs statistical information. In Proceedings of the 2016 24th Iranian Conference on Electrical Engineering (ICEE), Shiraz, Iran, 10–12 May 2016; pp. 496–501. [Google Scholar]
  25. Pak, J.M.; Ahn, C.K.; Shi, P.; Shmaliy, Y.S.; Lim, M.T. Distributed Hybrid Particle/FIR Filtering for Mitigating NLOS Effects in TOA-Based Localization Using Wireless Sensor Networks. IEEE Trans. Ind. Electron. 2016, 64, 5182–5191. [Google Scholar] [CrossRef]
  26. Jawad, H.M.; Nordin, R.; Gharghan, S.K.; Jawad, A.M.; Ismail, M. Energy-Efficient Wireless Sensor Networks for Precision Agriculture: A Review. Sensors 2017, 17, 1781. [Google Scholar] [CrossRef] [PubMed] [Green Version]
  27. Mekki, K.; Bajic, E.; Chaxel, F.; Meyer, F. A comparative study of LPWAN technologies for large-scale IoT deployment. ICT Express 2019, 5, 1–7. [Google Scholar] [CrossRef]
  28. Chaudhari, B.S.; Zennaro, M.; Borkar, S. LPWAN Technologies: Emerging Application Characteristics, Requirements, and Design Considerations. Future Internet 2020, 12, 46. [Google Scholar] [CrossRef] [Green Version]
  29. Lee, H.-C.; Ke, K.-H. Monitoring of Large-Area IoT Sensors Using a LoRa Wireless Mesh Network System: Design and Evaluation. IEEE Trans. Instrum. Meas. 2018, 67, 2177–2187. [Google Scholar] [CrossRef]
  30. LoRa Modulation Basics. Available online: http://www.semtech.com/images/datasheet/an1200.22.pdf (accessed on 7 April 2021).
  31. Huang, Q.; Selvakennedy, S. A range-free localization algorithm for wireless sensor networks. In Proceedings of the 2006 IEEE 63rd Vehicular Technology Conference, Melbourne, VIC, Australia, 7–10 May 2006; Volume 1, pp. 349–353. [Google Scholar]
  32. He, T.; Huang, C.; Blum, B.M.; Stankovic, J.A.; Abdelzaher, T. Range-free localization schemes for large scale sensor networks. In Proceedings of the 9th Annual International Conference on Mobile Computing and Networking, San Diego, CA, USA, 14–19 September 2003; pp. 81–95. [Google Scholar]
  33. Paul, A.K.; Sato, T. Localization in Wireless Sensor Networks: A Survey on Algorithms, Measurement Techniques, Applications and Challenges. J. Sens. Actuator Netw. 2017, 6, 24. [Google Scholar] [CrossRef] [Green Version]
  34. Langendoen, K.; Reijers, N. Distributed localization in wireless sensor networks: A quantitative comparison. Comput. Netw. 2003, 43, 499–518. [Google Scholar] [CrossRef]
  35. Mao, G.; Fidan, B.; Anderson, B.D. Wireless sensor network localization techniques. Comput. Netw. 2007, 51, 2529–2553. [Google Scholar] [CrossRef] [Green Version]
  36. Srinivasan, A.; Wu, J. A survey on secure localization in wireless sensor networks. In Encyclopedia of Wireless and Mobile Communications; Auerbach Publications: Boston, MA, USA, 2007; p. 126. [Google Scholar]
  37. Niculescu, D.; Nath, B. Ad hoc positioning system (APS) using AOA. In Proceedings of the IEEE INFOCOM 2003. Twenty-second Annual Joint Conference of the IEEE Computer and Communications Societies (IEEE Cat. No. 03CH37428), San Francisco, CA, USA, 30 March–3 April 2003; Volume 3, pp. 1734–1743. [Google Scholar]
  38. Youssef, A.M.; Youssef, M. A taxonomy of localization schemes for wireless sensor networks. In Proceedings of the ICWN, Las Vegas, NV, USA, 25–28 June 2007; pp. 444–450. [Google Scholar]
  39. Niu, R.; Vempaty, A.; Varshney, P.K. Received-Signal-Strength-Based Localization in Wireless Sensor Networks. Proc. IEEE 2018, 106, 1166–1182. [Google Scholar] [CrossRef]
  40. Mesmoudi, A.; Feham, M.; Labraoui, N. Wireless sensor networks localization algorithms: A comprehensive survey. arXiv 2013, arXiv:1312.4082. [Google Scholar] [CrossRef]
  41. Roopaei, M.; Rad, P.; Choo, K.K.R. Cloud of things in smart agriculture: Intelligent irrigation monitoring by thermal imaging. IEEE Cloud Comput. 2017, 4, 10–15. [Google Scholar] [CrossRef]
  42. Suma, D.N.; Samson, S.R.; Saranya, S.; Shanmugapriya, G.; Subhashri, R. IOT Based Smart Agriculture Monitoring System. Int. J. Recent Innov. Trends Comput. Commun. 2017, 5, 177–181. [Google Scholar]
Figure 1. LoRa Physical, Application, and MAC layers of protocol architecture.
Agronomy 11 00820 g001
Figure 2. Classification of localization schemes for sensor networks.
Agronomy 11 00820 g002
Figure 3. LoRa end node custom design for agriculture farm.
Agronomy 11 00820 g003
Figure 4. LoRa-based gateway.
Agronomy 11 00820 g004
Figure 5. Circuit diagram of the sensor node.
Agronomy 11 00820 g005
Figure 6. Block diagram of IoT-based farm automation using a solar panel.
Agronomy 11 00820 g006
Figure 7. Flow chart for execution of localization of algorithms.
Agronomy 11 00820 g007
Figure 8. Sensor node communication establishment using LoRa link.
Agronomy 11 00820 g008
Figure 9. Sensor node energy conservation using renewable resources in an agriculture field.
Agronomy 11 00820 g009
Figure 10. LoRa simulation platform with simulation parameters.
Agronomy 11 00820 g010
Figure 11. Gateway height versus range in meters.
Agronomy 11 00820 g011
Figure 12. Link budget variation with range.
Agronomy 11 00820 g012
Figure 13. Link budget variation with range.
Agronomy 11 00820 g013
Figure 14. (a,b) PER, SER, and BER versus the signal to noise ratio and BER versus SF = 6.
Agronomy 11 00820 g014
Figure 15. Data rate of LoRa from SF 7 to SF 12.
Agronomy 11 00820 g015
Figure 16. Real-time experimental setup of the sensor node and gateway.
Agronomy 11 00820 g016
Figure 17. Blynk dashboard.
Agronomy 11 00820 g017
Table 1. Technical specifications of communication protocols [26].
ParametersZig-BeeBluetoothBLEWi-FiGPRSLoRaNB-IoTSigFox
Frequency band868/915 MHz and 2.4 GHz2.40 GHz2.40 GHz2.40 GHz900 to 1800 MHz869 to 915 MHzLicensed LTE frequency bands868 to 915 MHz
Network sizeApprox. 65,000Approx. 8Limited applicationApprox 32Approx 100010,000 no of (nodes per BS)52,000 devices/channel/cel1,000,000 no. of (nodes per BS
Network TopologiesP2P, tree, star, meshScatter-net
Topology
Star-bus
topology
Point-to-hub
topology
Cellular system
Topology
Star-of-starsStar topologyStar topology
Channel bandwidthEqual to 2 MHz1 MHz1 MHz22 MHz200 kHz<500 KHz200 kHz200 kHz
Power consumption in TxmodeAround 36.9 mWAround 215 mWAround 10 mWAround 835 mW560 mW100 mWNA122 mW
ApplicationWPANs, WSNs,
and Agriculture
WPANsWPANsWLANsAMI, demand response, HANAgriculture, Smart grid,
environment control,
and lighting control
Smart metering, Tracking of persons, animals, or objects, etc. Agriculture and environment, automotive,
buildings, and
consumer electronics
LimitationsMandatory line-of-sightShort communication rangeShort communication rangeHigh power consumption and high latency (13.74 s)Power consumption problemNetwork size(scalability), data rate, and message capacityIncapable of a seamless handover between cells and does not provide low latency application Low data rates
Table 2. Localization algorithms (range free vs. hybrid range-based) [40].
ParametersFully Range Free Based AlgorithmsHybrid Range Based Algorithm
CANCADV-HoPATPAEATLFRTL
Node deploymentBoth uniform and randomRandomRandomRandomBoth uniform and randomRandom
Node densityLowLowHighHighLowMedium
Existence of obstacleYesYesYesYesYesYes
Anchor node presenceYesYesYesYesYesYes
Range estimationComputationalComputationalComputationalComputationalComputationalComputational
Range combinationCentroidCentroidTOA, TDOATOATDOARSSI
Localization co-ordinatesRD3D2D2D2D2D
ScalabilityYesYesNoYesYesYes
AccuracyLowLowMediumVery HighVery HighHigh
Table 3. Adaptive data rate of LoRa.
SFChirpsSNRToAData Ate
7128−8.5122 ms6345 bps
8256−11189 ms4425 bps
9512−15.48235 ms2118 bps
101024−18.5381 ms1233 bps
112048−15.48235 ms2118 bps
124096−18.5381 ms1233 bps
Table 4. Range and link budget at node sensitivity—124 dBm.
Mode
(Down Link)
Gateway Height
in Meter
End Node Height in
Meter
Link Budget dBmRange in Meter
Down Link11159932
Down Link211591318
Down Link311591614
Down Link411591683
Down Link511592083
Down Link611592282
Down Link711592465
Table 5. Range and link budget at node sensitivity of −124 dB.
Mode
(Down Link)
Gateway Height in MeterEnd Node Height in MeterLink Budget dBmRange in Meter
Down Link121591319
Down Link221591863
Down Link321592282
Down Link421592635
Down Link521592946
Table 6. Range and link budget at node sensitivity of −137 dBm.
Mode
(Down Link)
Gateway Height in MeterEnd Node Height in MeterLink Budget dBmRange in Meter
Down Link111511681
Down Link211512377
Down Link311512911
Down Link411513362
Down Link511513758
Table 7. Link budget in dBm from 141 to 164 dBm for the transmitter LoRa module.
Mode
(Up Link)
Antenna
Tx Gain in dB
Link Budget
dBm
Range in
Meter
Range in
Square KM
Up Link01419453
Up Link114210013
Up Link214310613
Up Link314411234
Up Link414511904
Up Link514612604
Up Link1015116818
Up Link15156224116
Up Link25166398628
Table 8. Range for the node sensitivity from −124 to −132 dBm.
Mode (Up Link)FrequencyNode
Sensitivity
in dBm
Range in MeterRange in Square KM
Up Link433−1249453
Up Link433−12510013
Up Link433−12610613
Up Link433−12711234
Up Link433−12811904
Up Link433−12912604
Up Link433−13016818
Up Link433−131224116
Up Link433−132398628
Table 9. Comparison of the LoRa-based agriculture research with the present study.
ResearchCommunication
Protocol
Custom End NodeCustom GatewayHand-Held for FarmerLink Budget ValidationLoRa SimulationPlot of Evaluation Metrics
[12]LoRaNoNoNoYesYesyes
[13]LoRaNoNoNoYesYesyes
[41]WiFiNoNoNoYesYesyes
[42]WiFiNoNoNoYesYesyes
Proposed
study
LoRa + WiFi
(with optimized embedded firmware)
Yes (customized)Yes
(custom design)
Yes
(customized)
YesSimulation + validation on hardware Yes
Publisher’s Note: MDPI stays neutral with regard to jurisdictional claims in published maps and institutional affiliations.

