Abstract
Potato is an important food crop with high water-use-efficiency but low drought tolerance. The bottleneck in drought tolerance breeding is phenotyping in managed field environments. Fundamental research on drought tolerance is predominantly done in container-based test systems in controlled environments. However, the portability of results from these systems to performance under field conditions is debated. Thus, we analyzed the effects of climate conditions, container size, starting material, and substrate on yield and drought tolerance assessment of potato genotypes compared to field trials. A leave one out assessment indicated a minimum of three field trials for stable tolerance prediction. The tolerance ranking was highly reproducible under controlled-conditions, but weakly correlated with field performance. Changing to variable climate conditions, increasing container size, and substituting cuttings by seed tubers did not improve the correlation. Substituting horticultural substrate by sandy soil resulted in yield and tuber size distributions similar to those under field conditions. However, as the effect of the treatment × genotype × substrate interaction on yield was low, drought tolerance indices that depend on relative yields can be assessed on horticultural substrate also. Realistic estimates of tuber yield and tuber size distribution, however, require the use of soil-based substrates.
1. Introduction
Global climate change models predict altered precipitation patterns and increased air temperatures, which result in more arid conditions during the cultivation period of many crops [1]. The alleviation of drought effects by irrigation meets restrictions by rising competition for decreased fresh water resources by industry and domestic use [2]. Water saving irrigation techniques like drip-irrigation and deficit irrigation provide partial solutions [3]. Thus, there is a high demand for water-efficient crops [4,5]. Among the most important crops, potato (Solanum tuberosum) has the highest water use efficiency with regard to the food calories produced per water volume [3,6]. However, tetraploid potatoes (Solanum tuberosum ssp. tuberosum L.) are drought-sensitive because of shallow rooting and low recovery capacity after drought stress [7,8,9,10]. Studies on wild ancestors of S. tuberosum and on modern European potato cultivars found significant genetic variation for drought tolerance as a basis for the breeding of drought tolerant potato genotypes [11,12,13,14,15]. Traditionally, potato breeding is based on rather slow phenotypic recurrent selection [6,16,17]. In wheat and maize, selection on yield in arid environments has proved to result in a significant improvement of yield under arid conditions [18,19]. However, although these traditional techniques are effective, they are too slow to meet the pressing demand for an improved water-efficiency of crops within the next decade. Modern methods like marker-assisted selection based on genetic or metabolic marker or genomic selection can be employed in the early breeding and reduce the breeding cycle from ten to four years [6,20,21,22]. The identification of markers and the training of marker models for the target population requires the phenotyping of many genotypes for drought tolerance. Ideally, the phenotyping is done in multi-environment trials and managed environments, where field trials in arid target environments are repeated over several years [2]. Thus, plants are exposed to the timing and degree of drought stress, the combination with heat or salinity stress, and the agricultural management, which is typical for on-farm production in the target environment [2,23,24]. Large scientific consortia and commercial companies have shown the power of this approach, especially for maize [2,24]. However, smaller companies and scientific settings need proxy methods that allow mimicking agricultural drought stress scenarios under climate chamber or greenhouse conditions.
Fundamental research on drought stress, especially on the molecular drought stress response of Arabidopsis thaliana, mainly relies on axenic agar culture. In these systems, drought stress is applied by removing plants from the medium and exposing them to intense short-term drought stress [25]. Alternatively, plants are cultivated on agar plates, in which the medium’s water potential is decreased by osmolytes like mannitol or PEG [26,27,28]. The latter system differs from the situation in the field by the high humidity/low water vapor pressure deficit (VPD) of the air space in agar plates and by the high osmotic component of the substrate water potential. In contrast, low water potentials in natural soils have a small osmotic component unless they are also saline. Furthermore, dry soils have a high resistance to water movement [29]. As drought stress researchers are generally aware of the shortcomings of agar-based systems, findings from these systems are checked in soil-grown plants. In these approaches, plants are grown on peat-based horticultural substrate under climate chamber conditions, in climate-controlled glasshouses, or screenhouses with variable climate conditions [14,30,31,32].
In the fastest screens, drought tolerance is quantified by assessing physiological response or the survival after stopping the irrigation and reapplying water after a set period [33,34,35]. This approach can be misleading if the size of the compared genotypes differ significantly, as the lower transpiration of smaller plants will result in a higher soil water content at the end of the period without irrigation. Furthermore, survival assays are very far from the agricultural situation, in which yield not survival is the target trait [36]. Thus, most researchers perform drought tolerance assessment by measuring the plant’s response to a reduced soil water potential that is kept constant by adding the water lost by evapotranspiration. Controlled irrigation is done laboriously by manual weighting and watering or automatically in phenotyping platforms [32,37,38]. This approach compensates for the effect of plant size on water-use. The results on drought tolerance QTL in maize and barley found in these systems are similar to those found under field conditions [38,39]. Mimicking this approach by manual weighing and watering is possible but laborious, which imposes a considerable restriction on the number of testable genotypes [40,41]. Furthermore, the constant water content approach differs from the field setting. In the field, all plants receive the same amount of water by precipitation or irrigation. The plants can only reach more water if they extend their roots into deeper soil layers and thus make use of excess precipitation in humid times. The impact of this drought avoidance adaptation on yield under drought stress is very difficult to assess in experiments, where plants grow in rather small pots [42,43].
However, not every researcher interested in drought tolerance in potato has access either to large managed field trials or to sophisticated phenotyping platforms. Thus, we like to establish, which factors are critical for the assessment of drought tolerance in container trials. Therefore, we performed a meta-analysis on the yield and drought tolerance data of potato genotypes in container-based experiments and field trials. Drought stress was applied by deficit irrigation, in which stressed plants received a fixed percentage of the irrigation volume required for optimal growth. Drought tolerance was assessed by the DRYMp (deviation of relative starch yield from the median of parent check genotypes) [14,21]. Drought trials were conducted on three populations with a total of 90 genotypes in controlled environments and under variable climate conditions in a screenhouse. The yield and tolerance results were compared to those from field trials conducted on three different sites between 2011 and 2018. The analysis revealed that a minimum of three field trials is required to obtain a stable drought tolerance ranking of the genotypes. Among the factors analyzed, pot size and planting material (in vitro cuttings or seed tubers) had but a weak effect on the tolerance assessment. In contrast, the substrate type affected the reproducibility of observations from field trials in container experiments considerably.
2. Materials and Methods
In this study, we performed a meta-analysis on data from 32 drought stress trials (Table 1) performed between 2011 and 2020 on three different populations of potato (Solanum tuberosum ssp. tuberosum L.). Population 1 contained 34 German potato cultivars, predominantly optimized for starch production, from nine different breeders. The data on this population have been analyzed and published with respect to the variability of drought tolerance and the relationship between yield potential and drought tolerance [14]. The data were reanalyzed in the context of this manuscript to illustrate the problem linked to container trials. Population 2 contained four cultivars (A, D, E, R) from population 1 and 60 offsprings of crosses between A × E (31 genotypes) and E × R (29 genotypes) [21]. Ten of these offsprings (five of each cross), the four cultivars A, D, E, and R and seven additional cultivars from population 1 were studied in population 3. Further details on the genotypes are given in Supplementary File S1, Figure S1.

Table 1.
Metadata on potato drought stress trials. Trial-Code First letter: F = field trial, P = pot trial, B = bigbag trial, second letter: T = starting material tuber, C = starting material cutting, third letter: S = sandy soil based substrate, H = horticultural substrate, final letters: counter. P = population, Culture = culture id in the plant database [44], n = number of replicates, Pl = number of plants per replicate, G = number of genotypes, start date = planting date, end date = date of haulm destruction, SI = stress index [14].
2.1. Experiments on Population 1
The drought stress trials on population 1 were performed in parallel either in pots or in managed field environments (details see Table 1 and [14]). In the pot trials, plants were grown from in vitro cuttings and cultivated in 4L-pots on horticultural substrate in a screenhouse (2 experiments) or in a climate-controlled glasshouse (CE, 4 experiments). Temperature in the CE was set to 21 °C (16 h day) and 18 °C (8 h night) and artificial light was provided by 62,400-W-AgrosonT lamps/100 m2. Natural light penetration through the roof was approximately 50% of the outside light intensity. The drought treatment was imposed by reducing the volume of the irrigation water to a fixed percentage (30% or 70%) of the volume required for optimal water supply. The optimal water supply was determined by weighing representative pots to estimate when the soil water content has decreased below 40% of full capacity. Drought-stress (treatment = s) was applied by reducing the water supply to 30% (6 experiments) or 70% (Experiment PCH11) of the irrigation volume received by the control plants that were cultivated under optimal water supply (treatment = c). The reduction was done by increasing the intervals between irrigations rather than by decreasing the amount of water given during the irrigation event. Water stress was applied from two weeks after planting until tuber harvest. The spatial design was a randomized split-plot design.
In the field trials, plants were grown from tubers on sand in Potsdam-Golm (Golm, 52°23′55″ N 13°3′56″ E) or sandy loam in Dethlingen (51°57′17″ N 10°07′33″ E) and Groß-Lüsewitz (54°04′12″ N 12°20′19″ E) between 2011 and 2013 (8 experiments, see Table 1). In Groß-Lüsewitz, drought-stressed plants were grown under rainout shelters and received no irrigation after emergence. On the two other sites, drought treatment relied on the low natural precipitation and low soil water capacity on the sites. Drought treatment by differential irrigation was started after plant emergence. On the site Potsdam-Golm, control plants received 10 L/m2 when wilting occurred at midday. Drought-stress plants were irrigated with 10 L/m2 when wilting was observed at 7:00. On the site Dethlingen, control plants were irrigated with an overhead irrigation system once the soil water capacity had been predicted to decrease below 50% of the field capacity by the soil moisture prediction model of the Deutsche Wetterdienst. Stressed plants received no irrigation but precipitation. The stress index SI (1 minus relative starch yield [14]) is given in Table 1. The drought score before and after flowering can be found in supplemental material Table S3 at [14]. The spatial design was randomized block design, details on the number of replicates and plants per replicate are given in Table 1.
In all experiments, drought tolerance was assessed based on the tuber starch yield. Tubers with a diameter >10 mm were harvested, weighted, and the starch content was determined gravimetrically or by dry weight determination (CE experiments). The starch yield was calculated as the product of starch content and tuber fresh weight. For further experimental details, see [14]. Yield and climate data are available at E!DAL [45,46].
2.2. Experiments on Population 2
All drought stress trials on population 2 were performed under naturally variable climate conditions. Plants grown from cuttings were cultivated in pots on horticultural substrate under a shelter (PCH19, PCH24) or in 30L-bigbags with horticultural substrate in a polytunnel screenhouse (BCH15, BCH20). Drought stress was applied as described before, with drought-stressed plant receiving 50% of the water-volume supplied to control plants. In parallel, genotypes of population 2 were grown from tubers on the three field sites as described above in 2015 and 2016. The onset of drought stress can be retrieved from the irrigation data shown in Figure 3 of [21] and in file ‘climate_VALDIS_vpd_water_supply.csv’ available at E!DAL [47]. Drought stress and yield phenotyping were done as described before. Plants in the stress-treatment were grown under rainout shelters at the sites Groß Lüsewitz and Golm. The experimental design was a randomized block design, details on replicates, start and end date are available in Table 1. Planting density was 44,000 plants/ha. Further experimental details are given in [21]. Original climate and phenotyping data can be retrieved from E!DAL [47].
2.3. Experiments on Population 3
Field experiments on population 3 (21 genotypes) were performed in 2017 and 2018 in the field site Potsdam-Golm as described in [21]. Four bigbag experiments were performed between 2017 and 2020 in the polytunnel screenhouse at the MPI-MP Golm. As in the field trials, plants were grown from tubers that were chitted for at least eight weeks at 6–8 °C in dim light before planting (planting dates see Table 1). In 2017 to 2019, all 20 genotypes were grown on 30 L peat-based horticultural substrate, a mixture of 1 part sand and 2 parts substrate type T (Kausek, Mittenwalde, Germany) mixed with 30 g Novatec classic per 30L-bigbag (Experiments BTH25, BTH27 and BTH29). Additionally, the cultivars A, D, E, and R were grown on sand (A horizon of a Podsol from Potsdam-Golm, Germany) fertilized with the same amount and type of fertilizer (experiment BTS30). In 2020, all 20 cultivars were grown on the soil-based system (BTS32) and the cultivars A, D, E and R were grown additionally in an horticultural substrate- based system (BTH31). The experimental design was a randomized-block design with treatment as block and genotype as subplots (replicates and plants per replicate see Table 1).
Stress treatment was started at BBCH15 and applied as described before: during the stress treatment, plants received the same amount of water per irrigation like the control plants but the interval between the irrigation was increased to achieve a final irrigation volume in the stress treatment equivalent to 50% of the optimal water supply in the controls. In addition to the control treatment (cc) and the stress treatment (ss), an early (sc) and late (cs) stress treatment was applied. The treatment switch was performed at flowering stage and all plant were watered to 60% of the soil water capacity at the switch date. Plants on early stress received reduced irrigation before the switch date, plants on late stress after the switch date. Details of the times and volumes of irrigation and precipitation can be found in Supplemental File S1, Figure S2, and in file ‘Water_2017_2020.csv’ at E!DAL [48]. Humidity and temperature of the soil was measured every hour at a depth of 15–20 cm below the surface in randomly chosen replicates of the cultivars A, D, E, and R in all treatments by Plantcare sensors (Plantcare, Ruchikon, Switzerland). In the field treatment, treatment ss and cs (2017) or sc (2018) grew under a rainout shelter, the other treatments were grown without a shelter. The water volume received in each treatment by irrigation and precipitation is depicted in Supplementary File S1, Figure S2. The air temperature was measured every 15 min (polytunnel) or every 1 min (field) by an HC2-S3 sensor, shielded with a SS3 radiation shield (UP Umweltanalytische Produkte, Cottbus) approximately 1.5 m above ground at a weather station adjacent to the experimental sites in the polytunnel and the field. Air temperatures and substrate/soil temperatures are shown in Supplemental File S1, Figures S3 and S4, respectively.
The experiments were terminated by the removal of the shoots when a thermal sum of 1400 day × C° (d°C) was reached. The thermal sum was calculated as the sum of the average between minimum and maximum air temperature starting from the day of tuber planting with a base temperature of 6 °C and a maximum temperature of 30 °C [21]. Within two weeks after termination of the experiments, tubers with a diameter >10 mm were harvested manually. Tuber fresh weight, starch content and tuber number in the size classes below 35 mm, 35 mm to 60 mm, and above 60 mm were determined as described before [14]. All data are available at E!DAL [48].
2.4. Statistical Evaluation
All statistical evaluations were performed in SAS (version 9.4, SAS Institute, Cary); scripts are available on request from the corresponding author.
Starch yield (SY) was calculated per replicate as a product of tuber fresh weight and starch content. Relative starch yield (RelSY) was calculated per replicate of each Genotype Ga by dividing the starch yield of the replicates with stress treatments (Ts = s, ss, sc or cs) by the mean starch yield of all replicates of the same genotype Ga from treatment c or cc of the same experiment Eb.
The deviation of the starch yield from the experimental median (DRYM) [21] was calculated as the difference between RelSY of a genotype Ga from treatment Ts and the median of the relative starch yield of the all cultivars from the same experiment Eb and treatment Ts.
The deviation of the starch yield from the parental median (DRYMp) [21] was calculated as the difference between RelSY of a genotype from treatment Ts and the median of the relative starch yield of the parent cultivars (Gp = A, R, and E) from the same experiment Eb and treatment Ts.
Spearman correlation analysis was performed with proc CORR on the mean DRYMp values for each genotype for the experiments performed on population 1. We performed a leaf one out analysis (LOOA) to estimate the power of a subset of field trials to assess drought tolerance. For LOOA, m (m = 2–7) experiments were selected randomly 21 times from the subset of eight field experiments on population 1 using proc SURVEYSELECT. The mean DRYMp was calculated for the selected experiments (DRYMp(m)) and for all eight experiments (DRYMp(8)). The Spearman correlation coefficient was calculated for the correlation between DRYMp(m) and DRYMp(8).
All analysis of variance and analysis of covariance on the effects of cultivar and treatment on tuber number, tuber fresh weight and starch yield were performed with proc GLM (method SS3), which adjusts the analysis for unbalanced designs. The Ryan-Einot-Gabriel-Welsh (REGW) test, which adjusts the test statistic for multiple testing, was used for means comparisons.
For population 1 and population 2, we tested the effects of type (pot, field for population 1; pot, bigbag and field for population 2), treatment (control, stress) and genotype (34 cultivars for population 1, 63 genotypes for populations 2) on starch yield per plant. The analysis was performed separately on each population. Correlation analysis on the relationship between DRYMp values calculated from starch yields in different test systems was calculated on mean DRYMp values for each cultivar calculated separately for the test systems pot, bigbag, and field (proc CORR, method Pearson correlation).
For population 3, data analysis was performed on the data for the four cultivars A, D, E, and R that had also been part of population 1 and 2. For a direct comparison of field and bigbag trials grown from seed tubers, the effect of genotype, trial type, treatment, year, and their interaction on tuber fresh weight FW and starch yield SY was analyzed for the experiments conducted in 2017 and 2018. To assess the substrate effect, an ANOVA on the effects of substrate, treatment, genotype and their interaction on FW and SY data was performed separately for the years 2019 and 2020, as a joint analysis revealed a highly significant interaction between substrate, treatment, and year.
The effect of genotype (A, D, E, R) and planting material (cuttings, tubers) on tuber numbers in the three size classes S, M, and L was analyzed in the datasets from bigbag trials with horticultural substrate performed in 2017 to 2020. Data from control and stress (ss) treatments were analyzed separately.
3. Results
3.1. Comparison of Potato Cultivars in Field and Pot Experiments
In the first years of the study (2011 to 2013), 34 potato cultivars (population 1) were characterized for starch yield and drought tolerance in eight field trials (F) and six pot (P) experiments. Plants were grown under optimal (control) and reduced water supply (drought) until tuber maturity. Field trials and pot experiments differed in several parameters, namely starting material (tubers (T) in field trials, cuttings (C) in pot experiments), substrate volume (field versus 4 liter-pots) and substrate type (soil (S) in field trials, peat-based horticultural (H) substrate in pot trials). Furthermore, all field trials and two of the pot experiments were conducted under naturally variable climate conditions, whereas four pot trials (marked with an asterisk in Figure 1 and Figure 2) were grown in a climate-controlled glasshouse with minimal (<4 K/24 h) temperature fluctuations.
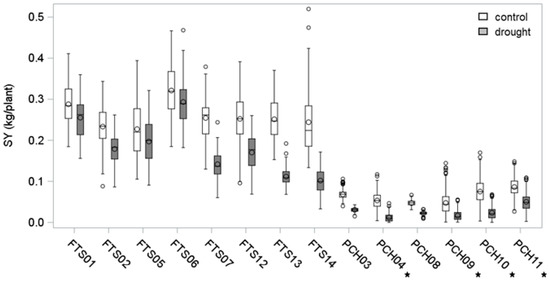
Figure 1.
Starch yield in field and pot test systems. Distribution of tuber starch yield of 34 potato cultivars (population 1) grown in the field (F) or pots (P) under optimal (control) or reduced (drought) water supply. Plants in pots were grown from cuttings (C) on horticultural substrate (H), field plants were grown from tubers (T) on natural soil (S). Experiments under controlled climate conditions are marked with an asterisk.
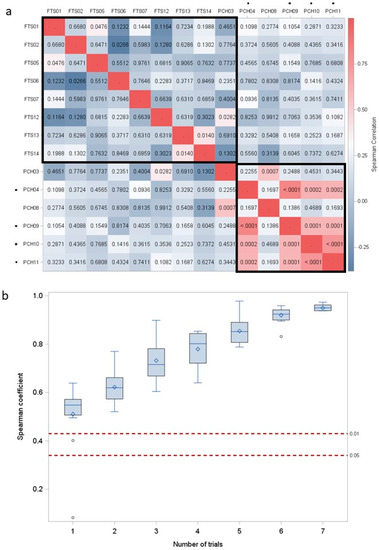
Figure 2.
(a) Correlation between drought tolerance indices within and between test systems. Heat map of the Spearman correlation coefficients DRYMp for correlations between potato cultivars of population 1. Numbers indicate type I error probability, colors indicate Pearson correlation coefficients. n = 26 to 34. Asterisk (*) indicates experiment under controlled climate conditions. (b) Distribution of the Spearman correlation between the mean DRYMp(m) of 21 random subset of m (m = 1 to 7) field experiments and the mean DRYMp(8) of all field experiments. Dashed lines indicate critical values of Spearman correlation coefficient for n = 34 and significance level α = 0.05 and 0.01.
As a readout parameter, starch yield (SY) was determined as the product of harvested tuber mass and tuber starch content (Figure 1). The analysis of variance (ANOVA) indicated that SY was significantly higher in the field trials than in the pot trials (Table 2). Furthermore, the ANOVA revealed a significant interaction between trial type (F versus P) and treatment (control versus drought) and a significant interaction between trial type, treatment, and cultivar. This suggests that the drought stress response of cultivars may depend on the trials system.
Table 2.
Result of an ANOVA on the effects of trial type, treatment, and genotype on potato starch yield (SY) of potato cultivars. Trial type: pots with peat, field with sandy soil; treatment: optimal irrigation, drought; genotype: 34 potato cultivars. DF = degrees of freedom, F = F statistic, Prob = type I error probability. Bold print indicates Prob < 0.05.
To establish how well drought tolerance under field conditions were predictable from pot-based drought tolerance trials, we calculated the correlation between the mean drought tolerance indices estimated for each cultivar for each of the twelve different experiments. The drought tolerance index was the deviation of the relative starch yield from the experimental median of all cultivars (DRYM) or of the check cultivars (DRYMp) [14,21]. The normalization to a set of cultivars that were used in all experiments allows comparisons over many years and all populations. The heat map (Figure 2a) shows the Spearman correlation coefficient (by color-code) and the type I error probability (Prob) values. The predominantly blue color indicates that most of the correlations coefficients were around zero or even negative, indicating a lack of reproducibility between the experiments. The exception are pot trials conducted at the same site, most of which show a highly significant (Prob < 0.001) correlation between the DRYMp values of the cultivars. The close correlation was observed in both test systems, the climate-controlled greenhouse and in the experiments conducted under variable climate conditions. However, neither test system showed a close correlation with any of the field trials nor did the field trials correlate well with each other.
To estimate the power of a single field trial to assess drought tolerance, we compared the mean DRYMp(m) calculated from a randomly selected number of m experiments to the mean DRYMp(8) calculated from all eight experiments by calculating the Spearman correlation coefficient. The distribution of the Spearman correlation coefficient is shown in Figure 2b. The median of the distribution increases from 0.50 for n = 1 to 0.80 for n = 4. When less than three experiments are performed, non-significant correlations between DRYMp(n) and DRYMp(8) are likely, as indicated by Spearman correlation coefficients below the significance threshold in Figure 2b. Thus, we concluded that single field experiments do not allow a stable assessment of a cultivars drought tolerance. Therefore, we switched to assess the drought tolerance of cultivars as mean tolerance estimated in a specified system. Indeed, the Pearson correlation between the DRYM calculated from all six pot and all field trials was positive (0.42) and significant (α = 0.05) [14]. The tolerance ranking of the cultivars in pot trials still differed from the ranking in the field trials as indicated by the significant interaction between genotype, treatment, and trial type (Prob = 0.054, Table 2). The main hypothesis was that the different response of the genotypes may have been caused by the much larger soil volume available to field grown plants compared to pot grown plants. The larger rooting volume supports a larger plant and thus a higher tuber yield, which may have resulted in the differences in tuber starch yield discernible in Figure 1. It also means that the drought tolerance of genotypes, in which drought tolerance resulted from the ability to forage additional water with longer roots, could have been underestimated in small pots. In the next step, we thus tested the effect of larger substrate volumes on drought tolerance assessments.
3.2. Effect of Pot Size on Drought Tolerance Assessment
In the second series of experiments, starch yield and drought tolerance were determined for population 2 that contained 3 or 4 potato cultivars and 60 genotypes obtained from crosses between three cultivars (details see [21]). The genotypes of population 2 were grown under optimal and reduced water supply in six field trials, two pot experiments and two bigbag experiments (Figure 3a). The bigbag contained 30 L of a horticultural substrate and thus provided a rooting volume comparable to the upper 30 cm of soil in a field trial system, which is the main rooting zone of potato. The plant density in the bigbag setup was similar to those on the field sites. In all trial systems, plant grew under naturally variable light and temperature conditions. The distribution of the starch yield data for the 10 experiments is shown in Figure 3b. Tuber starch yield of bigbag grown plants and pot grown plants was significantly lower than starch yield obtained from field grown plants (REGWQ-Test alpha = 0.05). However, the bigbag-grown plants achieved on average 85% of the field SY, whereas the SY of pot-grown plants was on average 24% of the field SY. The ANOVA (see Table 3) again revealed a significant effect of the test system on SY as well as a significant interaction between test system and genotype.
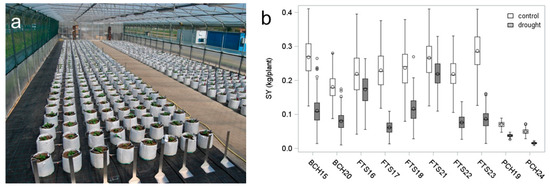
Figure 3.
Starch yield in bigbag system compared to other test systems (a) Bigbag system in polytunnel of MPI-MP. (b) Distribution of starch yield of 63 potato genotypes (population 2) grown in pots (P), bigbags (B), and on field sites (F). Plants in pots or bigbags were grown from cuttings (C) on horticultural substrate (H), field grown plants were grown from tubers (T) on sandy soil (S).
Table 3.
Result of an ANOVA on the effect of trial type, treatment, and genotype on tuber starch yield SY of potato cultivars. Trial type: pots with peat, bigbag with peat, field with sandy soil; treatment: optimal irrigation, drought; genotype: 63 potato genotypes. DF = degrees of freedom, F = F-value, Prob = type I error probability. Bold print indicates Prob < 0.05.
The power to predict drought tolerance in the field from container experiments was tested by correlation analysis on the mean drought tolerance indices DRYMp. The mean was calculated for each cultivar from several experiments, as the predictive power of single field experiments was insufficiently low (see above). The Pearson correlation coefficient between DRYMp from pot experiments and DRYMp from bigbag experiments was positive and highly significant (p = 0.0003), suggesting that the substrate volume is less relevant for the assessment of the drought tolerance as previously assumed. However, the Pearson correlation between the mean DRYMp in the field and the DRYMp obtain in pot or bigbag experiments was not significant (Prob = 0.31 (pot) or Prob = 0.69 (bigbag)). Figure 4 indicates that many genotypes that responded tolerantly under field conditions and thus had a DRYMp of > 0 showed a negative DRYMp (sensitive) in pot and bigbag experiments. Thus, increasing the substrate volume and moving from controlled environments to variable climate conditions has not solved the problem of insufficient tolerance prediction from container experiments. The other two variables differing between field and container experiments are the starting material—tubers versus cuttings—and the substrate, which is sandy soil in the field and peat-based horticultural substrate in the container.
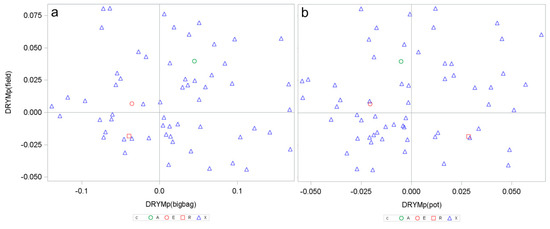
Figure 4.
Mean drought tolerance index of 63 potato genotypes calculated from tuber starch yield in field experiments (DRYMp(field)) plotted against DRYMp calculated from three bigbag experiments (a) or three pot experiments (b). Green symbol tolerant cultivar A, red symbol sensitive cultivars E and R, blue symbols genotypes obtained from crosses (see [21]).
3.3. Effect of Starting Material and Substrate
The effect of starting material and substrate was tested in 2017 to 2020 in a third population, which contained cultivars from population 1 and crossing lines from population 2 (details see Supplemental File, Supplemental Figure S1). Drought stress was applied in three different forms, as early-stress before flowering, late stress after flowering, and as long-term stress. Early-stress resulted in an almost twice as high starch yield compared to late- and long-term stress (see Supplemental File S1, Figure S5). However, correlation analysis revealed significant correlations (Pearson coefficient > 0.88, Prob < 0.0001) between the starch yields measured under all three stress conditions. Thus, the ranking of the cultivars with respect to the starch yield was unaffected by the timing and duration of the stress.
The drought resistant cultivars A and D and the sensitive cultivars R and E were part of all three populations. In the experiments on population 3, all plants were grown from tubers. The bigbag experiments were performed in a polytunnel adjacent to the field site, in which the field experiments were grown. Horticultural substrate was used in four bigbag experiments, and sandy soil was used additionally in two bigbag experiments.
The average tuber yield and starch yield of all four cultivars was significantly lower (REGW-Test α = 0.05) in plants grown in bigbags with horticultural substrate (BTH25 und BTH27) than in plants (FTS26 and FTS28) grown in the adjacent field (Figure 5, statistics Table 4). In addition to the significant effect of the test system on SY and FW, there was a significant interaction between cultivar and test system. While cultivar E showed the lowest SY and FW of all cultivars under optimal and stress conditions in the bigbag system, it yielded highest when grown in the field. Interestingly, there was no significant interaction between test system, genotype and treatment, suggesting that the lower tuber and starch yield in the bigbag system did not affect the cultivar-specific response to drought.
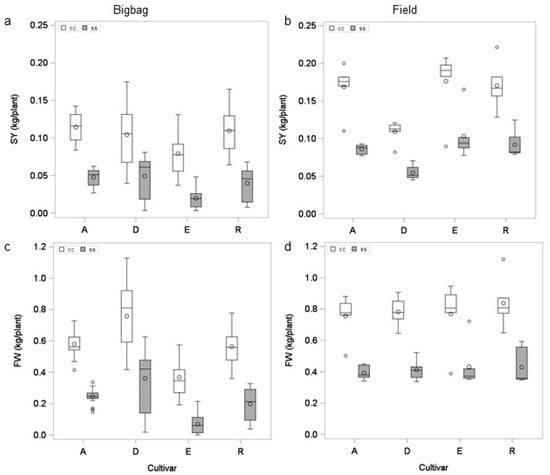
Figure 5.
Effect of growth system on yield. Mean starch yield (a) and tuber yield (c) of four cultivars grown from tubers in bigbags on peat substrate under optimal (cc) and reduced (ss) water supply (experiments BTH25 (2017) und BTH27 (2018)). Mean starch yield (b) or tuber yield (d) of four cultivars grown under field conditions under optimal and reduced water supply (experiments FTS26 (2017) und FTS28 (2018)).
Table 4.
Result of an ANOVA on the effect of trial type, treatment, year, and genotype on tuber starch yield (SY) and tuber fresh weight (FW) of potato cultivars. Trial type: bigbag with peat, field with sandy soil; treatment: optimal irrigation, long-term drought; genotype: potato genotypes A, D, E, and R. Year: 2017, 2018. DF = degrees of freedom, F = F-value, Prob = probability. Bold print indicates Prob < 0.05.
Subsequently, we compared the effect of the substrate on tuber fresh weight FW and SY of plants grown from tubers on sand or horticultural substrate in the bigbag system in 2019 (BTH29 und BTS30) and 2020 (BTH31 and BTS32) (Figure 6). In both years, cultivar and substrate had a significant effect on FW and SY (see Table 5). A significant interaction between cultivar and substrate on FW and SY indicated that the cultivars responded differently to the different substrates. In 2019 and 2020, plants grown on sand under optimal conditions reproduced the ranking of SY found under field conditions, with highest yields in cultivar E and lowest yields in cultivar D. This ranking was also found on horticultural substrate in 2020, but not in 2019. In a given treatment, e.g., drought treatment ss, both substrate types received equal amounts of irrigation water. Nevertheless, there was a significant substrate × treatment interaction on SY in both years and on FW in 2020 (Table 5). In 2019, drought stressed plants on horticultural substrate yielded significantly lower than those on sandy soil, although the shoots of the plants were larger on horticultural substrate than on sand.
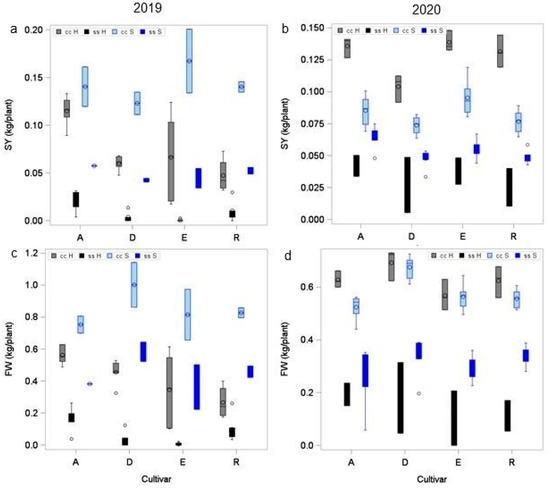
Figure 6.
Effect of substrate on yield. Mean starch yield (a,b) and tuber yield (c,d) of four cultivars grown horticultural substrate (H, black) or sandy soil (S, blue) under optimal (cc H, cc S) and reduced (ss H, ss S)) water supply. For result of ANOVA see Table 5.
Table 5.
Result of an ANOVA on the effect of substrate, treatment, year and genotype on tuber starch yield (SY) and tuber fresh weight (FW) of potato cultivars cultivated in bigbags. Substrate: peat-based horticultural substrate, sandy soil; treatment: optimal irrigation, long-term drought; genotype: potato genotypes A, D, E, and R. DF = degrees of freedom, F = F-value, Prob = probability. Bold print indicates Prob < 0.05.
The substrate also affected tuber form and size distribution (Figure 7). On sandy soil, cultivars E (Figure 7b) and R (Figure 7c) produced the large, oblong tubers that are typical for these cultivars when grown under field conditions. In contrast, plants grown on horticultural substrate produced roundish tubers. In an overview, Figure 7a displays the mean tuber numbers for the different size classes large (L, >60 mm), medium (M, 35–60 mm) and small (S, <35 mm) for the four cultivars that were grown in bigbags from cuttings or tubers on horticultural substrate or from tubers on sandy soil in bigbags or in the field. Plants grown under optimal conditions produce more tubers per plant and a higher percentage of medium tubers compared to plants grown under drought stress conditions.
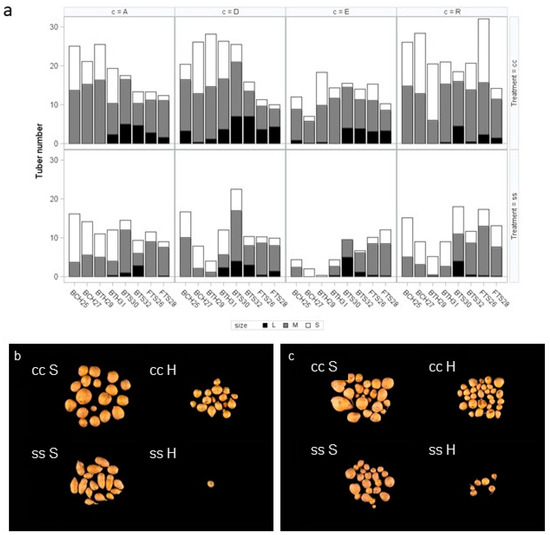
Figure 7.
Effect of cultivation factors on tuber size. (a) Tuber numbers in size classes L (>65 mm), M (35–65 mm), and S (<35) in four cultivars on horticultural substrate (H) or sandy soil (S) under optimal (cc) and reduced (ss) water supply in bigbag experiment (B) and field experiments (F). b, c Phenotype of potato tubers from cultivar E (b) and R (c) grown in sandy soil (left) and horticultural substrate (right).
In the field (FS26 and FTS28), all four cultivars produce 2 to 4 large tubers per plant under optimal water supply. In the bigbag system, plants predominantly produced large tubers when grown from tubers on sandy soil (BTS30 and BTS32). Cultivar D is the exception and develops large tubers under all conditions. The number of small tubers seemed to be higher on horticultural substrate than on sand, especially in the cultivars A and D. However, this could have been a sampling artefact as small tubers more easily detectable in horticultural substrate than in sand. The starting material—cuttings or tubers—had but a marginal effect on the tuber numbers of plants that grew on horticultural substrate (Statistics see Supplemental File, Table S1).
In summary, substrate had a higher impact on the assessment of potato performance in container trials than planting material, container size, and climate conditions.
4. Discussion
4.1. Controlled Water Supply versus Controlled Soil Water Content
In the experiments in this study, drought stress was applied by reducing the water supply to the plant to a fixed percentage of the optimal water supply. This approach differs substantially from the widely used approach of constantly reduced soil humidity [37,38,41]. In the constant humidity approach, the water content is kept on a level below the optimal soil water content by daily addition of the amount of water lost by evapotranspiration. This amount is quantified by pot weighing, corrected by the estimates on the plant weight [37]. In this approach, plants with a high transpiration rate will receive more water than plants with a low transpiration rate. Thus, differences between water-spending drought-sensitive and water-saving drought tolerant genotypes [2,49] are hard to detect in this approach unless the effect of genotype on the irrigation volumes is carefully evaluated. The approach of constant water supply mimics the situation in the field, in which an area-dependent volume of water is available to the plant. The constant volume approach comes to its limits when plants of very different size are investigated. In this case, small plants will be subjected to soil water contents that are higher than optimal while big plants experience suboptimal soil humidity. This problem is aggravated if pot sizes are small compared to the size of the plant. In the field, larger plant will root in a larger soil volume and hence forage water from a larger soil area, limited by competition from neighboring plants. Hence, planting density has a large impact on the response of maize and other cereals to water-deficit [2]. Optimum planting density in potato depends on the cultivar, seed tuber weight and the production goal with respect to total yield and required tuber size distribution [50,51]. Planting density affects the vertical root distribution of potato: high planting density results in a lower percentage of deep roots per leaf area [52]. This change has been associated with the negative effect of high planting densities on yield stability under water limiting conditions [50,52]. Differences in root growth have been linked to differences in drought tolerance between two cultivars that became apparent when plants were cultivated in deep soil layers (>40 cm) [53]. The substrate volume in our bigbag system mimicked the planting density of 4.4 plants m−2 in our field trials, but could not provide the deeper soil layers, thus potentially underestimating drought tolerance of deep rooting genotypes like the late-maturing cultivar E. However, under irrigated conditions and on sandy soil, highest root length densities were found in the top 30 to 40 cm [54,55], making the restriction of the rooting depth in the bigbag system less influential when sandy soil was used (see discussion below).
4.2. Controlled Condition versus Managed Field Environments
Major differences between drought stress experiments in academic settings and drought stress in plant production are the timing of drought stress within the life cycle of the plant, the degree of stress, and the micrometeorological conditions before and during the stress [42]. The timing of the stress with regard to the crop’s lifecycle is critical [42,56]. Potato is most sensitive to insufficient water supply in the period 15 to 20 days before flowering, during and after flowering, and during tuber filling [10,57,58]. In our study on population 3, we subjected potato genotypes to reduced water supply before (early stress) or after (late stress) flowering. The tuber yield was significantly lower after late stress than after early stress (see Supplemental File S1, Supplemental Figure S5). Likewise, cereals like rice and maize are most sensitive to drought during flowering and grain filling [2,59]. In contrast, a substantial part of academic research on drought stress is performed during early development. Hatzig et al. assessed the performance of rape seed seedlings to estimate the transgenerational effect of drought stress [60]. Muscolo et al. analyzed the response of lentil seedlings to short-term salt and PEG stress [32]. Bundig et al. screened potato genotypes on young cuttings in tissue culture [61]. Degenkolbe et al. studied the response of rice to drought stress during vegetative growth [41]. Resistance to drought during early development is critical for the establishment of crops and forest trees [42,62,63]. However, early drought tolerance is not necessarily linked to drought tolerance in later growth stages and thus yields stability in agronomic environments [64]. In our study, however, the cultivar ranking according to their tuber starch yield under stress was unaffected by the timing or the duration of the stress, although a much higher yield was achieved after early stress compared to late stress. Stress intensity is another difference between field and container trials. The much lower stress index (SI) of field experiments compared to bigbag and pot experiments may have affected the ranking. The role of stress intensity for the tolerance ranking of the cultivars in population 1 can be concluded from the correlation analysis between the pot trials. The drought tolerance indices in experiment PCH11 that had a low stress index of 0.42 was significantly correlated (Prob < 0.05) with the drought tolerance indices in the other three experiments conducted in controlled environments, which had high stress indices of >0.65. Thus, stress intensity does not seem to affect the genotype ranking in potato. The high correlation between the experiments furthermore suggest that the experimental design had sufficient power to estimate the tolerance indices. However, these experiments required substantial resources (100 m2 of climate-controlled glasshouse for three months for one experiment) and their power to predict yield under field conditions was limited. Controlled environments differ from field environments both with respect to the root environment (see below) and to the micrometeorological conditions. Poorter et al. reviewed the multitude of differences between controlled environments and field conditions [65]. The consequences of these difference have been shown, especially for Arabidopsis thaliana [66]. Mishra et al. found that phenotypes of Arabidopsis thaliana found under controlled conditions do not correlate with those found in the field [67]. Annunziata et al. showed that diel metabolism and expression of clock genes differs between controlled conditions with constant temperatures and highly variable natural conditions [68].
In our setup, light intensity in the controlled environment experiments was variable but substantially lower than in the field, as the greenhouse roof structure absorbs and scatters light and some of the experiments were conducted off-season. The internal intensity of natural light in the glasshouse is about 50% of the external intensity. Temperature variability was much lower under controlled conditions, with a difference of less than 4 K between day and night temperatures. In contrast, median temperatures on subsequent days could differ by up to 10 K under field conditions (see Supplemental File S1, Supplemental Figure S3). High maximum temperatures in the field were also linked to high vapor pressure deficits (VPD), which reached more than 2 kPa during field experiments on the site Golm [21,47]. In contrast, the set values of 21 °C/60% RH in the glasshouse amount to a VPD of 0.43. Together with the lower radiation intensity and the lack of wind, this causes a substantially lower transpiration in climate-controlled glasshouses compared to the open field. As this difference also affects the morphology of leaves and plants, high-end climate simulation facilities have been built to provide the option to simulate realistic atmospheric conditions, including wind [69].
In contrast to controlled environments, atmospheric conditions in the screenhouses and the rainout shelters are much more field-like. Light and temperatures are as variable as in the field, while soil volume and composition as well as water supply can be controlled. Temperatures in polytunnel screenhouses and—to a lesser extend—rainout shelters tend to be higher than in the open field and consequently VPDs are higher in polytunnel, too. In contrast, light intensities are lower in polytunnel screenhouses than in the field. Manufacturers provide transmission rate of up to 90% [70], however dust deposition can decrease transmission rates to 67% (own measurements). The effect of the light intensity reduction on yield will be highest, when light intensity is low during tuber filling after canopy closure, when the leaf area index has reached its maximum. Additionally, wind speeds enhance the transpiration rates in fields more than in polytunnels.
The major advantage of polytunnel screenhouses is the low per area cost for construction and maintenance. This make several 100 m2 area for large experiments with many genotypes or larger containers affordable.
4.3. The Hidden Half: Planting Material, Pot Size, and Soil
The second important aspect of this study concerns the compartment, in which the root—the hidden half [71] of the plant—is cultivated. The closer attention to the root compartment was triggered by the insightful review of Passioura [72] and by a puzzling observation that cultivar E, which was among the highest yielding in the field, showed low tuber yields in pots under controlled conditions.
Our first hypothesis was that 4 liter-pots prevented the optimal development of cultivar E, which produces large shoots [21]. Therefore, we started cultivating plants in substantially bigger containers, namely bigbags with a volume of 30 L and a height of 30 cm. However, E again showed lower yield under optimal water supply than the three other check cultivars A, D, and R. Solanum tuberosum ssp. tuberosum cultivars root to a depth of 100 cm, but develop the highest root density in the upper 30 cm, especially when irrigated [54,73,74]. Potato cultivars differ in root development both with respect to the root density in the plow layer (upper 30 cm) and to their root length. Late-maturing genotypes tend to produce deeper roots [73,74,75]. The stronger root development in late-maturing cultivars is related to the longer root growth period, which terminates with the end of the leaf production. Cultivar E has the latest development compared to A, D, and R based on the BBCH assessments under field conditions and the tuber maturity score [21]. Thus, a rooting horizon of 30 cm may have been insufficient for the cultivar E to fulfill its full potential for water uptake and yield. In spite of the higher root density in the upper 30 cm, deeper roots can contribute substantially to water uptake [76]. The interaction between rooting depth and water supply on yield gets even more complicated in irrigated crops, which take up most of the water from the upper layers. In our system, irrigation was performed with large volumes equivalent to 10 L per m2, thus rewetting more than the superficial layers of the soil. Thus, cultivar E could have benefited from its ability to take up water and nutrients from higher soil depth in the field while being cultivated under suboptimal conditions in bigbags on peat.
The second factor that differed between field and container experiments was the starting material. In most pot experiments, the plant started from in vitro propagated cuttings and thus relied on successful photosynthesis from the very beginning. In field trials as in production systems, potato crops were always started from seed tubers. Seed tubers bring a substantial amount of resources in the form of storage starch available for the establishment of the plant. Thus, the size of the seed tuber has an impact on the performance of the crop [50,77]. Therefore, tuber size was carefully controlled in our experiment to make sure that all cultivars and treatments were started with the same seed tuber weights. The comparison between the bigbag experiments from 2017 to 2020, which started from tubers, with the bigbag experiments of 2015 and 2016 started from cuttings revealed substantial differences in shoot development. Plants grown from cuttings logged two to three weeks earlier than those grown from tubers did. Nevertheless, the effect of the interaction between experiment type and genotype on tuber yield remained significant in the experiments performed in 2017 and 2018 (Table 4). Thus, the factor planting material did not explain the difference in cultivar ranking between field and container experiments.
Finally, the substrate turned out to be the essential factor for the reproduction of field results in container trials. When potato plants were grown on sandy substrate instead of horticultural substrate, the ranking of the genotypes with respect to yield was the same as in the field. The effect of substrate on tuber and starch yield was significant in both trial years; however the direction of the effect was opposite. This suggest that an interaction between substrate type and the water demand caused by the atmospheric condition throughout the experiment. In 2019, water demand was almost twice as high as in 2020, mainly due to a period of high temperatures and thus high VPD between 40 and 60 days from planting in 2019 (see Supplemental File S1, Supplemental Figures S2 and S3). The substrate effect was not due to soil temperature differences, as these were surprisingly similar. The interaction between substrate × genotype suggest that differences in water uptake, presumably due to different root developments, may be at the bottom of the substrate effect on cultivar ranking. The later maturing cultivar E may have been better able to respond by increased root growth to high water use than the other cultivars, which are more early maturing and thus terminate root growth earlier [75].
In addition to the effect on yield, substrate affected tuber quality. The typical tubers size distribution of the cultivars (see Figure 7) and the cultivar-specific tuber forms that are typically found in the field were reproduced after cultivation in bigbags with sandy substrate. On peat, tubers tended to be less oblong and the percentage of large tubers was decreased. Tuber size distribution and form are highly relevant for the market value of the potato crops for the fresh market or the chip production [78]. Thus, realistic assessment on tuber qualities in container trials requires the use of soil based substrates.
Interestingly, the 3-way interaction of genotype × substrate × treatment was non-significant, indicating that in spite of the striking effect of the substrate on absolute yield, its effect on drought tolerance index DRYMp, which is based on relative yield, was low. Thus, it is possible to use horticultural substrate when assessing drought tolerance based on tolerance scores DRYM, DRYMp, or the stress tolerance index STI, which are based on relative yield and are weakly affected by the yield potential [14].
The use of soil instead of horticultural substrate provides some challenges. Horticultural substrates are quality-controlled by manufactures to provide homogenous quality within and between batches and optimal pore size distribution. In contrast, homogeneous and quality-controlled soil supplies are more difficult to find. We tested quarz sand as an alternative to sandy soil in controlled-environment experiments and found it impossible to establish potato cultures from cuttings, even when cuttings were pre-cultivated in peat pots. One of the problem with soil use is the loss of soil structure during pot filling. When the dry soil is filled into pots, the porous structure that has established in the soil during numerous freeze-thaw, drying-rewetting cycles is lost and the soil is in single grain structure with a very adverse pore distribution [72]. We found that the structure can be improved when the soil-filled containers are kept in the polytunnel over winter with occasional rewetting. However, our sandy soil originated from an A-horizon and thus contained more organic matter than pure quarz sand. Additional problems with the use of soil instead of horticultural substrate arise from the risk of water logging when used in small pots [72]. Furthermore, the higher specific weight of mineral soil (typically 1.4 kg/L) compared to horticultural substrate (typically 0.7 kg/L) makes the logistics of substrate transport, pot filling and pot movement challenging. Nevertheless, natural soils in deep growth columns have been successfully used in drought tolerance trials on potato, maize, and pear millet [49,74,79].
Thus, we conclude that the use of soil-based substrates instead of peat-based horticultural substrate, while less critical for the assessment of the relative yield/yield stability under drought conditions, leads to a better estimate of yield potential, yield under stress, and tuber quality in potato.
5. Conclusions
The analysis of nine years of drought tolerance experiments on potato indicated that a minimum of three trials is required to obtain a stable estimate of drought tolerance in potato genotypes. We tested the effect of climate conditions, container size, starting material, and substrate on the correlation between the performances of potato genotypes in container experiments compared to field experiments. Realistic estimates on relative yields under drought can be obtained in container systems on horticultural substrate. However, genotype assessment with respect to yield potential, absolute yield under stress, and tuber size distribution requires the use of soil-based substrates.
Supplementary Materials
The following are available online at https://www.mdpi.com/article/10.3390/agronomy11050865/s1, in supplemental File S1, Figure S1: Potato genotypes in test populations 1 to 3. Figure S2 Water volumes in experiments on population 3. Figure S3: Air temperature in experiments on population 3, Figure S4 Soil temperature in experiments on population 3. Figure S5: Mean starch yield of cultivars in population 3 under early, late and long-term drought. Table S1: ANOVA on the effect of planting material on tuber size distribution.
Author Contributions
Conceptualization, methodology and formal analysis K.I.K.; investigation, K.I.K., M.H. and G.M.A.; data curation, K.I.K., M.H. and G.M.A.; writing—original draft preparation, K.I.K.; writing—review and editing, K.I.K., M.H., G.M.A. and R.P.; visualization, K.I.K.; supervision, project administration, and funding acquisition, K.I.K. and R.P. All authors have read and agreed to the published version of the manuscript.
Funding
This research was funded by grant 107945 ‘Accelerating the Development of Early-Maturing-Agile Potato for Food Security through a Trait Observation and Discovery Network’ of the Federal Ministry for Economic Cooperation and Development and by grants No. 22011208 and 22010913 of the Fachagentur Nachwachsende Rohstoffe (Federal Ministry of Food and Agriculture), Germany and the Gemeinschaft zur Förderung der Privaten Deutschen Pflanzenzüchtung (GFPi).
Institutional Review Board Statement
Not applicable.
Informed Consent Statement
Not applicable.
Data Availability Statement
All data are publicly archived and available at E!DAL as referenced in the text.
Acknowledgments
We thank Dirk Zerning, Laura Westphal und Mario Walenko for skilled technical assistance, Josef Bergstein, Adam Sevens and Benjamin Maltry for photographic work and the breeders of the GFPi for the donation of planting material and many enlightening discussions. All authors learned a lot from the exchange with Sylvia Seddig and her coworkers. The contribution of Hannele Lindqvist-Kreuze and Awais Khan (both International Centre for Potato, Peru), who initiated and coordinated the project ‘Accelerating the Development of Early-Maturing-Agile Potato for Food Security through a Trait Observation and Discovery Network’ is gratefully acknowledged.
Conflicts of Interest
The authors declare no conflict of interest. The funders had no role in the design of the study, in the collection, analyses, or interpretation of data; in the writing of the manuscript, or in the decision to publish the results.
References
- Harrison, M.T.; Tardieu, F.; Dong, Z.S.; Messina, C.D.; Hammer, G.L. Characterizing drought stress and trait influence on maize yield under current and future conditions. Glob. Chang. Biol. 2014, 20, 867–878. [Google Scholar] [CrossRef]
- Cooper, M.; Gho, C.; Leafgren, R.; Tang, T.; Messina, C. Breeding drought-tolerant maize hybrids for the US corn-belt: Discovery to product. J. Exp. Bot. 2014, 65, 6191–6204. [Google Scholar] [CrossRef]
- Monneveux, P.; Ramirez, D.A.; Pino, M.T. Drought tolerance in potato (S. tuberosum L.) Can we learn from drought tolerance research in cereals? Plant Sci. 2013, 205, 76–86. [Google Scholar] [CrossRef]
- Blum, A. Heterosis, stress, and the environment: A possible road map towards the general improvement of crop yield. J. Exp. Bot. 2013, 64, 4829–4837. [Google Scholar] [CrossRef] [PubMed]
- Blum, A.; Shpiler, L.; Golan, G.; Mayer, J. Yield stability and canopy temperature of wheat genotypes under drought-stress. Field Crops Res. 1989, 22, 289–296. [Google Scholar] [CrossRef]
- Slater, A.T.; Cogan, N.O.I.; Forster, J.W.; Hayes, B.J.; Daetwyler, H.D. Improving genetic gain with genomic selection in autotetraploid potato. Plant Genome 2016, 9, 1–15. [Google Scholar] [CrossRef] [PubMed]
- Vos, J.; Groenwold, J. Root-growth of potato crops on a marine-clay soil. Plant Soil 1986, 94, 17–33. [Google Scholar] [CrossRef]
- Anithakumari, A.M.; Nataraja, K.N.; Visser, R.G.F.; van der Linden, C.G. Genetic dissection of drought tolerance and recovery potential by quantitative trait locus mapping of a diploid potato population. Mol. Breed. 2012, 30, 1413–1429. [Google Scholar] [CrossRef]
- Obidiegwu, J.; Bryan, G.; Jones, H.; Prashar, A. Coping with drought: Stress and adaptive responses in potato and perspectives for improvement. Front. Plant Sci. 2015, 6, 542. [Google Scholar] [CrossRef]
- Van Loon, C.D. The effect of water stress on potato growth, development, and yield. Am. Potato J. 1981, 58, 51–69. [Google Scholar] [CrossRef]
- Aliche, E.B.; Oortwijn, M.; Theeuwen, T.P.J.M.; Bachem, C.W.B.; Visser, R.G.F.; van der Linden, C.G. Drought response in field grown potatoes and the interactions between canopy growth and yield. Agric. Water Manag. 2018, 206, 20–30. [Google Scholar] [CrossRef]
- Jefferies, R.A.; Mackerron, D.K.L. Aspects of the physiological basis of cultivar differences in yield of potato under droughted and irrigated conditions. Potato Res. 1987, 30, 201–217. [Google Scholar] [CrossRef]
- Schafleitner, R.; Gutierrez, R.; Espino, R.; Gaudin, A.; Pérez, J.; Martínez, M.; Domínguez, A.; Tincopa, L.; Alvarado, C.; Numberto, G.; et al. Field screening for variation of drought tolerance in Solanum tuberosum L. by agronomical, physiological and genetic analysis. Potato Res. 2007, 50, 71–85. [Google Scholar] [CrossRef]
- Sprenger, H.; Rudack, K.; Schudoma, C.; Neumann, A.; Seddig, S.; Peters, R.; Zuther, E.; Kopka, J.; Hincha, D.K.; Walther, D.; et al. Assessment of drought tolerance and its potential yield penalty in potato. Func. Plant Biol. 2015, 42, 655–667. [Google Scholar] [CrossRef] [PubMed]
- Wishart, J.; George, T.S.; Brown, L.K.; White, P.J.; Ramsay, G.; Jones, H.; Gregory, P.J. Field phenotyping of potato to assess root and shoot characteristics associated with drought tolerance. Plant Soil 2014, 378, 351–363. [Google Scholar] [CrossRef]
- Gopal, J. Challenges and way-forward in selection of superior parents, crosses and clones in potato breeding. Potato Res. 2015, 58, 165–188. [Google Scholar] [CrossRef]
- Slater, A.T.; Cogan, N.O.I.; Hayes, B.J.; Schultz, L.; Dale, M.F.B.; Bryan, G.J.; Forster, J.W. Improving breeding efficiency in potato using molecular and quantitative genetics. Theor. Appl. Genet. 2014, 127, 2279–2292. [Google Scholar] [CrossRef] [PubMed]
- Richards, R.A.; Hunt, J.R.; Kirkegaard, J.A.; Passioura, J.B. Yield improvement and adaptation of wheat to water-limited environments in Australia—A case study. Crop Pasture Sci. 2014, 65, 676–689. [Google Scholar] [CrossRef]
- Campos, H.; Cooper, M.; Edmeades, G.; Löffler, C.; Schussler, J.; Ibañez, M. Changes in drought tolerance in maize associated with fifty years of breeding for yield in the U.S. corn belt. Maydica 2006, 51, 369–381. [Google Scholar]
- Gemenet, D.C.; Lindqvist-Kreuze, H.; De Boeck, B.; da Silva Pereira, G.; Mollinari, M.; Zeng, Z.-B.; Craig Yencho, G.; Campos, H. Sequencing depth and genotype quality: Accuracy and breeding operation considerations for genomic selection applications in autopolyploid crops. Theor. Appl. Genet. 2020, 133, 3345–3363. [Google Scholar] [CrossRef] [PubMed]
- Haas, M.; Sprenger, H.; Zuther, E.; Peters, R.; Seddig, S.; Walther, D.; Kopka, J.; Hincha, D.K.; Köhl, K.I. Can metabolite- and transcript-based selection for drought tolerance in Solanum tuberosum replace selection on yield in arid environments? Front. Plant Sci. 2020, 11. [Google Scholar] [CrossRef]
- Sprenger, H.; Erban, A.; Seddig, S.; Rudack, K.; Thalhammer, A.; Le, M.Q.; Walther, D.; Zuther, E.; Köhl, K.I.; Kopka, J.; et al. Metabolite and transcript markers for the prediction of potato drought tolerance. Plant Biotech. J. 2018, 16, 939–950. [Google Scholar] [CrossRef] [PubMed]
- Tardieu, F. Any trait or trait-related allele can confer drought tolerance: Just design the right drought scenario. J. Exp. Bot. 2012, 63, 25–31. [Google Scholar] [CrossRef] [PubMed]
- Millet, E.J.; Welcker, C.; Kruijer, W.; Negro, S.; Coupel-Ledru, A.; Nicolas, S.D.; Laborde, J.; Bauland, C.; Praud, S.; Ranc, N.; et al. Genome-wide analysis of yield in Europe: Allelic effects vary with drought and heat scenarios. Plant Phys. 2016, 172, 749–764. [Google Scholar] [CrossRef] [PubMed]
- Seki, M.; Narusaka, M.; Ishida, J.; Nanjo, T.; Fujita, M.; Oono, Y.; Kamiya, A.; Nakajima, M.; Enju, A.; Sakurai, T.; et al. Monitoring the expression profiles of 7000 Arabidopsis genes under drought, cold and high-salinity stresses using a full-length cDNA microarray. Plant J. 2002, 31, 279–292. [Google Scholar] [CrossRef] [PubMed]
- Van der Weele, C.M.; Spollen, W.G.; Sharp, R.E.; Baskin, T.I. Growth of Arabidopsis thaliana seedlings under water deficit studied by control of water potential in nutrient-agar media. J. Exp. Bot. 2000, 51, 1555–1562. [Google Scholar] [CrossRef] [PubMed]
- Qin, Y.X.; Wang, M.C.; Tian, Y.C.; He, W.X.; Han, L.; Xia, G.M. Over-expression of TaMYB33 encoding a novel wheat MYB transcription factor increases salt and drought tolerance in Arabidopsis. Mol. Biol. Rep. 2012, 39, 7183–7192. [Google Scholar] [CrossRef]
- Bu, Q.; Lv, T.; Shen, H.; Phi, L.; Wang, J.; Wang, Z.; Huang, Z.; Xiao, L.; Engineer, C.; Kim, T.H.; et al. Regulation of Drought Tolerance by the F-Box Protein MAX2 in Arabidopsis. Plant Phys. 2014, 164, 424–439. [Google Scholar] [CrossRef]
- Scheffer, F.; Schachtschabel, P. Lehrbuch der Bodenkunde, 11th ed.; Enke: Stuttgart, Germany, 1984. [Google Scholar]
- Sakuma, Y.; Maruyama, K.; Osakabe, Y.; Qin, F.; Seki, M.; Shinozaki, K.; Yamaguchi-Shinozaki, K. Functional Analysis of an Arabidopsis Transcription Factor, DREB2A, Involved in Drought-Responsive Gene Expression. J. Plant Cell 2006, 18, 1292–1309. [Google Scholar] [CrossRef]
- Hummel, I.; Pantin, F.; Sulpice, R.; Piques, M.; Rolland, G.; Dauzat, M.; Christophe, A.; Pervent, M.; Bouteillé, M.; Stitt, M.; et al. Arabidopsis plants acclimate to water deficit at low cost through changes of carbon usage: An integrated perspective using growth, metabolite, enzyme, and gene expression analysis. J. Plant Physiol. 2010, 154, 357–372. [Google Scholar] [CrossRef]
- Muscolo, A.; Junker, A.; Klukas, C.; Weigelt-Fischer, K.; Riewe, D.; Altmann, T. Phenotypic and metabolic responses to drought and salinity of four contrasting lentil accessions. J. Exp. Bot. 2015, 66, 5467–5480. [Google Scholar] [CrossRef] [PubMed]
- Harb, A.; Krishnan, A.; Ambavaram, M.M.R.; Pereira, A. Molecular and physiological analysis of drought stress in Arabidopsis reveals early responses leading to acclimation in plant growth. J. Plant Pysiol. 2010, 154, 1254–1271. [Google Scholar] [CrossRef] [PubMed]
- Roca Paixão, J.F.; Gillet, F.-X.; Ribeiro, T.P.; Bournaud, C.; Lourenço-Tessutti, I.T.; Noriega, D.D.; Melo, B.P.D.; de Almeida-Engler, J.; Grossi-de-Sa, M.F. Improved drought stress tolerance in Arabidopsis by CRISPR/dCas9 fusion with a Histone AcetylTransferase. Sci. Rep. 2019, 9, 8080. [Google Scholar] [CrossRef]
- Ebrahimian-Motlagh, S.; Ribone, P.A.; Thirumalaikumar, V.P.; Allu, A.D.; Chan, R.L.; Mueller-Roeber, B.; Balazadeh, S. JUNGBRUNNEN1 Confers Drought Tolerance Downstream of the HD-Zip I Transcription Factor AtHB13. Front. Plant Sci. 2017, 8. [Google Scholar] [CrossRef]
- Passioura, J. The drought environment: Physical, biological and agricultural perspectives. J. Exp. Bot. 2007, 58, 113–117. [Google Scholar] [CrossRef]
- Granier, C.; Aguirrezabal, L.; Chenu, K.; Cookson, S.; Dauzat, M.; Hamard, P.; Thioux, J.; Rolland, G.; Bouchier-Combaud, S.; Lebaudy, A.; et al. PHENOPSIS, an automated platform for reproducible phenotyping of plant responses to soil water deficit in Arabidopsis thaliana permitted the identification of an accession with low sensitivity to soil water deficit. New Phytol. 2006, 16, 623–635. [Google Scholar] [CrossRef]
- Honsdorf, N.; March, T.J.; Berger, B.; Tester, M.; Pillen, K. High-Throughput Phenotyping to Detect Drought Tolerance QTL in Wild Barley Introgression Lines. PLoS ONE 2014, 9. [Google Scholar] [CrossRef]
- Dignat, G.; Welcker, C.; Sawkins, M.; Ribaut, J.M.; Tardieu, F. The growths of leaves, shoots, roots and reproductive organs partly share their genetic control in maize plants. Plant Cell Environ. 2013, 36, 1105–1119. [Google Scholar] [CrossRef]
- Bouchabke, O.; Chang, F.; Simon, M.; Voisin, R.; Pelletier, G.; Durand-Tardif, M. Natural variation in Arabidopsis thaliana as a tool for highlighting differential drought responses. PLoS ONE 2008, 3, e1705. [Google Scholar] [CrossRef]
- Degenkolbe, T.; Do, P.T.; Zuther, E.; Rebsilber, D.; Walther, D.; Hincha, D.K.; Köhl, K.I. Expression profiling of rice cultivars differing in their drought tolerance to long-term drought stress. Plant Mol. Biol. 2009, 69, 133–153. [Google Scholar] [CrossRef] [PubMed]
- Passioura, J.B. Phenotyping for drought tolerance in grain crops: When is it useful to breeders? Func. Plant Biol. 2012, 39, 851–859. [Google Scholar] [CrossRef]
- Poorter, H.; Bühler, J.; van Dusschoten, D.; Climent, J.; Postma, J.A. Pot size matters: A meta-analysis of the effects of rooting volume on plant growth. Func. Plant Biol. 2012, 39, 839–850. [Google Scholar] [CrossRef] [PubMed]
- Köhl, K.I.; Basler, G.; Luedemann, A.; Selbig, J.; Walther, D. A plant resource and experiment management system based on the Golm Plant Database as a basic tool for omics research. Plant Methods 2008, 4, 11. [Google Scholar] [CrossRef] [PubMed]
- Tuber Yield and Starch Content of 34 Potato Genotypes in 14 Pot and Field Trials with Optimal and Reduced Irrigation Conducted in Northern Germany 2011–2013. 2021. Available online: https://doi.ipk-gatersleben.de/DOI/c4eae50a-02ed-4c6c-b0b5-b5518b732a15/54a99f99-1255-4c3b-9038-929d4439b757/2 (accessed on 7 April 2021). [CrossRef]
- Arend, D.; Junker, A.; Scholz, U.; Schüler, D.; Wylie, J.; Lange, M. PGP repository: A plant phenomics and genomics data publication infrastructure. Database 2016, 2016. [Google Scholar] [CrossRef]
- Selection and Validation Experiment Comparing Phenotypic and Marker-Assisted Selection for Drought Tolerance in Solanum tuberosum ssp. tuberosum. 2018; Available online: https://doi.ipk-gatersleben.de/DOI/afa7cb69-224a-4f3b-b153-a013faff51c2/a0cd444d-0616-4ac3-91f4-e4ba987f5752/2 (accessed on 27 April 2021). [CrossRef]
- Supplemental Material for Publication counfounding Factors in Container-Based Assessment of Drought Tolerance in Solanum tuberosum. 2021. Available online: https://doi.ipk-gatersleben.de/DOI/a9dd6f7c-4457-4326-821c-https://api.asm.skype.com/v1/objects/0-ea-d8-335b5bc69130da0613c030dd77730642/views/imgpsh_mobile_save_anim1eecbba5a05d/001a3730-0874-436f-87d1-2e9a8cc89ee8/2/1847940088 (accessed on 27 April 2021). [CrossRef]
- Vadez, V.; Kholova, J.; Yadav, R.S.; Hash, C.T. Small temporal differences in water uptake among varieties of pearl millet (Pennisetum glaucum (L.) R. Br.) are critical for grain yield under terminal drought. Plant Soil 2013, 371, 447–462. [Google Scholar] [CrossRef]
- Wurr, D.; Fellows, J.; Allen, E. An approach to determining optimum tuber planting densities in early potato varieties. J. Agric. Sci. 1993, 120, 63–70. [Google Scholar] [CrossRef]
- Europlant. Anbauempfehlungen. Available online: https://www.europlant.biz/sortensuche-ergebnis/euroresa/ (accessed on 4 March 2021).
- Iwama, K.; Hukushima, T.; Yoshimura, T.; Nakaseko, K. Influence of planting density on root growth and yield in potato. Jpn. J. Crop Sci. 1993, 62, 628–635. [Google Scholar] [CrossRef][Green Version]
- Puertolas, J.; Ballester, C.; Elphinstone, E.D.; Dodd, I.C. Two potato (Solanum tuberosum) varieties differ in drought tolerance due to differences in root growth at depth. Func. Plant Biol. 2014, 41, 1107–1118. [Google Scholar] [CrossRef]
- Ahmadi, S.H.; Plauborg, F.; Andersen, M.N.; Sepaskhah, A.R.; Jensen, C.R.; Hansen, S. Effects of irrigation strategies and soils on field grown potatoes: Root distribution. Agric. Water Manag. 2011, 98, 1280–1290. [Google Scholar] [CrossRef]
- Svoboda, P.; Raimanová, I.; Duffková, R.; Fučík, P.; Kurešová, G.; Haberle, J. The effects of irrigation on root density profiles of potato, celery, and wheat. Agron. Res. 2020, 18, 567–578. [Google Scholar] [CrossRef]
- Granier, C.; Tardieu, F. Water Deficit and Spatial Pattern of Leaf Development. Variability in Responses Can Be Simulated Using a Simple Model of Leaf Development. J. Plant Physiol. 1999, 119, 609–620. [Google Scholar] [CrossRef]
- FAO Water Development and Management Unit Crop Water Information: Potato. Available online: http://www.fao.org/nr/water/cropinfo_potato.html (accessed on 26 March 2012).
- Ierna, A.; Mauromicale, G. Tuber yield and irrigation water productivity in early potatoes as affected by irrigation regime. Agric. Water Manag. 2012, 115, 276–284. [Google Scholar] [CrossRef]
- Lafitte, H.R.; Li, Z.K.; Vijayakumar, C.H.M.; Gao, Y.M.; Shi, Y.; Xu, J.L.; Fu, B.Y.; Yu, A.J.; Ali, A.J.; Domingo, J.; et al. Improvement of rice drought tolerance through backcross breeding: Evaluation of donors and selection in drought nurseries. Field Crops Res. 2006, 97, 77–86. [Google Scholar] [CrossRef]
- Hatzig, S.V.; Nuppenau, J.N.; Snowdon, R.J.; Schiessl, S.V. Drought stress has transgenerational effects on seeds and seedlings in winter oilseed rape (Brassica napus L.). BMC Plant Biol. 2018, 18. [Google Scholar] [CrossRef] [PubMed]
- Bundig, C.; Vu, T.H.; Meise, P.; Seddig, S.; Schum, A.; Winkelmann, T. Variability in Osmotic Stress Tolerance of Starch Potato Genotypes (Solanum tuberosum L.) as Revealed by an In Vitro Screening: Role of Proline, Osmotic Adjustment and Drought Response in Pot Trials. J. Agron. Crop Sci. 2017, 203, 206–218. [Google Scholar] [CrossRef]
- Galiano, L.; Timofeeva, G.; Saurer, M.; Siegwolf, R.; Martínez-Vilalta, J.; Hommel, R.; Gessler, A. The fate of recently fixed carbon after drought release: Towards unravelling C storage regulation in Tilia platyphyllos and Pinus sylvestris. Plant Cell Environ. 2017, 40, 1711–1724. [Google Scholar] [CrossRef] [PubMed]
- Serraj, R.; McNally, K.L.; Slamet-Loedin, I.; Kohli, A.; Haefele, S.M.; Atlin, G.; Kumar, A. Drought resistance improvement in rice: An integrated genetic and resource management strategy. Plant Prod. Sci. 2011, 14, 1–14. [Google Scholar] [CrossRef]
- Grzesiak, M.T.; Marcińska, I.; Janowiak, F.; Rzepka, A.; Hura, T. The relationship between seedling growth and grain yield under drought conditions in maize and triticale genotypes. Acta Physiol. Plant. 2012, 34, 1757–1764. [Google Scholar] [CrossRef]
- Poorter, H.; Fiorani, F.; Pieruschka, R.; Wojciechowski, T.; van der Putten, W.H.; Kleyer, M.; Schurr, U.; Postma, J. Pampered inside, pestered outside? Differences and similarities between plants growing in controlled conditions and in the field. New Phytol. 2016, 212, 838–855. [Google Scholar] [CrossRef]
- Köhl, K.I.; Laitinen, R.A. From the greenhouse to the real world—Arabidopsis field trials and applications. In Molecular Mechanisms in Plant Adaptation; Laitinen, R., Ed.; Wiley-Blackwell: Malden, MA, USA, 2015; pp. 217–235. [Google Scholar]
- Mishra, Y.; Johansson Jänkänpää, H.; Kiss, A.Z.; Funk, C.; Schröder, W.P.; Jansson, S. Arabidopsis plants grown in the field and climate chambers significantly differ in leaf morphology and photosystem components. BMC Plant Biol. 2012, 12, 6. [Google Scholar] [CrossRef]
- Annunziata, M.G.; Apelt, F.; Carillo, P.; Krause, U.; Feil, R.; Köhl, K.; Lunn, J.E.; Stitt, M. Response of Arabidopsis primary metabolism and circadian clock to low night temperature in a natural light environment. J. Exp. Bot. 2018, 69, 4881–4895. [Google Scholar] [CrossRef] [PubMed]
- Altmann, T. Pflanzenkulturhalle. Available online: https://www.ipk-gatersleben.de/phaenotypisierung/organismus (accessed on 24 February 2021).
- Folitec Agrarfolienvertriebs GmbH. Available online: http://www.folitec.de/Produkte/Gewaechshausfolie/Lumisol-clear-AF/ (accessed on 9 March 2021).
- Waisel, Y.; Eshel, A.; Kafkafi, U. Plant Roots: The Hidden Half, 2nd ed.; Dekker: New York, NY, USA, 1996; p. 1002. [Google Scholar]
- Passioura, J.B. The perils of pot experiments. Funct. Plant Biol. 2006, 33, 1075–1079. [Google Scholar] [CrossRef] [PubMed]
- Iwama, K. Physiology of the Potato: New Insights into Root System and Repercussions for Crop Management. Potato Res. 2008, 51, 333. [Google Scholar] [CrossRef]
- Boguszewska-Mańkowska, D.; Zarzyńska, K.; Nosalewicz, A. Drought Differentially Affects Root System Size and Architecture of Potato Cultivars with Differing Drought Tolerance. Am. J. Potato Res. 2020, 97, 54–62. [Google Scholar] [CrossRef]
- Stalham, M.A.; Allen, E.J. Effect of variety, irrigation regime and planting date on depth, rate, duration and density of root growth in the potato (Solanum tuberosum) crop. J. Agric. Sci. 2001, 137, 251–270. [Google Scholar] [CrossRef]
- Stalham, M.A.; Allen, E.J. Water uptake in the potato (Solanum tuberosum) crop. J. Agric. Sci. 2004, 142, 373–393. [Google Scholar] [CrossRef]
- Mullin, R.; Blomquist, A.W.; Lauer, F.I. Effect of seed tuber size on first clonal generation yield of potatoes. Am. Potato J. 1966, 43, 418–423. [Google Scholar] [CrossRef]
- Bussan, A.J.; Mitchell, P.D.; Copas, M.E.; Drilias, M.J. Evaluation of the Effect of Density on Potato Yield and Tuber Size Distribution. Crop Sci. 2007, 47, 2462–2472. [Google Scholar] [CrossRef]
- Grieder, C.; Trachsel, S.; Hund, A. Early vertical distribution of roots and its association with drought tolerance in tropical maize. Plant Soil 2014, 377. [Google Scholar] [CrossRef]
Publisher’s Note: MDPI stays neutral with regard to jurisdictional claims in published maps and institutional affiliations. |
© 2021 by the authors. Licensee MDPI, Basel, Switzerland. This article is an open access article distributed under the terms and conditions of the Creative Commons Attribution (CC BY) license (https://creativecommons.org/licenses/by/4.0/).