Article

Seed Morphology in Key Spanish Grapevine Cultivars

by
Emilio Cervantes
1,*,
José Javier Martín-Gómez
1,
Francisco Emmanuel Espinosa-Roldán
2,
Gregorio Muñoz-Organero
2,
Ángel Tocino
3 and
Félix Cabello-Sáenz de Santamaría
2,*
1
IRNASA-CSIC, Cordel de Merinas, 40, 37008 Salamanca, Spain
2
Instituto Madrileño de Investigación y Desarrollo Rural Agrario y Alimentario (IMIDRA), Autovía de Aragón Km, 38.2, Finca El Encín, Alcalá de Henares, 28800 Madrid, Spain
3
Departamento de Matemáticas, Facultad de Ciencias, Universidad de Salamanca, Plaza de la Merced 1-4, 37008 Salamanca, Spain
*
Authors to whom correspondence should be addressed.
Agronomy 2021, 11(4), 734; https://doi.org/10.3390/agronomy11040734
Submission received: 11 February 2021 / Revised: 6 April 2021 / Accepted: 7 April 2021 / Published: 10 April 2021

Abstract

:
Ampelography, the botanical discipline dedicated to the identification and classification of grapevine cultivars, was grounded on the description of morphological characters and more recently is based on the application of DNA polymorphisms. New methods of image analysis may help to optimize morphological approaches in ampelography. The objective of this study was the classification of representative cultivars of Vitis vinifera conserved in the Spanish collection of IMIDRA according to seed shape. Thirty eight cultivars representing the diversity of this collection were analyzed. A consensus seed silhouette was defined for each cultivar representing the geometric figure that better adjusted to their seed shape. All the cultivars tested were classified in ten morphological groups, each corresponding to a new model. The models are geometric figures defined by equations and similarity to each model is evaluated by quantification of percent of the area shared by the two figures, the seed and the model (J index). The comparison of seed images with geometric models is a rapid and convenient method to classify cultivars. A large proportion of the collection may be classified according to the new models described and the method permits to find new models according to seed shape in other cultivars.

1. Introduction

The genus Vitis L. (Vitaceae) contains more than 79 accepted species [1], with Vitis vinifera L. being extensively used in viticulture worldwide. Two forms of Vitis vinifera co-exist in Eurasia and North Africa: the cultivated form, V. vinifera ssp. Vinifera and the wild form V. vinifera ssp. Sylvestris (Gmel.) Beger [2]. Thousands of cultivars of this species are grown today in viticulture worldwide, receiving different denominations in many languages [3,4,5,6]. The description, classification and phylogenetic relationships of grape cultivars were traditionally based on different methods. For centuries, starting with the Agricultura General of Gabriel Alonso de Herrera (1470–1539), first published in Madrid in 1513 [7], and following with the classical treatise of Clemente (1777–1827), published in French and entitled Essay sur les varietés de la vigne qui végètent en Andalousie (1826) [8], the cultivars were described and classified based on morphological characteristics. Ampelography, the botanical discipline dedicated to the identification and classification of the varieties of grapevines, was traditionally based on the description and comparison of the shape and color of the vine leaves, grape clusters and berries [9]. More recently, from the last decades of the 20th century, molecular techniques based on the detection of both chloroplast and nuclear polymorphisms (DNA fingerprinting) by Simple Sequence Repeats (SSRs) have been widely used for the identification of cultivars as well as in the description of samples collected in the field [10,11,12,13,14,15]. Like in other disciplines of biology, molecular approaches have become the main trend in recent decades, while morphology was relegated to a second term, but now due to increased possibilities of obtention, storage and analysis of high-resolution images, morphometric approaches have witnessed interesting developments [16].
The seeds of grape, often called pips, present a high degree of variation, that is still higher in cultivars than in wild species [17]. In general, the seeds of cultivated varieties are more elongated than those of wild species. Thus, Planchon [18] defined two subgenera: Euvitis as those species with pear-shaped seeds, while species in subgen. Muscadinia had more rounded seeds, oblong to ovoid. The geometrical analysis of seed shape based on elliptical Fourier transform method has revealed useful in the discrimination of wild grapes and cultivars in agreement with results from microsatellites (SSRs), as well as to associate archaeological seeds with wild forms or other morpho-clades [19,20,21]. New developments of these techniques have included 3D scanning technology [22] allowing to discriminate between cultivars classified as identical by their SSR profiles, and the geochronological dynamics of the cultivars used in viticulture [23]. The groups obtained in these analyses may be associated with geometric figures representing graphically the morphological diversity of grape seeds and their relatedness to geometric forms.
A new method to describe and quantify seed shape in the Vitaceae including Vitis species based on geometric shapes was recently published. The seeds of different Vitis vinifera cultivars were described based on the comparison of their images with different geometric models [24]. The models were based on the heart and piriform curves [25,26], as well as the graphic representation of an equation composed by two parts representing a modified ellipse (Model 7 in [24]). The protocol is based on a parameter (J index) that quantifies the degree of similarity between seed images and geometric figures [27,28]. J index was first applied to the model plant Arabidopsis thaliana [29,30], then to the model legumes Lotus japonicus and Medicago truncatula [31] and to other species belonging to a variety of plant families [32,33,34,35,36,37,38], including the description of seed morphology in the complex genus Silene L., in the family Caryophyllaceae [39].
The first approximation to seed shape in the Vitaceae by this method involved a reduced number of cultivars (Camarate, Cariñena, Cercial, Malvasía, Merseguera and Morenillo), but enough to detect differences in shape associating each cultivar to a different geometric model [24]. While cultivar Merseguera gave better results with Model 5, an elongated heart curve, Model 7 resembled more closely seed shape in a majority of cultivars tested (Camarate, Cercial, Malvasía and Morenillo) [24]. Model 7 has revealed interesting because changes in the corresponding equation result in diverse curves that reproduce well the outline of seed shape of many cultivars, that subsequently may be grouped according to the different models.
The objective of this work was to compare selected cultivars in the Core germplasm collection of Vitis maintained in “El Encín” [40] with new geometric models. Of the new models, nine were obtained from the algebraic modification of Model 7 and one was derived from Model 6 [24]. A representative sample of 38 cultivars were chosen among the total of germplasm entries of the collection. The criteria for selection included their antiquity, historical relevance and broad international application in viticulture, as well as their diversity in shape, covering an important proportion of this aspect in the collection. In relation to previous results [24], this work represents a significant advance, both in the number and relevance of cultivars used as in the number of new models described, with each model defining a new morphological group.

2. Materials and Methods

2.1. Plant Material

The 38 cultivars used in this study are described in Appendix A Table A1.

2.2. Seed Images

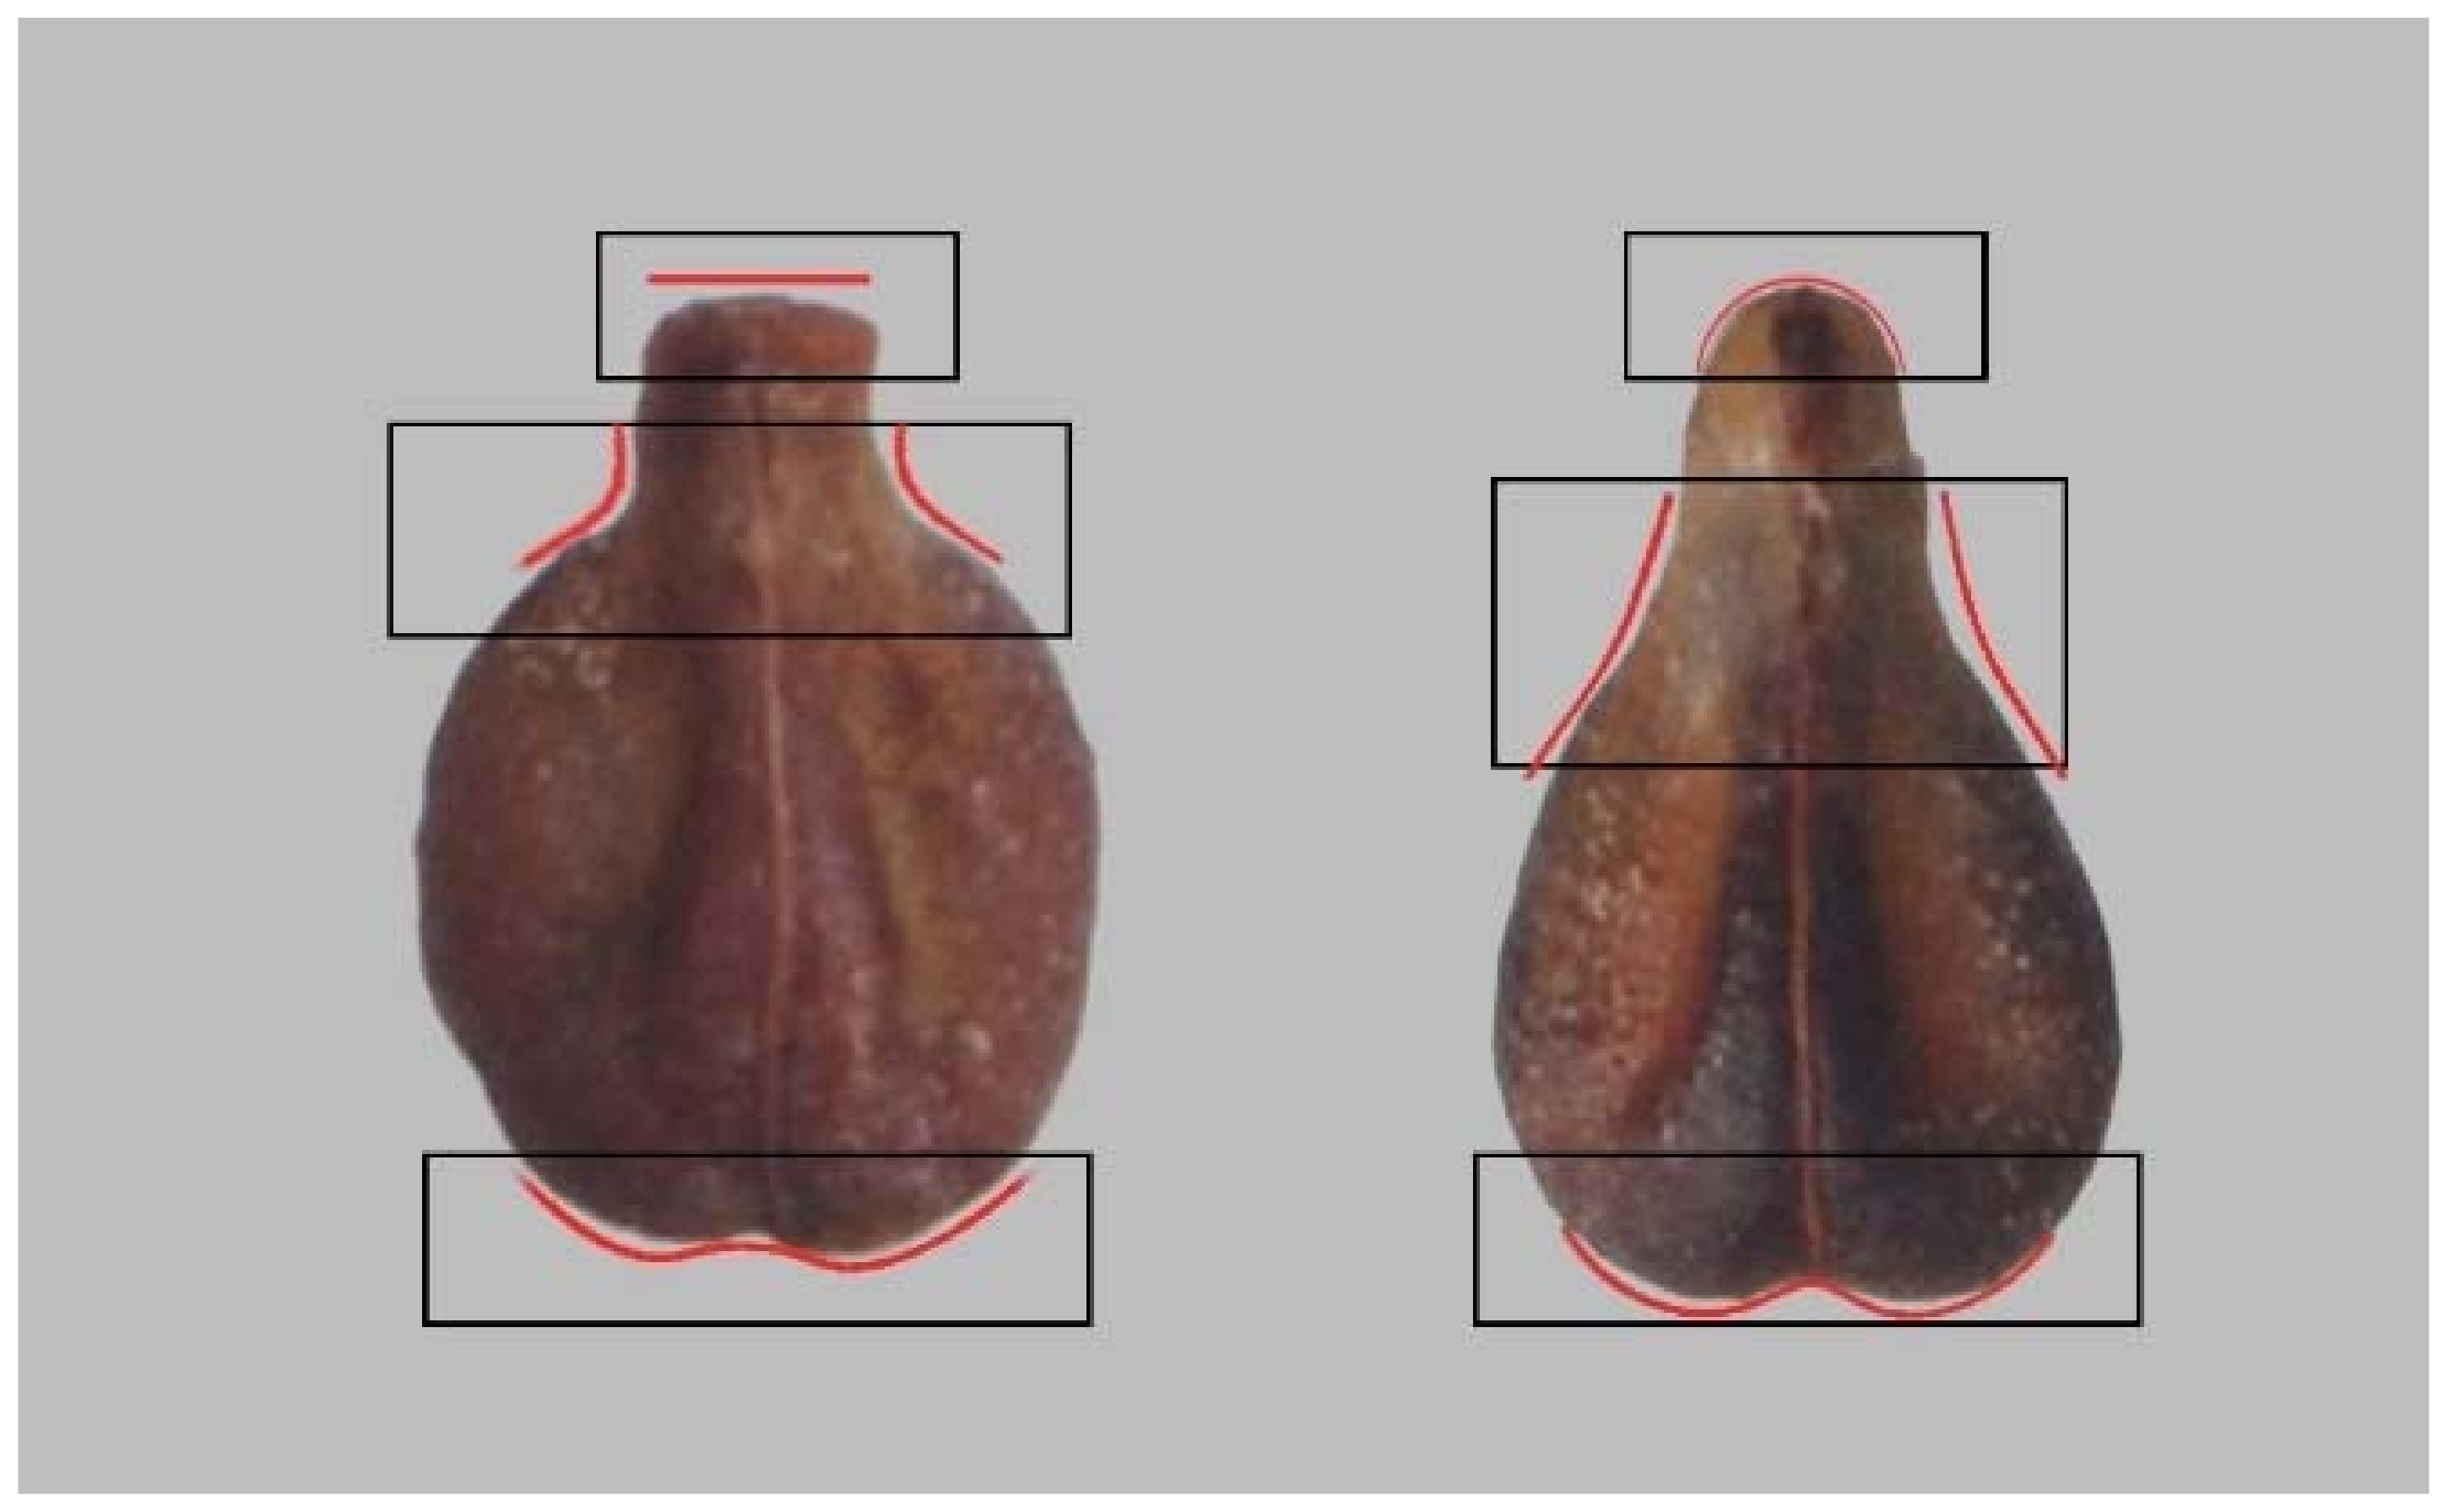
Photographs were taken with a D80 10.2 megapixel camera (Nikon, Madrid, Spain). The seeds (30 per cultivar) were oriented with their chalaza downwards, such as to expose the ribs upwards (ventral orientation) and straight in the middle to provide each seed image a maximum of symmetry (Figure 1). Features observed in the elaboration of the new models include the line at the top (flat, round or sharp), the curves defined by the edges of the peduncle and the curvature at the basis. Composed images containing 30 seeds per accession were prepared with Corel Photo Paint (Corel Co., Ottawa, ON, Canada) and are stored in: https://zenodo.org/record/4433813#.X_7hiOhKh9A (accessed 8 April 2021) Supplementary File 1.

2.3. General Morphological Description by Image Analysis

The area (A), perimeter (P), length of the major axis (L), length of the minor axis (W), aspect ratio (AR is the ratio length/width), circularity (C) and roundness (R) were measured for each seed image and the calculations were done for all 30 seeds in each composed figure with ImageJ [41]. Length and width are the Feret diameters of the seed images. Feret, or caliper diameter, is the distance between two parallel planes restricting the object. All the seeds were vertically oriented, so length and width correspond respectively with the vertical and horizontal Feret diameters. Circularity Index and Roundness were calculated as described [42]. Circularity is the ratio 4πA/P2, while Roundness is 4A/(πL2), thus Circularity values decrease with surface irregularities, while Roundness values are insensitive to them.

2.4. Obtention of the New Models

New models were obtained by modifications in the equations corresponding to Models 6 and 7 previously described [24]. The objective was to search for a maximum similarity between the seed images of each cultivar and the graphic representation of the equations. The 38 cultivars under study were classified in ten groups defined by their similarity to each of the respective models.

2.4.1. Obtention of an Average Silhouette for Each Cultivar

The average silhouette is a representative image of seed shape for each cultivar. It was obtained in Corel Photo Paint, by the following protocol (Supplementary File 2; a detailed video is available at Zenodo: https://zenodo.org/record/4478344#.YBPOguhKiM8, accessed 8 April 2021): The layers containing the seeds are superimposed and the opacity is given a value of 3 in all layers. All the layers are combined, and the brightness is adjusted to a minimum value. From this image we are interested in the inner region representing the area where most of the seeds coincide, which is the darkest area. To select it, we use the magic wand tool and with tolerance equal to 10, this selection is copied and pasted as a new layer.

2.4.2. New Models

Ten new geometric models were obtained from the modification of previously described equations, whose geometric representation gives figures resembling the silhouette of Vitis seeds. The equations were modified searching for the similarity of their representation to seed shape of the different cultivars. Of the new models, nine were obtained from Model 7 [24], and derive from the representation of two functions, one corresponding to the upper part of the seed containing the peduncle and the other to the lower part. Both functions were combined in a single equation. The remaining tenth model (de Cuerno) was derived from Model 6, the Fibonnacci’s pear [24]. The models are described in Section 3.1.

2.5. Quantification of Similarity between the Seeds and the Models: J Index

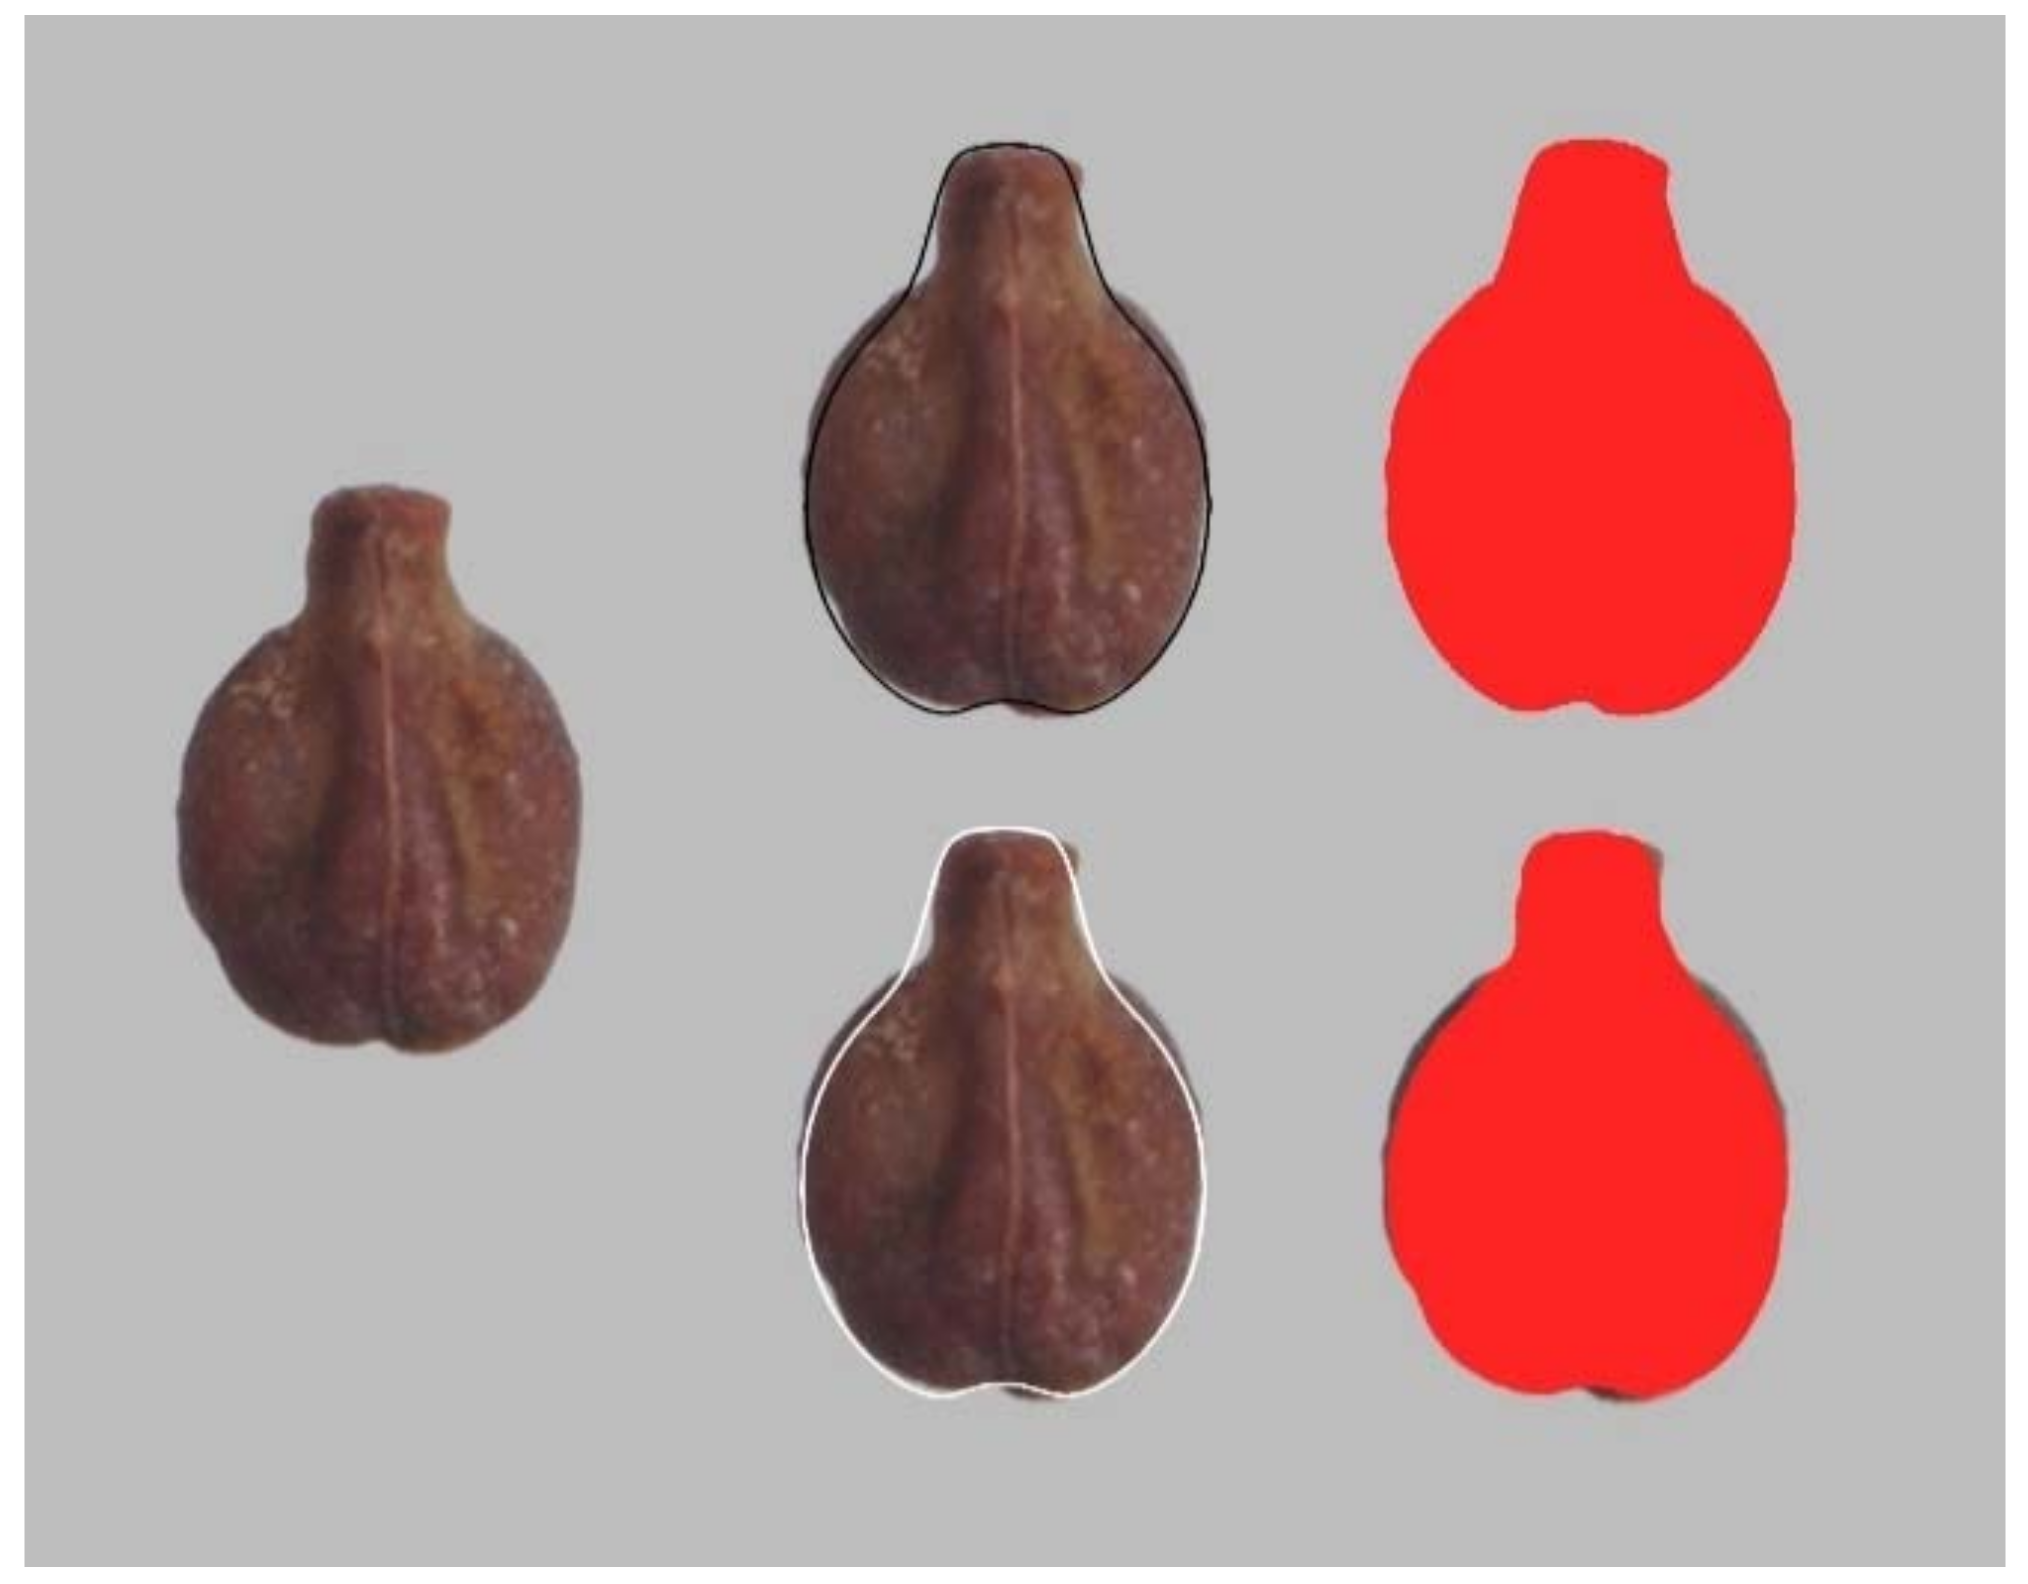
J index is the percent of similarity between two plane figures: The seed image and the geometric model. To obtain J index the model is superimposed to each seed image in the groups of 30 seeds per cultivar with Corel PhotoPaint. Images are kept for each group of 30 seeds with the models superimposed (PSD). Once the 30 models are adjusted, two documents are kept: A JPEG file with the models in black and another with the models in white. Both are successively opened with Image J, and the corresponding areas quantified. The figure with the models in black gives the total area (T), while the figure with the models in white gives the values of shared area between the model and the seed image (S) (Figure 2). All images used in the calculations are stored in Zenodo (Supplementary File 3; https://zenodo.org/deposit/4478301, accessed 8 April 2021). J index is the ratio S/Tx100 and has a maximum value of 100 when both areas coincide. A video showing the process has been uploaded in Zenodo (Supplementary File 4; https://zenodo.org/record/4478315#.YBPKFuhKiM8, 8 April 2021).

3. Results

3.1. New Models

The Mathematica code for the ten new models described in this work is stored in Zenodo (Supplementary File 5; https://zenodo.org/record/4478500#.YBPetOhKiM8, accessed 8 April 2021). The following nine models were obtained from modifications in Model 7 [24] (between parenthesis the cultivars to which the model applies):
Listán Prieto model (Listán Prieto and Tortozona Tinta):
2 17 3300 90 x 2 400 24 + 5 x 2 + y 25 187 3300 90 x 2 1200 60 + x 6 + y = 0 ;
Sylvestris model (wild varieties):
33 x 2 + 50 17 + 10 x 18 1 / 5 9 y 10 25 22   33 x 2 + 4 5 + x 2 + x 4 9 y 10 = 0 ;
Albillo Real model (Alarije, Albillo Real, Cayetana Blanca, Graciano, Juan García and Tempranillo):
y 25 33 x 2 22 125 33 + 11 x 8 200 y + 25 22 33 x 2 50 11 5 + x 2 + x 4 = 0 ;
Hebén model (Hebén, Macabeo and Zalema):
9 y 10 + 33 x 2 25 33 + 55 x 2 9 y 10 25 22 33 x 2 + 20 6 + x 4 = 0 ;
Moscatel model (Beba, Bruñal, Caíño Tinto, Castellana Blanca, Garnacha Tinta, Gewürztraminer, Malvasía Aromática, Mollar Cano, Moscatel de Alejandría, Moscatel de Grano Menudo, Palomino Fino, Prieto Picudo):
9 y 10 + 25 22 33 x 2 4 5 + x 2 + x 4 9 y 10 25 22 33 x 2 + 2000 600 + x 8 = 0 ;
Tortozón model (Imperial and Tortozón):
17 y 20 + 33 x 2 25 33 + 55 x 2 17 y 20 25 22 33 x 2 + 20 6 + x 4 = 0
Teta de Vaca model (cultivars Teta de Vaca Dominga, and Verdejo):
4 y 5 33 x 2 10000 3400 + 317 x 18 / 5 4 y 5 + 25 22 33 x 2 4 5 + x 2 + x 4 = 0 ;
Doña Blanca model (Doña Blanca, Monastrell and Pedro Ximénez):
33 x 2 4 5 + x 2 + x 4 + 22 25 y 33 x 2 + 2000 600 + x 8 88 y 125 = 0 ;
Airén model (Airén, Bobal and Mazuela):
33 x 2 16 12 + 17 x 2 + y 25 22 33 x 2 17600 2640 + 17 5   x 5 + y = 0 ;
In contrast with the previous models that derive from Model 7, model De Cuerno was obtained from the modification of Model 6, the Fibonnacci’s pear [24]:
De Cuerno model (De Cuerno)
It results from the graphic representation of the implicit equation:
49 x 2 + 25 y 2 ( 117649 x 6 + 15625 y 3 2 y 2 + y 1 2 + 60025 x 4 3 y 2 4 y + 2 + 30625 x 2 3 y 4 8 y 3 + 8 y 2 + y + 4 = 962500 ;
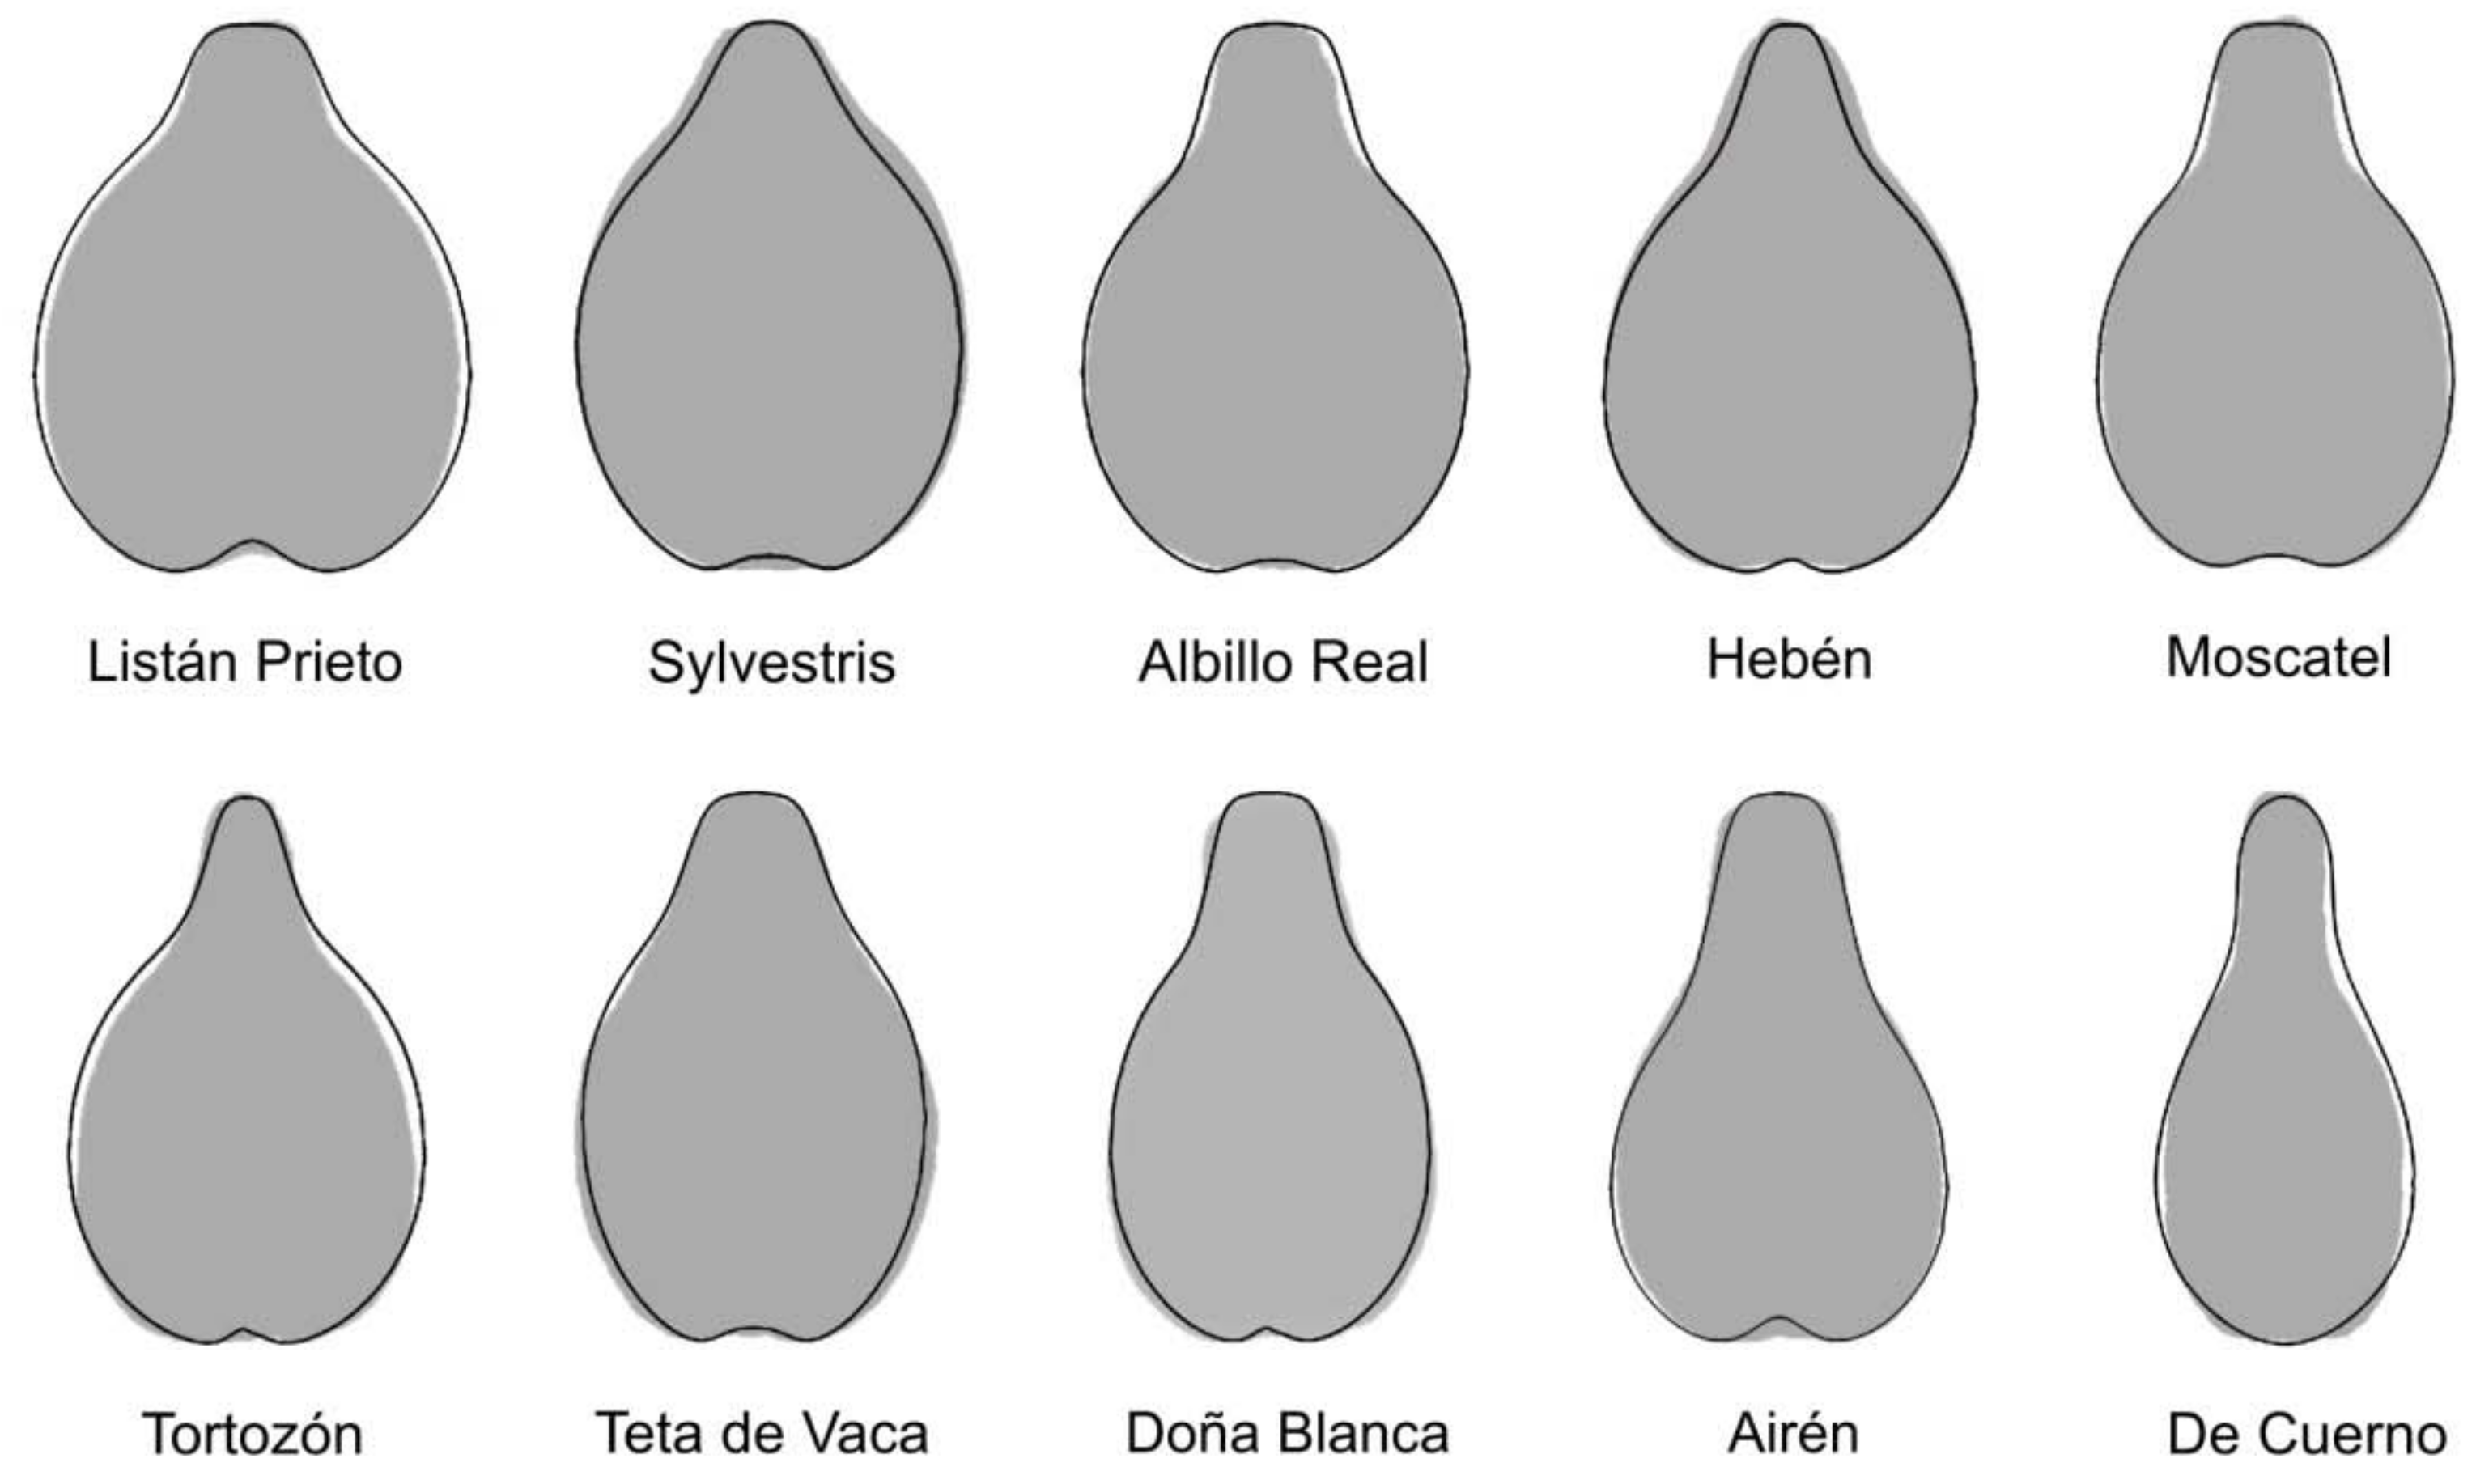
The new models obtained from the graphic representation of these functions are shown in Figure 3 superimposed to the average silhouettes of the cultivars that gave higher values with each model as indicated in Table 1.

3.2. General Morphological Description and Comparison between the Seeds of Different Groups

Table 2 presents the mean values for area, perimeter, length, width, aspect ratio (AR), circularity and roundness for the groups of cultivars and the results of ANOVA.
The aspect ratio (AR) values follow an opposite trend to those of circularity and roundness. Differences between the later are due to surface irregularities, that result in decreased roundness. Values of area were comprised between 13.8 mm2 (Sylvestris) and 29.1 mm2 (De Cuerno). The minimum values of perimeter (14.8 mm), length (5.0 mm) and width (3.5 mm) corresponded to the wild varieties (Sylvestris) which had also low aspect ratio values. Listán Prieto was the unique group with higher values of roundness and lower values of aspect ratio than the group containing the sylvestris cultivars.
Table 1 presents a list of the groups formed by the cultivars resembling each model. Underlined are the cultivars with the highest values of J index within each one.

3.3. Groups of Cultivars for Each of the Models

3.3.1. Listán Prieto Model

Among the cultivars characterized by a peduncle plane at the top, Listán Prieto is the one with higher roundness (lower Aspect Ratio). Cultivars Listán Prieto and Tortozona Tinta gave high values of J index with Model Listán Prieto (Figure 4, Table 3).
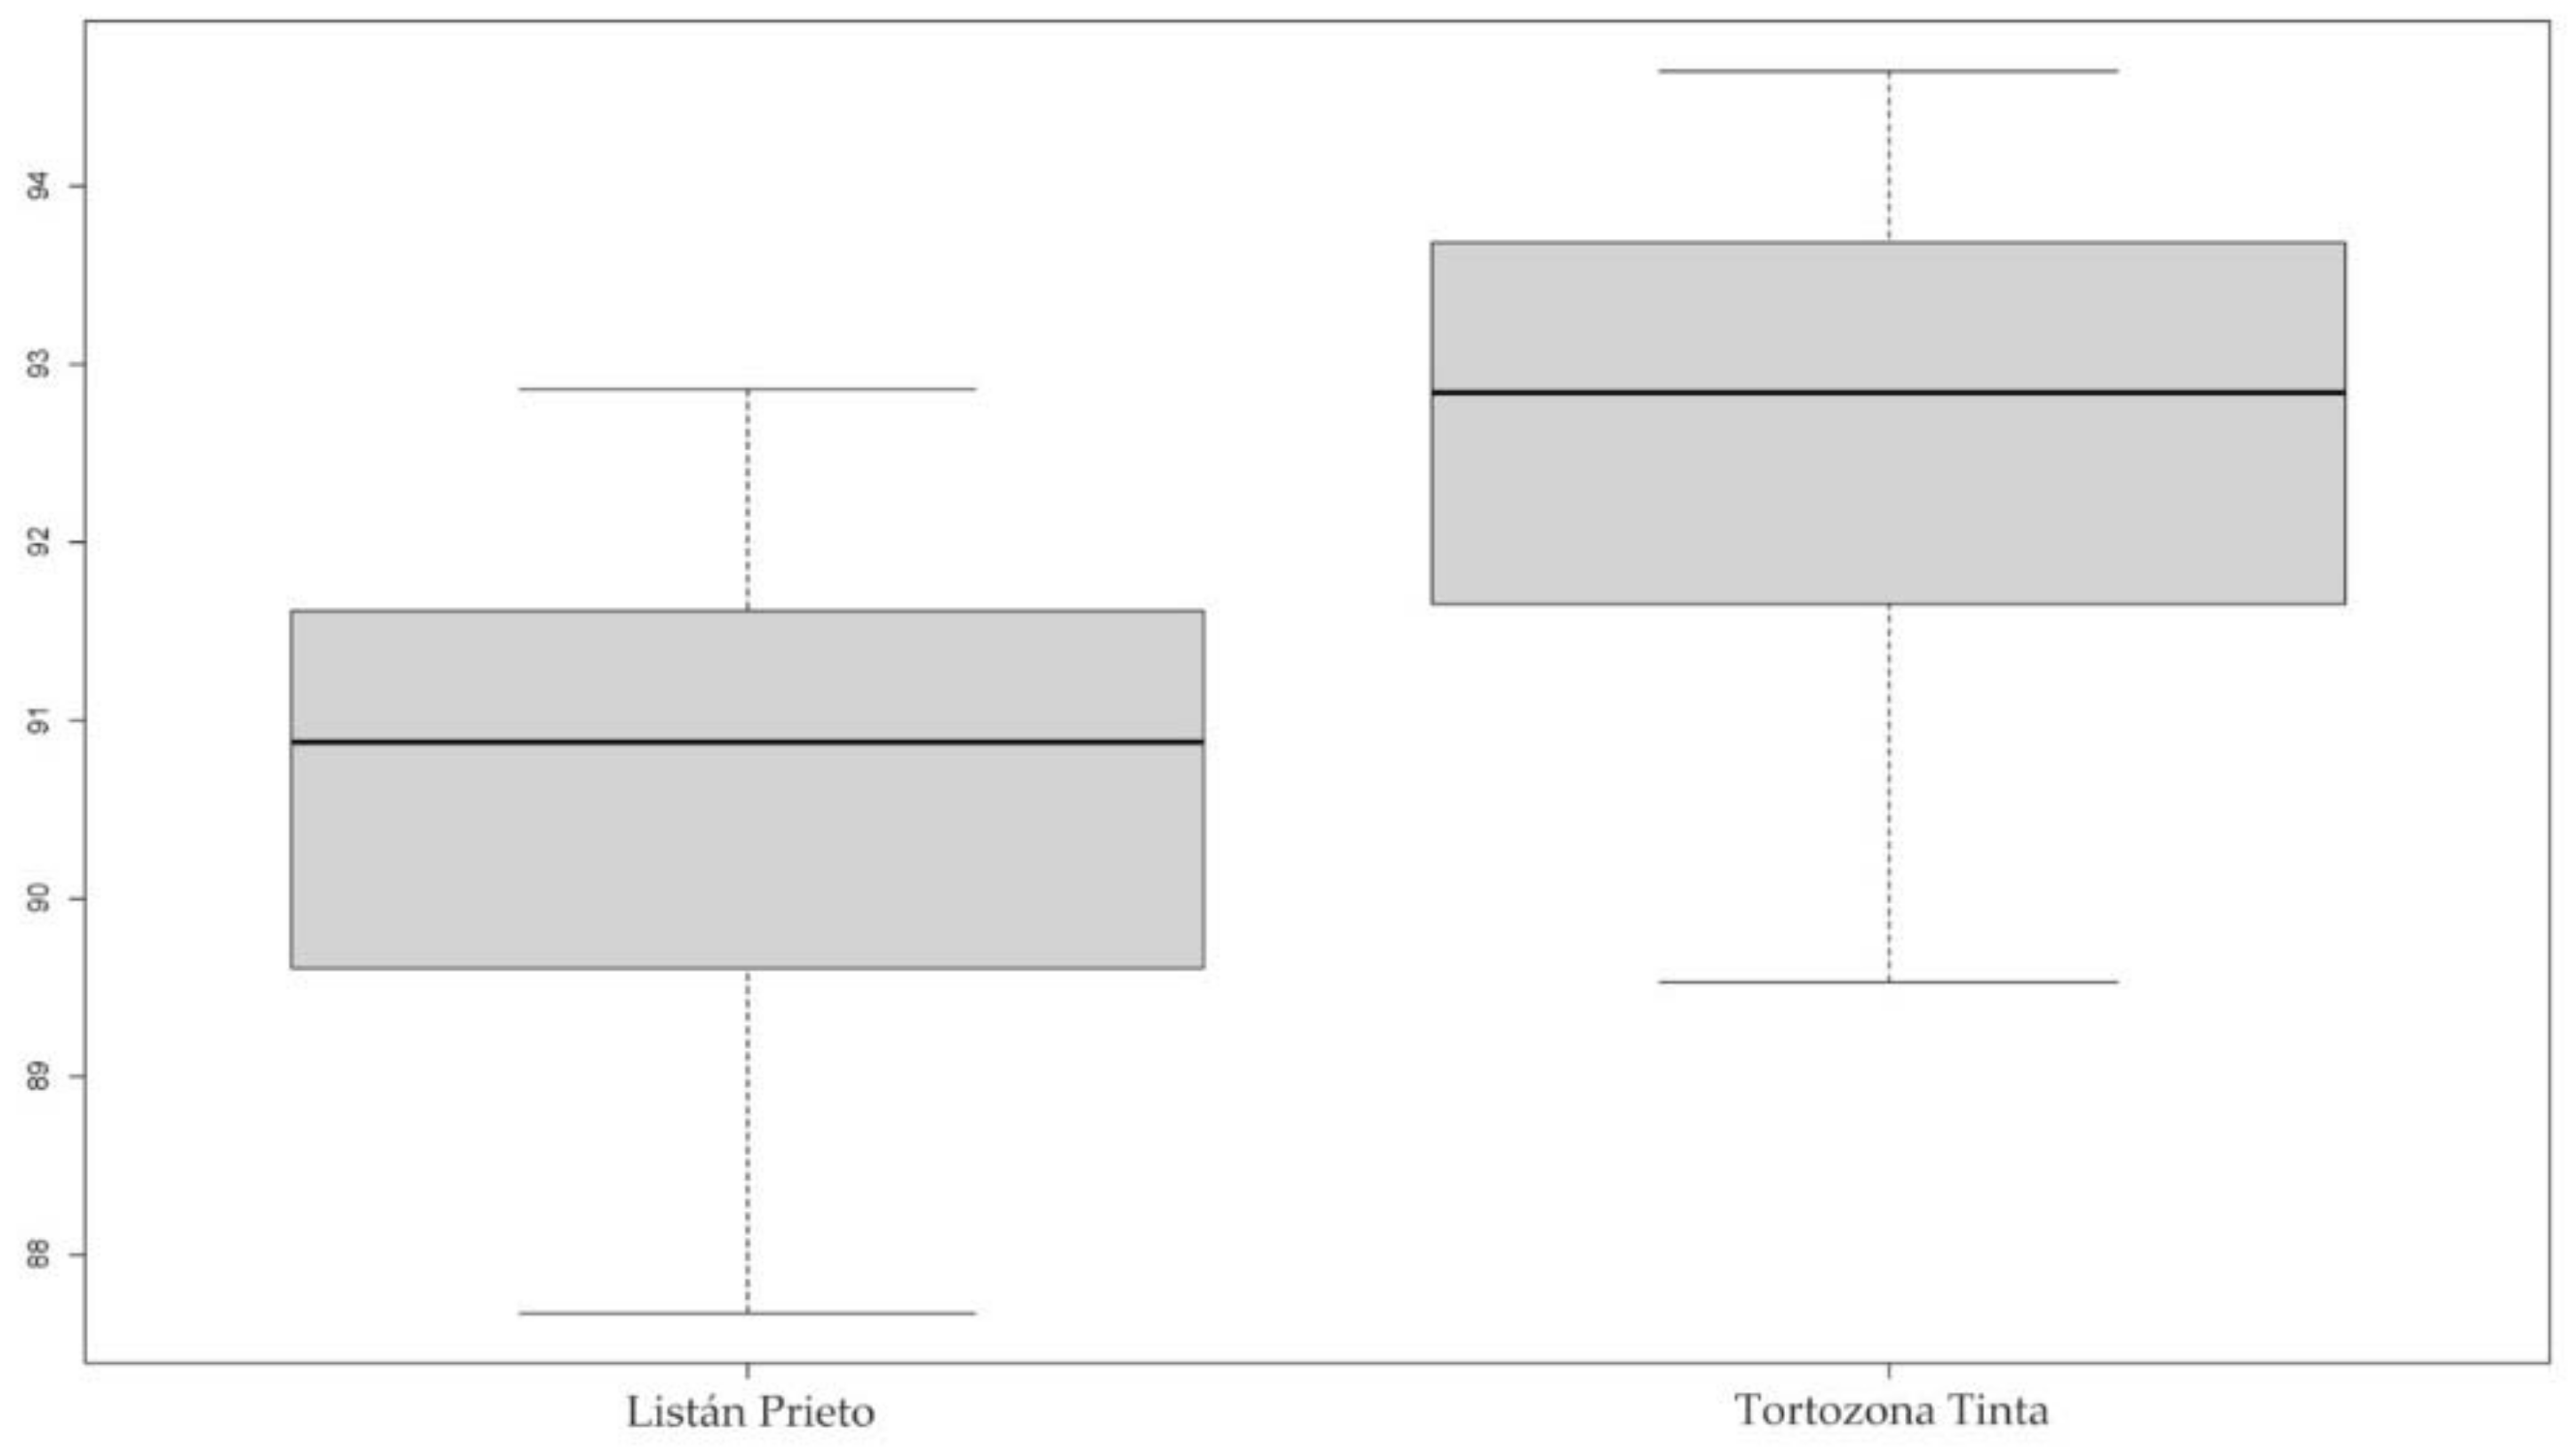
Figure 5 contains the Box-plot representations of the values of J index for the varieties Listán Prieto and Tortozona Tinta with the Listán Prieto model.

3.3.2. Sylvestris Model

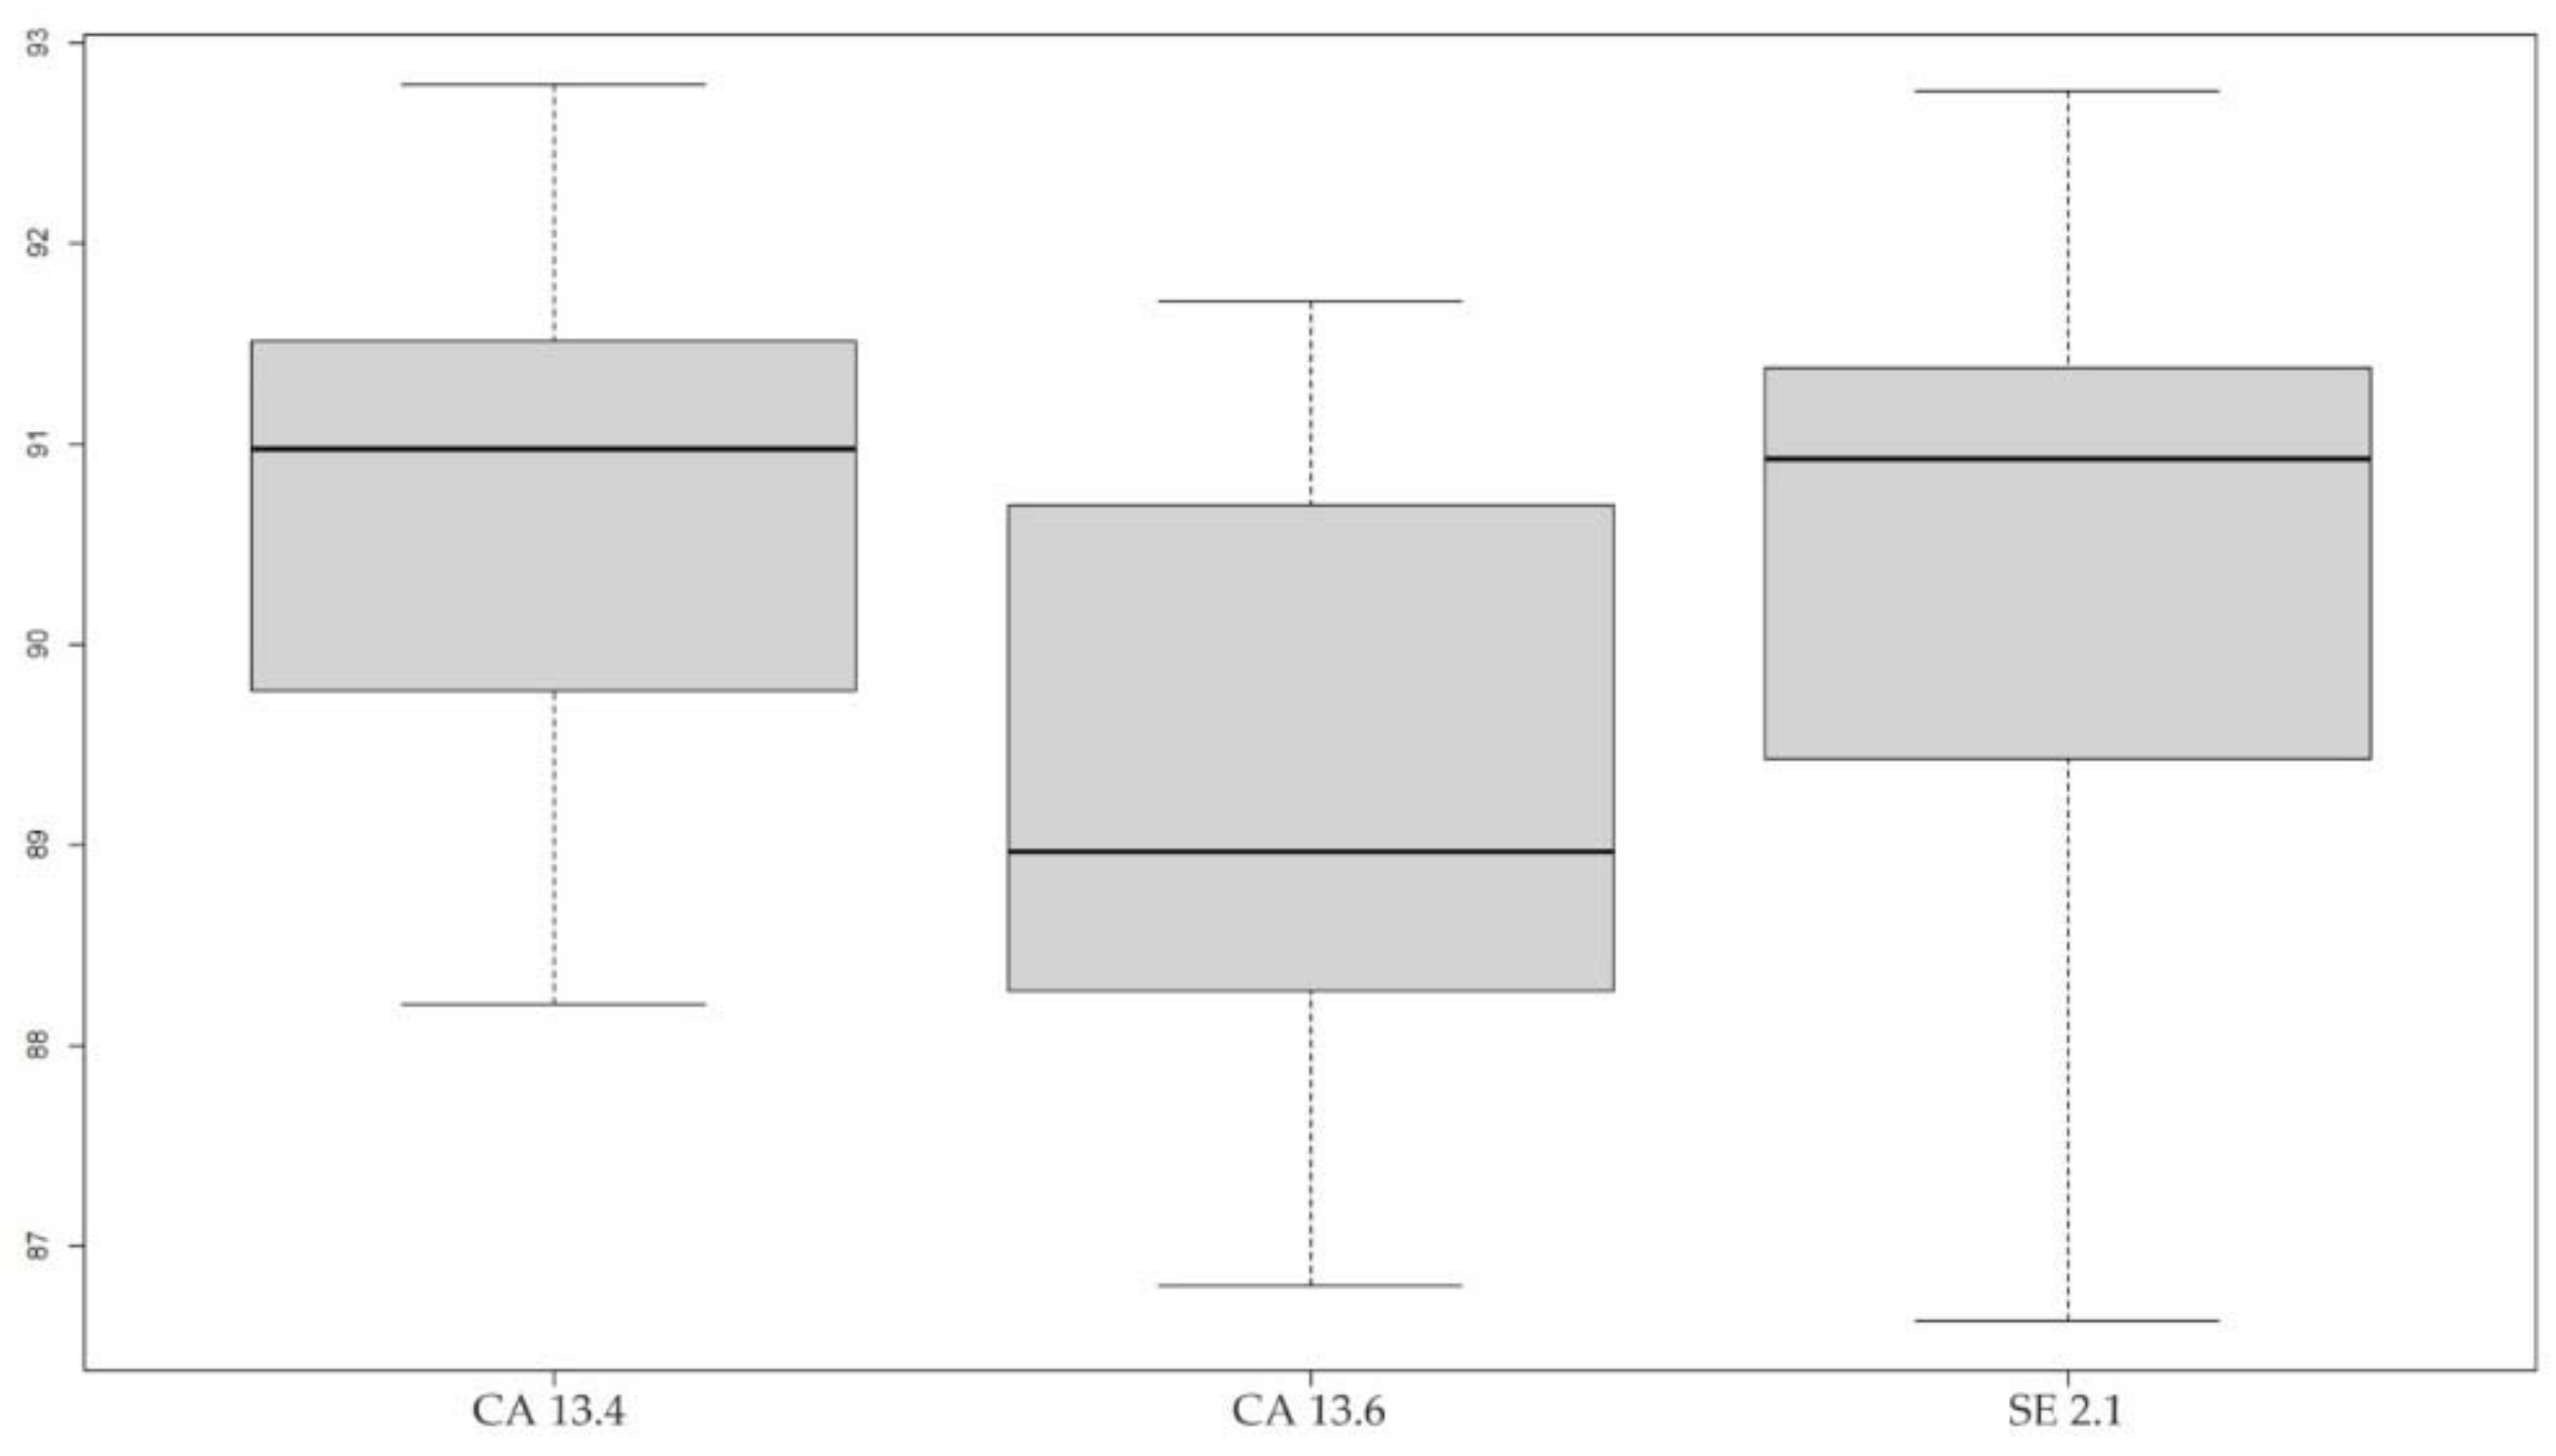
Three cultivars gave high values of J index with the Sylvestris model (Figure 6, Table 4). These are CA 13.4, CA 13.6 and SE 2.1. Scheffé test indicates that here is a difference between the mean J index values of CA 13.4 and CA 13.6.
Figure 7 contains the Box-plot representations of J index values for the varieties CA 13-4, CA 13-6 and SE 2-1.

3.3.3. Albillo Real Model

The cultivars Alarije, Albillo Real, Juan García and Tempranillo gave J index values higher than 90 with the Albillo Real model. Figure 8 shows the sum of the silhouettes, a representative silhouette, the model Albillo Real and the photographs of four seeds representative of this cultivar. Table 5 presents the values of área and J index in these cultivars and the results of the ANOVA test. Several different groups were found in seed size (area), but only Albillo Real and Juan Garcia can be considered different in J index values.
Figure 9 contains the Box-plot representations with values of J index for the varieties Alarije, Albillo Real, Cayetana Blanca, Graciano, Juan García and Tempranillo.

3.3.4. Hebén Model

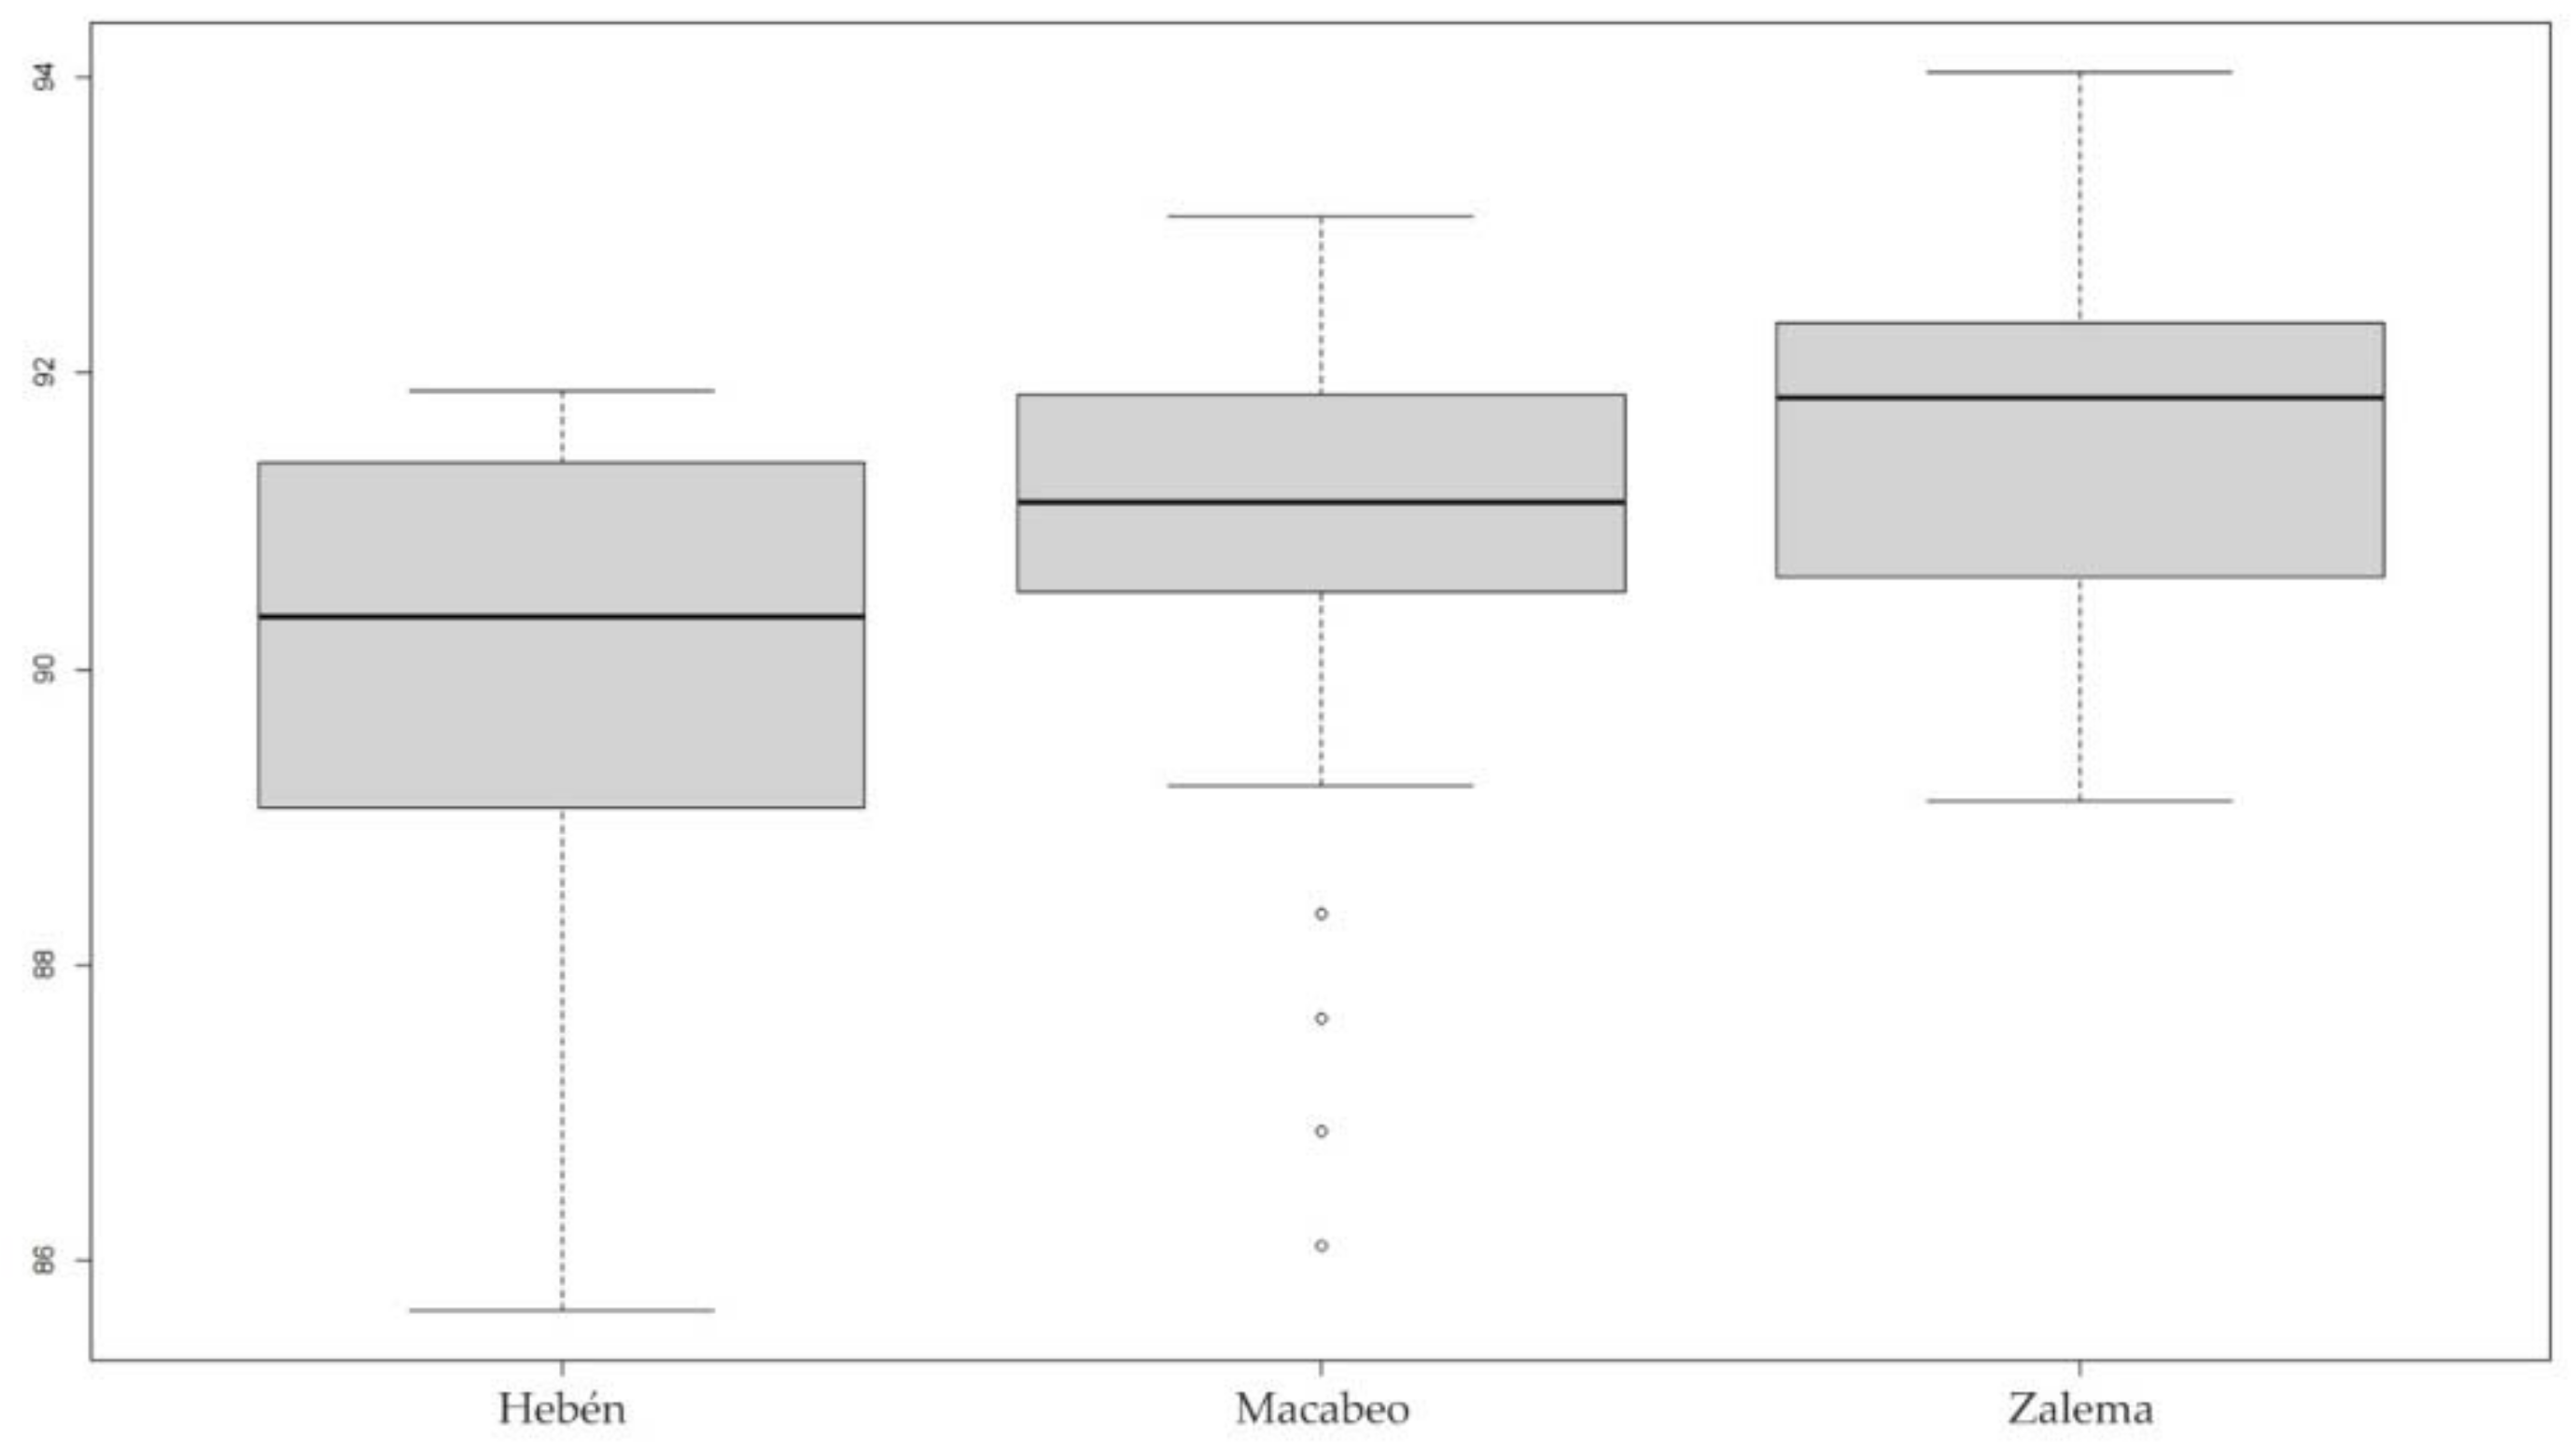
Three cultivars gave high values of J index with the Hebén model, namely Hebén, Macabeo and Zalema. Figure 10 shows the Hebén model, with representative seeds of this cultivar. Table 6 presents the values of J index obtained with the Macabeo model in the five indicated cultivars.
Figure 11 contains the Box-plot representations of the J index values for the varieties Hebén, Macabeo and Zalema with the Hebén model.

3.3.5. Moscatel Model

Cultivars Beba, Bruñal, Caiño Tinto, Castellana Blanca, Garnacha Tinta, Gewürztraminer, Malvasía Aromática, Mollar Cano, Moscatel de Alejandría, Moscatel de Grano Menudo, Palomino Fino and Prieto Picudo gave high J index values with the Moscatel model (Figure 12, Table 7).
Figure 13 contains the Box-plot representations with the J index values of the varieties Beba, Bruñal, Caíño Tinto, Castellana Blanca, Garnacha Tinta, Gewürztraminer, Malvasía Aromática, Mollar Cano, Moscatel de Alejandría, Moscatel de Grano Menudo, Palomino Fino and Prieto Picudo.

3.3.6. Tortozón Model

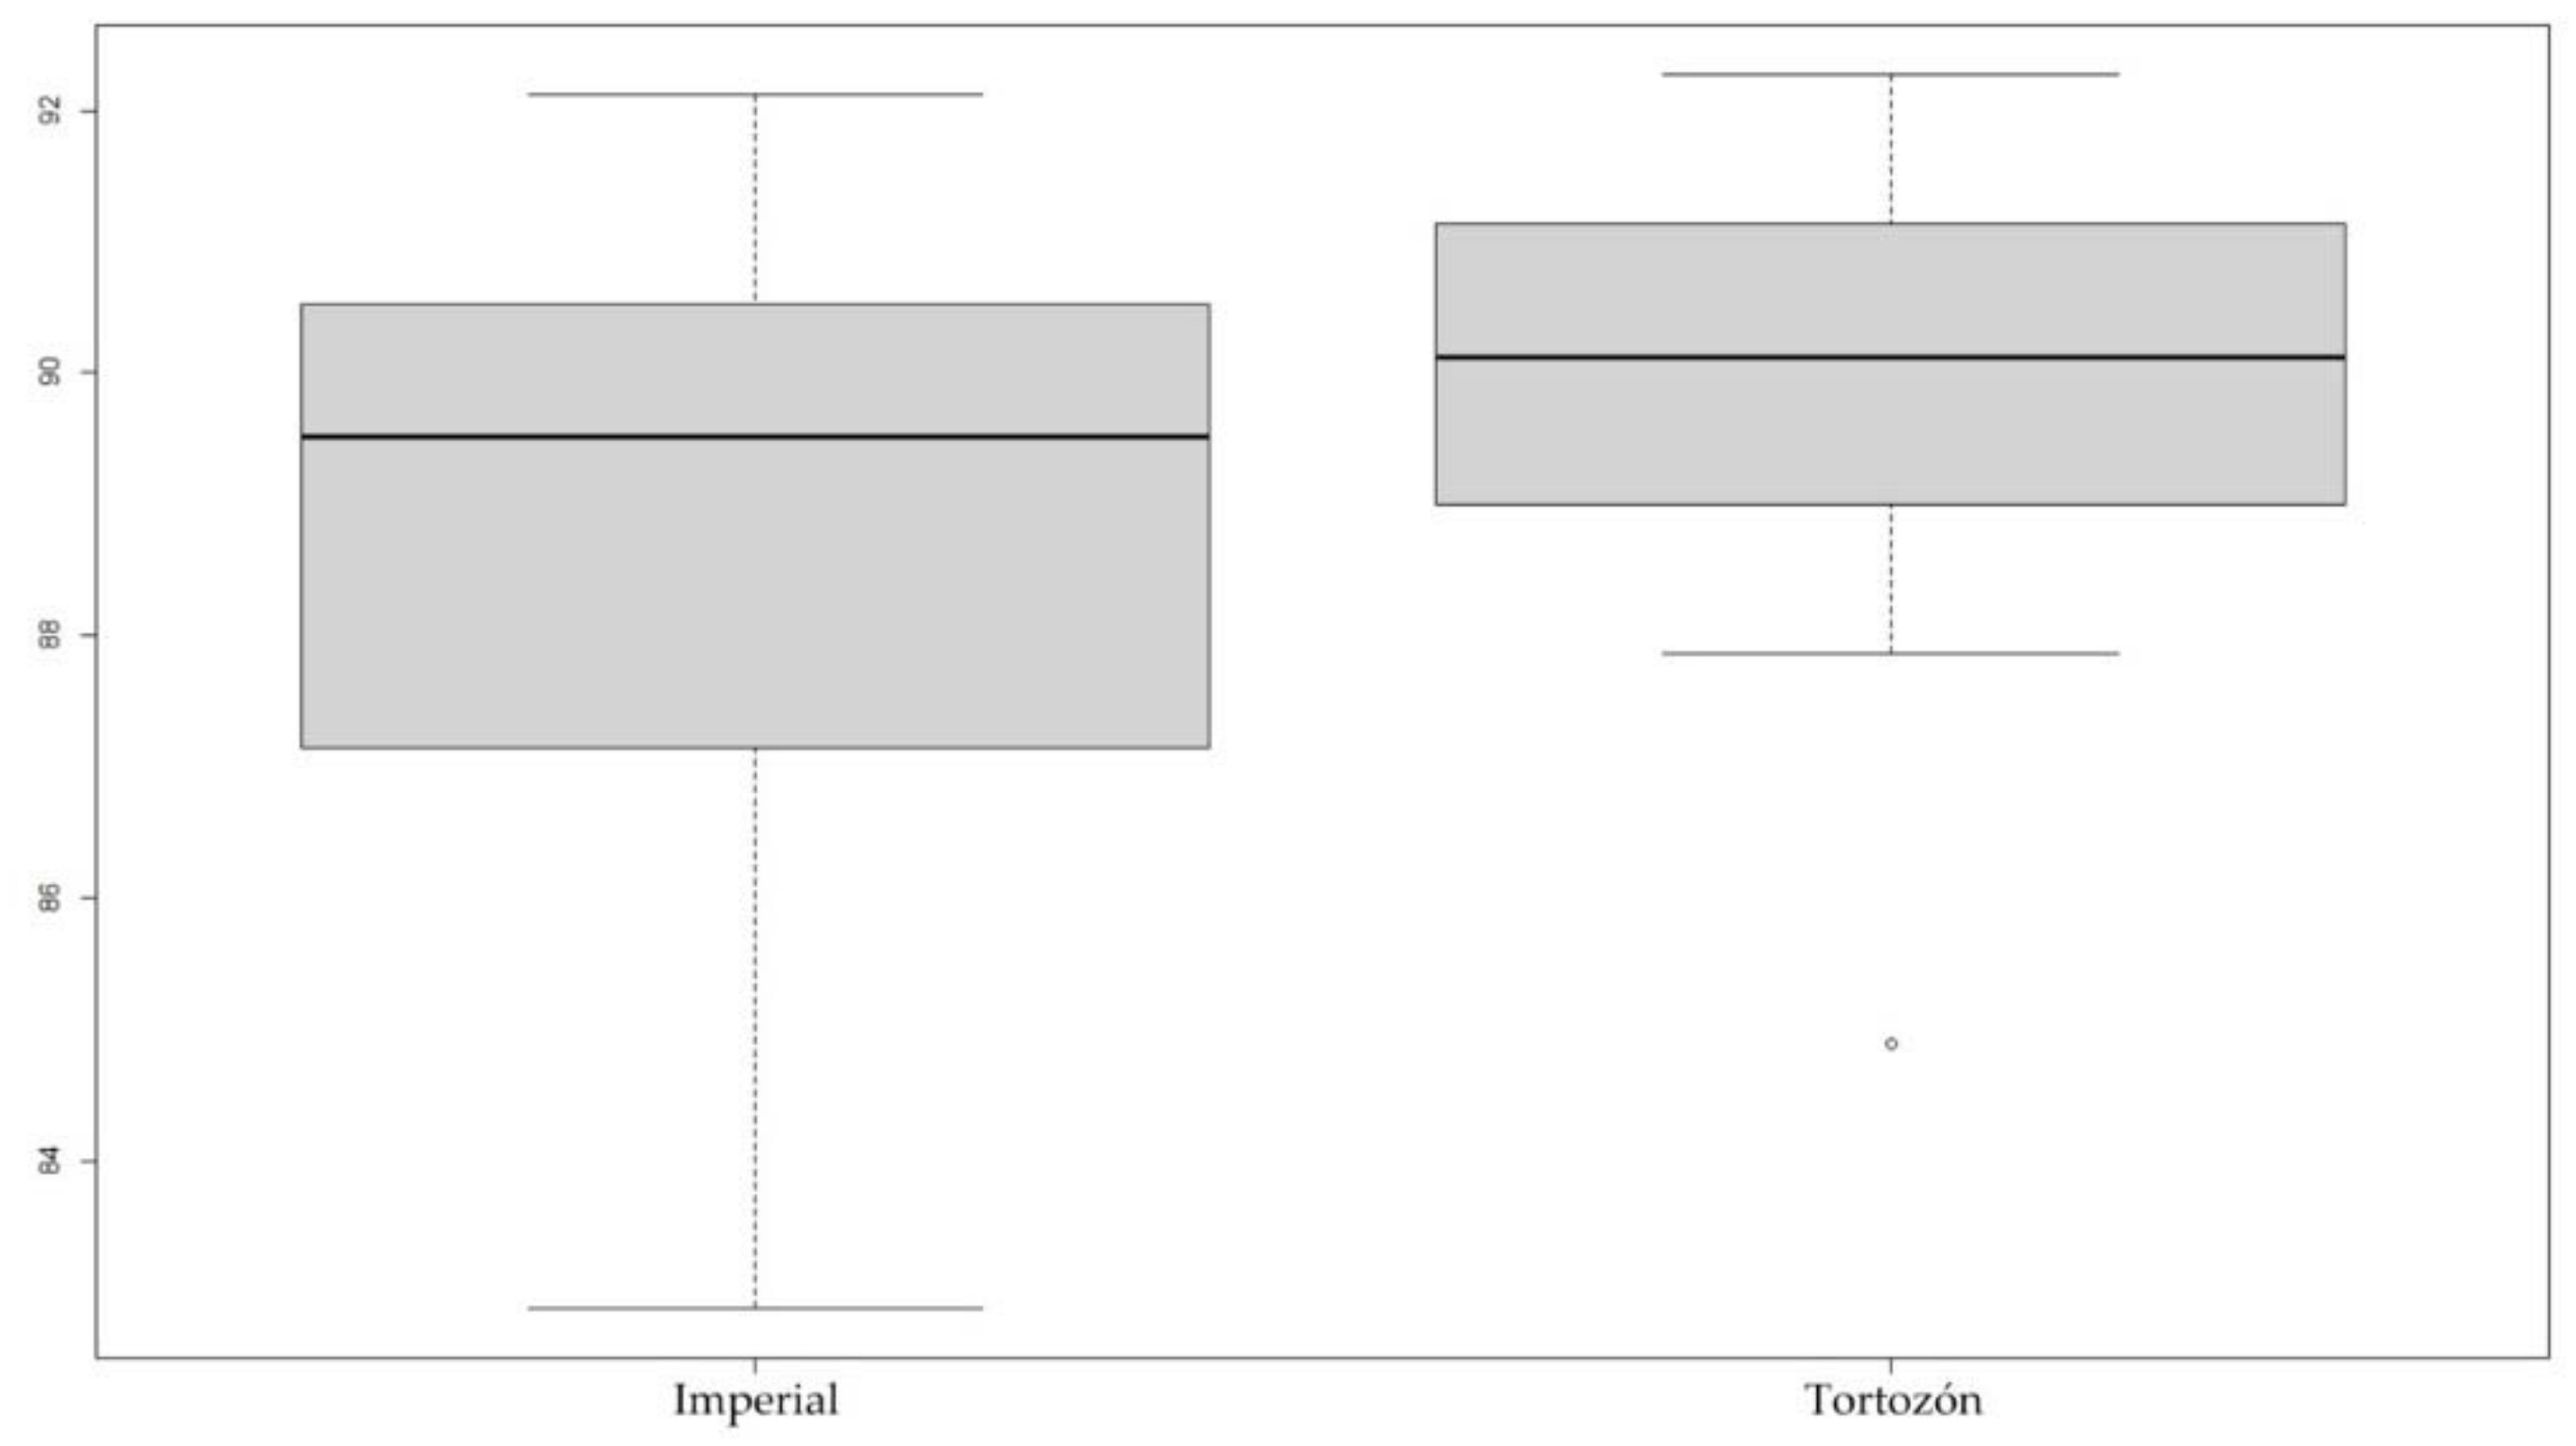
The seeds of cultivars Imperial and Tortozón resemble the Hebén model but are smaller and with a thinner peduncle. Change in size does not imply a change in shape, but the thickness of the peduncle, does. Both cultivars gave high values with the Tortozón model and there was no difference in area between them. Figure 14 shows the Tortozón model, with representative seeds of this cultivar. Table 8 presents the J index values obtained with the Tortozón model in the cultivars Imperial and Tortozón.
Figure 15 contains the Box-plot representations of the J index values for the varieties Imperial and Tortozón with the Tortozón model.

3.3.7. Teta de Vaca Model

Three cultivars gave high J index values with the Teta de Vaca model (Figure 16, Table 9). These are Dominga, Teta de Vaca and Verdejo. There is no difference in J index values between these three varieties, that are only distinguishable by their differences in area, the seeds of Teta de Vaca being larger, Verdejo, smaller and Dominga, with intermediate values.
Figure 17 contains the Box-plot representations of J index values for the varieties Dominga, Teta de Vaca and Verdejo with the Teta de Vaca model.

3.3.8. Doña Blanca Model

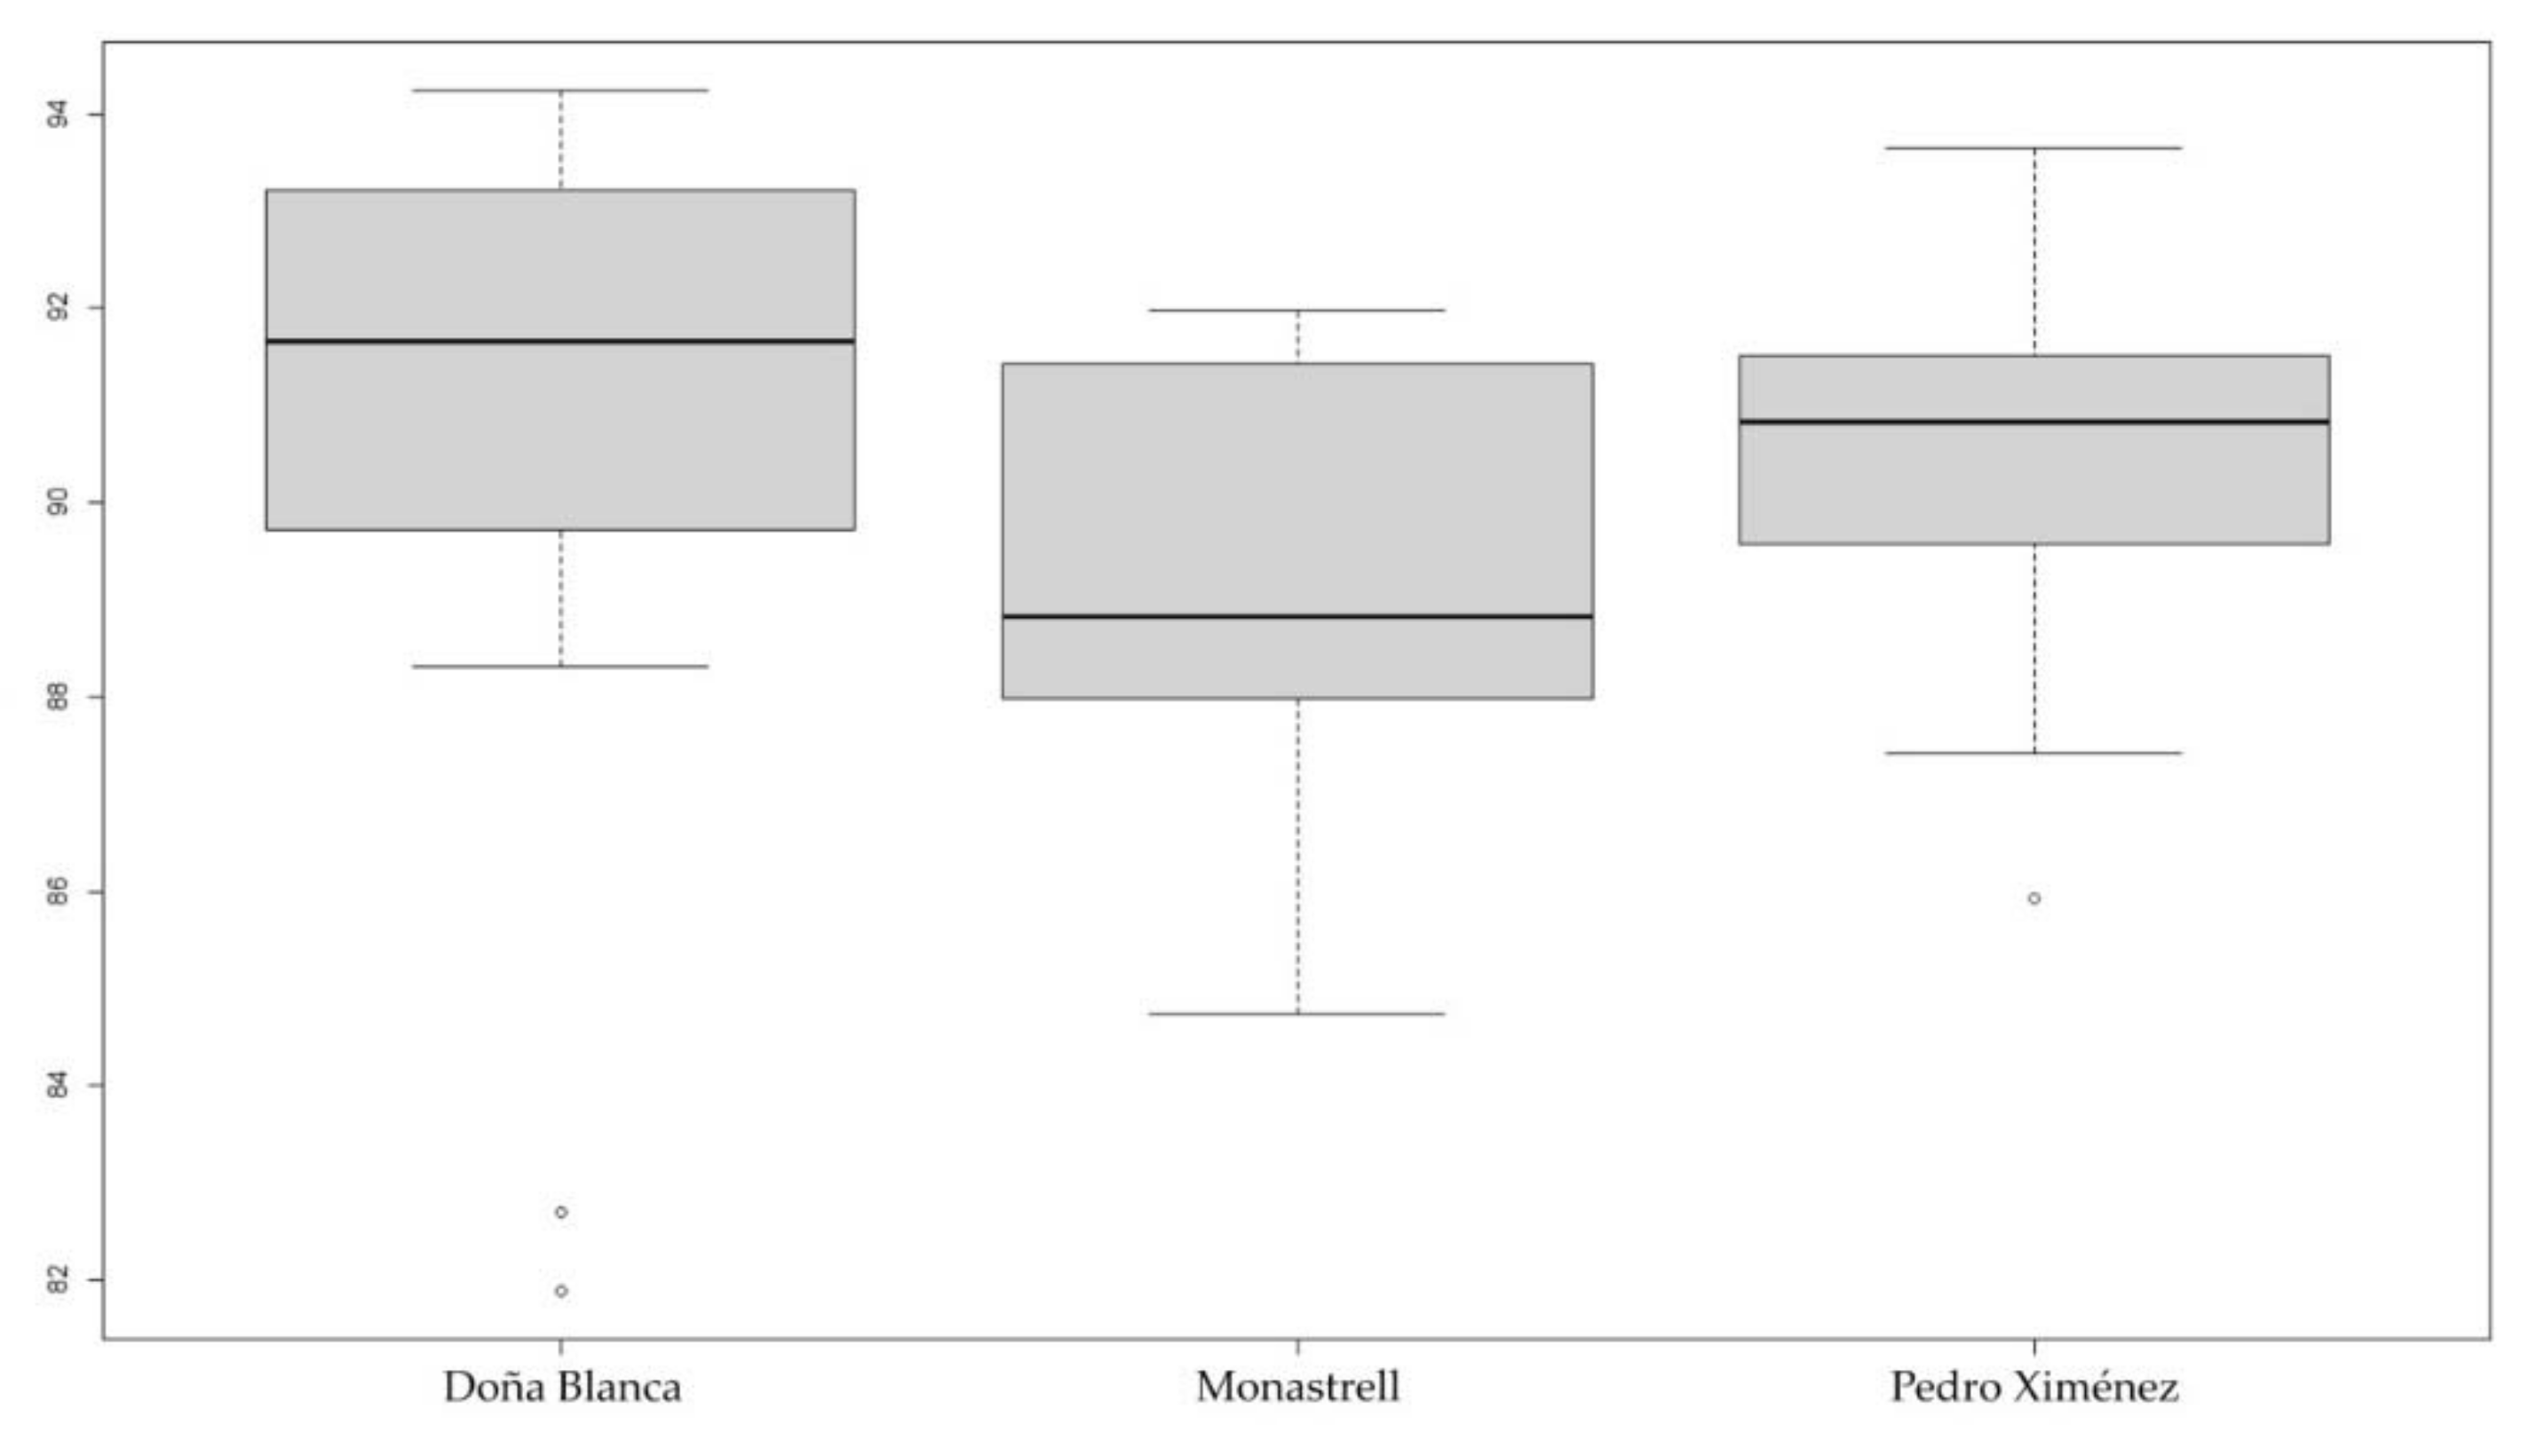
The seeds of cultivars Pedro Ximénez, Doña Blanca and Monastrell resemble the Moscatel model, but are more elongated. Figure 18 shows the Doña Blanca model, with the average silhouette and representative seeds of this cultivar. Table 10 presents the values of area and J index obtained with the Doña Blanca model in the cultivars Doña Blanca, Monastrell and Pedro Ximénez. The J index values obtained with this model are higher in Doña Blanca than in Monastrell. Area values are higher in Monastrell and smaller in Pedro Ximénez. Figure 19 contains the Box-plot representations of J index values for the varieties Doña Blanca, Monastrell and Pedro Ximénez with the Doña Blanca model.

3.3.9. Airén Model

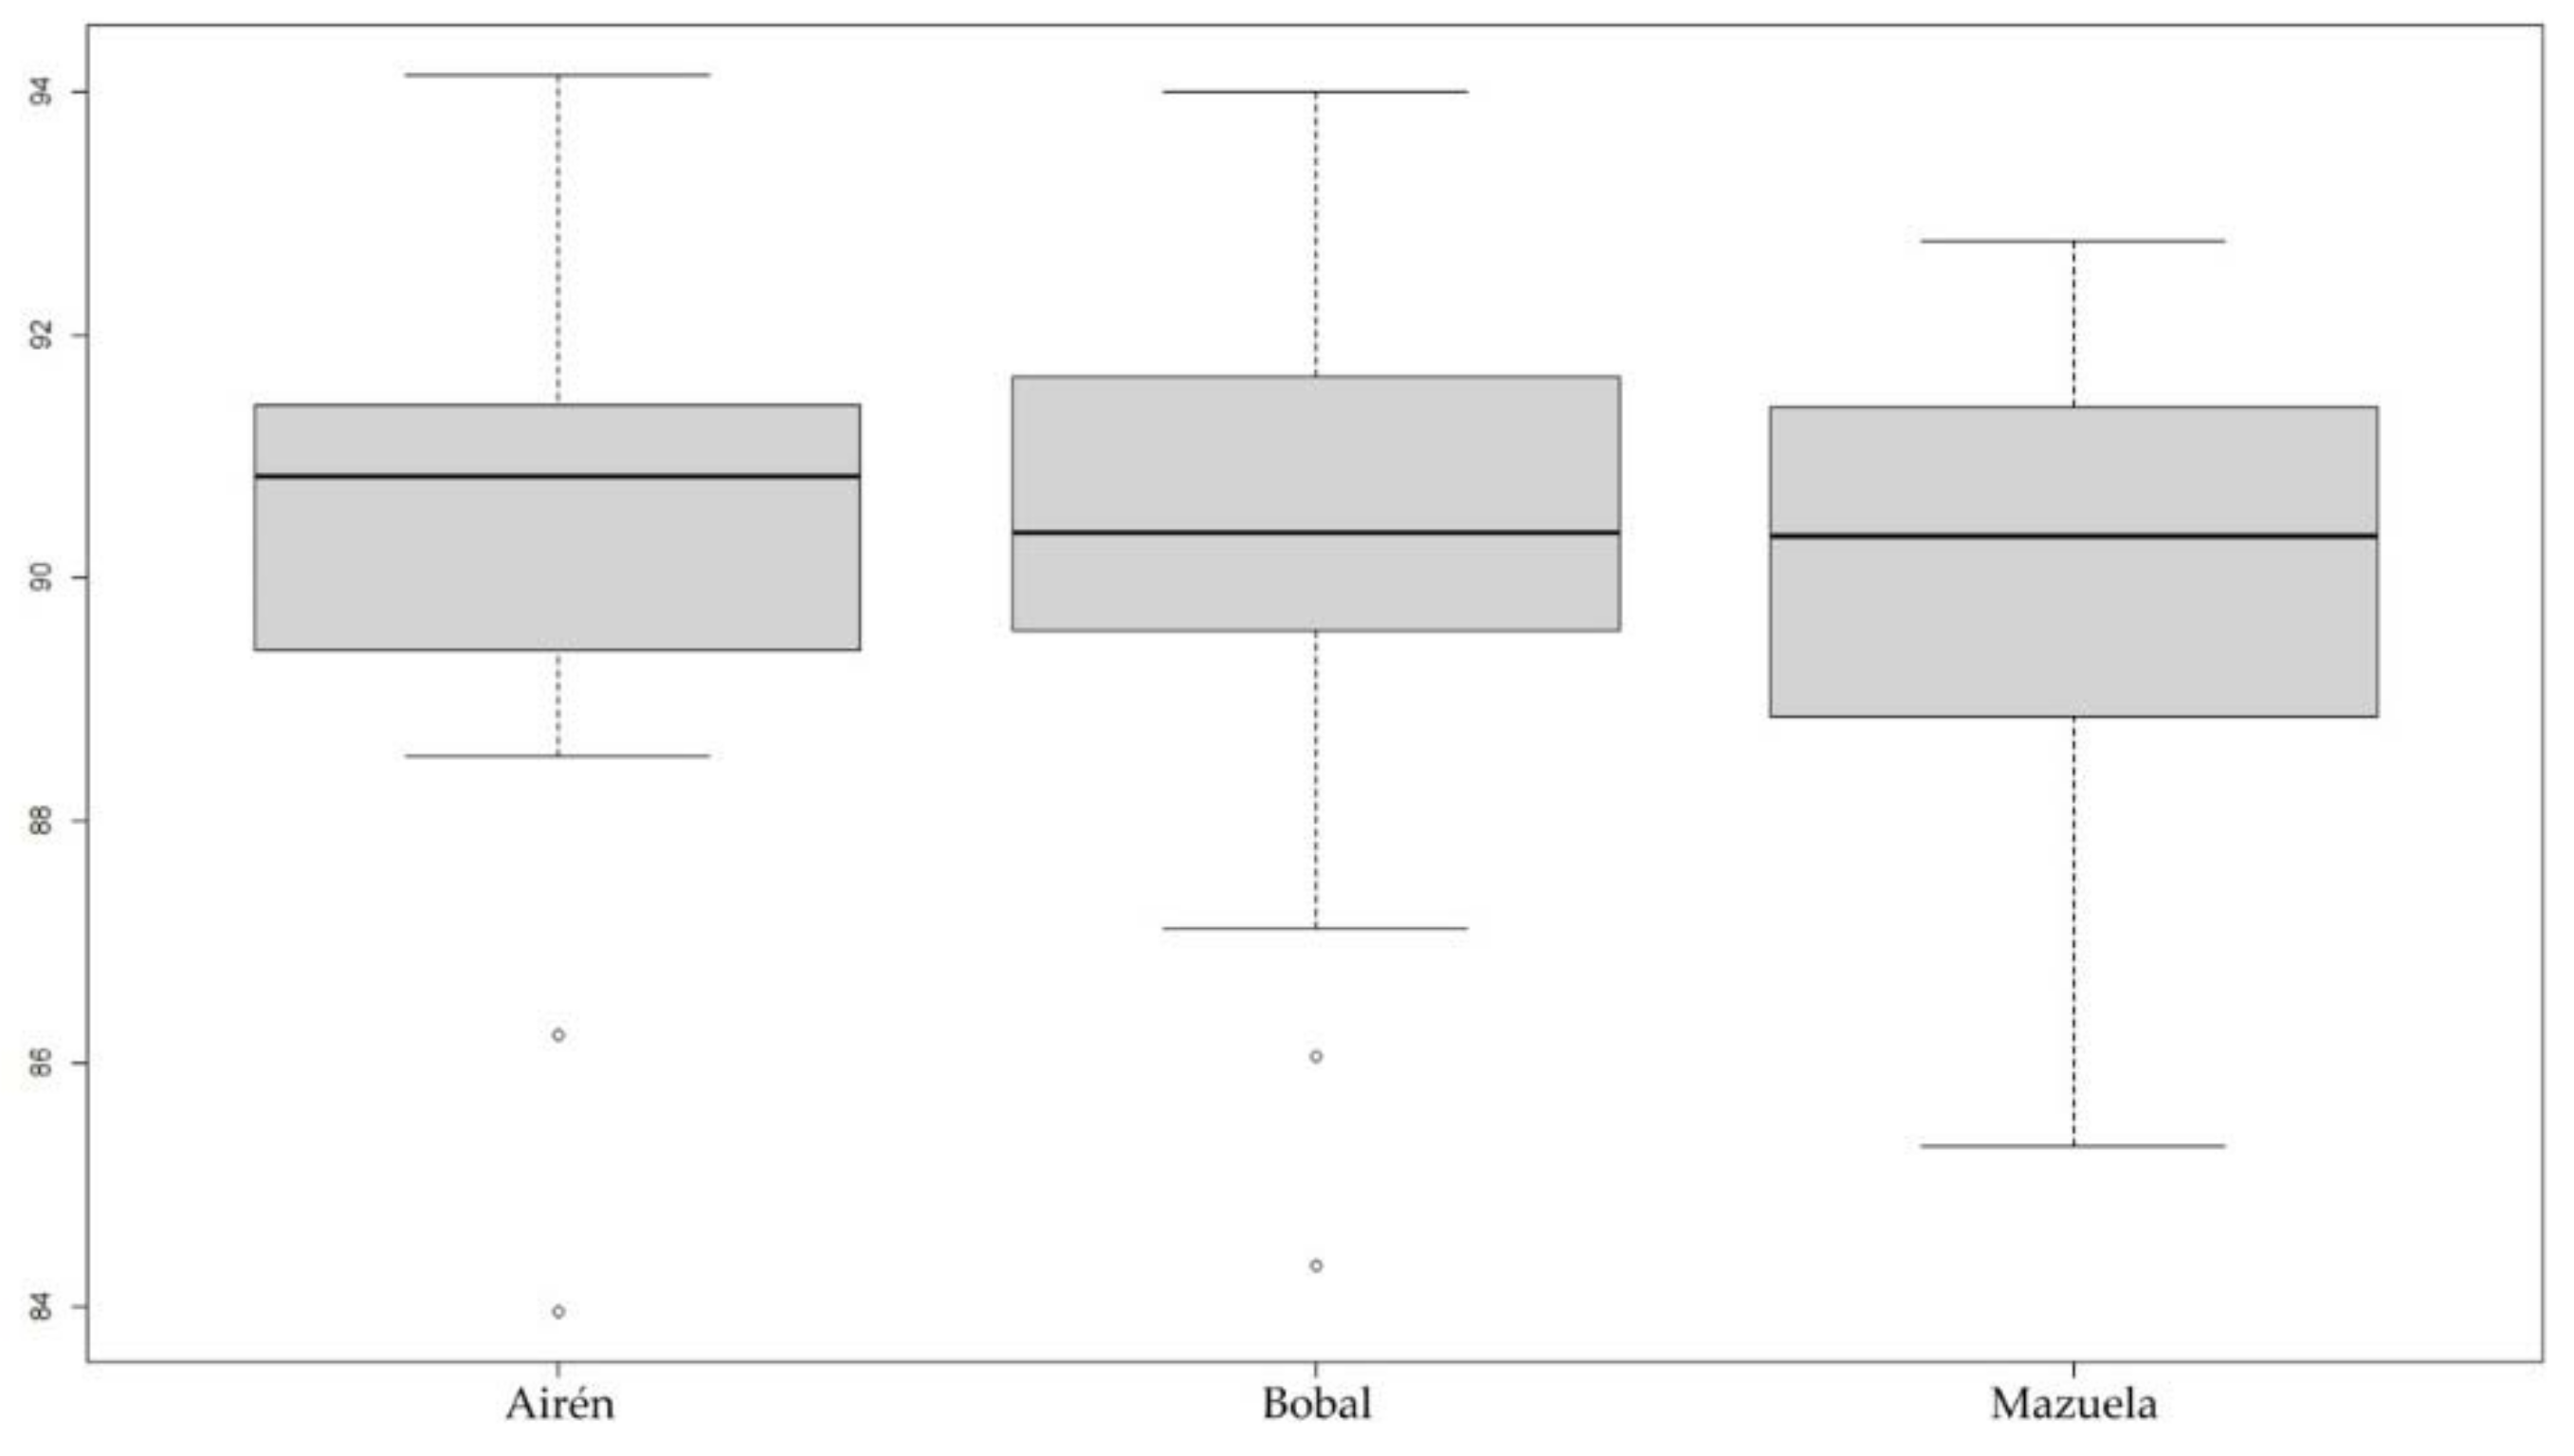
The group defined by the Airén model (Figure 20) has three cultivars with J index values superior to 90. These are Airén, Bobal and Mazuela. They differ in size, with the seeds of Mazuela being smaller than the other two cultivars (Table 11, Figure 21). On the other hand, there are no differences between these three cultivars with respect to their J indices.

3.3.10. De Cuerno Model

The De Cuerno model is the most elongated of all ten models and defines the seed shape of the De Cuerno variety (Figure 22, Table 12).

4. Discussion

The seeds of the Vitaceae have peculiar shapes different from those predominant in the Angiosperms that resemble ellipse, ovoid and cardioid figures [27,43]. A first study showed similarity to geometric figures derived from the heart and pear curves of Weisstein [24,25,26]. Seven models termed M1 to M7 were proposed to describe seed shape of species belonging to three genera in this family (Cissus verticillata, Parthenocissus tricuspidata, diverse Vitis species and six cultivars of Vitis vinifera subsp. Vinifera) [24]. In the comparisons between cultivars, Merseguera gave higher values with the elongated heart curve (M5), while seeds of other cultivars, including Malvasia adjusted better to M7 [24].
In this work we have investigated seed shape in 38 cultivars of Vitis vinifera conserved in the germplasm collection of El Encín. The collection has a total of 3699 entries, of which 241 will be the subject of a first approach to seed morphology. The cultivars used in this work were selected on the basis of their historical relevance. Many of them were reported in the first treatises of viticulture [7,8,44,45,46,47] (Table A1), while others have been used as parentals in crosses [48] and most of them are still used broadly today. In addition, the cultivars of this work represent a large proportion of the variation of seed shape in the collection. Based on the morphological diversity in this set of 38 representative cultivars, ten new models were developed, nine based on variations of M7 and one based on the piriform curve (M6), both M6 and M7 described before [24]. In comparison with our previous work based on geometric models in the Vitaceae [24], the results reported here represent an important step forward in the following aspects: (1) The number and relevance of cultivars used, (2) The number of new models described, with each model defining a new morphological group and (3) The close relatedness found between cultivars belonging to each group. In addition, the protocol described here included the obtention of a mean seed image for each cultivar, a step that was helpful for the identification and design of the models. The cultivars were classified according to their similarity to the models and J index, representing the percent area shared by each seed and the respective model, was obtained for 30 seeds in each of 38 cultivars.
In an attempt to define and describe seed shape, three aspects were considered in the seed images for the obtention of the models: the surface on top of the peduncle that may be plane, rounded or acute, the lateral inclination of the peduncle, that may be more or less pronounced and sometimes takes the aspect of a shoulder, and the structure of the curve that forms the basis of the seed. Approximately half of the cultivars have the top of the peduncle flat, while in the others it is rounded or acute. The cultivars grouped around the Listán Prieto, Albillo Real, Moscatel, Airén and Doña Blanca models have the top of the peduncle plane, while in the remainder of the groups it is rounded or acute. The biochemical and structural properties associated with these types remain to be investigated. Considering that lignin is an important component of the cell walls it may be interesting to explore the possibility of changes in lignin composition in both types. Pedicel thickening in grape berries results by increased the number of secondary xylem cells and their lignification [49]. It may be interesting to check whether there are differences in these aspects among the cultivars.
Ten groups were formed representative of the variation in seed shape in the 38 cultivars. Each group is based on the similarity of the cultivars to one of the models. The groups are heterogenous in size as well as in fidelity of their cultivars to their respective model. Some of them include a high number of cultivars, others a reduced number. In most of the cultivars ascribed to each group, the values of J index with the corresponding model are superior to 90, representative of high similarity [39]. Exceptionally, cultivars ascribed to a group had their J index value lower than 90 with the corresponding model. This was due to either a high morphological variation in the samples of some cultivars (De Cuerno) or to the possibility of existence of two or more seed types in a cultivar (Airén, Garnacha Tinta). The largest group is the one formed around the Moscatel model, containing 12 cultivars. Although most of them have high J index values with this model, based on the average silhouette it may be possible to obtain new models that define sub-groups or varieties inside this group, as well as some in of the other groups. Thus, it is expected that this group will be split in two or more when the analysis is done in other cultivars. The second group in size is the formed around Albillo Real, with six cultivars, all with J index values superior to 90. The existence of differences in J index values is not restricted to the large groups and indicates the possibility of obtaining more specific models for some of the cultivars.
The values of J index obtained have improved with respect to the already reported [24]. In Vitis vinifera subsp. Vinifera, a mean value of 88.9 was reported with M7, while in this work the values corresponding to the three cultivars of this subspecies with the respective model were of 90.7, 90.4 and 89.6 for CA 13.4 SE 2.1 and CA 13.6. Considering the six cultivars tested in the previous article, the maximum values obtained of 90.1 and 91.7 for Cercial and Malvasia with Model 7 and 90.4 with Model 5 for Merseguera are comparable to those obtained with the majority of cultivars in this work. In future tests, Cercial and Malvasia may give higher values with the Albillo Real model, while Merseguera may be included in the Hebén or Tortozón groups. The other three varieties tested may also be included in some of the groups here described, for example, Camarate in Moscatel or Doña Blanca. Cariñena may give high J index values with the Hebén or Tortozón models, or a similar, but more elongated new model. The work is open to the addition of new models and testing with new cultivars.
Hebén is an interesting cultivar that played a fundamental role in the current varietal map of Spain and Portugal [48]. Possibly originating from North Africa, it is a female variety whose reproduction by seed between the 9th and 12th centuries has given rise to a large number of descendants. Many of the cultivars currently grown on the Iberian Peninsula are the result of a natural cross between Hebén and other grapes mentioned by Alonso de Herrera in his treatise. Among the parentals are Teta de Vaca, Monastrell and Tortozón. Crosses of Tortozón with Heben gave Alarije, Malvar and Merseguera [48]. Although in the Hebén group there is a reduced number of cultivars (3), it may be possible to obtain more specific models adapted to their shape.
This work confirms the possibility of a classification of grapes based on the similarity of seed shape with geometric models, a method that is complementary to the classifications based on molecular protocols such as SSRs and particularly of those based on elliptical Fourier transform [19,20], contributing to give them a visual support. Similar to the traditional classification of Planchon in short and elongated seeds, our method is based in seed shape, but this is a complex character. Morphological aspects of seed shape such as peduncle length, structure and thickness of the in the apex may be evaluated by magnitudes. In addition to distance, curvature values may provide new descriptions.

5. Conclusions

Seeds of 38 cultivars of Vitis vinifera subsp. Vinifera representing the biodiversity in the germplasm collection of El Encín were classified in ten groups according to their similarity to geometric figures resulting from the bi-dimensional representation of algebraic equations.
Based on morphological aspects of the seeds, ten new models were designed that define the groups containing all the cultivars. Similarity of seed images to the geometric models was described and quantified by J index, measuring the percent similarity between seeds and models. The analysis has given ten new models able to describe and classify seed shape in 38 cultivars representative of the variability in shape on the seeds of Vitis vinifera conserved in the germplasm collection of El Encín (Madrid). More cultivars will be tested to find new models, confirm and expand these groups.

Supplementary Materials

The following materials are available online: Supplementary File 1: Composed images containing 30 seeds per accession in: https://zenodo.org/record/4433813#.X_7hiOhKh9A (accessed 8 April 2021). Supplementary File 2: video on how to obtain an average silhouette for each cultivar is available at: https://zenodo.org/record/4478344#.YBPOguhKiM8 (accessed 8 April 2021). Supplementary File 3: images used in the calculations are stored in: https://zenodo.org/deposit/4478301 (accessed 8 April 2021). Supplementary File 4: A video showing the process for calculation of J index has been uploaded in: https://zenodo.org/record/4478315#.YBPKFuhKiM8 (accessed 8 April 2021). Supplementary File 5: The Mathematica code for the ten new models described in this work is stored in: https://zenodo.org/record/4478500#.YBPetOhKiM8 (accessed 8 April 2021).

Author Contributions

Conceptualization, E.C., G.M.-O., Á.T. and F.C.-S.d.S.; methodology, E.C., J.J.M.-G. and Á.T.; software, E.C., J.J.M.-G. and Á.T; validation, E.C., J.J.M.-G., F.E.E.-R., G.M.-O., Á.T. and F.C.-S.d.S.; formal analysis, E.C., J.J.M.-G., F.E.E.-R., and Á.T.; resources, E.C., J.J.M.-G., F.E.E.-R., G.M.-O., Á.T. and F.C.-S.d.S.; data curation, J.J.M.-G. and F.E.E.-R.; writing—original draft preparation, E.C.; writing—review and editing, E.C., J.J.M.-G., F.E.E.-R., G.M.-O., Á.T. and F.C.-S.d.S.; visualization, J.J.M.-G.; supervision, E.C, G.M.-O., Á.T. and F.C.-S.d.S.; project administration, G.M.-O., F.C.-S.d.S.; funding acquisition, F.C.-S.d.S. All authors have read and agreed to the published version of the manuscript.

Funding

This research received no external funding.

Institutional Review Board Statement

Not applicable.

Informed Consent Statement

Not applicable.

Data Availability Statement

The data presented in this study are available as indicated in the Materials and Methods and Supplementary Materials sections.

Acknowledgments

Proyect “CLU-2019-05—IRNASA/CSIC Unit of Excellence”, funded by the Junta de Castilla y León and co-financed by the European Union (ERDF “Europe drives our growth”).

Conflicts of Interest

The authors declare no conflict of interest.

Appendix A

Table A1. List of cultivars of of Vitis vinifera L. used in this work, indicating the origin of the cultivars and their first mention in the literature [6,7,8,22,23,24,25,26]. CA 13.4 and CA 13.6 were obtained from the terrains close to the stream Nateruela in Cadiz. Se 2.1 was obtained in Ribera del Huéznar, Sevilla.
NMain NameFirst DescriptionSynonymsOriginGroup
1Airén [8]Blancón, Lairén, Manchega, Valdepeñas,Castilla-La ManchaAirén
2Alarije[7]Aris, Malvasía Riojana, Rojal, Subirat Parent, Torrontés.ExtremaduraAlbillo Real
3Albillo Real[7]Albillo de Madrid, Albillo de Toro, Temprana.Castilla y LeónAlbillo Real
4Beba[44]Calop Blanco, Chelva, Lairén, Valencí, Mantua, Uva Rey.AndalucíaMoscatel
5Bobal[44]Moravia, Morenillo, Pansa negra, Provechón.ValenciaBobal
6Bruñal[45]Albarín Negro, Baboso Negro, Alfrocheiro Preto (Portugal).Castilla y LeónMoscatel
7Caiño Tinto[46]Caíño del País, Caíño Gordo, Caíño, Tinta Femia.GaliciaMoscatel
8Castellana Blanca[7]Without synonyms.Castilla y LeónMoscatel
9Cayetana Blanca [7]Baladí, Cagazal, Calagraño, Jaén, Robal, Verdoncho.AndalucíaAlbillo Real
10De Cuerno[8]Dedos de doncella, Cornichón Blanc, Pizzutelllo bianco.AndalucíaDe Cuerno
11Dominga[50]Gloria, Murciana Blanca y Uva Verde de Alhama.MurciaTeta de vaca
12Doña Blanca[7]Cigüente, Malvasía Castellana, Valenciana.ExtremaduraAirén
13Garnacha Tinta[44]Aragonés, Lladoner Negre, Grenache (Francia).AragónMoscatel
14Gewürztraminer[47]Savagnin Rosa Aromática (Francia).GermanyMoscatel
15Graciano[8]Morrastel en Francia, Tinta Miuda (Portugal).La RiojaAlbillo Real
16Hebén[7,48]Ben, Evén, Laco Blanco, Panseras, Pansero.Castilla-La ManchaHebén
17Imperial[40]Without synonyms.UnknownTortozón
18Juan García[46]Negrón de Aldán, Mouratón, Negreda, Tinto Madrid.Castilla y LeónAlbillo Real
19Listán Prieto[7]Mission (California); País (Chile), Hariri (Morocco).Castilla-La ManchaListán Prieto
20Macabeo[44]Blanco de Daroca, Viura.AragónHebén
21Malvasía Aromática[7]Malvasía de Sitges; Malvasía de Lipari (Italy).GreeceMoscatel
22Mazuela[44]Cariñena, Concejón, Samsó, Carignan (France).AragónBobal
23Mollar Cano[44]Mulata Negra, Moll, Negra Moll, Negra Mole (Portugal).AndalucíaMoscatel
24Monastrell[44]Alcayata, Garrut, Mandó, Mourvèdre (Francia).ValenciaAirén
25Moscatel de Alejandría[44]Moscatel de Grano Gordo, Romé, Zibibbo (Italy).EgyptMoscatel
26Moscatel de grano menudo[7]Moscatel Almizclero, Moscatel Morisco, Moscatel Romano.ValenciaMoscatel
27Palomino Fino[51]Jerezana fina, Listán Blanco, Listán Gacho.AndalucíaMoscatel
28Pedro Ximénez[44]Chironés, Chironet.AndalucíaAirén
29Prieto Picudo[52]Verdejo negroCastilla y LeónMoscatel
30Sylvestris (CA 13.4)[53]Without synonymsAndalucíaSylvestris
31Sylvestris (CA 13.6)[53]Without synonymsAndalucíaSylvestris
32Sylvestris (SE 2.1)[53]Without synonymsAndalucíaSylvestris
33Tempranillo[7]Cencibel, Tinta de Toro, Tinta Roriz (Portugal).La RiojaAlbillo Real
34Teta de vaca[54]Royal Gordo, Rojal Gordo, Ahmeur bou Ahmeur.EgyptTeta de vaca
35Tortozón[7]Prieto Picudo Blanco, Folha de Figuera (Portugal)Castilla-La ManchaTortozón
36Tortozona Tinta[7]Without synonymsCastilla-La ManchaListán Prieto
37Verdejo[45]Without synonymsCastilla y LeónTeta de vaca
38Zalema[8]Mantúo Perruno, Perruna, Torrontés de Montilla.AndalucíaHebén

References

  1. The Plant List. Vitis; Royal Botanic Gardens, Kew. 2013. Available online: http://www.theplantlist.org/1.1/browse/A/Vitaceae/Vitis/ (accessed on 20 January 2021).
  2. This, P.; Lacombe, T.; Thomas, M.R. Historical origins and genetic diversity of wine grapes. Trends Genet. 2006, 22, 511–519. [Google Scholar] [CrossRef]
  3. Alleweldt, G.; Dettweiler, E. The Genetic Resources of Vitis: World List of Grapevine Collections, 2nd ed.; Bundesforschungsanstalt für Rebenzüchtung Geilweilerhof: Siebeldingen, Germany, 1994. [Google Scholar]
  4. Galet, P. Dictionnaire Encyclopédique des Cépages (Encyclopaedic Dictionary of Grape Varieties); Hachette: Paris, France, 2000. [Google Scholar]
  5. Levadoux, L. Les populations sauvages et cultivées de Vitis vinifera L. Ann. Amélior. Plant 1956, 6, 59–117. [Google Scholar]
  6. De Santa María, C.S.F.; Marcide, O.J.M.; Muñoz Organero, G.; Rodríguez Torres, I.; Barba, A.B.; de Miguel, C.R.; García Muñoz, S.; Sáiz Sáiz, R. Variedades de Vid en España; Editorial Agrícola Española: Madrid, Spain, 2012. [Google Scholar]
  7. De Herrera, A.G. Agricultura General; Corregida y Adicionada por la Real Sociedad Económica Matritense (General Agriculture; Corrected and Edited by the Real Sociedad Económica Matritense); Imprenta Real: Madrid, Spain, 1818–1819; Available online: https://bibliotecadigital.jcyl.es/i18n/consulta/registro.cmd?id=7134 (accessed on 20 January 2021).
  8. Rojas-Clemente, S. Essay sur les Varietés de la Vigne qui Végètent en Andalousie (Essay on Vine Varieties Growing in Andalusia); Impr. de Poult: Paris, France, 1814; Available online: https://www.biodiversitylibrary.org/bibliography/83591#/summary (accessed on 20 January 2021).
  9. Viala, P.; Vermorel, V. Ampelographie. Traité Général de Viticulture (Ampelography. General Treaty of Viticulture); Masson: Paris, France, 1910; Volume 1–7. [Google Scholar]
  10. Barth, S.; Forneck, A.; Verzeletti, F.; Blaich, R.; Schumann, F. Genotypes and phenotypes of an “ex situ” Vitis vinifera ssp. sylvestris (Gmel.) Beger germplasm collection from the Upper Rhine Valley. Genet. Resour. Crop Evol. 2009, 56, 1171–1181. [Google Scholar] [CrossRef]
  11. Arroyo-García, R.; Lefort, F.; de Andrés, M.; Ibáñez, J.; Borrego, J.; Cabello, F.; Martínez-Zapater, J.M. Haplotypic polymorphisms for chloroplast microsatellites analysis in Vitis. Genome 2002, 45, 1142–1149. [Google Scholar] [CrossRef] [Green Version]
  12. Arroyo-García, R.; Ruiz-García, L.; Bolling, L.; Ocete, R.; López, M.A.; Arnold, C.; Ergul, A.; Söylemezolu, G.; Uzun, H.I.; Cabello, F.; et al. Multiple origins of cultivated grapevine (Vitis vinifera L. ssp. sativa based on chloroplast DNA polymorphisms. Mol. Ecol. 2006, 15, 3707–3714. [Google Scholar] [CrossRef] [Green Version]
  13. Lefort, F.; Roubelakis-Angelakis, K.A. Genetic comparison of Greek cultivars of Vitis vinifera L. by nuclear microsatellite profiling. Am. J. Enol. Vitic. 2001, 52, 101–108. [Google Scholar]
  14. Lopes, M.S.; Sefc, K.M.; Dias, E.E.; Steinkellner, H.; Machado, M.L.C.; Machado, A.C. The use of microsatellites for germplasm management in a Portuguese grapevine collection. Theor. Appl. Genet. 1999, 99, 733–739. [Google Scholar] [CrossRef]
  15. Maletic, E.; Sefc, K.M.; Steinkellner, H.; Kontic, J.K.; Pejic, I. Genetic characterization of Croatian grapevine cultivars and detection of synonymous cultivars in neighbouring regions. Vitis 1999, 38, 79–83. [Google Scholar]
  16. Christodoulou, M.D.; Clark, J.Y.; Culham, A. The Cinderella discipline: Morphometrics and their use in botanical classification. Bot. J. Linn. Soc. 2020, 194, 1–12. [Google Scholar] [CrossRef]
  17. Viala, P.; Péchoutre, P. Morphologie Externe de la Graine. In Ampélographie; Viala, P., Vermorel, V., Eds.; Masson et Cie: Paris, France, 1910; pp. 156–166. [Google Scholar]
  18. Planchon, J.E. Ampelideae, Monographie des Ampélidées Vraies. In Monographiae Phanerogamarum; de Candolle, A.P., Ed.; Treuttel et Würtz: Paris, France, 1887; Volume 5, pp. 305–368. [Google Scholar]
  19. Terral, J.F.; Tabard, E.; Bouby, L.; Ivorra, S.; Pastor, T.; Figueiral, I. Evolution and history of grapevine (Vitis vinifera) under domestication: New morphometric perspectives to understand seed domestication syndrome and reveal origins of ancient European cultivars. Ann. Bot. 2010, 105, 443–455. [Google Scholar] [CrossRef] [PubMed]
  20. Pagnoux, C.; Bouby, L.; Ivorra, S.; Petit, C.; Valamoti, S.-M.; Pastor, T.; Picq, S.; Terral, J.-F. Inferring the agrobiodiversity of Vitis vinifera L. (grapevine) in ancient Greece by comparative shape analysis of archaeological and modern seeds. Veg. Hist. Archaeobotany 2015, 24, 75–84. [Google Scholar] [CrossRef]
  21. Ucchesu, M.; Orrú, M.; Grillo, O.; Venora, G.; Paglietti, G.; Ardu, A.; Bacchetta, G. Predictive Method for Correct Identification of Archaeological Charred Grape Seeds: Support for Advances in Knowledge of Grape Domestication Process. PLoS ONE 2016, 11, e0149814. [Google Scholar] [CrossRef] [Green Version]
  22. Karasik, A.; Rahimi, O.; David, M.; Weiss, E.; Drori, E. Development of a 3D seed morphological tool for grapevine variety identification, and its comparison with SSR analysis. Sci. Rep. 2018, 8, 6545. [Google Scholar] [CrossRef] [PubMed]
  23. Bonhomme, V.; Terral, J.-F.; Zech-Matterne, V.; Ivorra, S.; Lacombe, T.; Deborde, G.; Kuchler, P.; Limier, B.; Pastor, T.; Rollet, P.; et al. Seed morphology uncovers 1500 years of vine agrobiodiversity before the advent of the Champagne wine. Sci. Rep. 2021, 11, 2305. [Google Scholar] [CrossRef]
  24. Martín-Gómez, J.J.; del Pozo, G.D.; Ucchesu, M.; Bacchetta, G.; de Santamaría, C.S.F.; Tocino, Á.; Cervantes, E. Seed Morphology in the Vitaceae Based on Geometric Models. Agronomy 2020, 10, 739. [Google Scholar] [CrossRef]
  25. Weisstein, E.W. Heart Curve; From MathWorld—A Wolfram Web Resource. Available online: http://mathworld.wolfram.com/HeartCurve.html (accessed on 3 December 2020).
  26. Weisstein, E.W. Pear Curve; From MathWorld—A Wolfram Web Resource. Available online: http://mathworld.wolfram.com/PearCurve.html (accessed on 3 December 2020).
  27. Cervantes, E.; Martín-Gómez, J.J.; Saadaoui, E. Updated Methods for Seed Shape Analysis. Scientifica 2016, 5691825. [Google Scholar] [CrossRef] [Green Version]
  28. Cervantes, E.; Martín Gómez, J.J. Seed Shape Description and Quantification by Comparison with Geometric Models. Horticulturae 2019, 5, 60. [Google Scholar] [CrossRef] [Green Version]
  29. Cervantes, E.; Martín, J.J.; Ardanuy, R.; de Diego, J.G.; Tocino, Á. Modeling the Arabidopsis seed shape by a cardioid: Efficacy of the adjustment with a scale change with factor equal to the Golden Ratio and analysis of seed shape in ethylene mutants. J. Plant Physiol. 2010, 67, 408–410. [Google Scholar] [CrossRef] [PubMed]
  30. Gómez, M.J.J.; Tocino, A.; Ardanuy, R.; de Diego, J.G.; Cervantes, E. Dynamic analysis of Arabidopsis seed shape reveals differences in cellulose mutants. Acta Phys. Plant 2014, 36, 1585–1592. [Google Scholar]
  31. Cervantes, E.; Martín, J.J.; Chan, P.K.; Gresshoff, P.M.; Tocino, Á. Seed shape in model legumes: Approximation by a cardioid reveals differences in ethylene insensitive mutants of Lotus japonicus and Medicago truncatula. J. Plant Physiol. 2012, 169, 1359–1365. [Google Scholar] [CrossRef] [PubMed] [Green Version]
  32. Saadaoui, E.; Gómez, M.J.J.; Tlili, N.; Khaldi, A.; Cervantes, E. Effect of Climate in Seed Diversity of Wild Tunisian Rhus tripartita (Ucria) Grande. J. Adv. Biol. Biotechnol. 2017, 13, 1–10. [Google Scholar] [CrossRef] [Green Version]
  33. Martín-Gómez, J.J.; Saadaoui, E.; Cervantes, E. Seed Shape of Castor Bean (Ricinus communis L.) Grown in Different Regions of Tunisia. JAERI 2016, 8, 1–11. [Google Scholar]
  34. Saadaoui, E.; Martín, J.J.; Bouazizi, R.; Chokri, B.R.; Grira, M.; Saad, A.; Khouja, M.L.; Cervantes, E. Phenotypic variability and seed yield of Jatropha curcas L Introduced to Tunisia. Acta Bot. Mex. 2015, 110, 119–134. [Google Scholar] [CrossRef] [Green Version]
  35. Martín-Gómez, J.J.; Gutiérrez del Pozo, D.; Cervantes, E. Seed shape quantification in the Malvaceae reveals cardioid-shaped seeds predominantly in herbs. Bot. Lith. 2019, 25, 21–31. [Google Scholar] [CrossRef] [Green Version]
  36. Cervantes, E.; Martín-Gómez, J.J. Seed shape quantification in the order Cucurbitales. Mod. Phytomorphol. 2018, 12, 1–13. [Google Scholar]
  37. Martín-Gómez, J.J.; Rewicz, A.; Cervantes, E. Seed Shape Diversity in families of the Order Ranunculales. Phytotaxa 2019, 425, 193–207. [Google Scholar] [CrossRef]
  38. Saadaoui, E.; Martín-Gómez, J.J.; Cervantes, E. Seed morphology in Tunisian wild populations of Capparis spinosa L. Acta Biol. Cracov. Bot. 2013, 55, 99–106. [Google Scholar]
  39. Martín-Gómez, J.J.; Rewicz, A.; Rodríguez-Lorenzo, J.L.; Janoušek, B.; Cervantes, E. Seed Morphology in Silene Based on Geometric Models. Plants 2020, 9, 1787. [Google Scholar] [CrossRef] [PubMed]
  40. Cabello, F. La Colección de Vides de “El Encín”. Historia del Banco de Germoplasma (1904–1994); Memoria de Actividades y Catálogo de Variedades; Comunidad de Madrid: Madrid, Spain, 1995; ISBN 84-451-1045-4. [Google Scholar]
  41. Ferreira, T.; Rasband, W. ImageJ User Guide-IJ1.46r. 2012. Available online: http://imagej.nih.gov/ij/docs/guide (accessed on 20 January 2021).
  42. Zdilla, M.J.; Hatfield, S.A.; McLean, K.A.; Cyrus, L.M.; Laslo, J.M.; Lambert, H.W. Circularity, Solidity, Axes of a Best Fit Ellipse, Aspect Ratio, and Roundness of the Foramen Ovale. J. Craniofac. Surg. 2016, 27, 222–228. [Google Scholar] [CrossRef] [PubMed] [Green Version]
  43. Cervantes, E.; Gómez, M.J.J.; del Pozo, G.D.; Silva Dias, L. An Angiosperm Species Dataset Reveals Relationships between Seed Size and Two-Dimensional Shape. Horticulturae 2019, 5, 71. [Google Scholar] [CrossRef] [Green Version]
  44. Valcárcel, J.A. Agricultura General y Gobierno de la Casa de Campo (General Agriculture and Government of the Casa de Campo); Tomo VIII; Imprenta de Joseph Thomas Lucas: Valencia, Spain, 1791; Available online: https://bivaldi.gva.es/es/consulta/registro.cmd?id=3706 (accessed on 20 January 2021).
  45. Suárez Cantón, N. Asturias vinícola. Breves apuntes sobre el vino de Cangas de Tineo. Rev. Astur. 1879, 14, 15. [Google Scholar]
  46. Casares, A. Observaciones Sobre el Cultivo de la Vid en Galicia (Observations on the cultivation of vines in Galicia); Imprenta de la viuda e hijos de Compañel: Santiago de Compostela, Spain, 1879; Volume 29, p. 1843. [Google Scholar]
  47. Prince, R.W. A Treatise on the Vine: Embracing its History from the Earliest Ages to the Present Day; Swords, T.J., Ed.; Carvill, G.C.H.: New York, NY, USA, 1830. [Google Scholar]
  48. Cabello, F. La vid en los textos de la Hispania romana y el renacimiento español (The vine in the texts of Roman Hispania and the Spanish Renaissance). In La vid en al-Andalus. Tradición, Diversidad y Patrimonio (The Vine in al-Andalus. Tradition, Diversity and Heritage); Carabaza, M.J., Hernández-Bermejo, E., Eds.; Comares: Granada, Spain, 2020; pp. 27–38, 320. [Google Scholar]
  49. Nakamura, M.; Hori, Y. Post-harvest berry drop in seedless berries produced by GA treatment in the grape cultivar Kyoho. IV. Rachis hardness and phenol production of rachis in vitro following GA application as affected by the addition of b-nitrostyrene derivatives. Tohoku J. Agric. Res. 1985, 35, 81–89. [Google Scholar]
  50. Hidalgo, L.; Serrano, L.; Rodríguez-Candela, M. Catastro Vitícola y Vinícola. Catálogo de Variedades de Viníferas y Portainjertos (Wine and vineyard register. Catalogue of Vinifera Varieties and Rootstocks); Ministerio de Agricultura: Madrid, Spain, 1976.
  51. Fernández de Bobadilla, G. Viníferas Jerezanas y de Andalucía Occidental (Vineyards of Jerez and Western Andalusia); Instituto Nacional de Investigaciones Agronómicas: Madrid, Spain, 1956. [Google Scholar]
  52. De Andino, A.S.E.J. Apéndice sobre las especies y variedades de vid (Appendix on vine species and varieties). In El libro del Viticultor (The Winegrower’s Book); Hernández, M.G., Ed.; Editorial Maxtor: Madrid, Spain, 1885; pp. 218–326. [Google Scholar]
  53. Benito, A.; Muñoz-Organero, G.; de Andrés, M.; Ocete, R.; García-Muñoz, S.; López, M.; Arroyo-García, R.; Cabello, F. Ex situ ampelographical characterisation of wild Vitis vinífera from fifty-one Spanish populations. Aust. J. Grape Wine Res. 2017, 23, 143–152. [Google Scholar] [CrossRef]
  54. Columela, L.J.M. 1st Century. In Los Doce Libros de Agricultura (The Twelve Books on Agriculture); Edición Facsímil; Trad, J.M., Ed.; Álvarez de Sotomayor: Santander, Spain, 1979; Volume II, pp. 103–104. [Google Scholar]
Figure 1. Seeds of the cultivars Albillo Real (left) and Airén (right) showing the regions observed for modelling. The variable regions are indicated with rectangles and correspond to the upper and lateral edges of the peduncle, and to the curvature at the base. The red lines show the variations in these regions corresponding to a flat peduncle in Albillo Real, in contrast to a rounded top in Airén. The peduncle appears more differentiated from the rest of the seed in Albillo Real, while there is more continuity in Airén. The discontinuity at the base is more pronounced in the Airén seed, on the right.
Agronomy 11 00734 g001
Figure 2. Schematic representation of the method used to obtain J index. J index is the ratio between shared and total area in two images. Left: a seed from the cultivar Albillo Real. Middle: The same seed with the model superimposed; above, with the model in black; and below, the model in white. Right: Red zones show the areas quantified in each of the figures. ImageJ gives the total area for the seed with the model in black, while shared area is obtained with the white model.
Agronomy 11 00734 g002
Figure 3. New models used in the classification of 38 representative cultivars of Vitis vinifera L. maintained in El Encín and the respective average silhouettes of some of the cultivars. The average silhouettes of the varieties that best fitted each model are represented by a gray area, and the models by a continuous line.
Agronomy 11 00734 g003
Figure 4. Listán Prieto Model. From left to right: An image with the sum of the silhouettes of 30 seeds, average silhouette obtained from the first image, the Listán Prieto model, and four representative seeds of this cultivar. Bar represents 1 cm.
Agronomy 11 00734 g004
Figure 5. Box-plot representations showing the distribution of J index values in cultivars Listán Prieto and Tortozona Tinta with the Listán Prieto model.
Agronomy 11 00734 g005
Figure 6. Sylvestris Model. From left to right: An image with the sum of the silhouettes of 30 seeds of CA 13.4, average silhouette obtained from the first image, the Sylvestris model, and four representative seeds of CA 13.4. Bar represents 1 cm.
Agronomy 11 00734 g006
Figure 7. Box-plot representations showing the distribution of J index values in cultivars CA 13-4, CA 13-6 and SE 2-1 with the Sylvestris model.
Agronomy 11 00734 g007
Figure 8. Albillo Real. From left to right: A sum of the silhouettes of 30 seeds of Albillo Real cultivar, a silhouette obtained by the pixel profile of the first image, the Albillo Real model, and four representative seeds of this cultivar. Bar represents 1 cm.
Agronomy 11 00734 g008
Figure 9. Box-plot representations showing the distribution of J index values in the cultivars Alarije, Albillo Real, Graciano, Juan García and Tempranillo with the Albillo Real model.
Agronomy 11 00734 g009
Figure 10. Hebén Model. From left to right: A sum of the silhouettes of 30 seeds, a silhouette obtained by the pixel profile of the first image, the Hebén model, and four representative seeds of this cultivar. Bar represents 1 cm.
Agronomy 11 00734 g010
Figure 11. Box-plot representations showing the distribution of J index values in the cultivars Hebén, Macabeo and Zalema with the Heben model.
Agronomy 11 00734 g011
Figure 12. Moscatel model. From left to right: A sum of the silhouettes of 30 seeds of the cultivar Mollar Cano, average silhouette for this cultivar obtained by the pixel profile of the first image, the Moscatel model, and four representative seeds of cultivar Mollar Cano. Bar represents 1 cm.
Agronomy 11 00734 g012
Figure 13. Box-plot representations showing the distribution of J index values in cultivars Beba, Bruñal, Caíño Tinto, Castellana Blanca, Garnacha Tinta, Gewürztraminer, Malvasía Aromática, Mollar Cano, Moscatel de Alejandría, Moscatel de Grano Menudo, Palomino Fino, Prieto Picudo with the Moscatel model.
Agronomy 11 00734 g013
Figure 14. Tortozón. From left to right: A sum of the silhouettes of 30 seeds, a silhouette obtained by the pixel profile of the first image, the Tortozón model, and four representative seeds of this cultivar. Bar represents 1 cm.
Agronomy 11 00734 g014
Figure 15. Box-plot representations showing the distribution of J index values in cultivars Imperial and Tortozón with the Tortozón model.
Agronomy 11 00734 g015
Figure 16. Teta de Vaca model. From left to right: A sum of the silhouettes of 30 seeds of cultivar Teta de Vaca, a silhouette obtained by the pixel profile of the first image, the Teta de Vaca model, and four representative seeds of this cultivar. Bar represents 1 cm.
Agronomy 11 00734 g016
Figure 17. Box-plot representations showing the distribution of J index values in cultivars Dominga, Teta de Vaca and Verdejo with the Teta de Vaca model.
Agronomy 11 00734 g017
Figure 18. From left to right: A sum of the silhouettes of 30 seeds, a silhouette obtained by the pixel profile of the first image, the Doña Blanca model, and four representative seeds of Doña Blanca. Bar represents 1 cm.
Agronomy 11 00734 g018
Figure 19. Box-plot representations showing the distribution of J index values in cultivars Doña Blanca, Monastrell and Pedro Ximénez with the Doña Blanca model.
Agronomy 11 00734 g019
Figure 20. From left to right: A sum of the silhouettes of 30 seeds, a silhouette obtained by the pixel profile of the first image, Airén the model, and four representative seeds of Airén. Bar represents 1 cm.
Agronomy 11 00734 g020
Figure 21. Box-plot representations showing the distribution of J index values in cultivars Airén, Bobal and Mazuela with the Airén model.
Agronomy 11 00734 g021
Figure 22. From left to right: A sum of the silhouettes of 30 seeds, a silhouette obtained by the pixel profile of the first image, the De Cuerno model, and four representative De Cuerno seeds. Bar represents 1 cm.
Agronomy 11 00734 g022
Table 1. Mean J index values in the cultivars with their respective models. Underlined: cultivars that gave highest values of J index with each of the models.
ModelCultivars (J Index Values)
Listán PrietoListán Prieto (90.7), Tortozona Tinta (92.6)
SylvestrisCA 13.4 (90.7), CA 13.6 (89.3), SE 2.1 (90.4)
Albillo RealAlarije (90.8), Albillo Real (91.5), Cayetana Blanca (90.0), Graciano (91.1), Juan García (90.0), Tempranillo (90.9)
HebénHebén (90,0), Macabeo (90.8), Zalema (91.6)
MoscatelBeba (91.2), Bruñal (92.2), Caíño Tinto (90.6), Castellana Blanca (91.4), Garnacha Tínta (88.8), Gewürztraminer (90.8), Malvasía Aromática (90.3), Mollar Cano (90.8), Moscatel de Alejandría (90.5), Moscatel de Grano Menudo (90.4), Palomino Fino (91.0), Prieto Picudo (90.9)
TortozónImperial (88.9), Tortozón (89.9)
Teta de VacaDominga (90.4), Teta de Vaca (90.4), Verdejo (90.3)
Doña BlancaDoña Blanca (91.0), Monastrell (89.4), Pedro Ximénez (90.5)
AirénAirén (90.4), Bobal (90.3), Mazuela (90.1)
De CuernoDe Cuerno (88.8)
Table 2. Mean values for morphological characters in the groups corresponding to the differentmodels. Groups are denominated by the corresponding model and appear ordered by increasing values of aspect ratio (AR). The mean values marked with the same letter in each column do not differ significantly at p < 0.05 (Scheffe’s test). N is the number of seeds analysed.
ModelNAreaPerimeterLengthWidthARCircularityRoundness
Listan Prieto6017.2 d16.8 e5.4 f4.0 b1.3 f0.76 a0.75 a
Sylvestris9013.8 e14.8 f5.0 g3.5 e1.4 e0.78 a0.70 b
Albillo Real18018.7 c17.8 d5.8 de4.1 b1.4 e0.73 b0.70 b
Hebén9017.3 d17.3 e5.8 e3.8 cd1.5 d0.72 c0.66 c
Moscatel35616.8 d17.3 e5.8 e3.7 d1.6 c0.70 d0.64 d
Tortozon6017.6 cd18.5 c6.0 d3.7 cd1.6 c0.66 e0.63 d
Teta de Vaca9023.2 b20.1 b6.8 b4.3 a1.6 c0.72 bc0.63 d
Doña Blanca9018.7 c18.4 cd6.4 c3.7 cd1.7 b0.70 d0.59 e
Airén9017.5 d18.1 cd6.2 c3.6 e1.7 b0.67 e0.57 e
De Cuerno2029.1 a25.9 a9.4 a3.9 bc2.4 a0.55 f0.42 f
Table 3. Values of area and J index in the cultivars of the Listán Prieto group. Superscript letters indicate the results of Scheffé test: the mean values marked with the same letter in the superindex of each column do not differ significantly at p < 0.05. N is the number of seeds analyzed.
CultivarNAreaJ Index
Mean (Std Dev)MinMaxMean (Std Dev)MinMax
Listán Prieto3019.2 a (1.31)16.521.490.7 b (1.32)87.792.9
TortozonaTinta3015.2 b (1.21)12.117.192.6 a (1.42)89.594.6
Table 4. Values of area and J index in the three cultivars of the Sylvestris group. Superscript letters indicate the results of Scheffé test: the mean values marked with the same letter in the superindex of each column do not differ significantly at p < 0.05. N is the number of seeds analyzed.
CultivarNAreaJ Index
Mean (Std Dev)Min.Max.Mean (Std Dev)Min.Max.
CA 13.42013.7 b (1.24)11.515.790.7 a (1.15)89.292.8
CA 13.62014.8 a (1.56)12.917.989.3 b (1.57)86.891.7
SE 2.12012.6 c (0.99)10.114.290.4 ab (1.67)86.692.8
Table 5. Values of area and J index in the cultivars of the Albillo Real group. Superscript letters indicate the results of Scheffé test: the mean values marked with the same letter in the superindex of each column do not differ significantly at p < 0.05. N is the number of seeds analyzed.
CultivarNAreaJ Index
Mean (Std Dev)Min.Max.Mean (Std Dev)Min.Max.
Alarije3018.0 bc (1.59)15.221.290.8 ab (2.10)83.893.2
Albillo Real3016.2 d (1.17)13.217.991.5 a (2.06)85.494.5
Cayetana Blanca3018.6 b (1.43)15.822.791.0 ab (4.84)85.493.6
Graciano3017.3 c (1.22)14.520.191.1 ab (1.62)87.093.5
Juan García3022.9 a (1.68)20.226.090.0 b (1.74)83.092.0
Tempranillo3018.9 b (0.99)16.420.690.9 ab (1.28)88.193.1
Table 6. Values of area and J index in the cultivars of the Hebén group. Superscript letters indicate the results of Scheffé test: the mean values marked with the same letter in the superindex of each column do not differ significantly at p < 0.05. N is the number of seeds analyzed.
CultivarNAreaJ Index
Mean (Std Dev)MinMaxMean (Std Dev)MinMax
Hebén3021.2 a (1.68)18.324.890.0 b (1.72)85.791.9
Macabeo3016.1 b (0.83)13.918.190.8 a,b (1.70)86.193.1
Zalema3014.6 c (0.99)12.717.291.6 a (1.26)89.194.0
Table 7. Values of area and J index in the cultivars of the Moscatel group. Superscript letters indicate the results of Scheffé test: the mean values marked with the same letter in the superindex of each column do not differ significantly at p < 0.05. N is the number of seeds analyzed.
CultivarNAreaJ Index Moscatel
Mean (Std Dev)MinMaxMean (Std Dev)MinMax
Beba3014.7 f (0.82)13.216.391.2 ab (1.43)88.193.3
Bruñal3014.6 fg (0.93)13.016.592.2 a (1.12)89.794.4
Caíño Tinto3023.7 a (1.85)20.227.890.6 ab (2.99)82.794.3
Castellana Blanca3020.1 b (1.14)18.023.391.4 ab (0.91)89.693.7
Garnacha Tinta3013.9 gf ((0.94)12.115.988.8 c (3.03)81.692.7
Gewürztraminer3017.2 de (0.79)15.118.590.8 ab (2.43)83.193.7
Malvasía Aromática3017.5 d (1.02)15.019.990.3 bc (1.55)85.492.5
Mollar Cano3018.5 c (0.77)16.920.190.8 ab (1.68)87.694.0
Moscatel de Alejandría3017.2 de (1.54)14.520.290.5 ab (2.53)83.293.2
Moscatel de Grano Menudo3013.8 g (0.84)11.915.490.4 bc (2.12)84.393.1
Palomino Fino3014.5 fg (072)12.916.291.0 ab (1.69)86.793.8
Prieto Picudo2616.4 e (0.84)14.217.590.9 ab (2.07)84.393.3
Table 8. Values of J index in the cultivars Imperial and Tortozón. Superscript letters indicate the results of Scheffé test: the mean values marked with the same letter in the superindex of each column do not differ significantly at p < 0.05. N is the number of seeds analyzed.
CultivarNAreaJ Index
Mean (Std Dev)MinMaxMean (Std Dev)MinMax
Imperial3017.5 a (1.18)15.620.288.9 b (2.24)82.992.1
Tortozón3017.7 a (0.93)16.020.189.9 a (1.52)84.992.3
Table 9. Values of area and J index in the two cultivars of the Teta de Vaca group. Superscript letters indicate the results of Scheffé test: the mean values marked with the same letter in the superindex of each column do not differ significantly at p < 0.05. N is the number of seeds analyzed.
CultivarNAreaJ Index
Mean (Std Dev)MinMaxMean (Std Dev)MinMax
Dominga3023.8 b (1.50)20.723.890.4 a(2.60)79.393.7
Teta de Vaca3025.8 a (1.73)20.329.190.4 a(1.81)86.093.8
Verdejo3020.0 c (0.87)17.821.390.3 a(1.09)87.892.3
Table 10. Values of area and J index in the cultivars of the Doña Blanca group. Superscript letters indicate the results of Tukey test: the mean values marked with the same letter in the superindex of each column do not differ significantly at p < 0.05. N is the number of seeds analyzed.
CultivarNAreaJ Index
Mean (Std Dev)MinMaxMean (Std Dev)MinMax
Doña Blanca 3018.3 b (1.17)15.920.991.0 a (2.93)81.994.2
Monastrell3020.4 a (1.46)17.423.189.4 b (2.09)84.792.0
Pedro Ximénez3017.4 c (0.87)15.119.090.5 ab (1.73)85.993.7
Table 11. Values of area and J index in the cultivars of the Airen group. Superscript letters indicate the results of Tukey test: the mean values marked with the same letter in the superindex of each column do not differ significantly at p < 0.05. N is the number of seeds analyzed.
CultivarNAreaJ Index
Mean (Std Dev)MinMaxMean (Std Dev)MinMax
Airen3017.7 a (1.21)15.519.790.4 a (2.09)83.994.1
Bobal3018.3 a (1.30)15.720.890.3 a(2.02)84.394.0
Mazuela3016.4 b (0.96)14.518.390.1 a(1.93)85.392.8
Table 12. Values of area and J index in the De Cuerno cultivar.
CultivarNAreaJ Index
Mean (Std Dev)MinMaxMean (Std Dev)MinMax
De Cuerno2029.1 (1.46)26.031.188.8 (1.63)85.891.6
Publisher’s Note: MDPI stays neutral with regard to jurisdictional claims in published maps and institutional affiliations.