
Biostimulant Activity of Azotobacter chroococcum and Trichoderma harzianum in Durum Wheat under Water and Nitrogen Deficiency

 ,
,  , , and
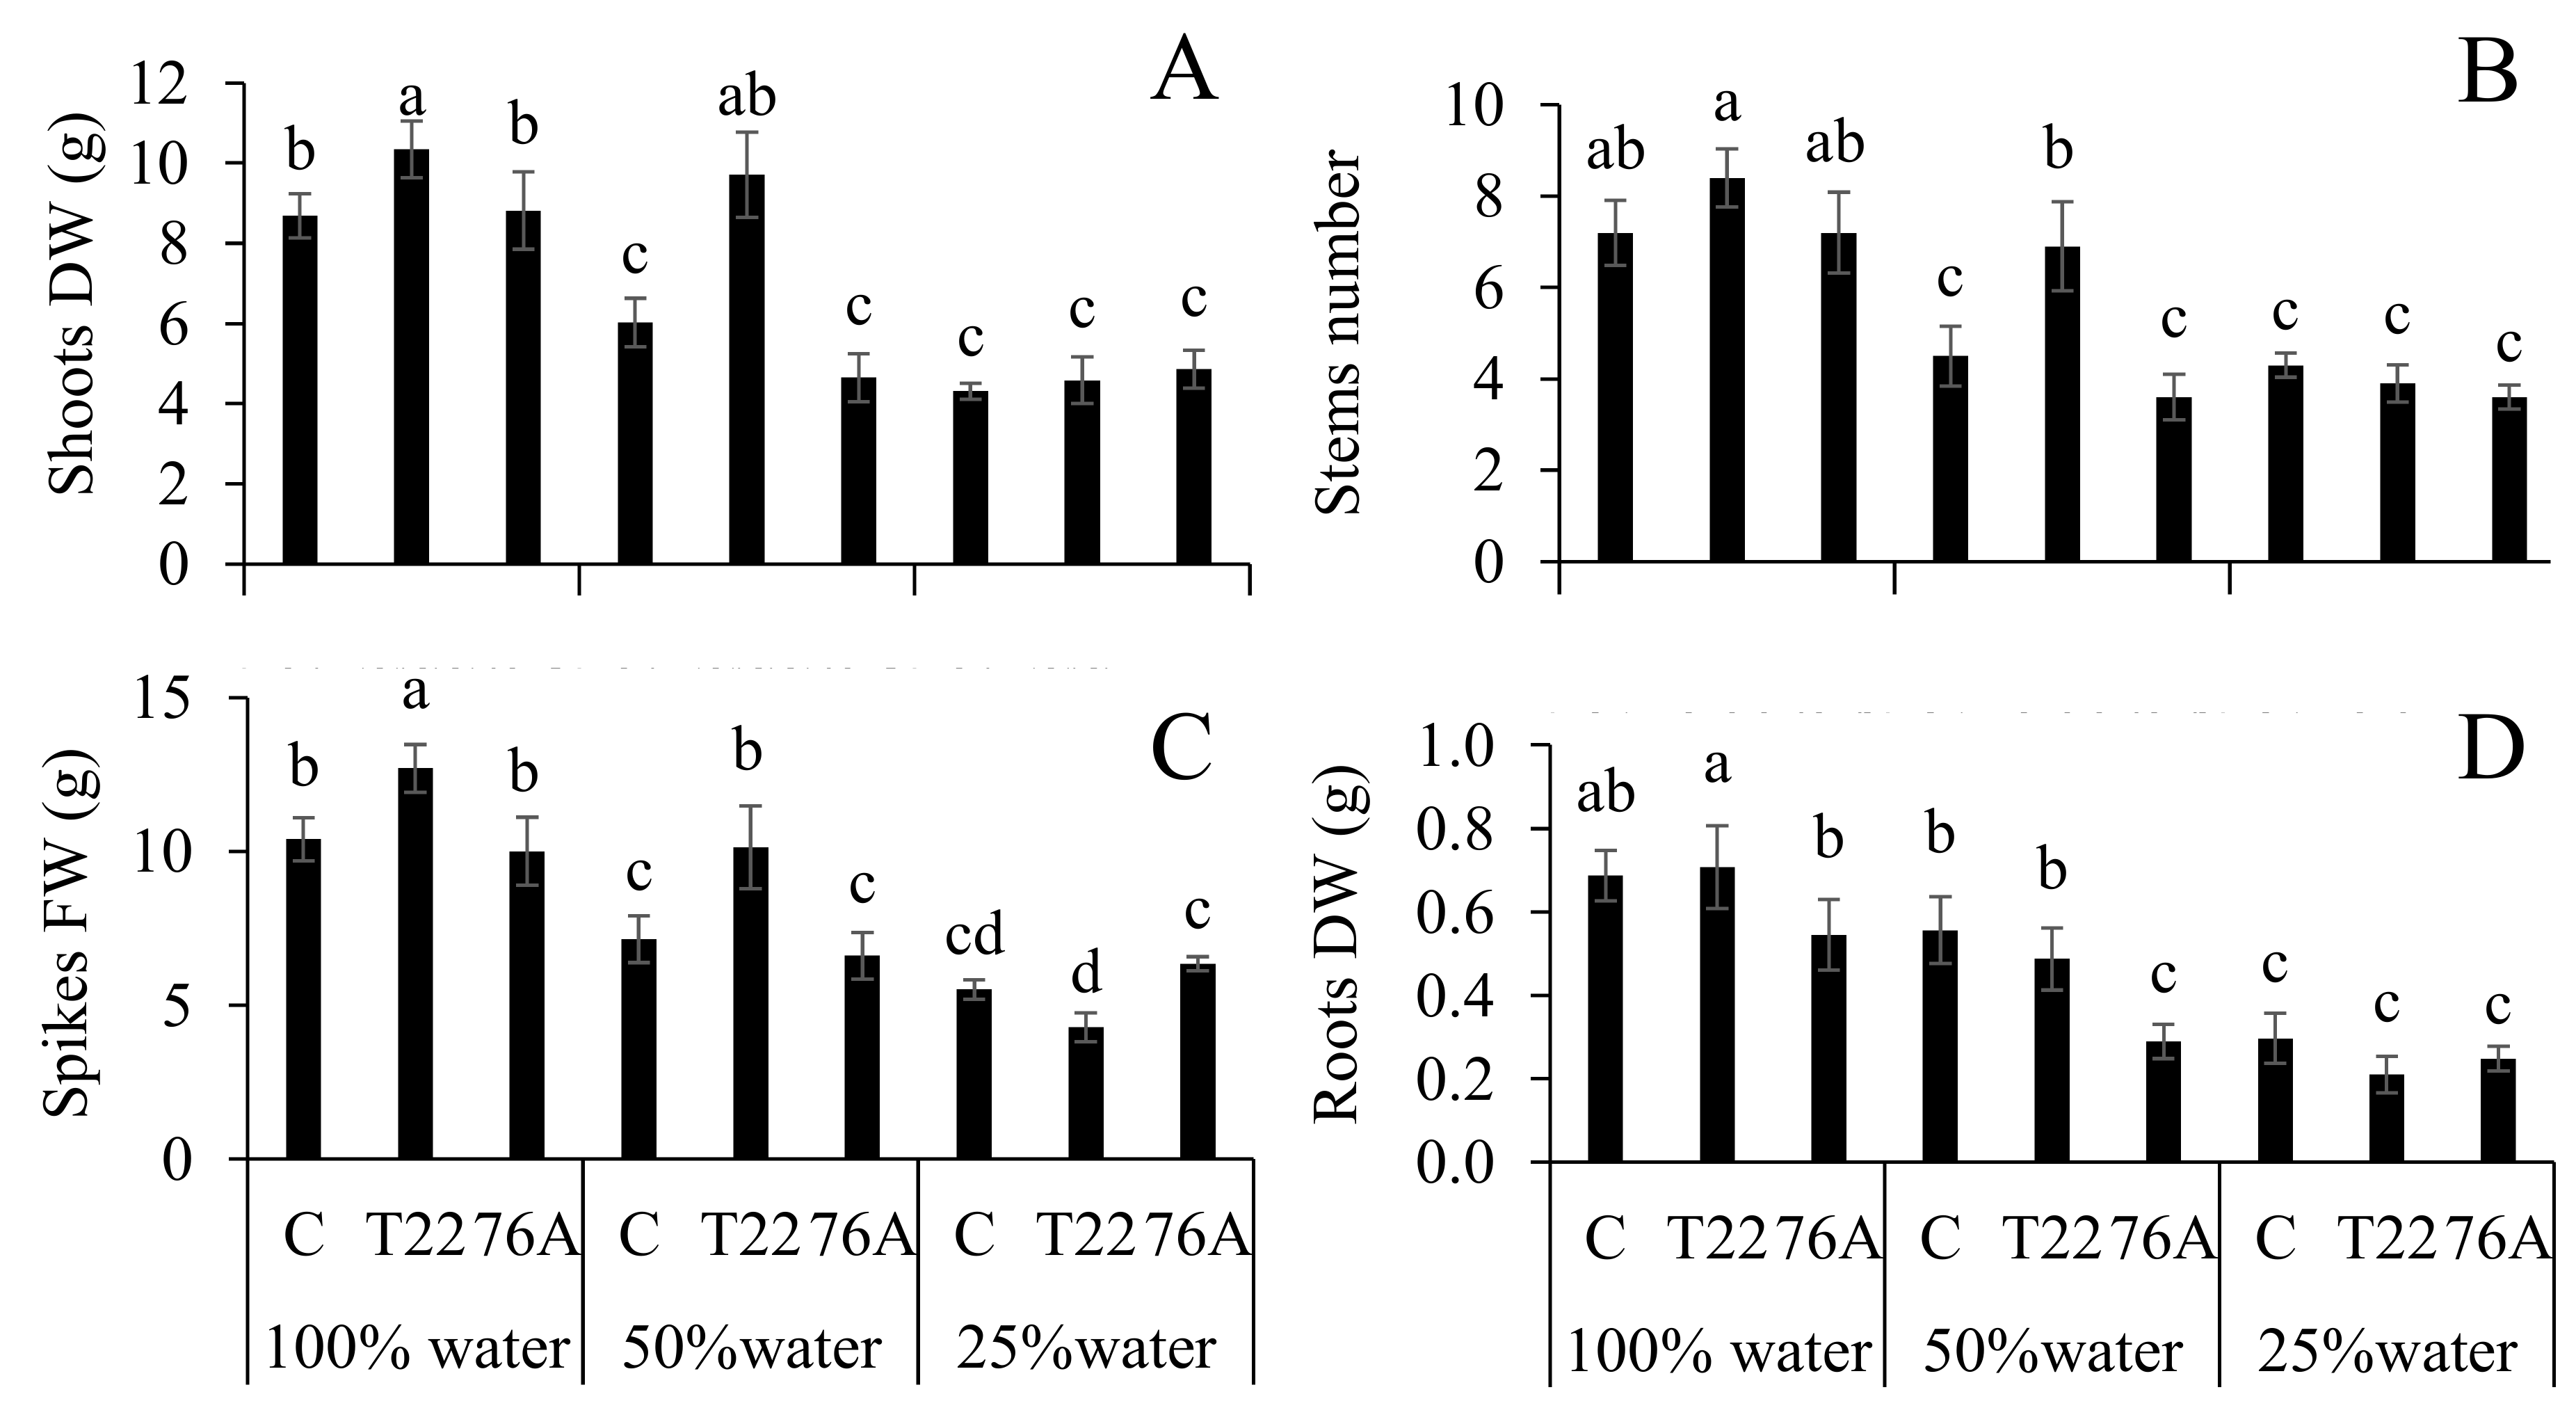
Abstract
1. Introduction
2. Materials and Methods
2.1. Growing Conditions and Experimental Design
2.2. Bacterial and Fungal Inoculum
2.3. Physiological and Biometric Measurements
2.4. Mineral Analysis
2.5. Gene Expression Analysis
2.6. Proline Content Measurement
2.7. Statistical Analysis
3. Results
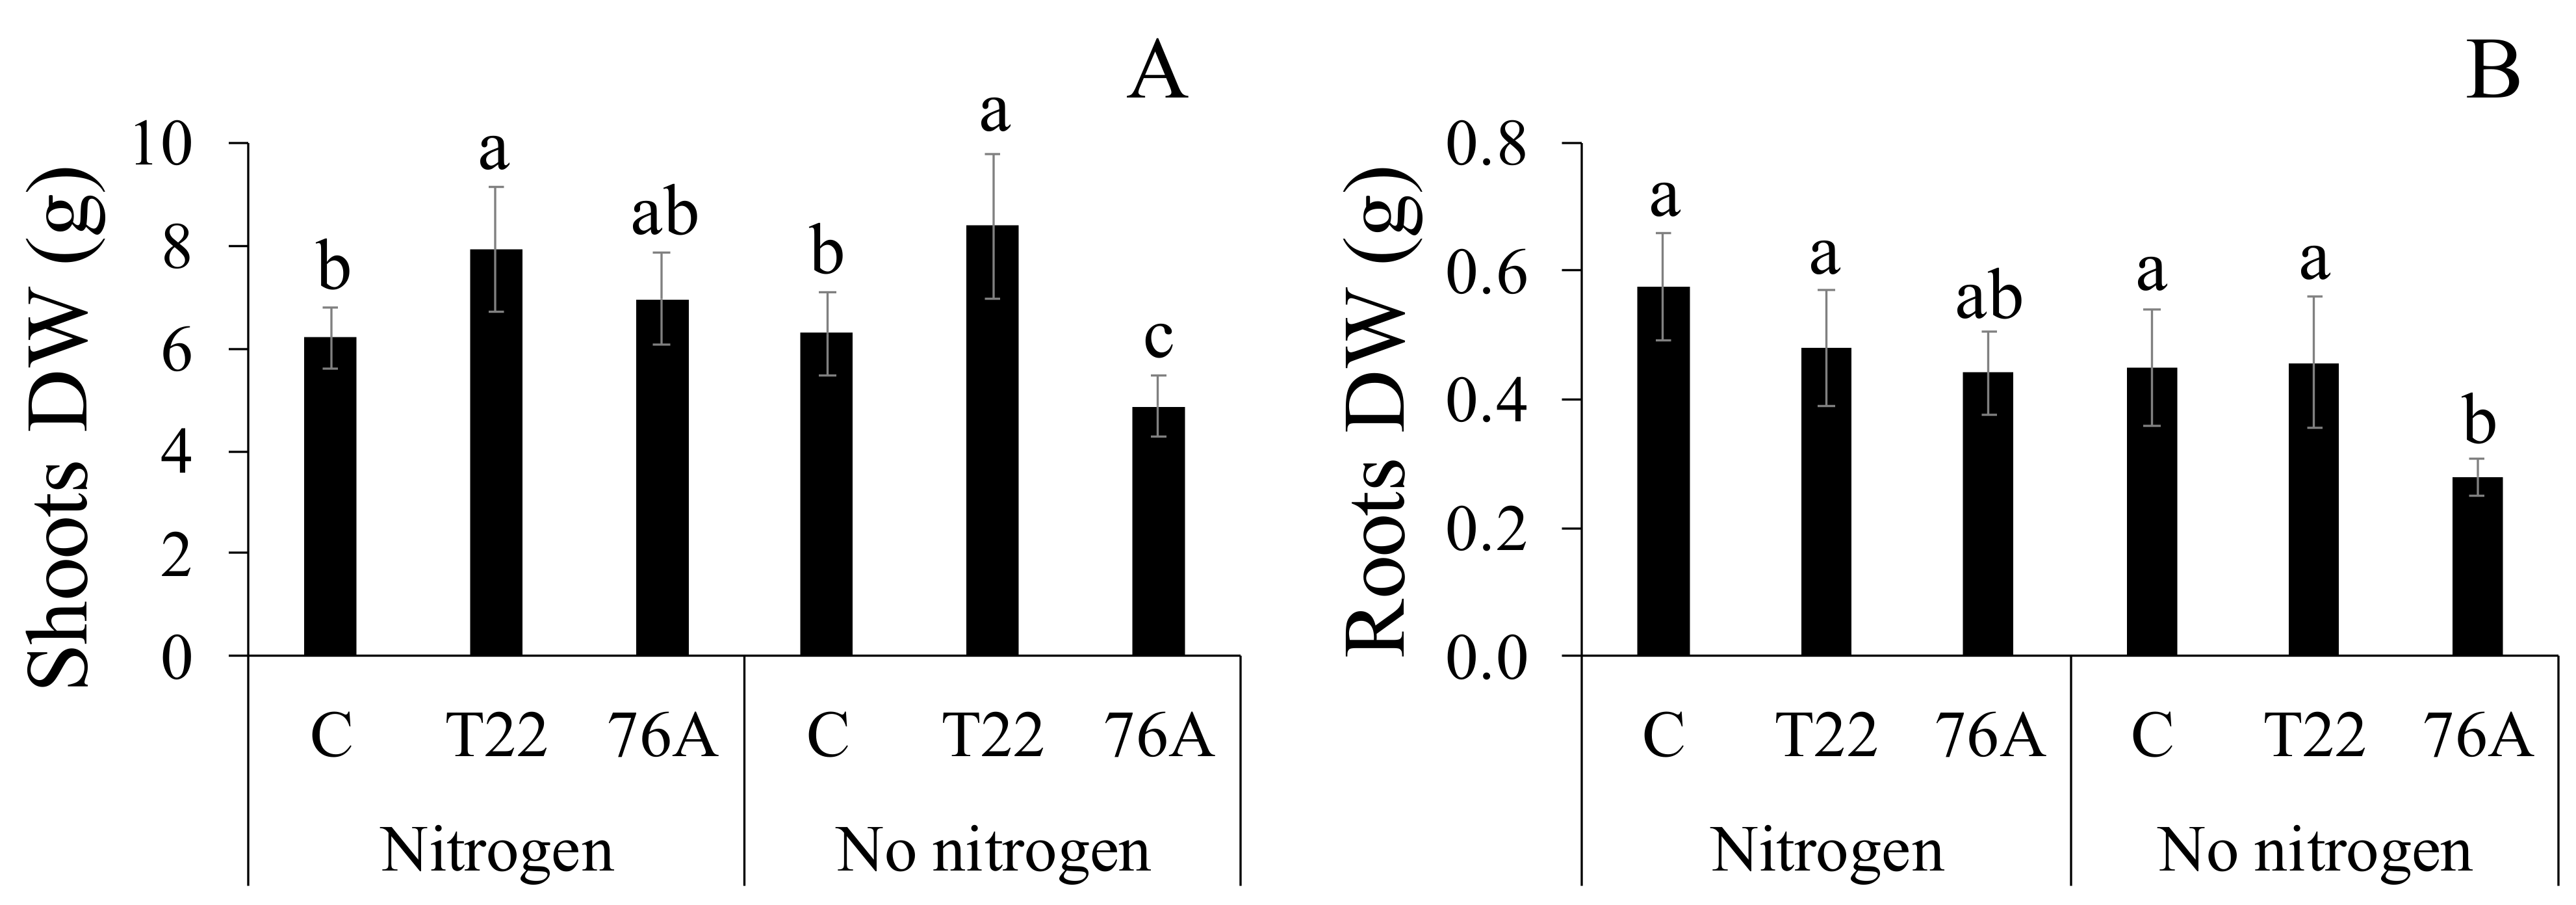
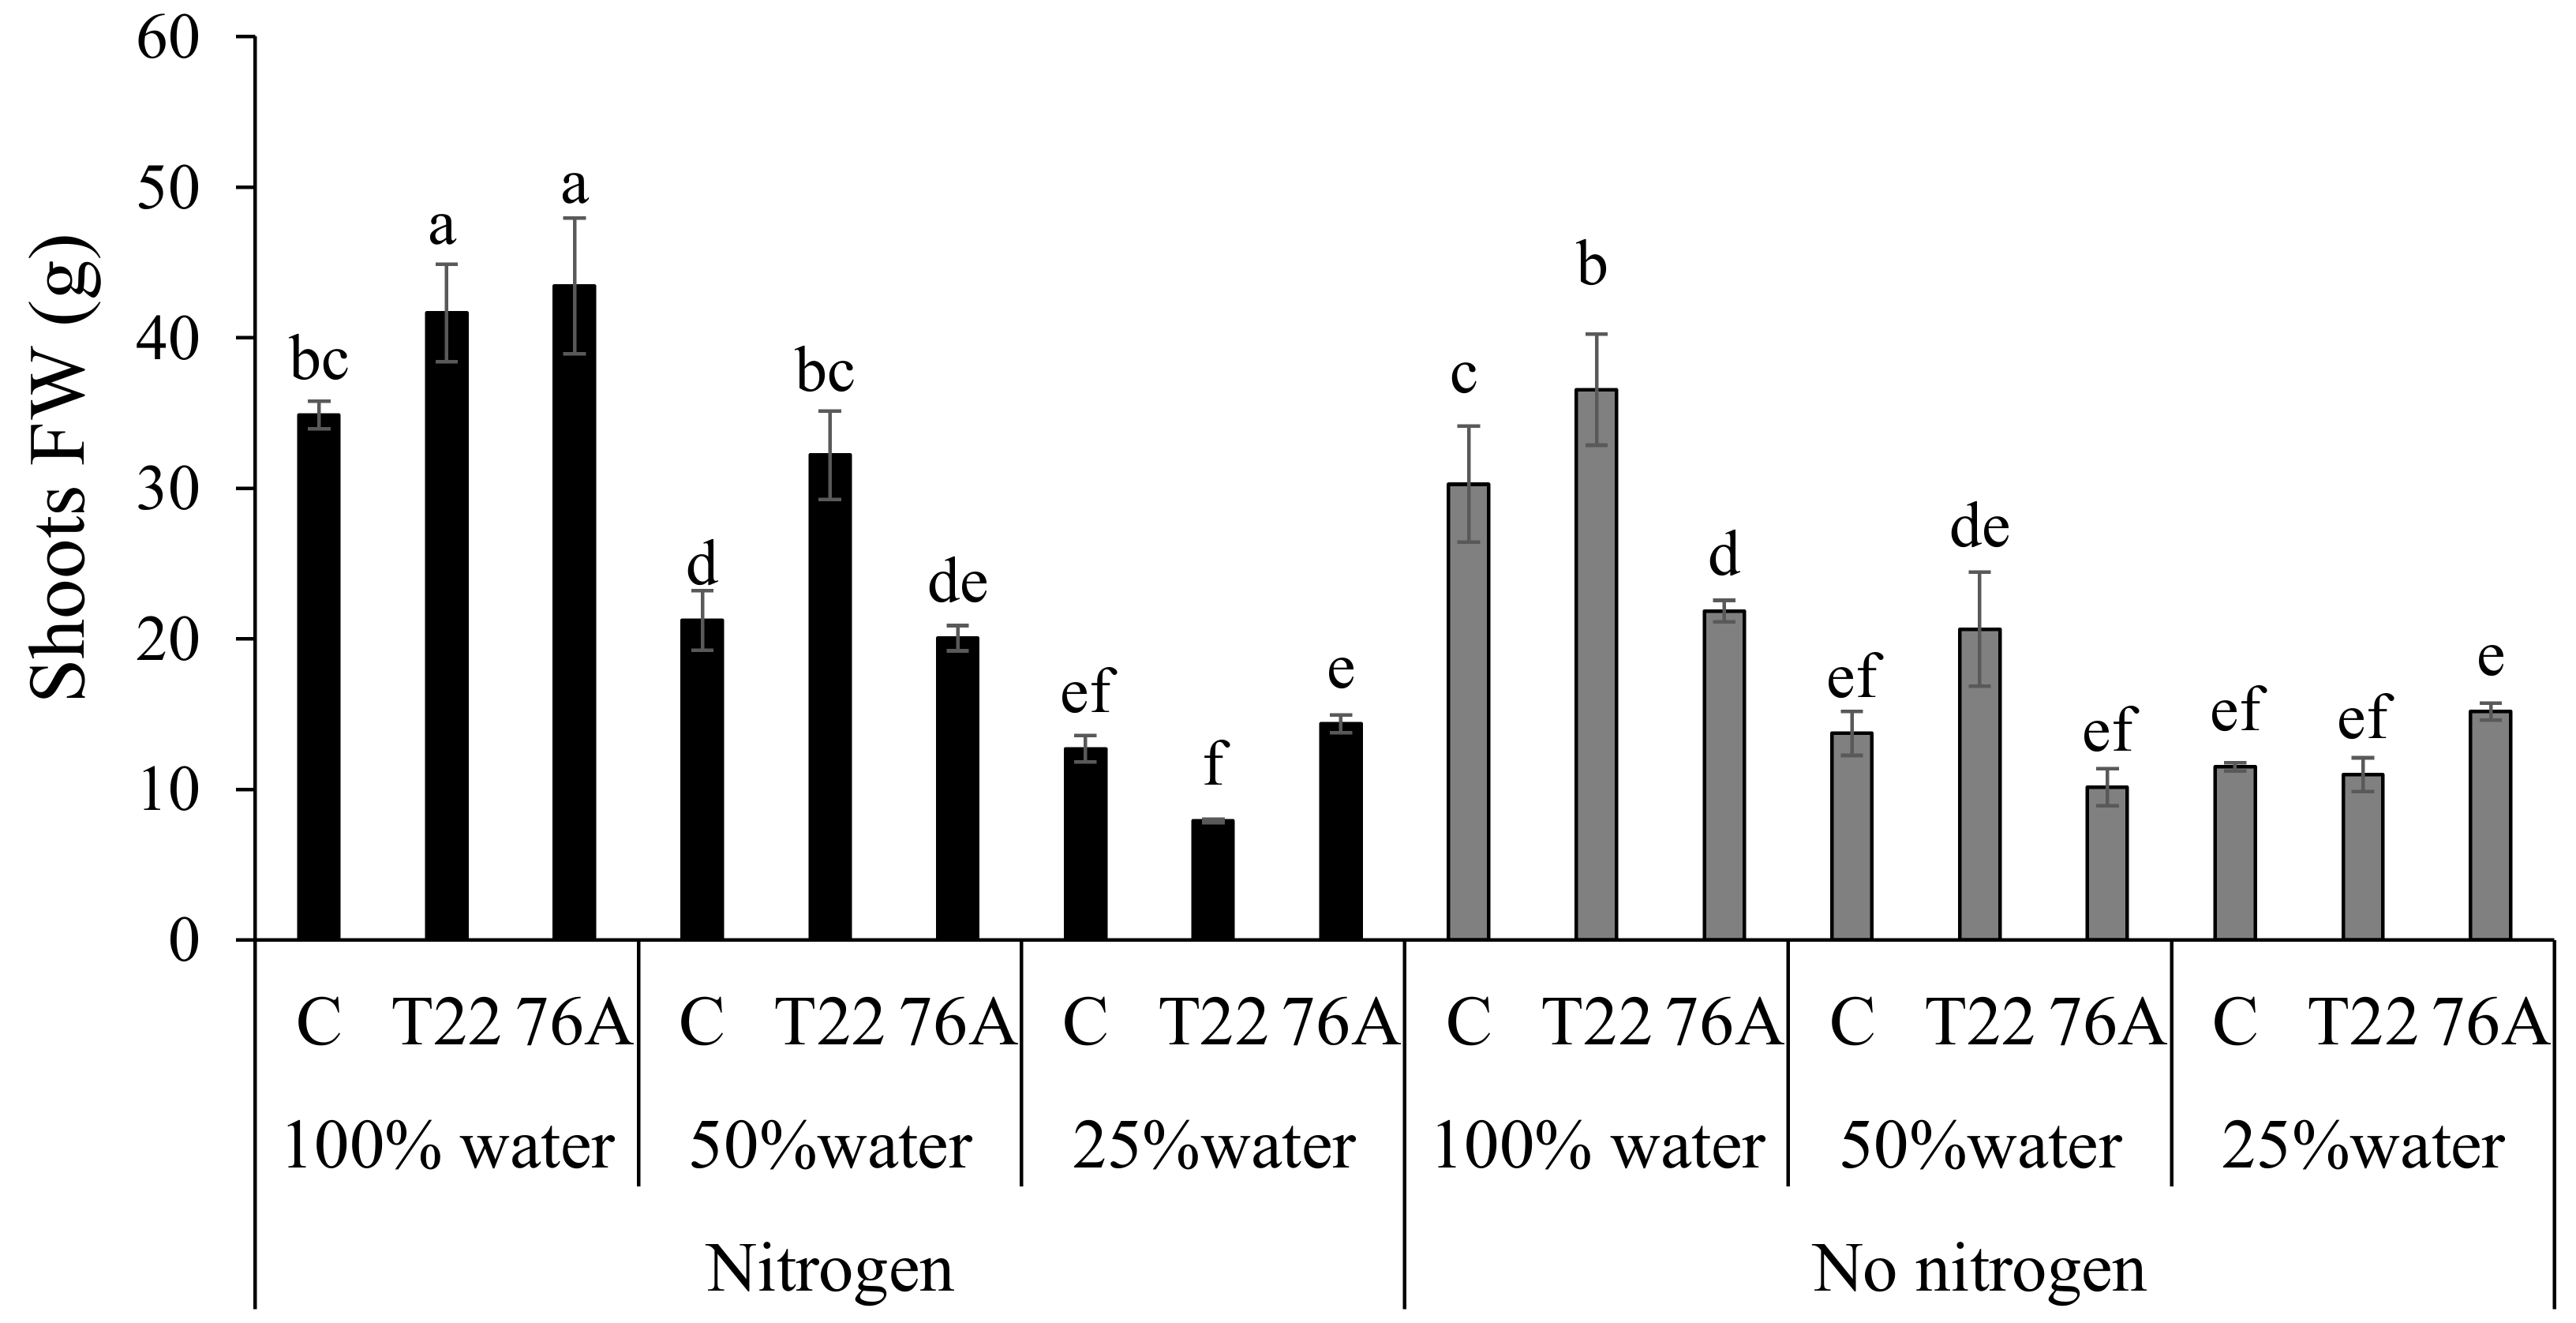
3.1. Microbial Counts, Plant Growth and Yield
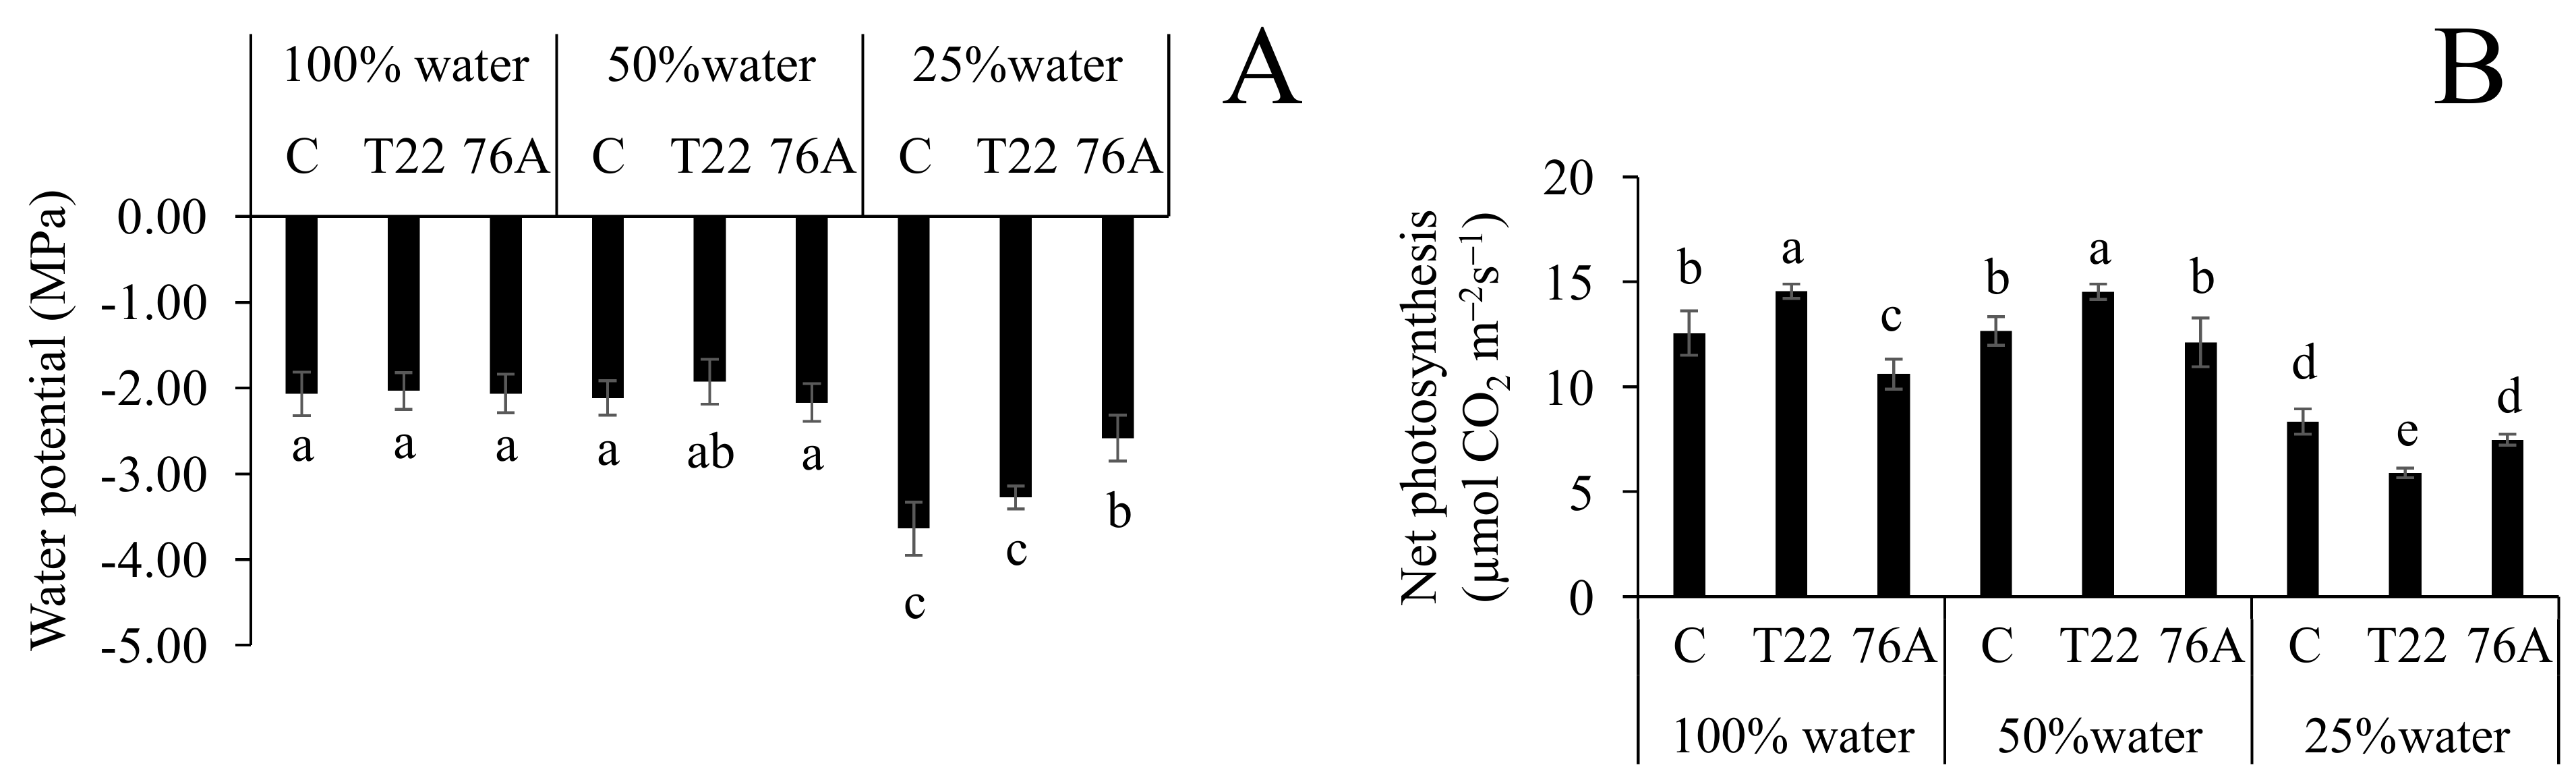
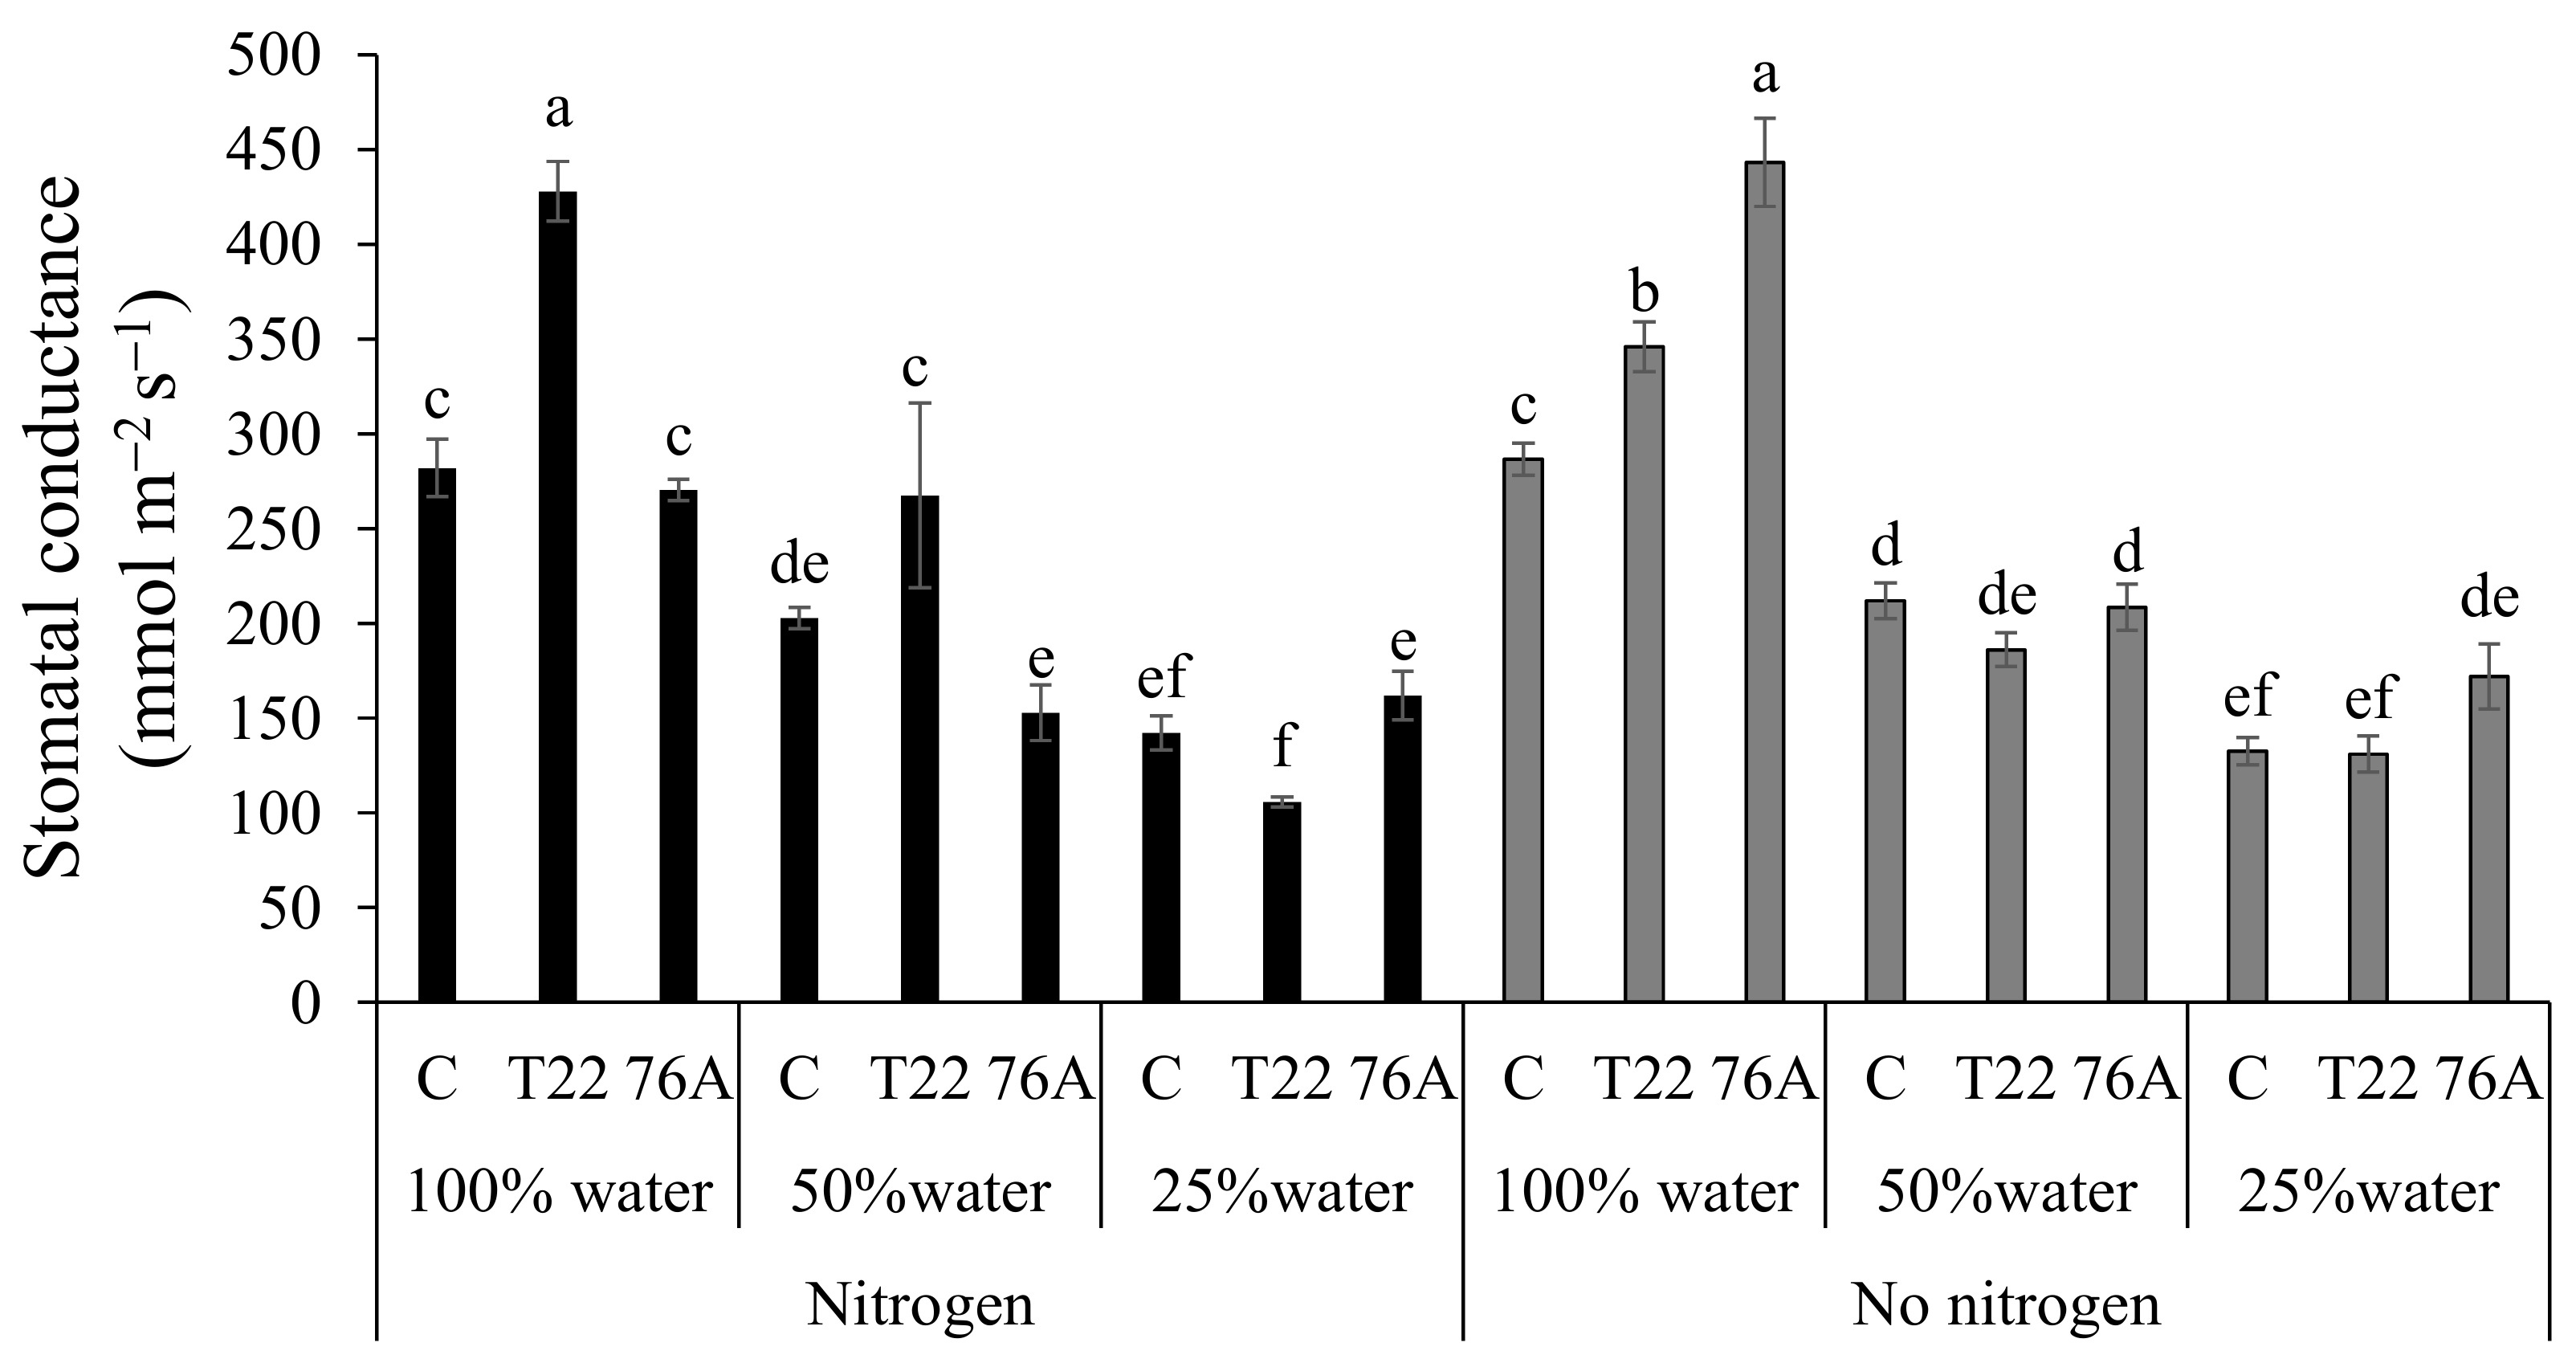
3.2. Physiological Responses to Combined N and Water Stress
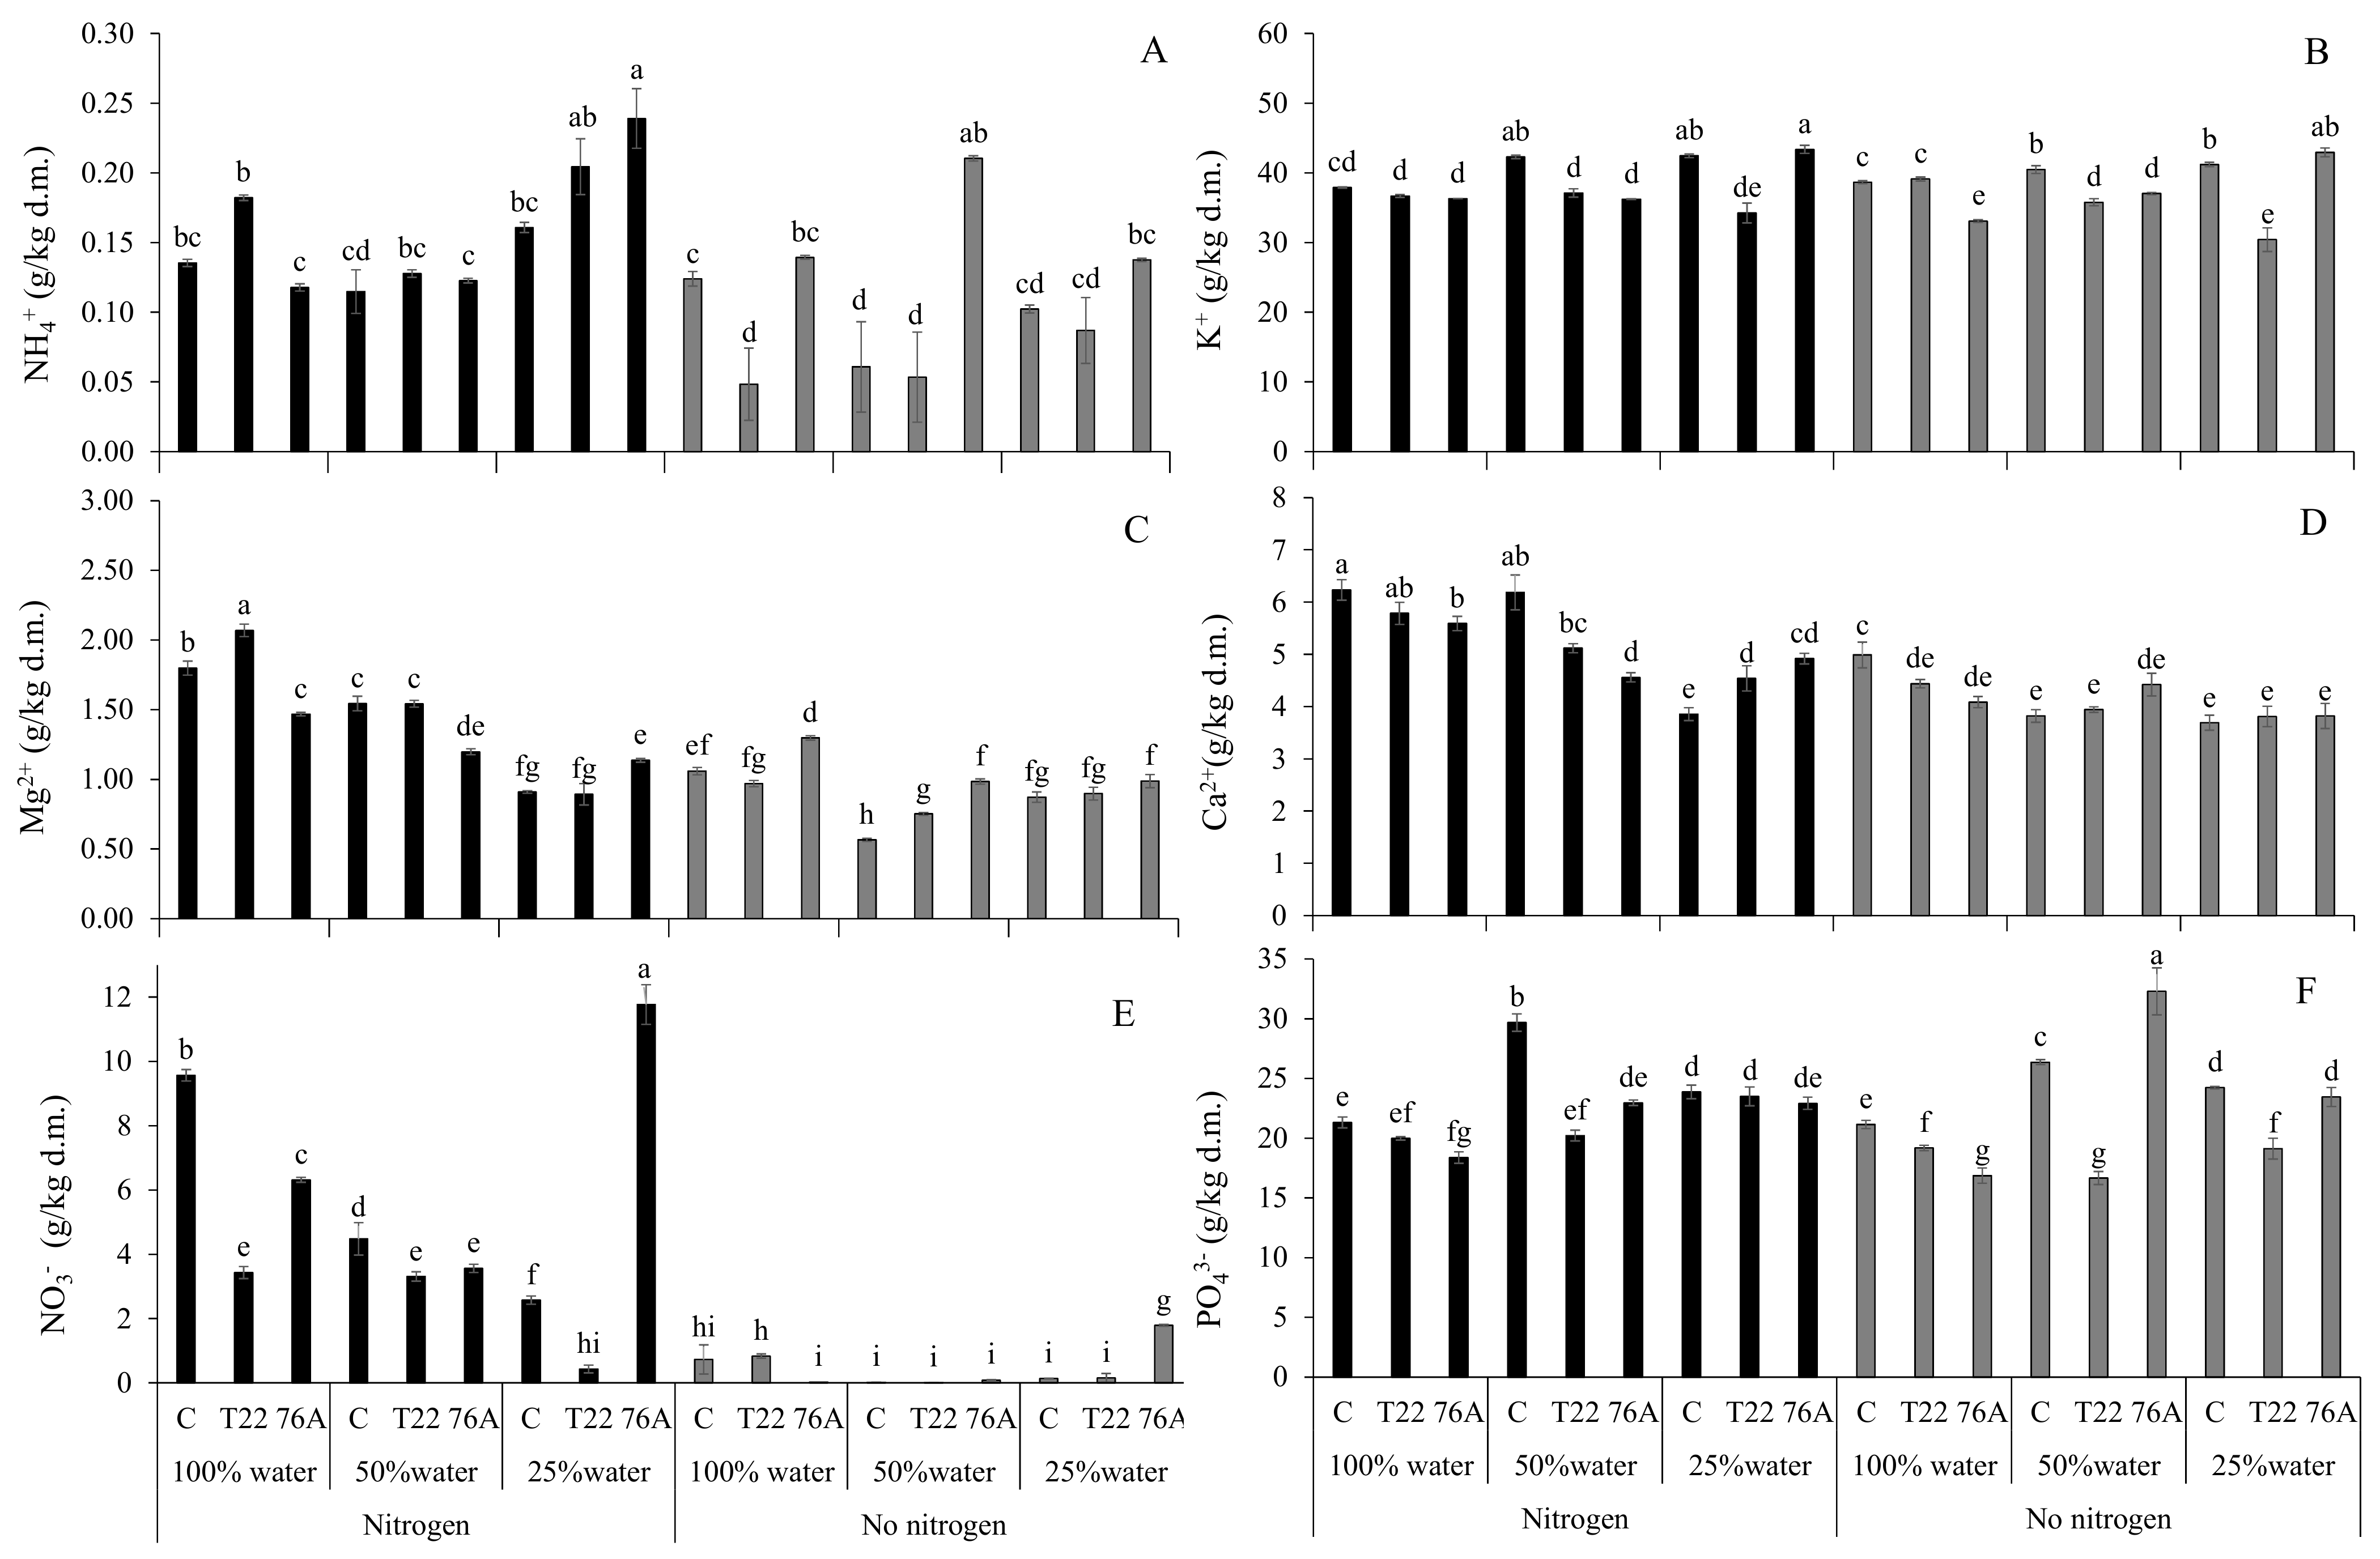
3.3. Leaf and Root Ion Content
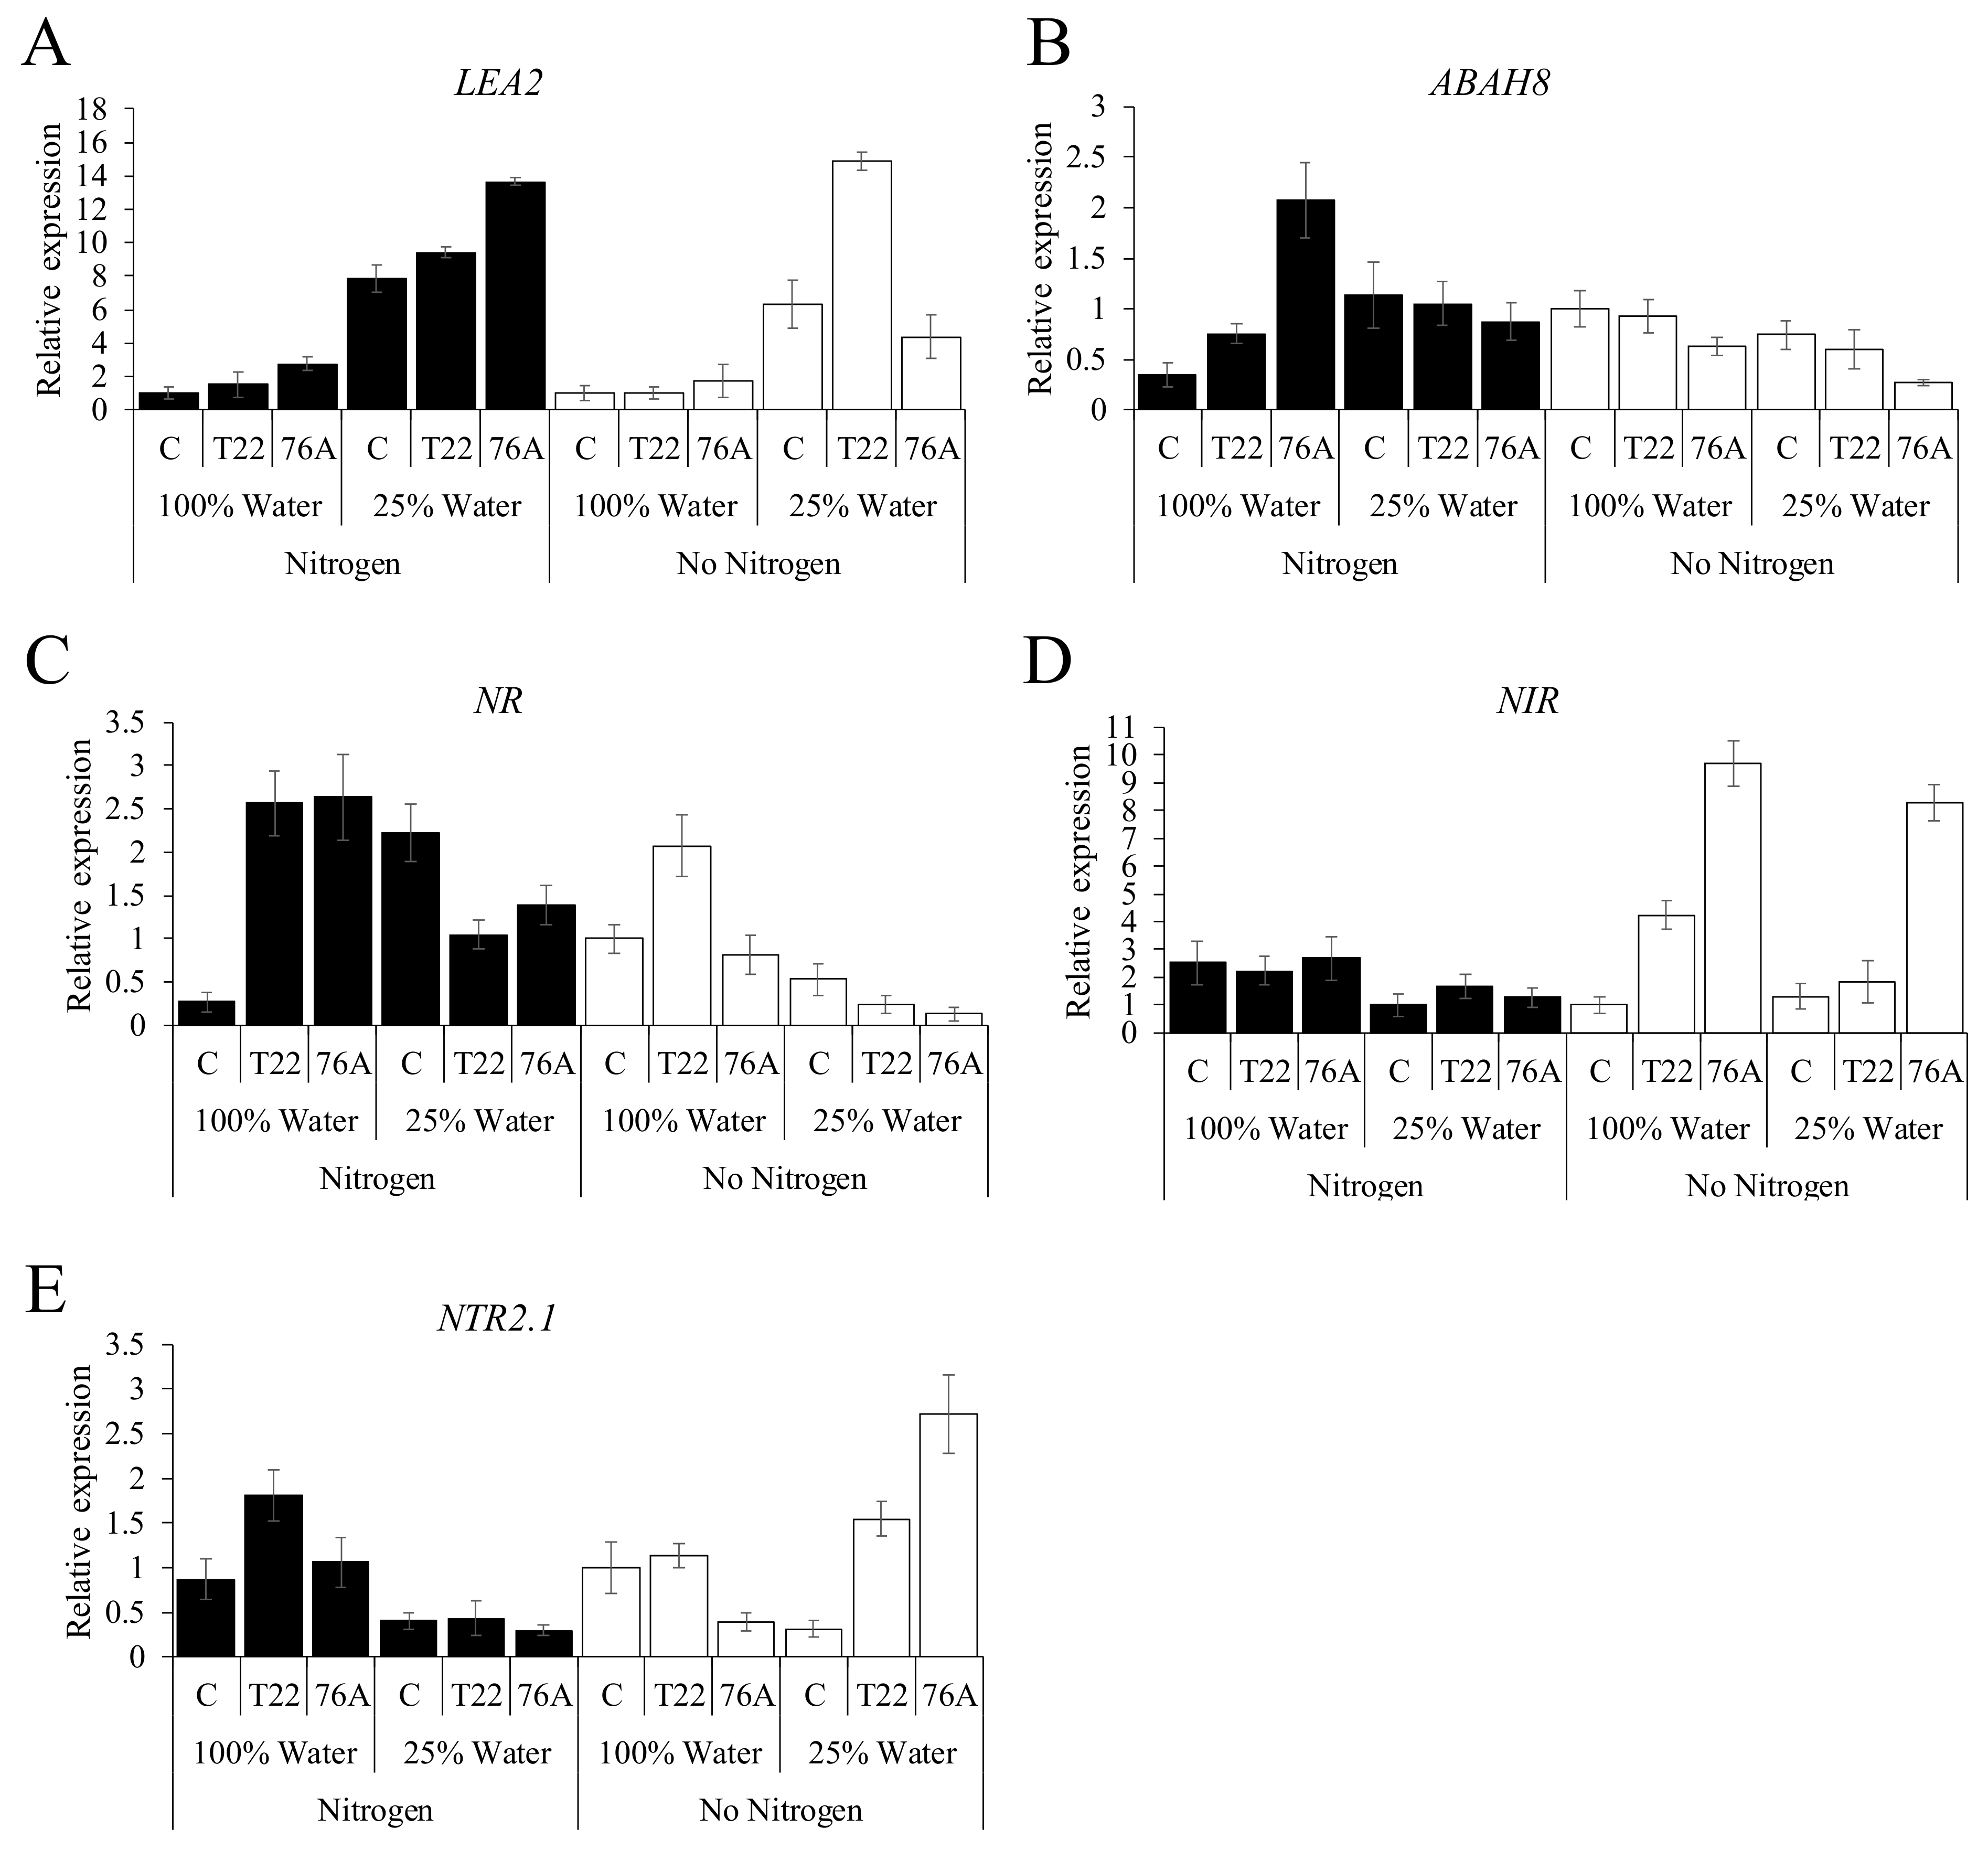
3.4. Gene Expression
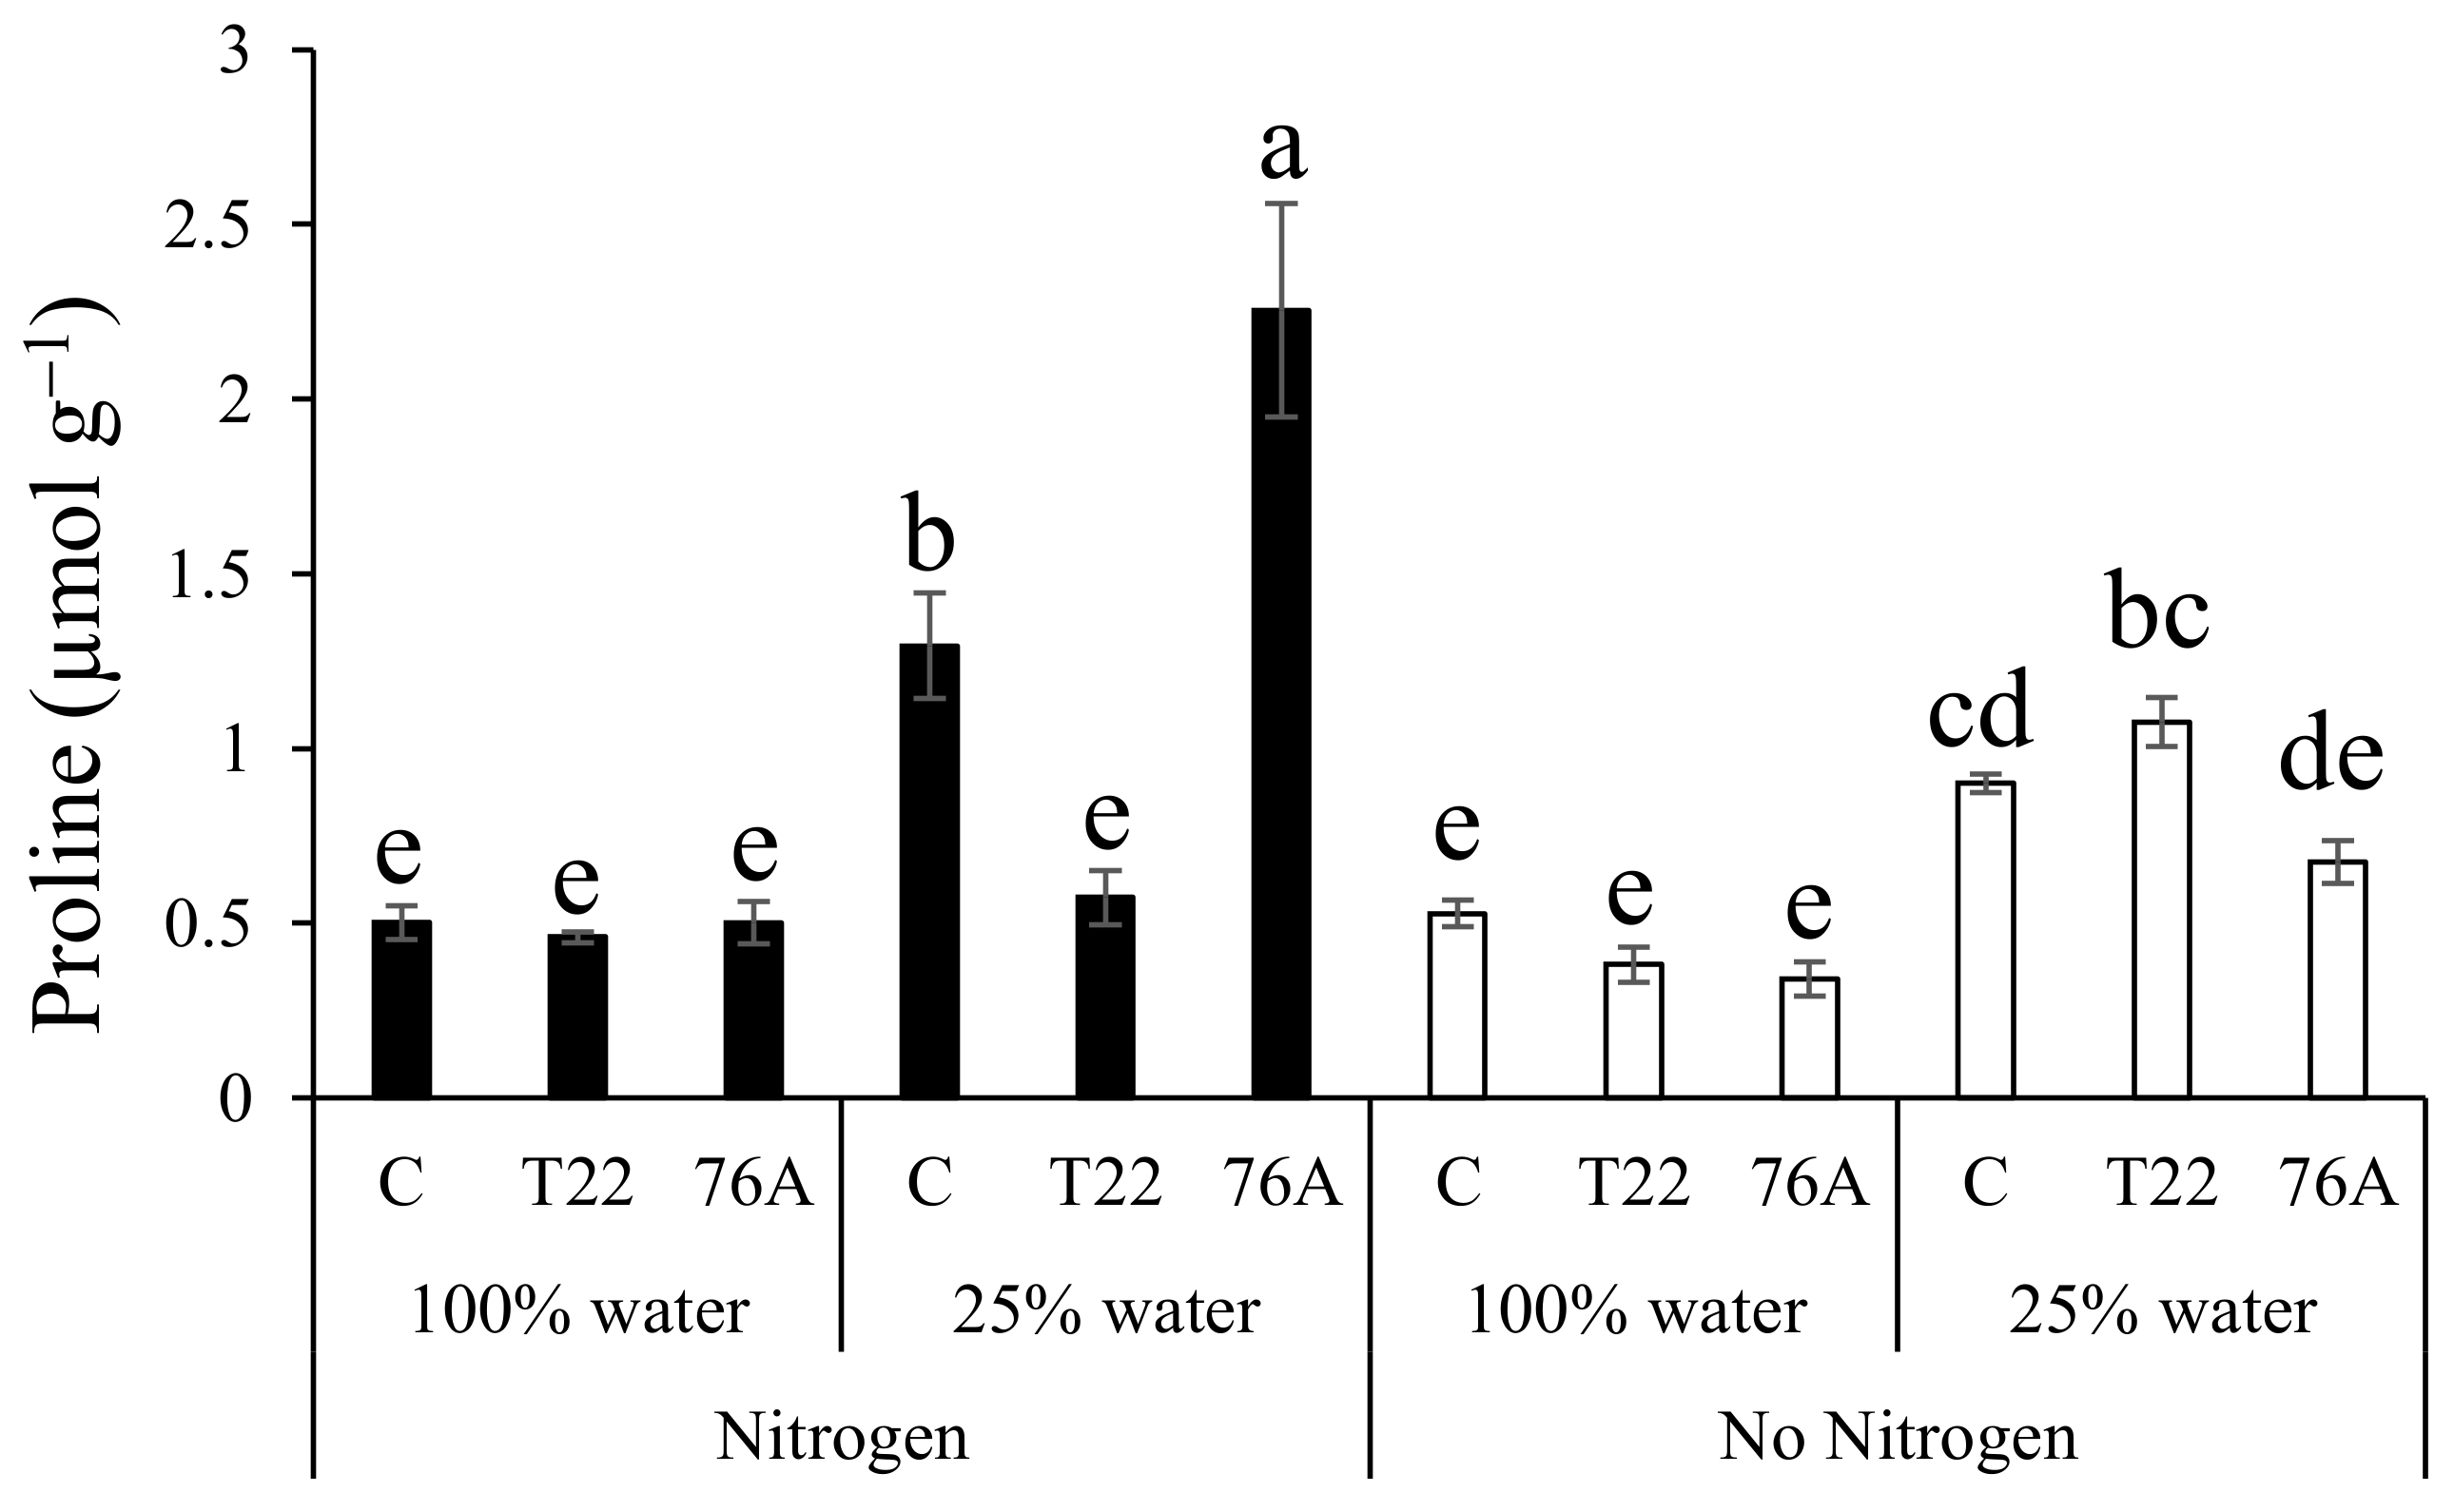
3.5. Proline Content
4. Discussion
4.1. T. harzianum Enhances Yield and Biomass Production under Reduced Water and Nitrogen Availability
4.2. Photosynthetic Functionality, Water Relation and Ion Partitioning Are Critical Components of T. harzianum T22 vs. A. chroococcum 76A Mediated Stress Protection
4.3. Molecular Basis of Wheat-Microorganisms Interactions in Response to Water and Nitrogen Limitations
Supplementary Materials
Author Contributions
Funding
Institutional Review Board Statement
Informed Consent Statement
Data Availability Statement
Conflicts of Interest
References
- Evans, N.; Baierl, A.; Semenov, M.A.; Gladders, P.; Fitt, B.D.L. Range and severity of a plant disease increased by global warming. J. R. Soc. Interface 2008, 5, 525–531. [Google Scholar] [CrossRef]
- Eckardt, N.A.; Cominelli, E. The future of science: Food and water for life. Plant Cell 2009, 21, 368–372. [Google Scholar] [CrossRef]
- Zou, Y.N.; Wu, Q.S.; Kuča, K. Unravelling the role of arbuscular mycorrhizal fungi in mitigating the oxidative burst of plants under drought stress. Plant Biol. 2020, 1–8. [Google Scholar] [CrossRef]
- Farooq, M.; Hussain, M.; Wahid, A.; Siddique, K.H.M. Drought stress in plants: An overview. In Plant Responses to Drought Stress: From Morphological to Molecular Features; Springer: Berlin/Heidelberg, Germany, 2012; pp. 1–33. ISBN 9783642326530. [Google Scholar]
- Lambers, H.; Oliveira, R.S. Plant Physiological Ecology; Springer: New York, NY, USA, 2019; ISBN 9783030296391. [Google Scholar]
- Ilyas, M.; Nisar, M.; Khan, N.; Hazrat, A.; Khan, A.H.; Hayat, K.; Fahad, S.; Khan, A.; Ullah, A. Drought tolerance strategies in plants: A mechanistic approach. J. Plant Growth Regul. 2020. [Google Scholar] [CrossRef]
- Tardieu, F.; Simonneau, T.; Muller, B. The physiological basis of drought tolerance in crop plants: A scenario-dependent probabilistic approach. Annu. Rev. Plant Biol. 2018, 69, 733–759. [Google Scholar] [CrossRef]
- Ruggiero, A.; Punzo, P.; Landi, S.; Costa, A.; Van Oosten, M.J.; Grillo, S. Improving plant water use efficiency through molecular genetics. Horticulturae 2017, 3, 31. [Google Scholar] [CrossRef]
- Li, Y.; Ye, W.; Wang, M.; Yan, X. Climate change and drought: A risk assessment of crop-yield impacts. Clim. Res. 2009, 39, 31–46. [Google Scholar] [CrossRef]
- Farooq, M.; Basra, S.M.A.; Wahid, A.; Ahmad, N.; Saleem, B.A. Improving the drought tolerance in rice (Oryza sativa L.) by exogenous application of salicylic acid. J. Agron. Crop Sci. 2009, 195, 237–246. [Google Scholar] [CrossRef]
- He, M.; Dijkstra, F.A. Drought effect on plant nitrogen and phosphorus: A meta-analysis. New Phytol. 2014, 204, 924–931. [Google Scholar] [CrossRef] [PubMed]
- Van Oosten, M.J.; Pepe, O.; De Pascale, S.; Silletti, S.; Maggio, A. The role of biostimulants and bioeffectors as alleviators of abiotic stress in crop plants. Chem. Biol. Technol. Agric. 2017, 4, 5. [Google Scholar] [CrossRef]
- Di Stasio, E.; Cirillo, V.; Raimondi, G.; Giordano, M.; Esposito, M.; Maggio, A. Osmo-priming with seaweed extracts enhances yield of salt-stressed tomato plants. Agronomy 2020, 10, 1559. [Google Scholar] [CrossRef]
- Battacharyya, D.; Babgohari, M.Z.; Rathor, P.; Prithiviraj, B. Seaweed extracts as biostimulants in horticulture. Sci. Hortic. 2015, 196, 39–48. [Google Scholar] [CrossRef]
- Colla, G.; Nardi, S.; Cardarelli, M.; Ertani, A.; Lucini, L.; Canaguier, R.; Rouphael, Y. Protein hydrolysates as biostimulants in horticulture. Sci. Hortic. 2015, 196, 28–38. [Google Scholar] [CrossRef]
- Canellas, L.P.; Olivares, F.L.; Aguiar, N.O.; Jones, D.L.; Nebbioso, A.; Mazzei, P.; Piccolo, A. Humic and fulvic acids as biostimulants in horticulture. Sci. Hortic. 2015, 196, 15–27. [Google Scholar] [CrossRef]
- Savvas, D.; Ntatsi, G. Biostimulant activity of silicon in horticulture. Sci. Hortic. 2015, 196, 66–81. [Google Scholar] [CrossRef]
- Pichyangkura, R.; Chadchawan, S. Biostimulant activity of chitosan in horticulture. Sci. Hortic. 2015, 196, 49–65. [Google Scholar] [CrossRef]
- Gómez-Merino, F.C.; Trejo-Téllez, L.I. Biostimulant activity of phosphite in horticulture. Sci. Hortic. 2015, 196, 82–90. [Google Scholar] [CrossRef]
- Rouphael, Y.; Franken, P.; Schneider, C.; Schwarz, D.; Giovannetti, M.; Agnolucci, M.; De Pascale, S.; Bonini, P.; Colla, G. Arbuscular mycorrhizal fungi act as biostimulants in horticultural crops. Sci. Hortic. 2015, 196, 91–108. [Google Scholar] [CrossRef]
- Woo, S.L.; Scala, F.; Ruocco, M.; Lorito, M. The molecular biology of the interactions between Trichoderma spp., phytopathogenic fungi and plants. Phytopathology 2006, 96, 181–185. [Google Scholar] [CrossRef]
- López-Bucio, J.; Pelagio-Flores, R.; Herrera-Estrella, A. Trichoderma as biostimulant: Exploiting the multilevel properties of a plant beneficial fungus. Sci. Hortic. 2015, 196, 109–123. [Google Scholar] [CrossRef]
- Ruzzi, M.; Aroca, R. Plant growth-promoting rhizobacteria act as biostimulants in horticulture. Sci. Hortic. 2015, 196, 124–134. [Google Scholar] [CrossRef]
- Dodd, I.C.; Ruiz-Lozano, J.M. Microbial enhancement of crop resource use efficiency. Curr. Opin. Biotechnol. 2012, 23, 236–242. [Google Scholar] [CrossRef] [PubMed]
- Zhang, F.; Huo, Y.; Cobb, A.B.; Luo, G.; Zhou, J.; Yang, G.; Wilson, G.W.T.; Zhang, Y. Trichoderma biofertilizer links to altered soil chemistry, altered microbial communities and improved grassland biomass. Front. Microbiol. 2018, 9, 848. [Google Scholar] [CrossRef]
- Chen, M.; Arato, M.; Borghi, L.; Nouri, E.; Reinhardt, D. Beneficial services of arbuscular mycorrhizal fungi—From ecology to application. Front. Plant Sci. 2018, 9, 1270. [Google Scholar] [CrossRef] [PubMed]
- Singh, P.K.; Singh, M.; Tripathi, B.N. Glomalin: An arbuscular mycorrhizal fungal soil protein. Protoplasma 2013, 250, 663–669. [Google Scholar] [CrossRef]
- Smith, S.E.; Facelli, E.; Pope, S.; Smith, F.A. Plant performance in stressful environments: Interpreting new and established knowledge of the roles of arbuscular mycorrhizas. Plant Soil 2010, 326, 3–20. [Google Scholar] [CrossRef]
- Khalvati, M.A.; Hu, Y.; Mozafar, A.; Schmidhalter, U. Quantification of water uptake by arbuscular mycorrhizal hyphae and its significance for leaf growth, water relations and gas exchange of barley subjected to drought stress. Plant Biol. 2005, 7, 706–712. [Google Scholar] [CrossRef]
- Harman, G.E.; Howell, C.R.; Viterbo, A.; Chet, I.; Lorito, M. Trichoderma species—Opportunistic, avirulent plant symbionts. Nat. Rev. Microbiol. 2004, 2, 43–56. [Google Scholar] [CrossRef]
- Seidl, V.; Marchetti, M.; Schandl, R.; Allmaier, G.; Kubicek, C.P. Epl1, the major secreted protein of Hypocrea atroviridis on glucose, is a member of a strongly conserved protein family comprising plant defense response elicitors. FEBS J. 2006, 273, 4346–4359. [Google Scholar] [CrossRef]
- Vinale, F.; Sivasithamparam, K.; Ghisalberti, E.L.; Marra, R.; Woo, S.L.; Lorito, M. Trichoderma-plant-pathogen interactions. Soil Biol. Biochem. 2008, 40, 1–10. [Google Scholar] [CrossRef]
- Lorito, M.; Woo, S.L.; Harman, G.E.; Monte, E. Translational research on Trichoderma: From ’omics to the field. Annu. Rev. Phytopathol. 2010, 48, 395–417. [Google Scholar] [CrossRef]
- Shoresh, M.; Harman, G.E.; Mastouri, F. Induced systemic resistance and plant responses to fungal biocontrol agents. Annu. Rev. Phytopathol. 2010, 48, 21–43. [Google Scholar] [CrossRef]
- Mukherjee, P.K.; Horwitz, B.A.; Herrera-Estrella, A.; Schmoll, M.; Kenerley, C.M. Trichoderma research in the genome era. Annu. Rev. Phytopathol. 2013, 51, 105–129. [Google Scholar] [CrossRef]
- Studholme, D.J.; Harris, B.; Le Cocq, K.; Winsbury, R.; Perera, V.; Ryder, L.; Ward, J.L.; Beale, M.H.; Thornton, C.R.; Grant, M. Investigating the beneficial traits of Trichoderma hamatum GD12 for sustainable agriculture-insights from genomics. Front. Plant Sci. 2013, 4, 258. [Google Scholar] [CrossRef]
- Hermosa, R.; Belén Rubio, M.; Cardoza, R.E.; Nicolás, C.; Monte, E.; Gutiérrez, S. The contribution of Trichoderma to balancing the costs of plant growth and defense. Int. Microbiol. 2013, 16, 69–80. [Google Scholar]
- Hermosa, R.; Viterbo, A.; Chet, I.; Monte, E. Plant-beneficial effects of Trichoderma and of its genes. Microbiology 2012, 158, 17–25. [Google Scholar] [CrossRef]
- Pandey, V.; Ansari, M.W.; Tula, S.; Yadav, S.; Sahoo, R.K.; Shukla, N.; Bains, G.; Badal, S.; Chandra, S.; Gaur, A.K.; et al. Dose-dependent response of Trichoderma harzianum in improving drought tolerance in rice genotypes. Planta 2016, 243, 1251–1264. [Google Scholar] [CrossRef] [PubMed]
- Mastouri, F.; Björkman, T.; Harman, G.E. Trichoderma harzianum enhances antioxidant defense of tomato seedlings and resistance to water deficit. Mol. Plant Microbe Interact. 2012, 25, 1264–1271. [Google Scholar] [CrossRef] [PubMed]
- Mona, S.A.; Hashem, A.; Abd Allah, E.F.; Alqarawi, A.A.; Soliman, D.W.K.; Wirth, S.; Egamberdieva, D. Increased resistance of drought by Trichoderma harzianum fungal treatment correlates with increased secondary metabolites and proline content. J. Integr. Agric. 2017, 16, 1751–1757. [Google Scholar] [CrossRef]
- Rawat, L.; Bisht, T.S.; Kukreti, A.; Prasad, M. Bioprospecting drought tolerant Trichoderma harzianum isolates promote growth and delay the onset of drought responses in wheat (Triticum aestivum L.). Mol. Soil Biol. 2016, 7, 1–15. [Google Scholar] [CrossRef][Green Version]
- Van Oosten, M.J.; Di Stasio, E.; Cirillo, V.; Silletti, S.; Ventorino, V.; Pepe, O.; Raimondi, G.; Maggio, A. Root inoculation with Azotobacter chroococcum 76A enhances tomato plants adaptation to salt stress under low N conditions. BMC Plant Biol. 2018, 18, 205. [Google Scholar] [CrossRef]
- Gopalakrishnan, S.; Sathya, A.; Vijayabharathi, R.; Varshney, R.K.; Gowda, C.L.L.; Krishnamurthy, L. Plant growth promoting rhizobia: Challenges and opportunities. 3 Biotech 2015, 5, 355–377. [Google Scholar] [CrossRef]
- Egamberdieva, D. Alleviation of salt stress by plant growth regulators and IAA producing bacteria in wheat. Acta Physiol. Plant. 2009, 31, 861–864. [Google Scholar] [CrossRef]
- Ventorino, V.; Nicolaus, B.; Di Donato, P.; Pagliano, G.; Poli, A.; Robertiello, A.; Iavarone, V.; Pepe, O. Bioprospecting of exopolysaccharide-producing bacteria from different natural ecosystems for biopolymer synthesis from vinasse. Chem. Biol. Technol. Agric. 2019, 6, 18. [Google Scholar] [CrossRef]
- Paul, D.; Lade, H. Plant-growth-promoting rhizobacteria to improve crop growth in saline soils: A review. Agron. Sustain. Dev. 2014, 34, 737–752. [Google Scholar] [CrossRef]
- Kaushal, M.; Wani, S.P. Plant-growth-promoting rhizobacteria: Drought stress alleviators to ameliorate crop production in drylands. Ann. Microbiol. 2016, 66, 35–42. [Google Scholar] [CrossRef]
- Yakhin, O.I.; Lubyanov, A.A.; Yakhin, I.A.; Brown, P.H. Biostimulants in plant science: A global perspective. Front. Plant Sci. 2017, 7, 2049. [Google Scholar] [CrossRef] [PubMed]
- Rouphael, Y.; Colla, G. Synergistic biostimulatory action: Designing the next generation of plant biostimulants for sustainable agriculture. Front. Plant Sci. 2018, 871, 1655. [Google Scholar] [CrossRef]
- Gemin, L.G.; Mógor, Á.F.; De Oliveira Amatussi, J.; Mógor, G. Microalgae associated to humic acid as a novel biostimulant improving onion growth and yield. Sci. Hortic. 2019, 256, 108560. [Google Scholar] [CrossRef]
- Testa, G.; Gresta, F.; Cosentino, S.L. Dry matter and qualitative characteristics of alfalfa as affected by harvest times and soil water content. Eur. J. Agron. 2011, 34, 144–152. [Google Scholar] [CrossRef]
- Anastasio, M.; Pepe, O.; Cirillo, T.; Palomba, S.; Blaiotta, G.; Villani, F. Selection and use of phytate-degrading LAB to improve cereal-based products by mineral solubilization during dough fermentation. J. Food Sci. 2010, 75, 28–35. [Google Scholar] [CrossRef]
- Viscardi, S.; Ventorino, V.; Duran, P.; Maggio, A.; De Pascale, S.; Mora, M.L.; Pepe, O. Assessment of plant growth promoting activities and abiotic stress tolerance of Azotobacter chroococcum strains for a potential use in sustainable agriculture. J. Soil Sci. Plant Nutr. 2016, 16, 848–863. [Google Scholar] [CrossRef]
- Romano, I.; Ventorino, V.; Pepe, O. Effectiveness of plant beneficial microbes: Overview of the methodological approaches for the assessment of root colonization and persistence. Front. Plant Sci. 2020, 11, 6. [Google Scholar] [CrossRef] [PubMed]
- Rouphael, Y.; Carillo, P.; Colla, G.; Fiorentino, N.; Sabatino, L.; El-Nakhel, C.; Giordano, M.; Pannico, A.; Cirillo, V.; Shabani, E.; et al. Appraisal of combined applications of Trichoderma virens and a biopolymer-based biostimulant on lettuce agronomical, physiological and qualitative properties under variable n regimes. Agronomy 2020, 10, 196. [Google Scholar] [CrossRef]
- Pepe, O.; Ventorino, V.; Blaiotta, G. Dynamic of functional microbial groups during mesophilic composting of agro-industrial wastes and free-living (N2)-fixing bacteria application. Waste Manag. 2013, 33, 1616–1625. [Google Scholar] [CrossRef]
- Cirillo, V.; Van Oosten, M.J.; Izzo, M.; Maggio, A. Omeprazole treatment elicits contrasting responses to salt stress in two basil genotypes. Ann. Appl. Biol. 2019, 174, 329–338. [Google Scholar] [CrossRef]
- Claussen, W. Proline as a measure of stress in tomato plants. Plant Sci. 2005, 168, 241–248. [Google Scholar] [CrossRef]
- Teklić, T.; Parađiković, N.; Špoljarević, M.; Zeljković, S.; Lončarić, Z.; Lisjak, M. Linking abiotic stress, plant metabolites, biostimulants and functional food. Ann. Appl. Biol. 2020, 1–23. [Google Scholar] [CrossRef]
- Frioni, T.; Tombesi, S.; Quaglia, M.; Calderini, O.; Moretti, C.; Poni, S.; Gatti, M.; Moncalvo, A.; Sabbatini, P.; Berrìos, J.G.; et al. Metabolic and transcriptional changes associated with the use of Ascophyllum nodosum extracts as tools to improve the quality of wine grapes (Vitis vinifera cv. Sangiovese) and their tolerance to biotic stress. J. Sci. Food Agric. 2019, 99, 6350–6363. [Google Scholar] [CrossRef]
- Woo, S.L.; Pepe, O. Microbial consortia: Promising probiotics as plant biostimulants for sustainable agriculture. Front. Plant Sci. 2018, 9, 1801. [Google Scholar] [CrossRef]
- Naik, K.; Mishra, S.; Srichandan, H.; Singh, P.K.; Sarangi, P.K. Plant growth promoting microbes: Potential link to sustainable agriculture and environment. Biocatal. Agric. Biotechnol. 2019, 21, 101326. [Google Scholar] [CrossRef]
- De Vries, F.T.; Wallenstein, M.D. Below-ground connections underlying above-ground food production: A framework for optimising ecological connections in the rhizosphere. J. Ecol. 2017, 105, 913–920. [Google Scholar] [CrossRef]
- Wallenstein, M.D. Managing and manipulating the rhizosphere microbiome for plant health: A systems approach. Rhizosphere 2017, 3, 230–232. [Google Scholar] [CrossRef]
- Kong, W.; Meldgin, D.R.; Collins, J.J.; Lu, T. Designing microbial consortia with defined social interactions. Nat. Chem. Biol. 2018, 14, 821–829. [Google Scholar] [CrossRef] [PubMed]
- Ferguson, J.N. Climate change and abiotic stress mechanisms in plants. Emerg. Top. Life Sci. 2019, 3, 165–181. [Google Scholar] [PubMed]
- Bonaccorsi, E.D.; Ferreira, A.J.S.; Chambergo, F.S.; Ramos, A.S.P.; Mantovani, M.C.; Simon Farah, J.P.; Sorio, C.S.; Gombert, A.K.; Tonso, A.; El-Dorry, H. Transcriptional response of the obligatory aerobe Trichoderma reesei to hypoxia and transient anoxia: Implications for energy production and survival in the absence of oxygen. Biochemistry 2006, 45, 3912–3924. [Google Scholar] [CrossRef]
- Vinale, F.; Sivasithamparam, K.; Ghisalberti, E.L.; Woo, S.L.; Nigro, M.; Marra, R.; Lombardi, N.; Pascale, A.; Ruocco, M.; Lanzuise, S.; et al. Trichoderma secondary metabolites active on plants and fungal pathogens. Open Mycol. J. 2014, 8, 127–139. [Google Scholar] [CrossRef]
- Poveda, J. Trichoderma parareesei favors the tolerance of rapeseed (Brassica napus L.) to salinity and drought due to a chorismate mutase. Agronomy 2020, 10, 118. [Google Scholar] [CrossRef]
- Mastouri, F.; Björkman, T.; Harman, G.E. Seed treatment with Trichoderma harzianum alleviates biotic, abiotic and physiological stresses in germinating seeds and seedlings. Phytopathology 2010, 100, 1213–1221. [Google Scholar] [CrossRef]
- Yasmeen, R.; Siddiqui, Z.S. Physiological responses of crop plants against Trichoderma harzianum in saline environment. Acta Bot. Croat. 2017, 76, 154–162. [Google Scholar] [CrossRef]
- Ikram, M.; Ali, N.; Jan, G.; Iqbal, A.; Hamayun, M.; Jan, F.G.; Hussain, A.; Lee, I.J. Trichoderma reesei improved the nutrition status of wheat crop under salt stress. J. Plant Interact. 2019, 14, 590–602. [Google Scholar] [CrossRef]
- Sharma, P.; Nath Patel, A.; Kumar Saini, M.; Deep, S. Field demonstration of Trichoderma harzianum as a plant growth promoter in wheat (Triticum aestivum L.). J. Agric. Sci. 2012, 4, 65–73. [Google Scholar] [CrossRef]
- Kaur, G.; Asthir, B. Proline: A key player in plant abiotic stress tolerance. Biol. Plant. 2015, 59, 609–619. [Google Scholar] [CrossRef]
- Pál, M.; Tajti, J.; Szalai, G.; Peeva, V.; Végh, B.; Janda, T. Interaction of polyamines, abscisic acid and proline under osmotic stress in the leaves of wheat plants. Sci. Rep. 2018, 8, 12839. [Google Scholar] [CrossRef]
- Barbieri, G.; Vallone, S.; Orsini, F.; Paradiso, R.; De Pascale, S.; Negre-Zakharov, F.; Maggio, A. Stomatal density and metabolic determinants mediate salt stress adaptation and water use efficiency in basil (Ocimum basilicum L.). J. Plant Physiol. 2012, 169, 1737–1746. [Google Scholar] [CrossRef]
- Plunkett, M.H.; Knutson, C.M.; Barney, B.M. Key factors affecting ammonium production by an Azotobacter vinelandii strain deregulated for biological nitrogen fixation. Microb. Cell Fact. 2020, 19, 107. [Google Scholar] [CrossRef] [PubMed]
- Narula, N.; Lakshminarayana, K.; Tauro, P. Ammonia excretion by Azotobacter chroococcum. Biotechnol. Bioeng. 1981, 23, 467–470. [Google Scholar] [CrossRef]
- Nosrati, R.; Owlia, P.; Saderi, H.; Rasooli, I.; Malboobi, M.A. Phosphate solubilization characteristics of efficient nitrogen fixing soil Azotobacter strains. Iran. J. Microbiol. 2014, 6, 285–295. [Google Scholar]
- Das, H.K. Azotobacters as biofertilizer. In Advances in Applied Microbiology; Elsevier Inc.: Amsterdam, The Netherlands, 2019; Volume 108, pp. 1–43. ISBN 9780128176207. [Google Scholar]
- Cormier, F.; Foulkes, J.; Hirel, B.; Gouache, D.; Moënne-Loccoz, Y.; Le Gouis, J. Breeding for increased nitrogen-use efficiency: A review for wheat (T. aestivum L.). Plant Breed. 2016, 135, 255–278. [Google Scholar] [CrossRef]
- Salim, N.; Raza, A. Nutrient use efficiency (NUE) for sustainable wheat production: A review. J. Plant Nutr. 2020, 43, 297–315. [Google Scholar] [CrossRef]
- Gagneul, D.; Aïnouche, A.; Duhazé, C.; Lugan, R.; Larher, F.R.; Bouchereau, A. A reassessment of the function of the so-called compatible solutes in the halophytic plumbaginaceae Limonium latifolium. Plant Physiol. 2007, 144, 1598–1611. [Google Scholar] [CrossRef]
- Hayat, S.; Hayat, Q.; Alyemeni, M.N.; Wani, A.S.; Pichtel, J.; Ahmad, A. Role of proline under changing environments: A review. Plant Signal. Behav. 2012, 7, 1–11. [Google Scholar] [CrossRef] [PubMed]
- Maggio, A.; Miyazaki, S.; Veronese, P.; Fujita, T.; Ibeas, J.I.; Damsz, B.; Narasimhan, M.L.; Hasegawa, P.M.; Joly, R.J.; Bressan, R.A. Does proline accumulation play an active role in stress-induced growth reduction? Plant J. 2002, 31, 699–712. [Google Scholar] [CrossRef] [PubMed]
- Maggio, A.; Zhu, J.K.; Hasegawa, P.M.; Bressan, R.A. Osmogenetics: Aristotle to Arabidopsis. Plant Cell 2006, 18, 1542–1557. [Google Scholar] [CrossRef] [PubMed]
- Saia, S.; Rappa, V.; Ruisi, P.; Abenavoli, M.R.; Sunseri, F.; Giambalvo, D.; Frenda, A.S.; Martinelli, F. Soil inoculation with symbiotic microorganisms promotes plant growth and nutrient transporter genes expression in durum wheat. Front. Plant Sci. 2015, 6, 815. [Google Scholar] [CrossRef]
- Ahmad, F.; Ahmad, I.; Khan, M.S. Screening of free-living rhizospheric bacteria for their multiple plant growth promoting activities. Microbiol. Res. 2008, 163, 173–181. [Google Scholar] [CrossRef]


Publisher’s Note: MDPI stays neutral with regard to jurisdictional claims in published maps and institutional affiliations. |
© 2021 by the authors. Licensee MDPI, Basel, Switzerland. This article is an open access article distributed under the terms and conditions of the Creative Commons Attribution (CC BY) license (http://creativecommons.org/licenses/by/4.0/).
Share and Cite
Silletti, S.; Di Stasio, E.; Van Oosten, M.J.; Ventorino, V.; Pepe, O.; Napolitano, M.; Marra, R.; Woo, S.L.; Cirillo, V.; Maggio, A. Biostimulant Activity of Azotobacter chroococcum and Trichoderma harzianum in Durum Wheat under Water and Nitrogen Deficiency. Agronomy 2021, 11, 380. https://doi.org/10.3390/agronomy11020380
Silletti S, Di Stasio E, Van Oosten MJ, Ventorino V, Pepe O, Napolitano M, Marra R, Woo SL, Cirillo V, Maggio A. Biostimulant Activity of Azotobacter chroococcum and Trichoderma harzianum in Durum Wheat under Water and Nitrogen Deficiency. Agronomy. 2021; 11(2):380. https://doi.org/10.3390/agronomy11020380
Chicago/Turabian StyleSilletti, Silvia, Emilio Di Stasio, Michael James Van Oosten, Valeria Ventorino, Olimpia Pepe, Mauro Napolitano, Roberta Marra, Sheridan Lois Woo, Valerio Cirillo, and Albino Maggio. 2021. "Biostimulant Activity of Azotobacter chroococcum and Trichoderma harzianum in Durum Wheat under Water and Nitrogen Deficiency" Agronomy 11, no. 2: 380. https://doi.org/10.3390/agronomy11020380
APA StyleSilletti, S., Di Stasio, E., Van Oosten, M. J., Ventorino, V., Pepe, O., Napolitano, M., Marra, R., Woo, S. L., Cirillo, V., & Maggio, A. (2021). Biostimulant Activity of Azotobacter chroococcum and Trichoderma harzianum in Durum Wheat under Water and Nitrogen Deficiency. Agronomy, 11(2), 380. https://doi.org/10.3390/agronomy11020380