Article

Biochar Promotes Nitrogen Transformation and Tomato Yield by Regulating Nitrogen-Related Microorganisms in Tomato Cultivation Soil

1
College of Water Resources and Architectural Engineering, Northwest A&F University, Weihui Road 23, Yangling 712100, China
2
Department of Plant and Environmental Science, Faculty of Science, University of Copenhagen, Højbakkegaard Alle 13, DK-2630 Taastrup, Denmark
3
Key Laboratory of Agricultural Soil and Water Engineering in Arid and Semiarid Areas, Ministry of Education, Northwest A&F University, Yangling 712100, China
4
Department of Food and Science, Faculty of Science, University of Copenhagen, Rolighedsvej 26, DK-1958 Frederiksberg C, Denmark
5
Institute of Soil and Water Conservation, Northwest A&F University, Yangling 712100, China
6
Institute of Soil and Water Conservation, CAS &MWR, Yangling 712100, China
7
Research Unit of Mathematical Sciences, University of Oulu, FI-90014 Oulu, Finland
*
Author to whom correspondence should be addressed.
These two authors contributed equally.
Agronomy 2021, 11(2), 381; https://doi.org/10.3390/agronomy11020381
Submission received: 26 January 2021 / Revised: 17 February 2021 / Accepted: 18 February 2021 / Published: 20 February 2021

Abstract

:
Nitrogen (N) transformation in soil directly determines the effectiveness of N for plant growth. Biochar has received evermore attention because of its significant ability to improve soil. However, the effects of biochar on N-related microorganisms (Lycopersicon esculentum Mill.) in tomato cultivation soil, N transformation, utilisation of water and N fertiliser, and tomato yield remain unclear. The objective of this study was to investigate the responses of N-related microorganisms to biochar and N fertilisation in soil, along with the implications of biochar for altering N transformation, N uptake by tomatoes, and utilisation of water and N fertiliser. A two-year greenhouse experiment containing six biochar levels under drip irrigation (0, 10, 30, 50, 70, and 90 t ha−1) and two N fertiliser application rates (190 and 250 kg ha−1) was conducted in the northwest of China. The results showed that adding biochar significantly promoted urease activity, microbial biomass carbon (MBC), microbial biomass nitrogen (MBN), and the number of amoA-type nitrifiers in the soil. The MBC:N ratio and the number of nirS-type denitrifiers were significantly inhibited when the added amount of biochar was greater than or equal to 30 t ha−1. Moreover, biochar can increase the water content in the soil and can reduce the N lost to leaching. The inorganic N (NO3 and NH4+) in the soil could be better maintained in the rootzone and better absorbed by tomato plants when adding 30, 50, and 70 t ha−1 of biochar. The amount of N fertiliser could be reduced by 24% without a significant loss of tomato yield when the amount of biochar added was over 30 t ha−1. It was indicated that the yield of tomatoes and the net profits were quadratically related to the application rate of biochar. In the test area, 53 t ha−1 of biochar with 190 kg ha−1 of N and 44.6 t ha−1 of biochar with 190 kg ha−1 of N were calculated to be the best amounts from the perspectives of tomato yield and net profit, respectively. Thus, biochar promotes N transformation by regulating N-related microorganisms; hence, it increases the inorganic N in the roots of the plants, reduces N lost to leaching, and significantly promotes the N absorption of tomatoes. The results in this research are of great significance for the development of management strategies for tomato maintenance, environmental protection, and resource conservation.

1. Introduction

Nitrogen (N) is essential for increasing crop yield. However, excessive or inappropriate applications of N fertiliser may lead to the loss of N from a farmland system to an aquatic system, which not only causes water pollution but also depletes soil fertility and reduces crop yield [1]. Biochar has been widely used to improve soil quality [2]. The combination of biochar and N fertilisation may increase soil carbon (C) storage and N use efficiency [3], thereby reducing the environmental impacts of the fertiliser and increasing crop productivity. On the one hand, the interaction between biochar and soil changes N dynamics in different ecosystems [4]. Previous studies have reported that biochar can reduce the volatilisation of NH3 and the leaching of NO3, can increase the efficiency of N retention and utilisation, and can promote the absorption of N by crops [5,6,7]. It has also been pointed out that biochar can significantly change the composition of the microbial community, can directly or indirectly affect the metabolism of microorganisms, and can increase the biomass of soil microorganisms [8]. On the other hand, N-related microbial abundance and microbial biomass are closely associated with the transformation of N in soil [9].
The abundances of nitrifying and denitrifying bacteria affect N nitrification and denitrification [10]. As the most active component of soil organic N, microbial biomass N is very important for promoting the transformation of soil organic N to inorganic N [11]. Microbial biomass carbon is an important fraction in labile soil organic C pools, and it affects soil N transformation [12]. Moreover, enzyme activity is a critical indicator of soil health. In particular, the urease enzyme plays an important role in the process of hydrolysing the urea fertiliser into NH3 and CO2 [13]. However, the key roles of N-related microbial abundance, microbial biomass, and enzyme activity in the N cycle are still unclear. The effects of the combination of biochar amendments and N fertilisation on N-related microorganisms and the implications for altering N uptake and use efficiency for tomatoes are still unclear as well. Little relevant information has come to light in academia or in practice.
In this paper, it was hypothesised that the response of the N-related microorganisms in soil to biochar and N fertiliser promotes N transformation, and that the effect of biochar on soil water changes the distribution of soil inorganic N (NO3 and NH4+), which in turn should affect the N absorption of tomatoes, their utilisation of water and N fertiliser, and their yield.
The objectives of this study were (1) to explore the effects of biochar and N application on the urease activity, number of amoA-type nitrifiers and nirS-type denitrifiers, and microbial biomass in tomato cultivation soil; (2) to study the effects of biochar and N fertiliser application on soil N distribution and tomato plants’ N uptake; (3) to analyse the impacts of biochar application on N fertiliser productivity, water use efficiency, and tomato yield; (4) to propose appropriate biochar and N fertiliser application strategies for tomato production and net profit in the tested area.

2. Materials and Methods

2.1. Experimental Site and Materials

Two greenhouse experiments were conducted from 2 September 2017 to 10 February 2018 (autumn tomato) and from 6 April 2018 to 1 August 2018 (spring tomato), respectively, in Yangling City, Shaanxi Province, China (520 m altitude, 34°17′ N latitude and 108°02′ E longitude). The area has a semi-humid continental monsoon climate with an average annual temperature of approximately 16.1 °C. The average annual sunshine duration is 2165 h and the average annual frost-free period is more than 210 days. The greenhouse was 108 m in length and 8 m in width. Each plot was 6.5 m in length and 3.2 m in width.
The soil in the greenhouse was classified as a silty clay loam with a bulk density of 1.35 g cm−3. The soil had a field capacity of 27.98%, a pH of 7.35, and a soil porosity of 49.01%. The organic matter content was 16.48 g kg−1, total N was 0.96 g kg−1, total P was 0.87 g kg−1, and total K was 10.4 g kg−1.
The pyrolysis temperature of the biochar was 450 °C, and the feedstock was the trunks and branches of discarded fruit trees (Shaanxi Yixin Bioenergy Technology Development Co., Ltd., Yangling City, Shaanxi Province, China). The biochar had a specific surface area of 87.1 m2 g−1 and a pH of 10.51. The amount of carbon was 72.38%, total N was 0.98 g kg−1, NO3–N was 0.59 mg kg−1, and NH4+–N was 1.67 mg kg−1 (Table 1). The tomato variety was “Dorui Star” (Seedling Breeding Center of Yangling Demonstration Area, Yangling City, Shaanxi Province, China). Each treatment occupied a block in the greenhouse. One block was divided into three small plots, and 30 plants were transplanted in each small plot in double rows with a row distance of 40 cm and a plant spacing of 45 cm.
Drip irrigation pipes (Shaanxi Huawei Agricultural Science and Technology Development Co., Ltd., Yangling City, Shaanxi Province, China) were laid on the ground, and the length was the same as the ridge length (5.5 m).

2.2. Experimental Setup

Similarly to the experimental setup of [14,15], our experiment consisted of six biochar doses (C0, 0 t ha−1; C10, 10 t ha−1; C30, 30 t ha−1; C50, 50 t ha−1; C70, 70 t ha−1; C90, 90 t ha−1) and two N fertilisation rates (N1, 190 kg ha−1; N2, 250 kg ha−1), resulting in a total of 12 treatments (Table 2). N2 (250 kg ha−1) is the normal amount of N fertiliser applied by the local farmers in the experimental area. Every treatment had five replicates. The N, P, and K fertilisers were urea (N = 46% by weight), biological phosphorus (16% P2O5 by weight), and potassium sulphate (K2O = 51% by weight), respectively. In total, 150 kg P2O5 ha−1 and 200 kg K2O ha−1 were applied as basal fertilisers. In the first year of the experiment, the biochar (passed through a 4 mm sieve) was applied to the 0–30 cm soil layer by ploughing with a rotary tiller; then, N fertiliser and basal fertilisers were applied. In the second year, only N and basal fertilisers were applied.

2.3. Measurements

2.3.1. Soil Water Content and Water Use Efficiency

During the tomato plants’ growth period, we measured the soil water content in the 0–40 cm soil layer every 10 days. The soil content was determined by the drilling and drying method (drying at 105 °C for 8 h). The tomato’s water consumption (ET) was calculated according to the water balance equation as:
ET = P + I + U − R − D − △W
where P is the effective rainfall (mm), I is the irrigation volume (mm), U is the groundwater recharge (mm), R is the runoff (mm), D is the deep leakage (mm), and ΔW is the water change from the beginning to the end of the experiment in the 0–70 cm soil layer (mm). As there was no rainfall in the greenhouse, P = 0. For drip irrigation, the amount of water per irrigation was small, so R and D could be ignored. The groundwater level was below 50 m, so U could also be ignored. The above formula could then be simplified to:
ET = I − △W
Thus, the formula for tomato water use efficiency is as follows:
WUE = Y/ET
where WUE means water use efficiency (kg/m3), Y means tomato yield (kg/ha2), and ET means water consumption (mm) during the growth period.

2.3.2. Tomato Yield and Total N Uptake (TN) of Tomato Plants

During the tomato maturity period, 15 tomato plants were selected in each plot, and the first four layers of the fruit were measured sequentially. The total yield of each plant was the cumulative fresh weight of the fruit harvested from the first four trusses. The over-dried root, stem, leaf, and fruit samples were ground and passed through a 0.5 mm sieve, then digested with H2SO4–H2O2 for N content analysis using an automated continuous-flow analyser (AA3, Seal, Norderstedt, Germany). The total N uptake of the tomato plants was calculated via the dry weight of each organ.

2.3.3. NO3 and NH4+ of the Soil

A fresh soil sample was taken from each plot at 20 cm intervals over the 0–100 cm soil depth, and 5 g of air-dried soil sample was obtained by passing through a 2 mm sieve. The samples were extracted using 50 mL of potassium chloride solution (2 M) and shaken for 0.5 h. After the filtration, the concentrations of NO3 and NH4+ were analysed with a continuous flow analyser (0.001 AUFS; Auto Analyzer 3 AA3, Germany).

2.3.4. Soil Enzyme Activity and the Quantification of Nitrifying and Denitrifying Bacteria

Soil samples were collected at a depth of 0–20 cm in the tomato maturation stage for soil enzymatic activity and soil microbial abundance measurements [16]. Each treatment had three replicates. Five grams of soil, 10 mL of 10% (w/v) urea solution, and 20 mL of citrate buffer (pH 6.7) were added to a 50 mL flask and incubated at 37 °C for 24 h. After filtration, an aliquot of 3 mL of the filtrate was added to a 50 mL flask, and then 3 mL of sodium hypochlorite and 4 mL of sodium phenolate were added. The colour developed at room temperature was determined by spectrophotometry at 578 nm [17].
The numbers of nitrifying and denitrifying bacteria were determined using most probable number polymerase chain reaction (MPN-PCR). MPN-PCR is an efficient method for the estimation of microorganisms that contain a serial dilution of the extracted DNA, and replicate PCRs for each point in the dilution series [18]. It has recently been used for the quantitative detection of microorganisms in soil [19,20]. The MPN technique is essentially a procedure for obtaining the final estimates. For the PCR part, in this study, the nirS gene was used as a marker to indicate the presence of denitrifying bacteria, and the PCRs for the amplification of nirS gene fragments from denitrifying bacteria were performed with primers 832F (TCACACCCCGAGCCGCGCGT) and 1606R (AGKCGTTGAACTTKCCGGTCGG). The amoA gene was used as a marker to indicate the presence of nitrifying bacteria, and the PCRs for the amplification of amoA gene fragments from nitrifying bacteria were performed with primers amoA-1F (GGGGTTTCTACTGGTGGT) and amoA-2R (CCCCTCKGSAAAGCCTTCTTC) [18].

2.3.5. Microbial Biomass Analysis

The microbial biomass carbon and nitrogen (MBC and MBN) contents were determined using the fumigation–extraction method [21]. MBC and MBN were calculated by dividing the differences in C and N contents between the fumigated and unfumigated soil samples by the coefficients KC = 0.38 and KN = 0.54, respectively. The MBC values were divided by MBN to obtain the ratios of the microbial biomass (MBC:N).

2.3.6. Partial-Factor Productivity of N and Cost–Benefit Analysis

The partial-factor productivity (PFP) of applied N (kg kg−1) [16] was calculated as follows:
PFP = Y/NF
where Y is the tomato yield (kg ha−1) of the treatments and NF is the amount of N fertiliser used (kg ha−1).
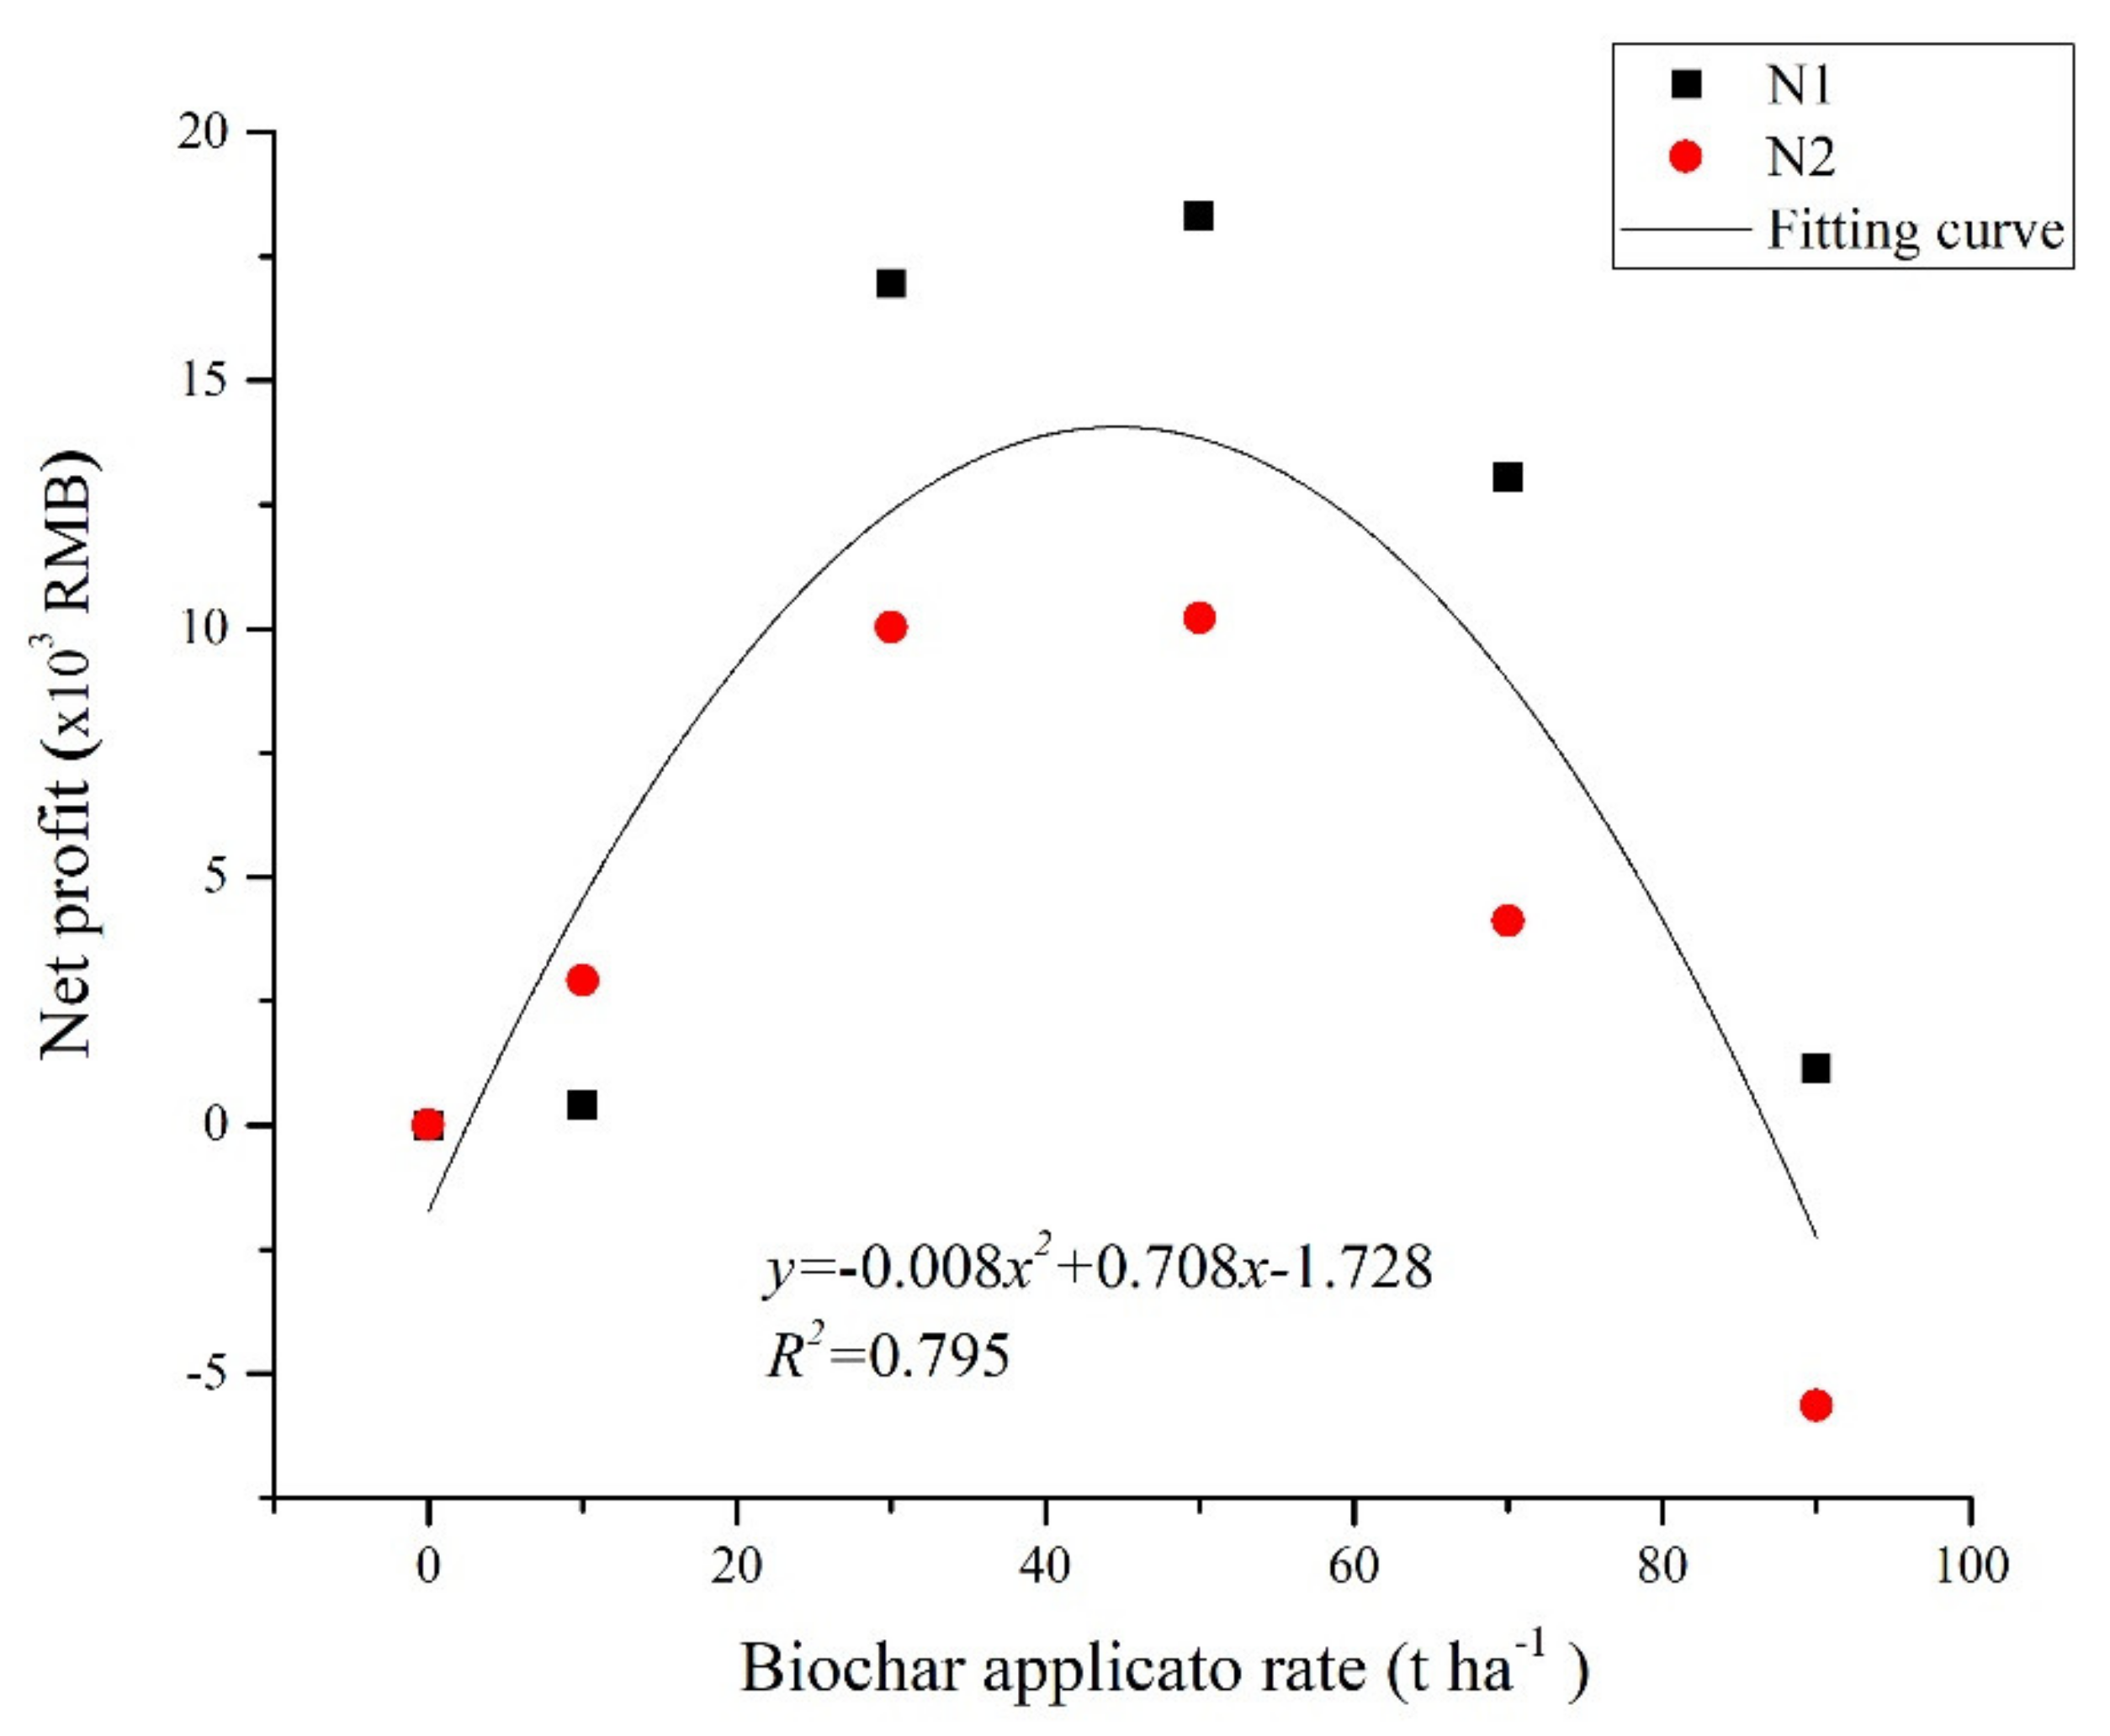
For fitting the nonlinear regression model of cost–benefit, the input costs include variable costs, such as biochar (2 yuan kg−1) and N fertilisers (1.7 yuan kg−1), and also fixed costs, such as pesticides, piping systems, seedlings, and water. The income comes from tomato sales (5.6 yuan kg−1). The net profit is the relative net profit compared to the profit of a non-biochar treatment. The cost–benefit details for different biochar and N treatments in a single greenhouse can be found in Table 3.

2.4. Statistical Analysis

Statistical analysis was performed using SPSS version 23.0 software (SPSS Inc., Chicago, IL, USA). The significant difference in the parameters among the treatments was tested by two-way analysis of variance (ANOVA) and the means were compared using Duncan’s multiple range test at the 0.05 probability level. All graphs were prepared using Origin 2016 software (OriginLab, Northampton, Mass., USA). The principal component analysis (PCA) of all parameters in this experiment was conducted with MATLAB R2018a software (The MathWorks, Inc., Natick, MA, USA).

3. Results

3.1. Soil Water Content

The soil water content (0–40 cm) of the treatments in the two-season test is shown in Figure 1. Obviously, the biochar treatments had comparatively higher soil water contents compared with the non-biochar controls when ignoring the N fertiliser. The addition of biochar can increase the water retention rate of the soil. The average soil water contents of the two seasons under the C10, C30, C50, C70, and C90 treatments were 6.09%, 12.56%, 15.73%, 12.40%, and 7.34%, respectively—all higher than the water content of the non-biochar control.

3.2. Soil Enzyme Activity and Abundance of Nitrifying and Denitrifying Bacteria

The soil urease activity and microbial abundance under different treatments are shown in Table 4. Basically, when the amount of biochar was greater than or equal to 30 t ha–1, the soil urease activity was significantly increased compared with the non-biochar control over the two seasons. As the added amount of biochar increased, the soil urease activity increased first and then decreased. The average amount of urease activity in the soil across the two seasons under the C30, C50, C70, and C90 treatments was 23.1%, 29.9%, 25.1%, and 13.9%, respectively—greater activity than for the non-biochar control. In the C50 and C70 treatments, no significant differences in urease activity were found between the N1 and N2 treatments.
Soil nitrifier and denitrifier microbes are the main driving factors in soil nitrification and denitrification. Our results showed that biochar significantly increased the number of amoA-type nitrifiers and significantly decreased the number of nirS-type denitrifiers when the amount of biochar was greater than or equal to 30 t ha−1. Under the C30, C50, C70, and C90 treatments, the average number of amoA-type nitrifiers increased by 58.0%, 106.7%, 84.0%, and 48.8%, whereas the average number of nirS-type denitrifiers decreased by 28.3%, 50.9%, 39.0%, and 24.9%, respectively, compared with the non-biochar control. For the C70 treatment, the number of amoA-type nitrifiers was not significantly different between the N1 and N2 treatments over the two seasons. For the C50 and C70 treatments, the number of nirS-type denitrifiers was not significantly different between the N1 and N2 treatments in spring.

3.3. Soil Microbial Biomass

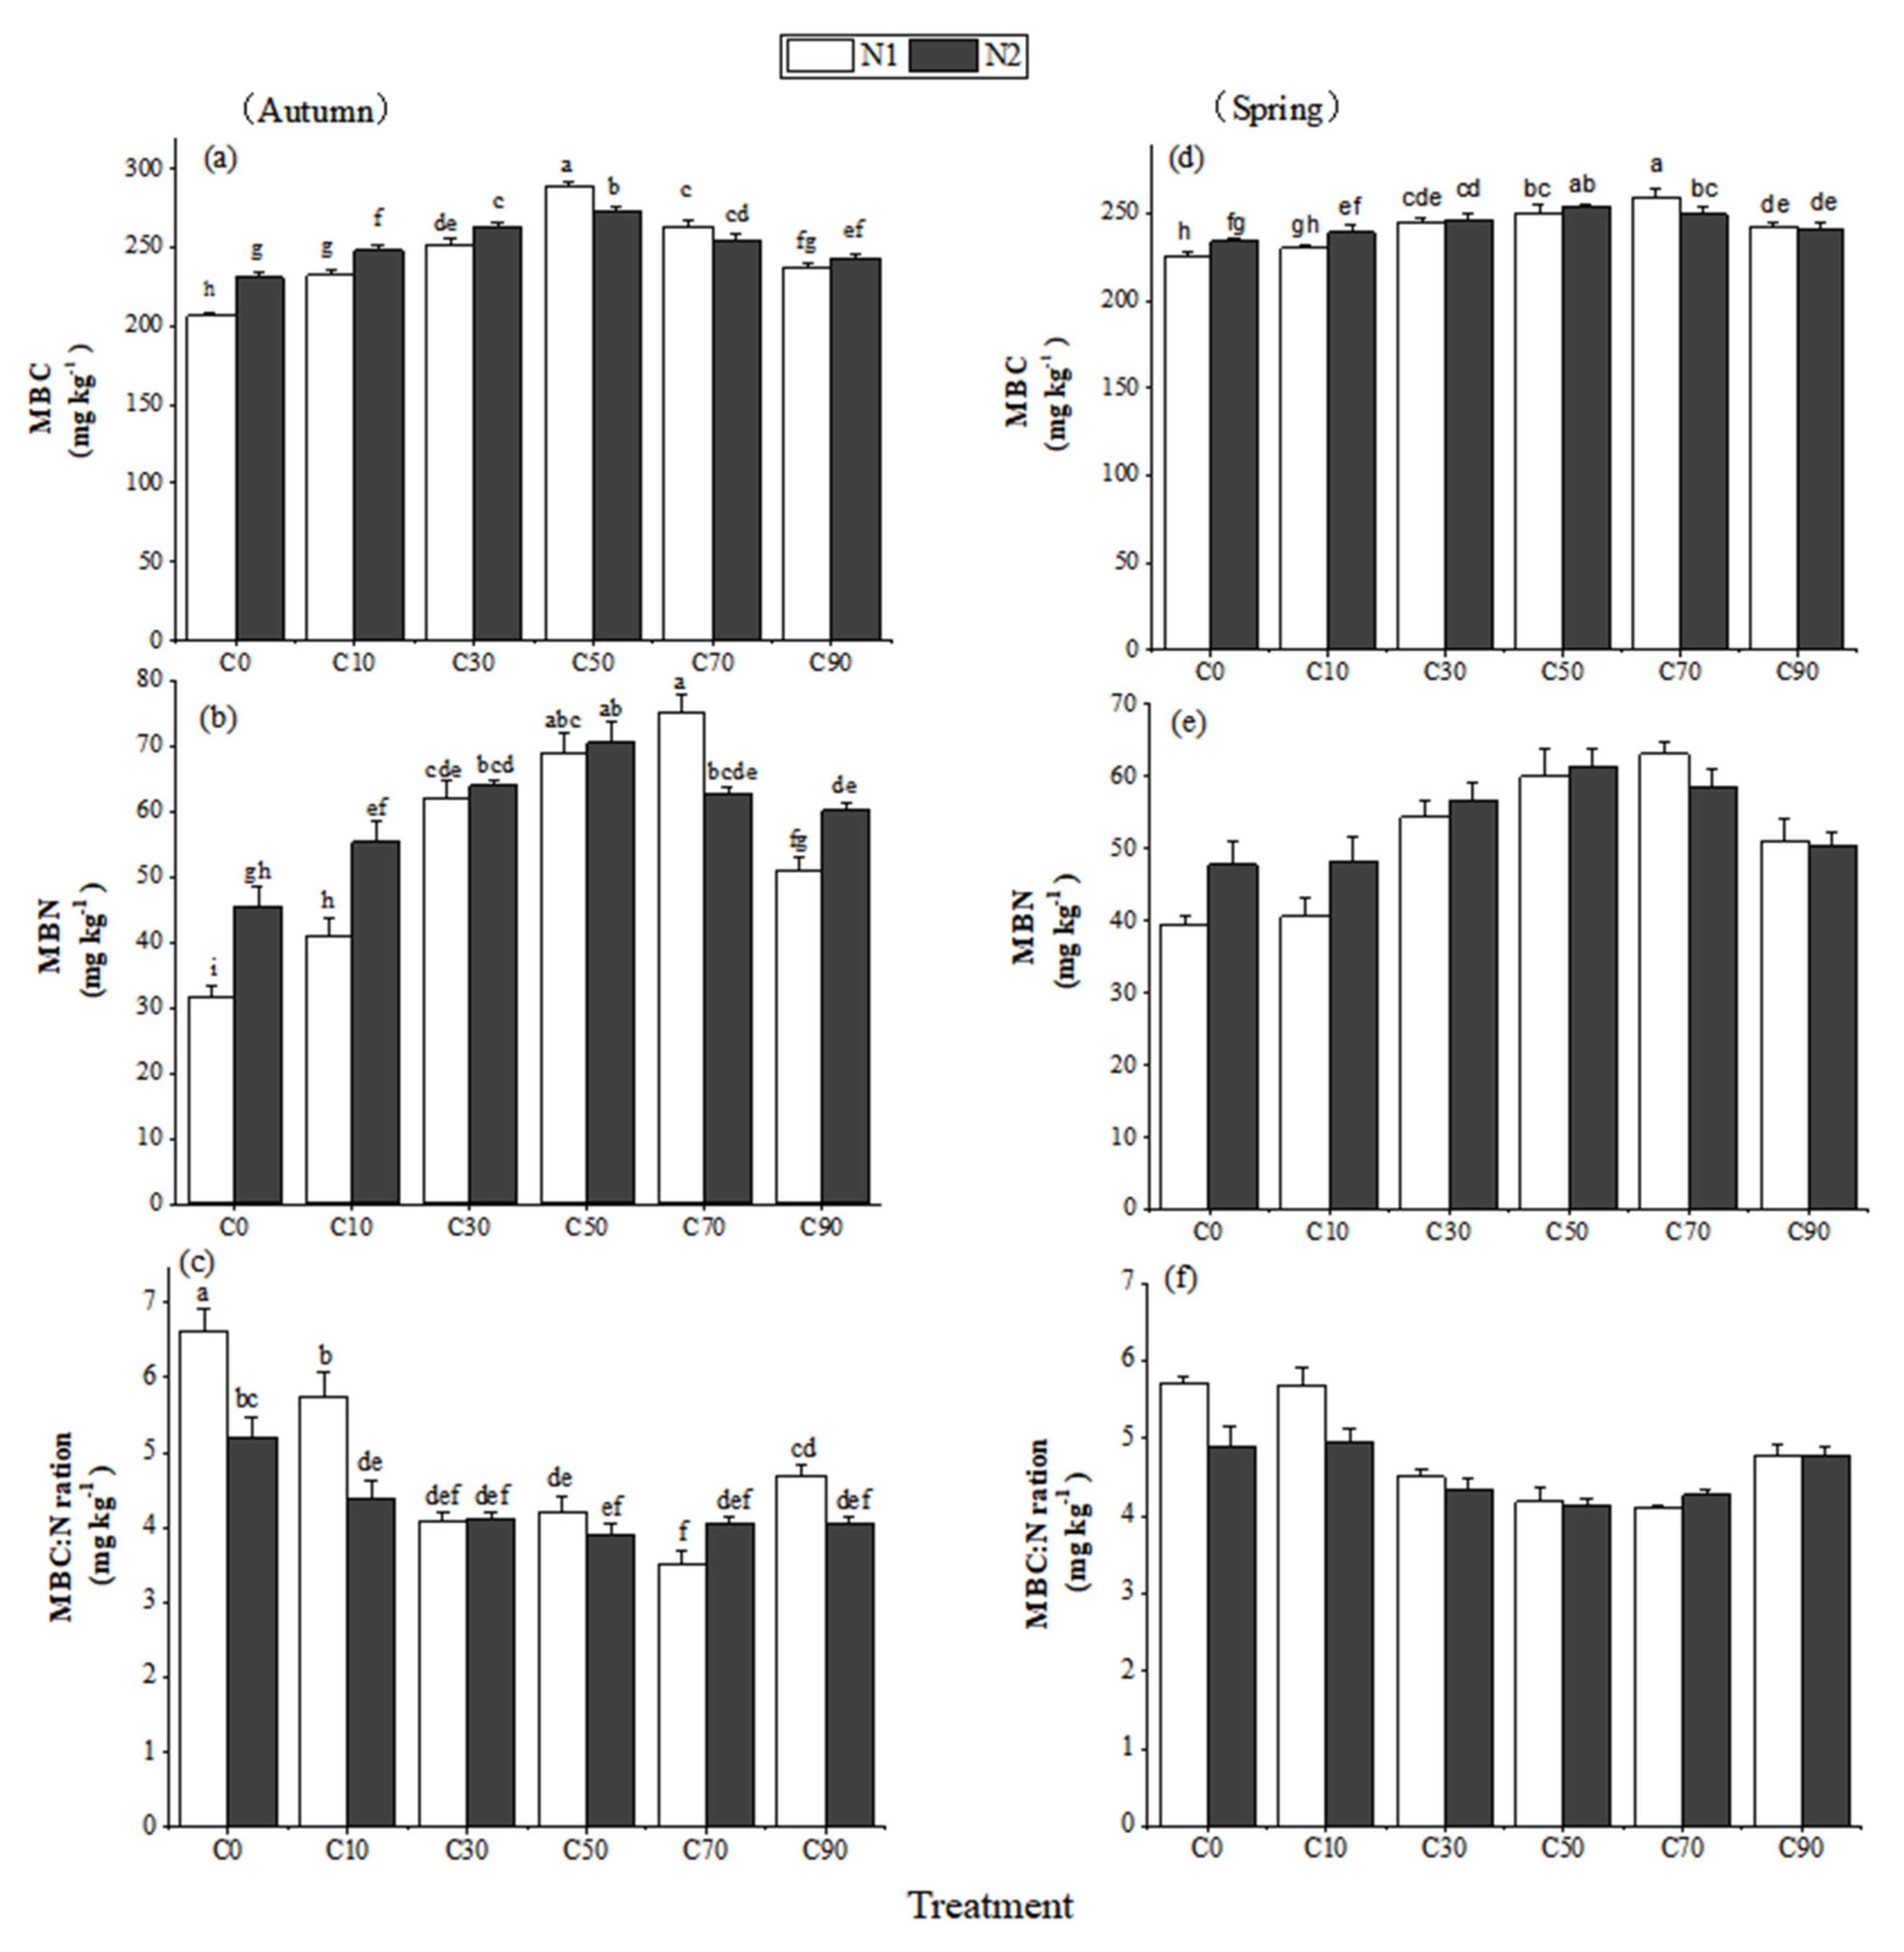
MBC, MBN, and MBC:N were significantly affected by N, C, and N×C in autumn. MBC, MBN, and MBC:N were significantly affected by C, and MBC was also significantly affected by N×C (Figure 2 and Table 5). Biochar had significant effects on the MBC, MBN, and MBC:N of the soil in the autumn. When the added amount of biochar was greater than or equal to 30 t ha−1, it had significant effects on MBC, MBN, and MBC:N in the spring.
The average MBC values of the two seasons under the C30, C50, C70, and C90 treatments were 11.9%, 18.8%, 14.3%, and 7.2%, respectively—higher values than for the non-biochar control. The average MBN values under the C30, C50, C70, and C90 treatments were 53.0%, 68.4%, 69.1%, and 36.1%, respectively—higher values than for the non-biochar control. The average MBC:N under C30, C50, C70, and C90 treatments were 25.8%, 28.7%, 30.2%, and 20.8%, respectively—lower values than for the non-biochar control.
In autumn, there was no significant difference in MBC between N1 and N2 under the C70 and C90 treatments, but the MBC of N1 was significantly greater than N2 in the C50 treatment. For MBN, there was no significant difference between N1 and N2 under the C30 and C50 treatments, but the MBN of N1 was significantly greater than N2 in the C70 treatment. In spring, MBC and MBN in the C30, C50, and C90 treatments were not significantly different between N1 and N2; the MBC and MBN of N1 were significantly larger than N2 in the C70 treatment. When the amount of biochar was greater than or equal to 30 t ha−1, there was no significant difference in the MBC:N between the N1 and N2 treatments.

3.4. Distributions of NO3 and NH4+ at Different Soil Depths

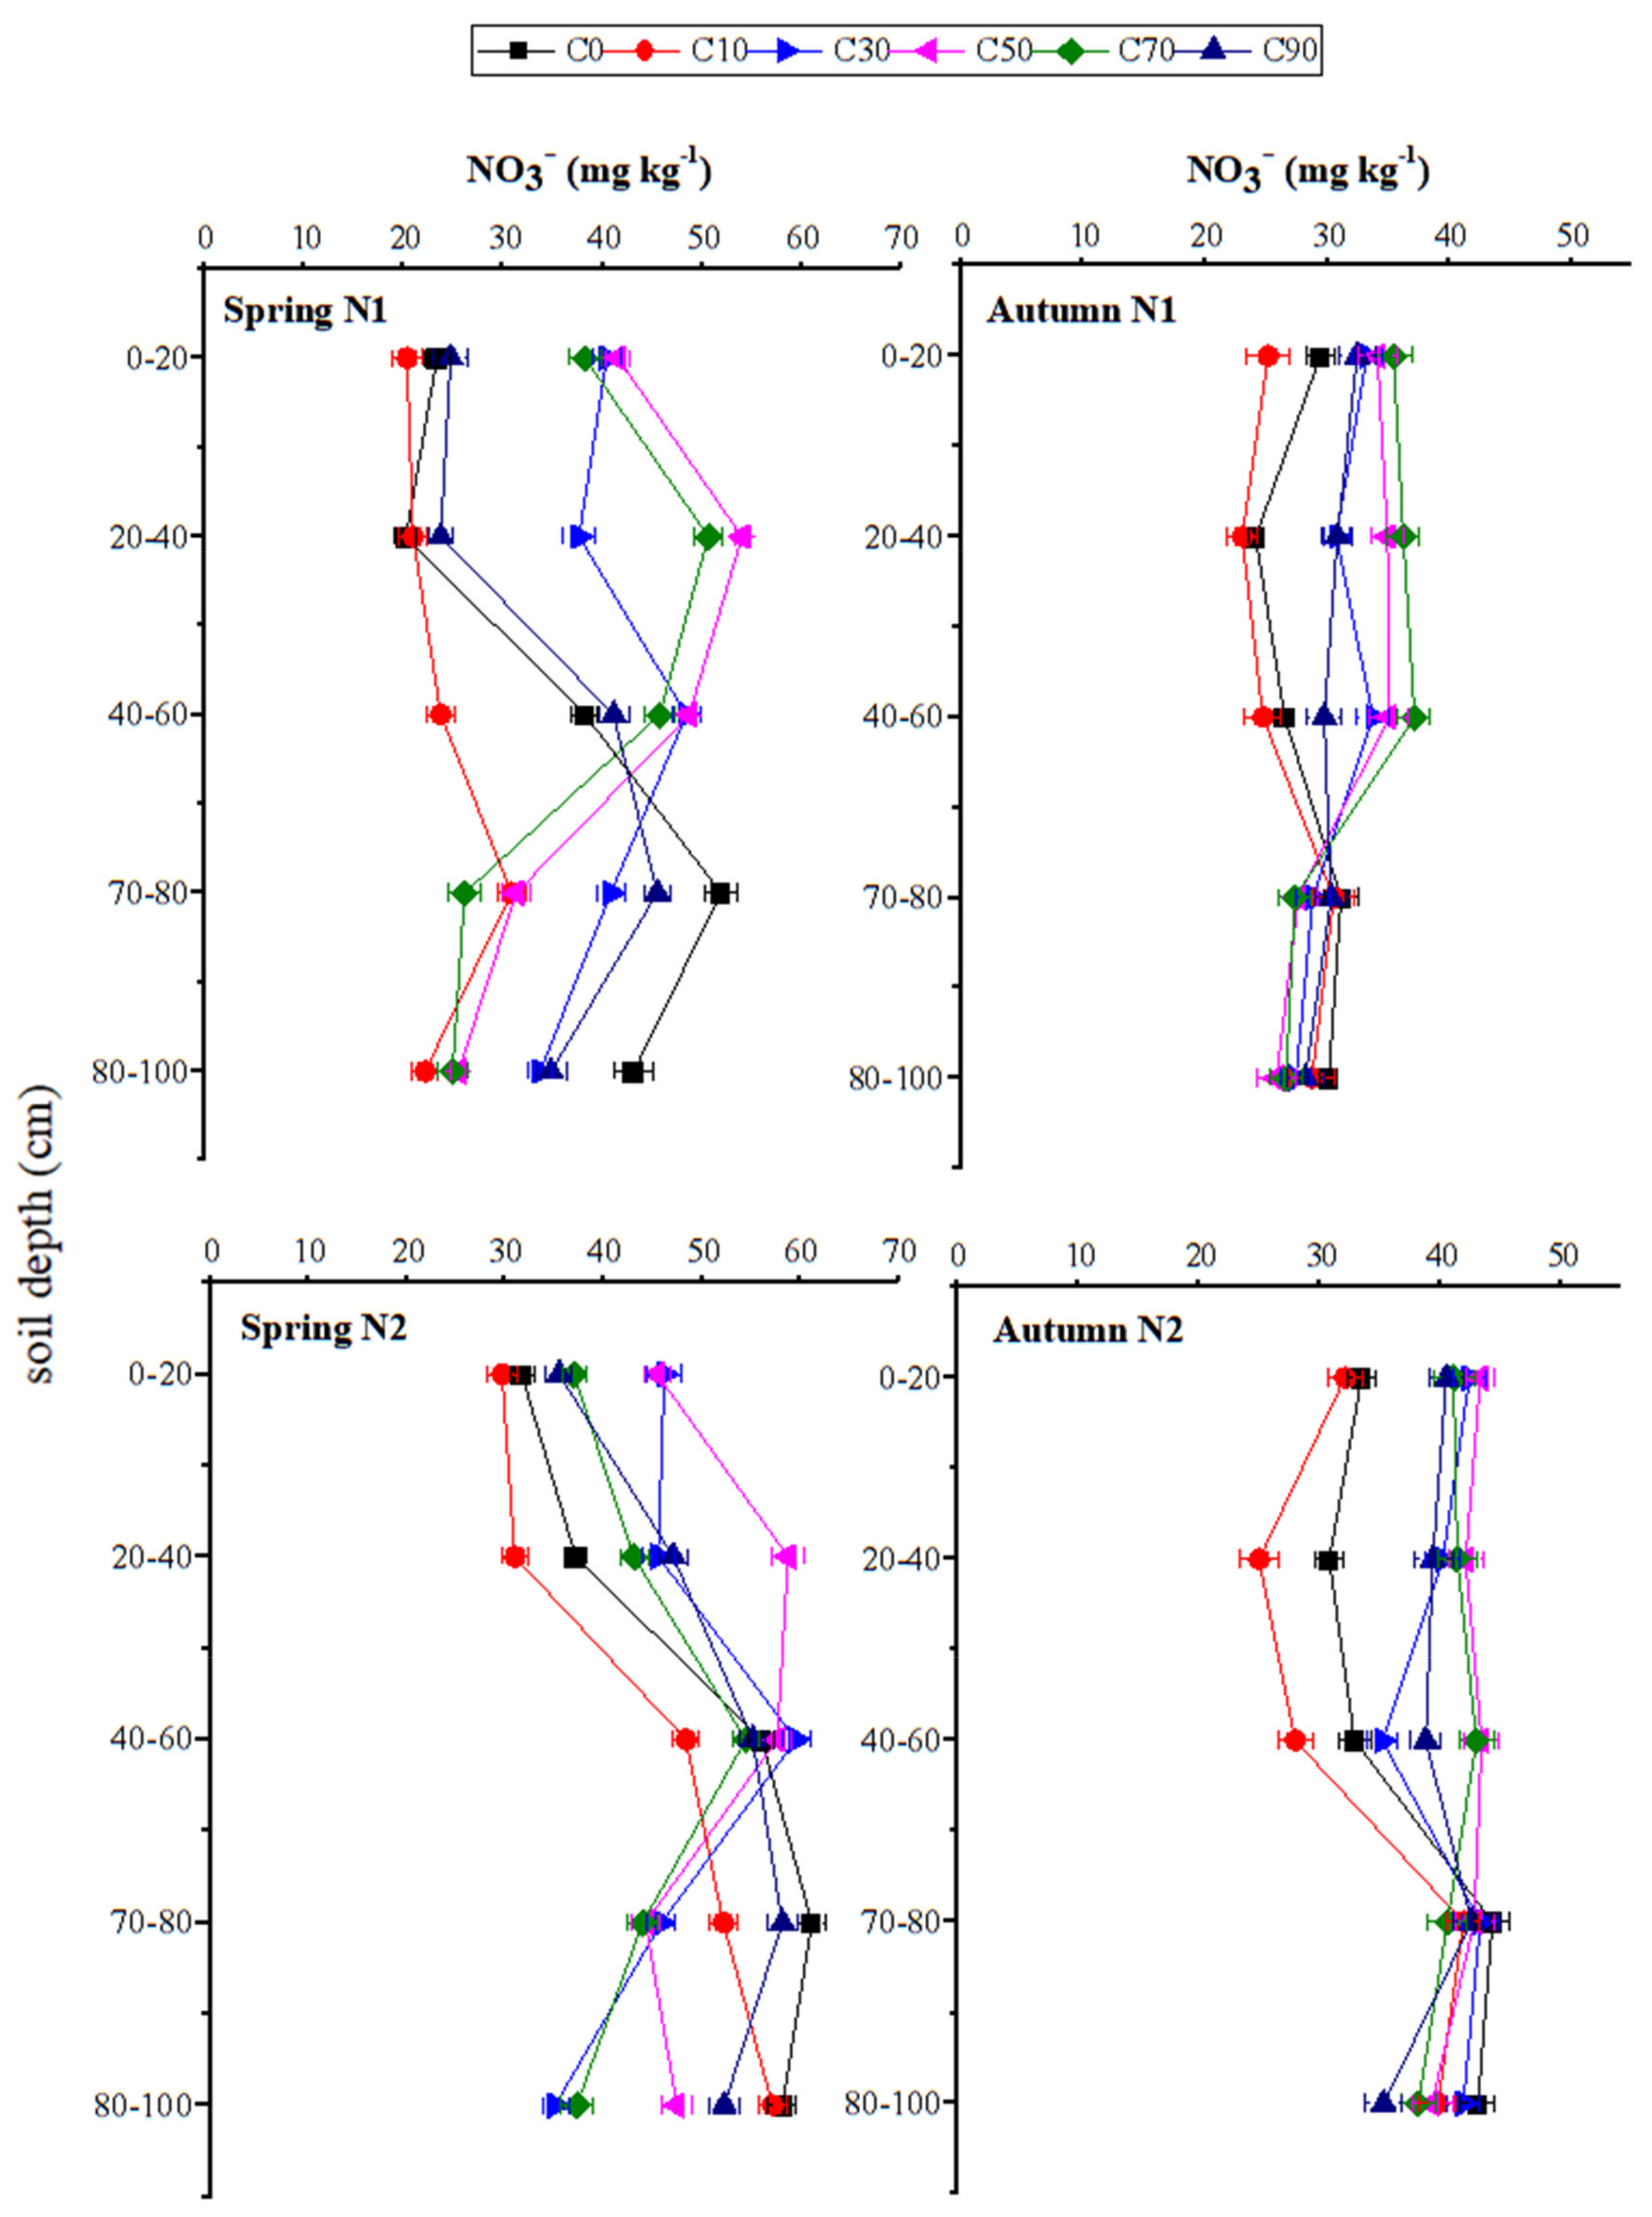
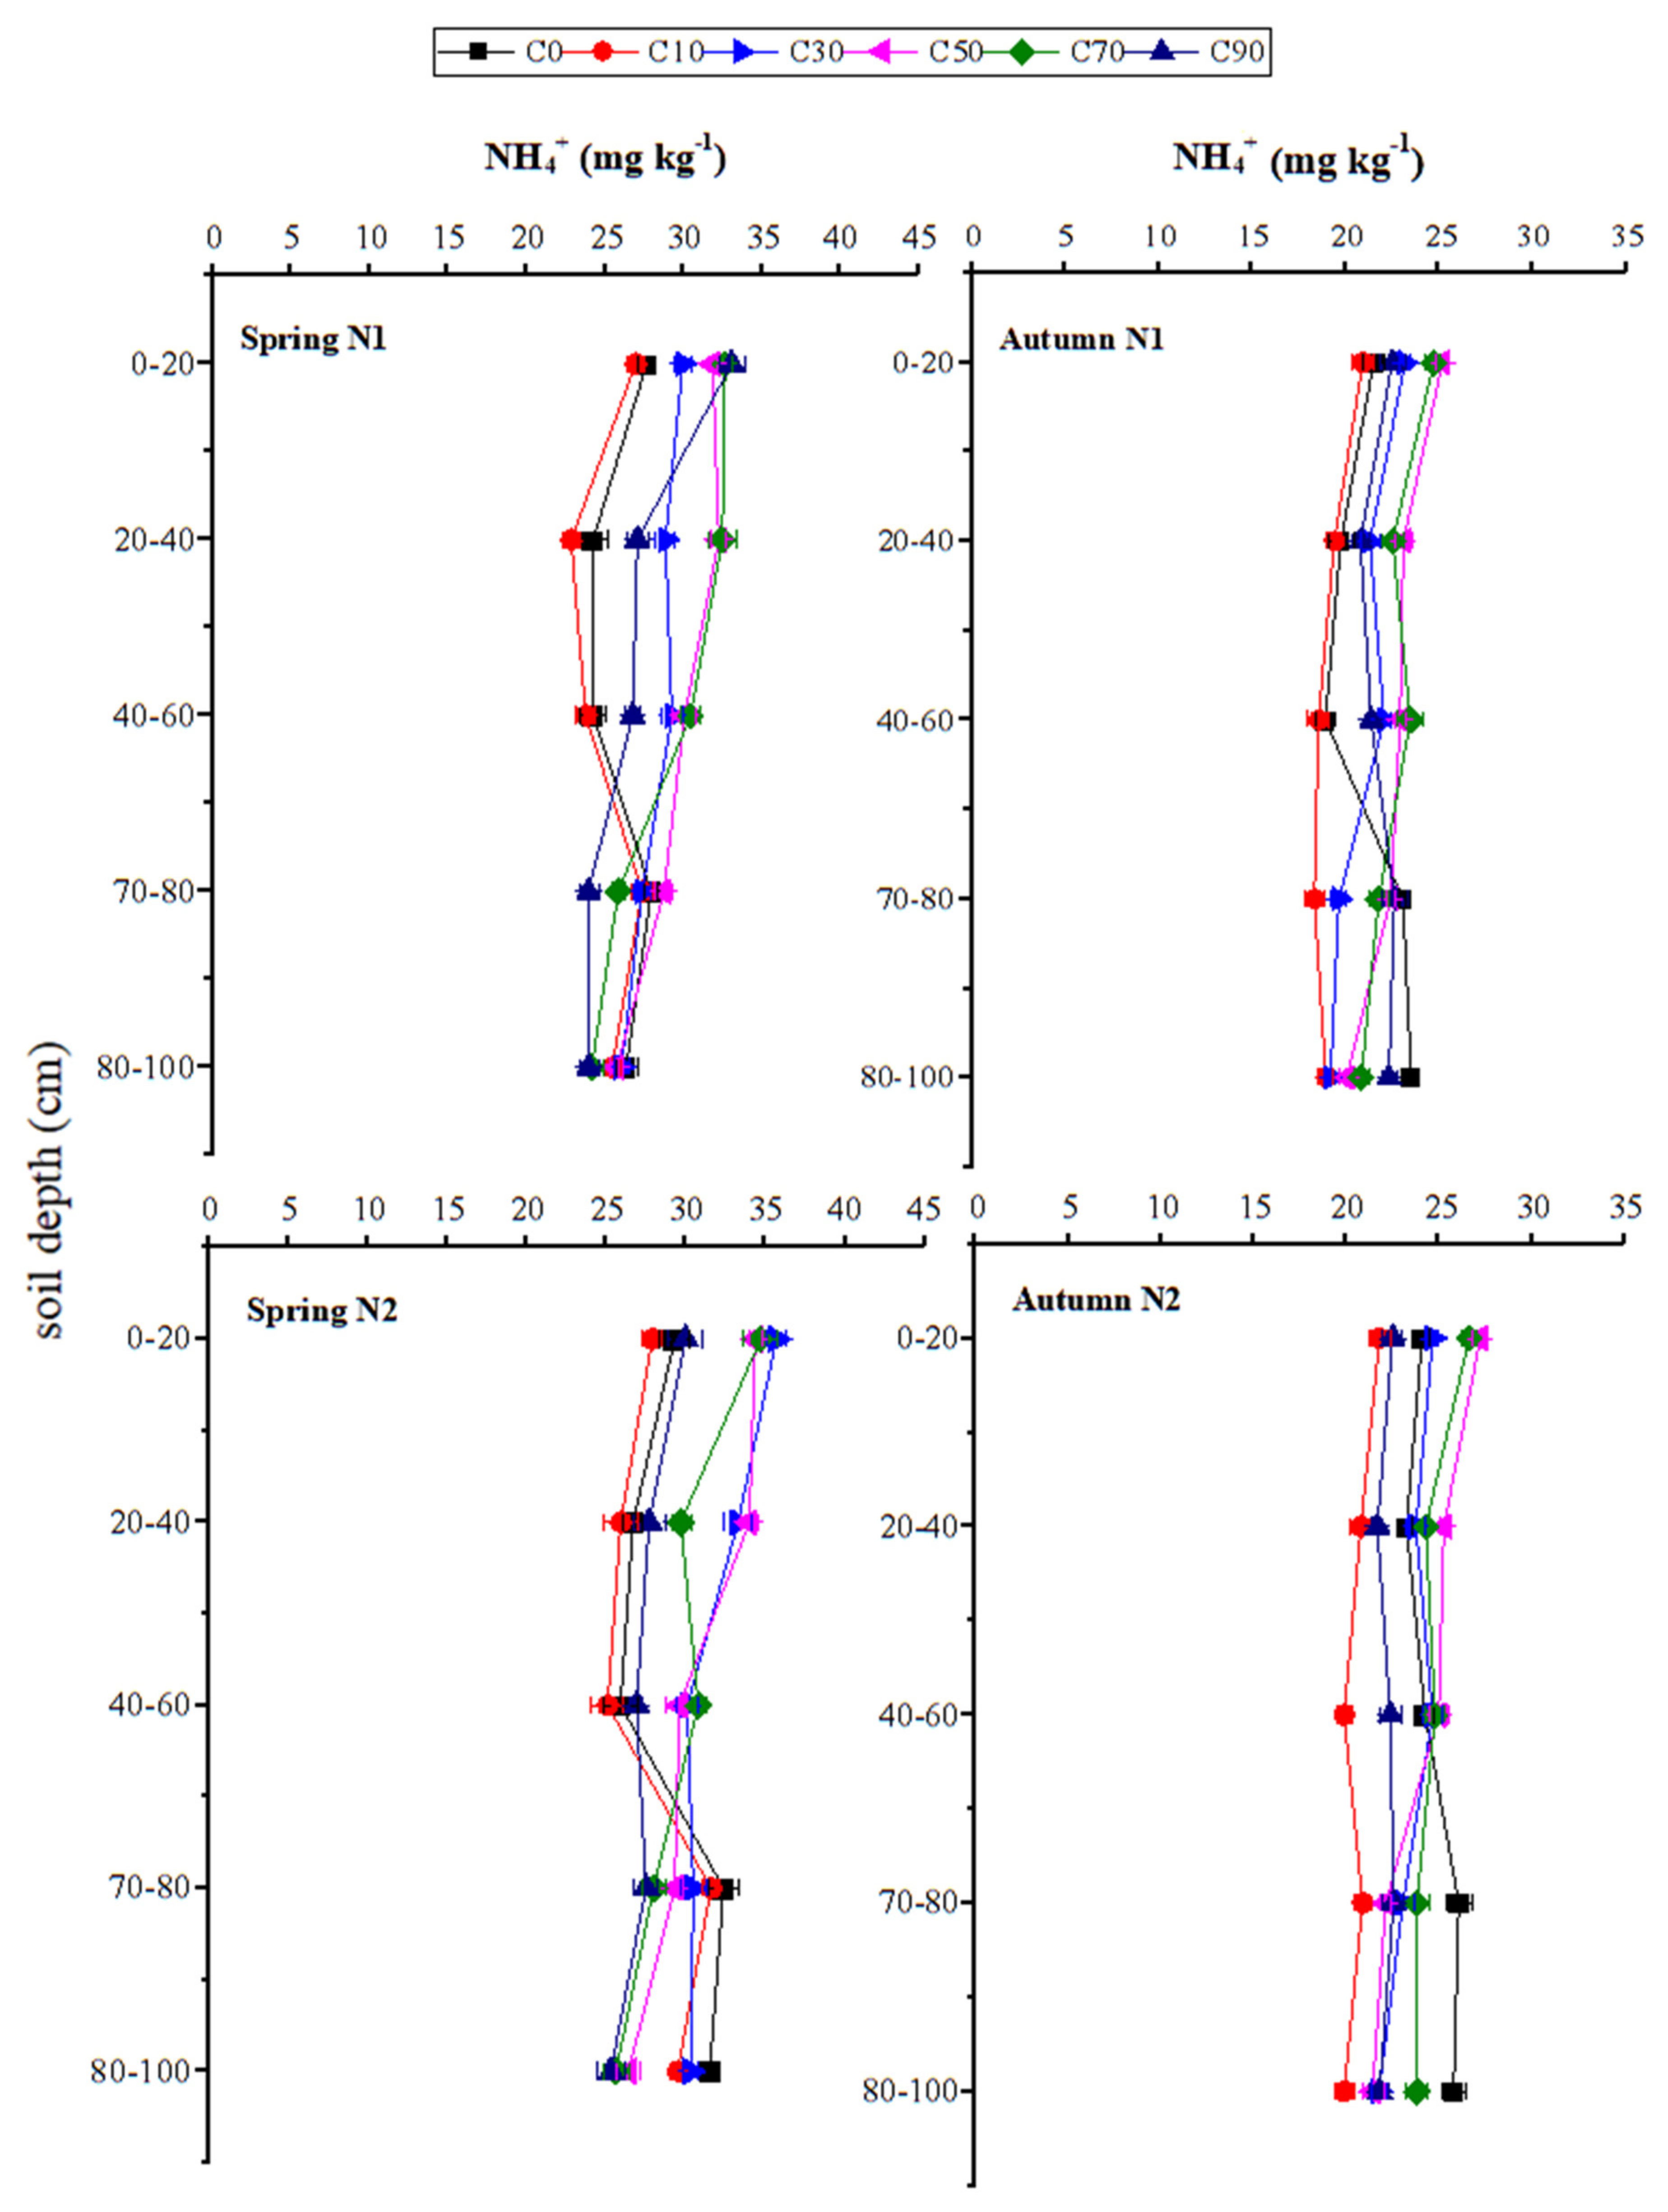
The distributions of NO3 and NH4+ at different soil depths under different treatments are shown in Figure 3 and Figure 4. In the two seasons, the average NO3 values of the 0–60 cm soil layer under the C30, C50, C70, and C90 treatments increased by 29.6%, 40.9%, 35.1%, and 14.4%, respectively, compared with the non-biochar control. The average NH4+ values of the 0–60 cm soil layer under the C30, C50, C70, and C90 treatments increased by 12.3%, 17.4%, 17.1%, and 4.4%, respectively, compared with the non-biochar control. The inorganic N (NO3 and NH4+) in the soil could be better maintained in the rootzone (0–60 cm) when adding 30, 50, or 70 t ha−1 biochar. Over the two seasons, in the biochar treatments, the NO3 and NH4+ contents in the 70–100 cm soil layer generally showed a downward trend, and they were lower than that of the non-biochar control.

3.5. Total N Uptake of Tomato Plants

The effects of the different treatments on the N uptake in each organ of the tomato plants are shown in Figure 5. TN was significantly affected by N, C, and N×C (Table 5). When the added amount of biochar was greater than or equal to 30 t ha−1, the TN of plants was significantly increased. Over the two seasons, the average TN values under the C30, C50, and C70 treatments were 50.8%, 75.7%, and 60.0%, respectively—greater than the TN of the non-biochar control. In autumn, under the C50 and C70 treatments, there was no significant difference in the TN between the N1 and N2 treatments. In spring, under the C50 treatments, there was no significant difference in the TN between the N1 and N2 treatments. Under the C70 treatment, the TN in N1 was significantly greater than that in N2.

3.6. Tomato Yield and Utilisation of Water and N Fertiliser

The tomato yield, WUE, and PFP under different treatments are shown in Table 6. The tomato yield, WUE, and PFP were significantly affected by N, C, and N×C. When the amount of biochar was greater than or equal to 30 t ha−1, the tomato yield was significantly enhanced. The tomato yield first increased and then decreased with the increase of the biochar added, and it reached a maximum for the C50 treatment. In the two seasons, the average PFP values under the C30, C50, C70, and C90 treatments were 36.22%, 43.46%, 37.63%, and 21.20%, respectively, all of which were greater than that of the non-biochar control. In the C30, C50, and C70 treatments, the reduced N fertilisation rate (N1) had no significant negative effect on the tomato yield compared to the N2 treatment. Compared to N2 treatments, N1 significantly increased the PFP. When the amount of biochar was greater than or equal to 30 t ha−1, the PFP of the N1 treatment was significantly greater than for the N2 treatment. The average WUE increased by 37.16%, 45.33%, 38.77%, and 23.62% under the C30, C50, C70, and C90 treatments, respectively, compared with the non-biochar control.

3.7. Relatively Suitable Combination of N Fertiliser and Biochar

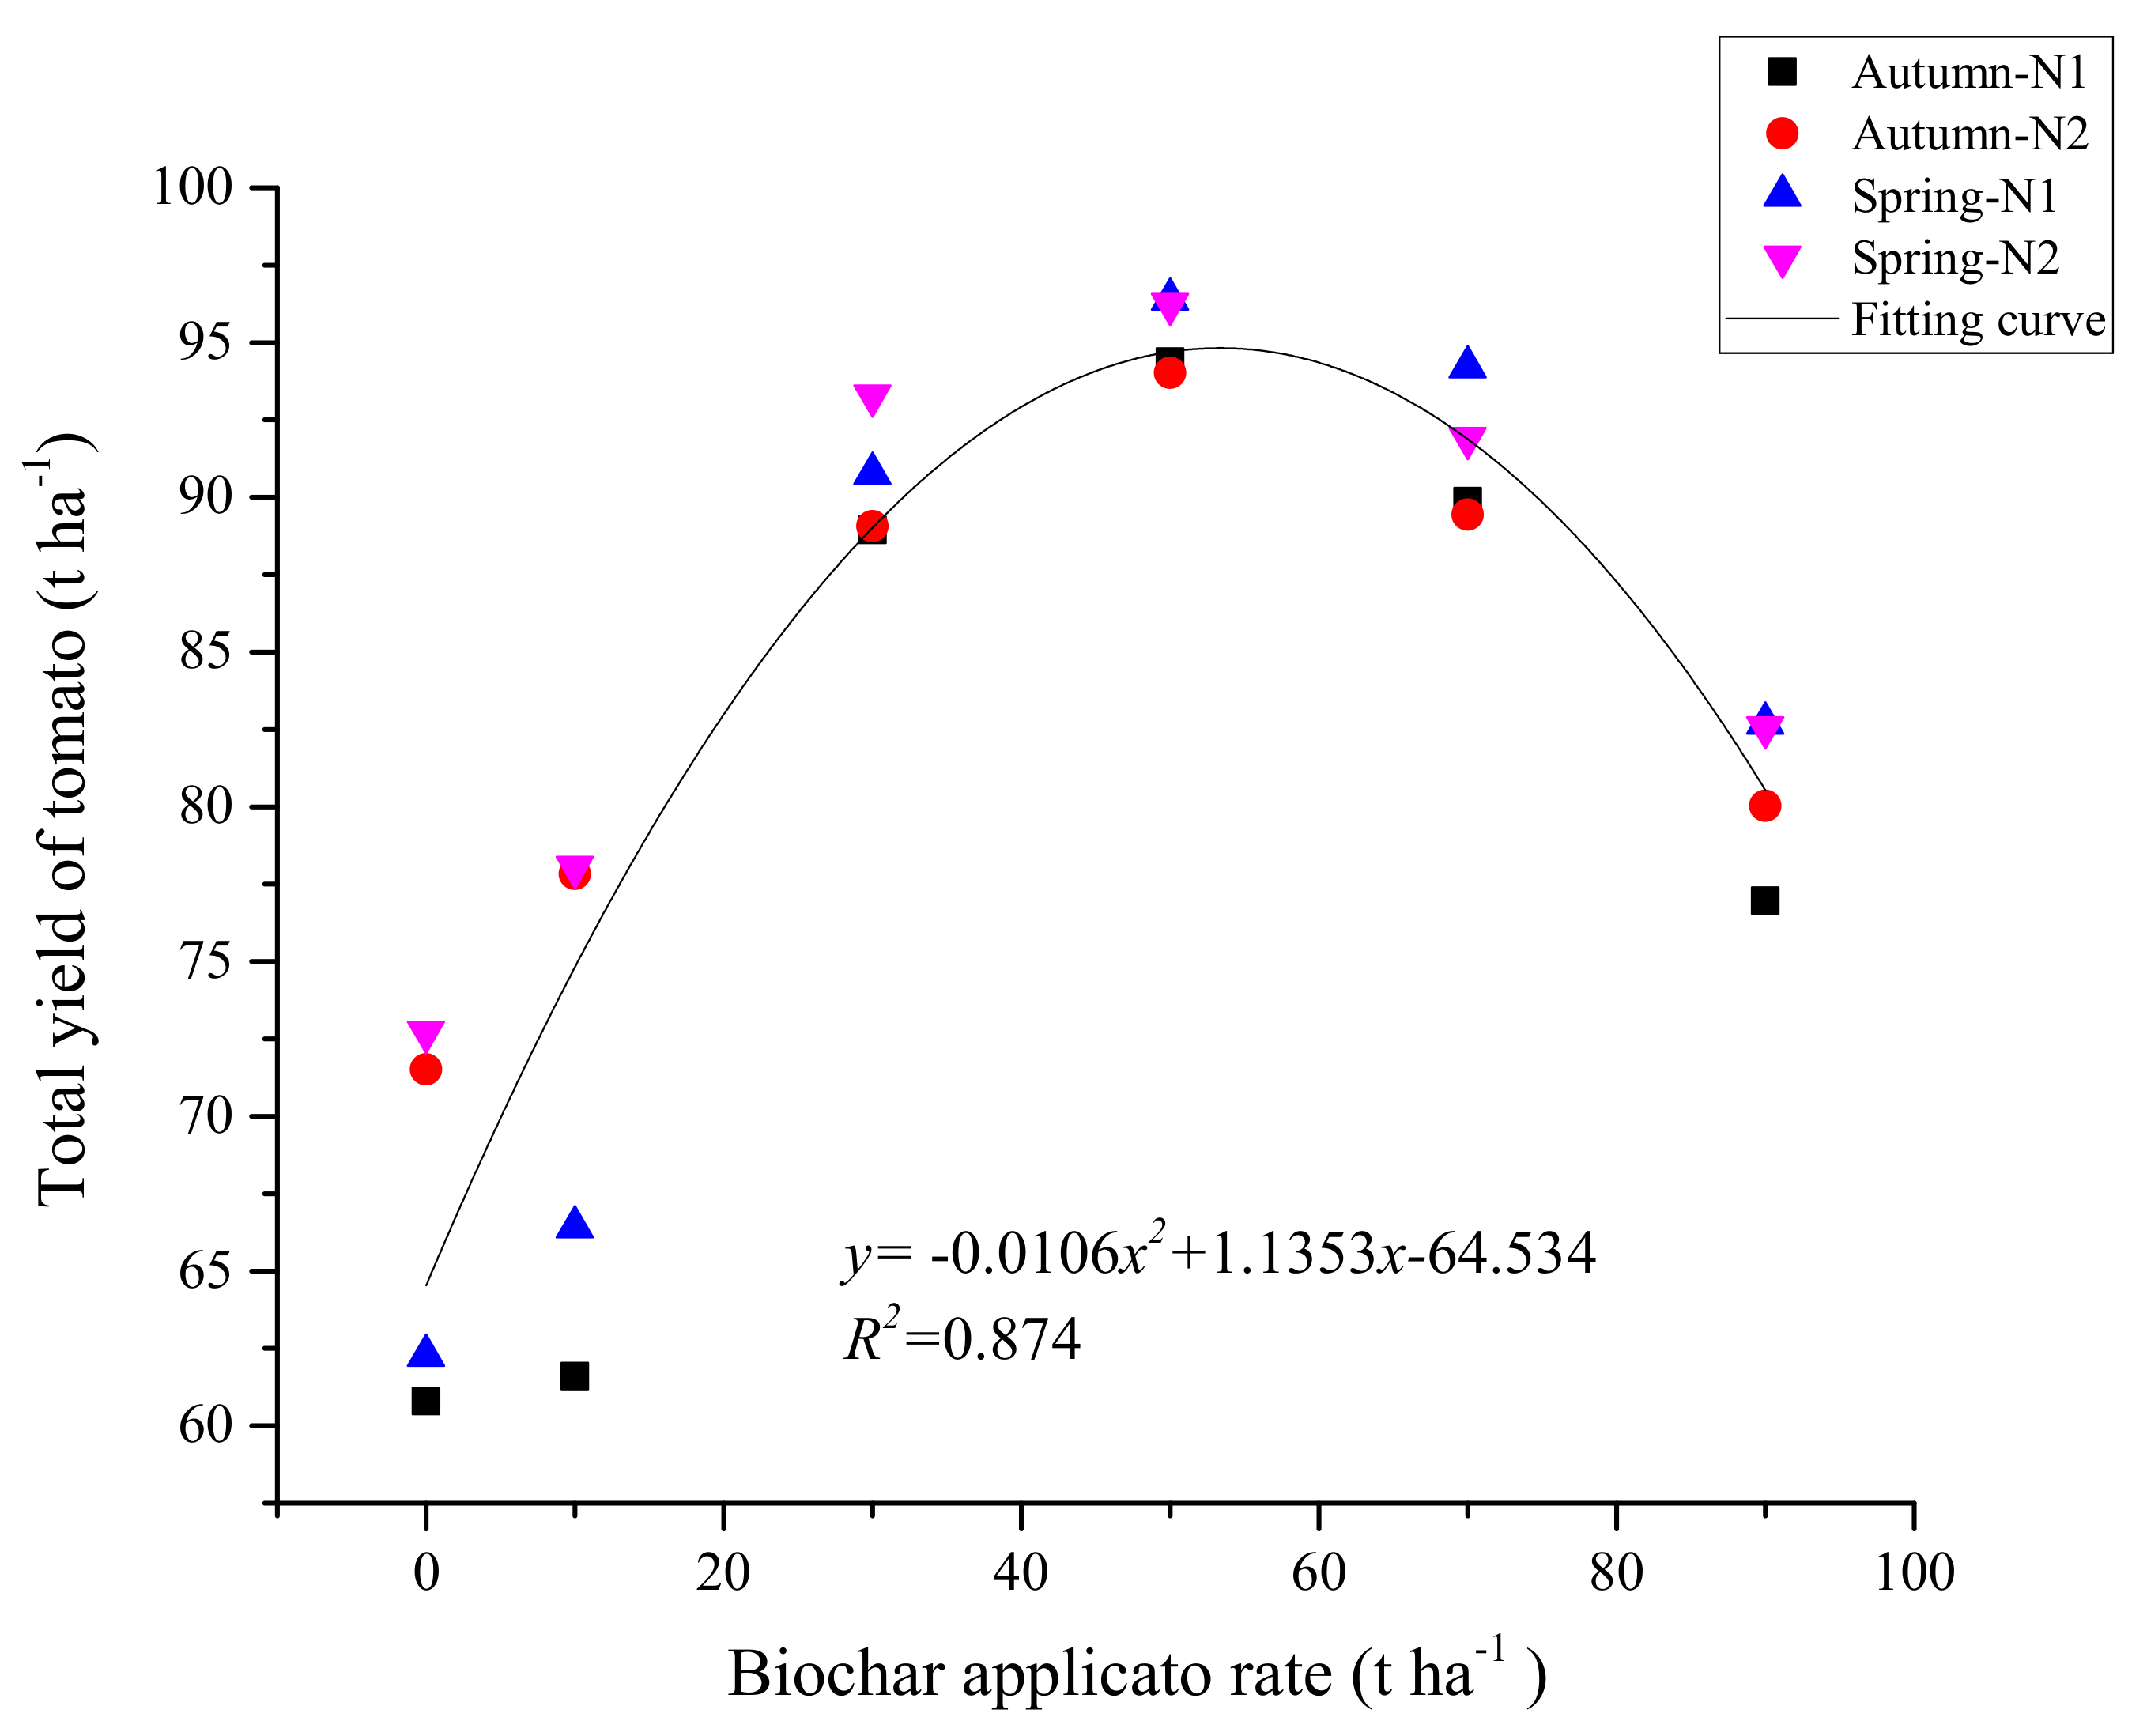
The two-season total tomato yield and total net profit varied with the added amount of biochar (Figure 6 and Figure 7, respectively). A well-fitted quadratic function quantified the relationship between the tomato yield and the added amount of biochar, indicating that the addition of approximately 53 t ha−1 of biochar was optimal for tomato yield (Figure 6). A similar quadratic function for describing the relationship between the net profit and the amount of biochar indicated that the addition of 44.6 t ha−1 of biochar was optimal for achieving the greatest net profit (Figure 7).

3.8. PCA of the Soil–Plant Parameters as Affected by the Treatments

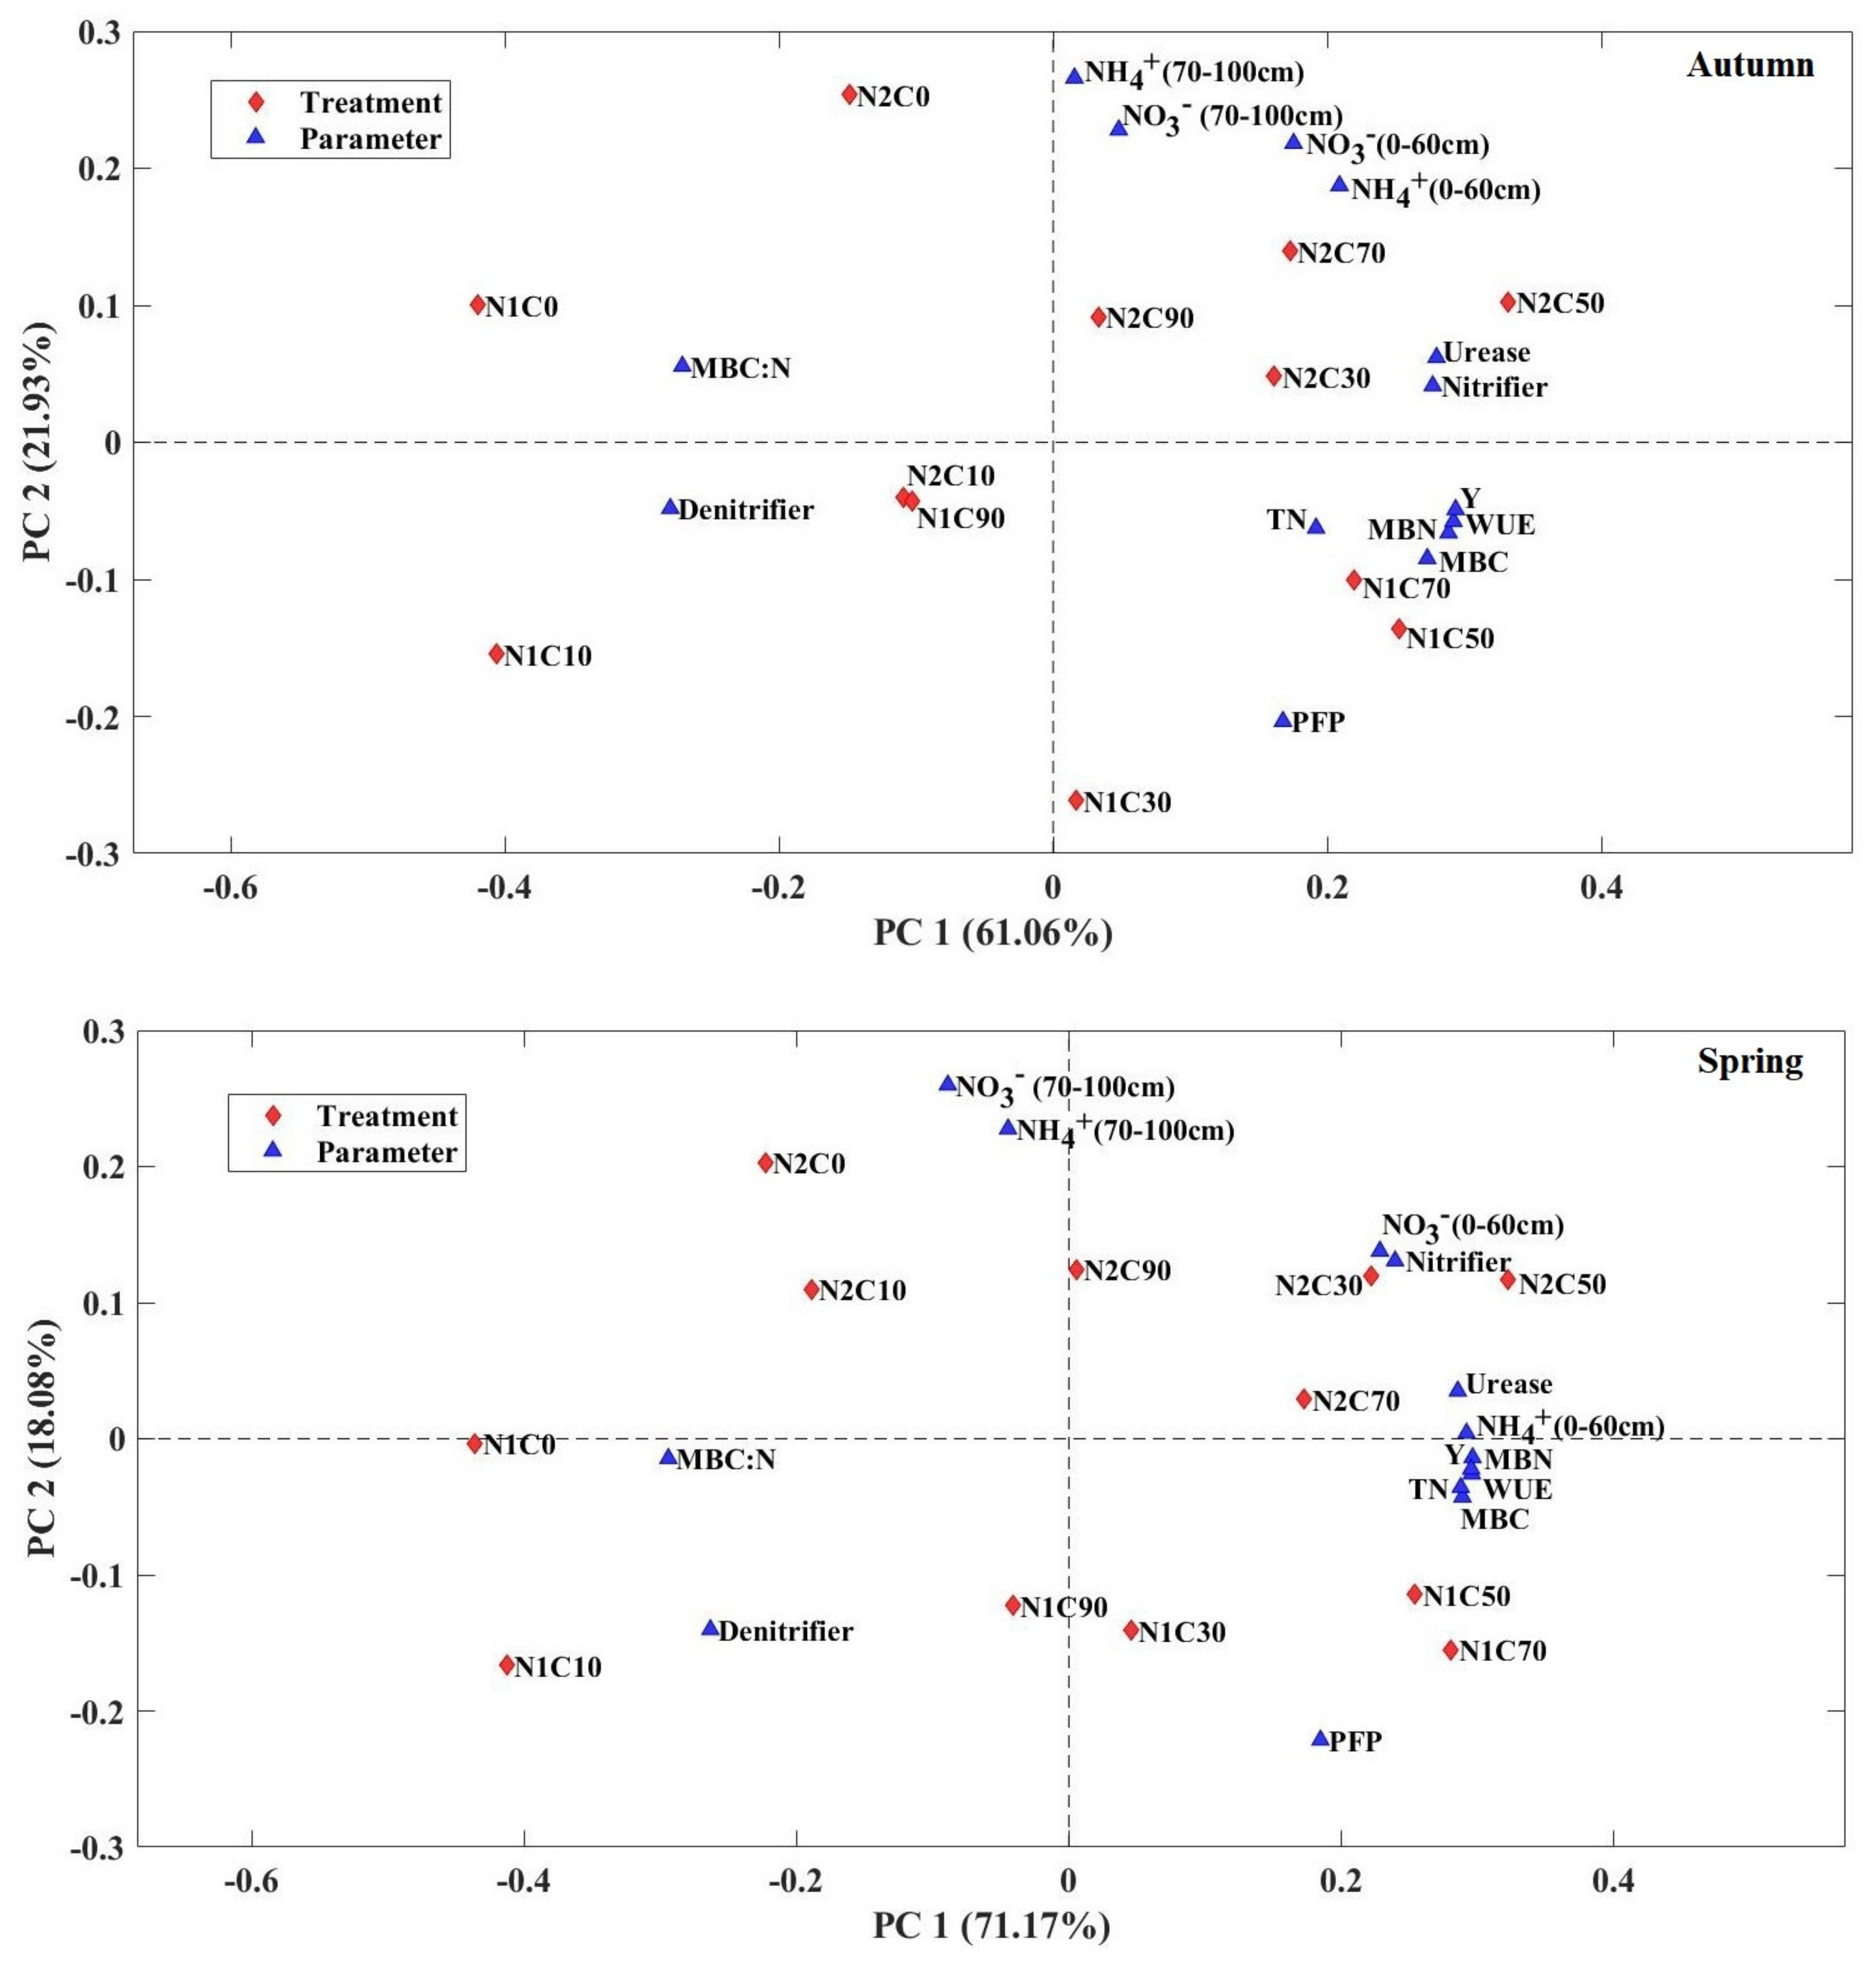
The PCA, which was conducted based on the measured parameters, revealed that the treatments were separated into distinct clusters (Figure 8). In autumn, PC1 explained 61.06% of the variation, whereas PC2 explained 12.93% of the variation. In spring, PC1 explained 71.17% of the variation, whereas PC2 explained 18.08% of the variation. A similar trend was observed in the plots for both seasons. First, the biochar treatments of C0, C10, and C90 and were separated from the C30, C50, and C70 biochar treatments by PC1. Along the PC1 direction, almost all the parameters and the biochar treatments of C30, C50, and C70 were on the right side of the plot, which means that the effects of the C30, C50, and C70 biochar treatments on each measurement parameter were significantly greater than those of the C0, C10, and C90 biochar treatments. Second, NO3 (0–60 cm), NH4+ (0–60 cm), urease, and nitrifier were in the first quadrant, while denitrifier and MBC:N were in the third quadrant, which means that NO3 (0–60 cm) and NH4+ (0–60 cm) have positive correlations with urease and nitrifier, and inverse correlations with denitrifier and MBC:N.

4. Discussion

In recent years, the problem of environmental pollution has become increasingly serious with the increase in N fertiliser consumption. As a soil amendment, biochar can retain and increase nutrients in soil. The porous structure of biochar can provide a favourable habitat for the survival of microorganisms [22,23]. In agreement with the results of many experiments [24,25,26,27], our research concluded that biochar can increase soil water content in the 0–40 cm soil layer (Figure 1), so it may be beneficial to the soil’s microenvironment. In addition, urease plays a very important role in N transformation in soil [28]. Dempster et al. [29] indicated that biochar may promote the transformation of N by affecting urease activity. In our study, the results showed that biochar significantly promoted soil urease activity when the amount of applied biochar was greater than or equal to 30 t ha−1 (Table 4). As a result, biochar further improved the hydrolysis reactions of urea fertiliser by increasing the activity of urease.
Moreover, when the amount of biochar was greater than or equal to 30 t ha−1, biochar significantly increased the number of amoA-type nitrifiers and inhibited the nirS-type denitrifiers (Table 4). Changing the abundance of nitrifying and denitrifying bacteria is deemed to affect soil nitrification and denitrification [30]. Thus, our results mean that biochar can significantly promote soil nitrification and can inhibit denitrification when the amount of biochar applied is greater than or equal to 30 t ha−1, which results in an increase in soil NO3 [31] and a reduction of plant available N loss [32]. The adsorption of nitrification inhibitory substances (such as phenol and terpenes) in biochar may be the reason why biochar promotes soil nitrification [33], and the reason why biochar reduces soil denitrification may be that biochar affects the physical structure of the soil and increases the air content, thereby reducing the level of denitrification [34]. Our results are supported by the previous studies of Zhou et al. [35] and Cao et al. [36].
The MBC is an indicator of changes in organic C content and decomposition in soil; any process and substance that can change the soil C content may affect the biomass and activity of microorganisms [37]. Our results showed that the MBC and MBN were significantly increased in the soil when the added amount of biochar was greater than or equal to 30 t ha−1. This is consistent with the findings of Chen et al. [38], who found that the MBC and MBN increased significantly with the application of 40 t ha−1 biochar to acid rice paddy soil. Meanwhile, the soil MBC:N ratio is a measure of the ability to supply N; the ratio is generally inversely related to the bioavailability of N. In the present study, when the amount of biochar was greater than or equal to 30 t ha−1, it significantly reduced MBC:N (Figure 2). Similarly, Kushwaha et al. [39] reported that the return of straw to a field causes a decrease in MBC:N. However, Zhang et al. [40] reported that the MBC:N significantly increases as the amount of biochar being applied increases and showed that the addition of biochar at the rate of 25 t ha−1 has no significant effect on the MBC:N ratio. The reason may be that different varieties of biochar were applied to different types of soil, which may have had a different effect on the structure of the microbial community.
In this work, when the amount of biochar applied was above 30 t ha−1, the concentrations of NH4+ and NO3 were significantly increased and the soil inorganic N was retained in the 0–60 cm soil layer (Figure 3 and Figure 4). Meanwhile, the addition of biochar also reduced the N lost to leaching compared with the non-biochar control due to reduced N–NO3 in the 70–100 cm soil layer (Figure 3 and Figure 4). The reason is that the addition of biochar increased the soil water holding capacity and reduced the migration of dissolved N due to its large specific surface area and high porosity [41]. As a result, the tomato plants could better absorb and utilise the inorganic N in the soil.
As a result of the improvement of N transformation and the retainment of more inorganic N, biochar increased the total N uptake, yield, WUE, and PFP of the tomato plants compared with the non-biochar control (Table 6 and Figure 5). As the added amount of biochar increased, these variables increased first and then decreased. The PCA plot showed that the impacts of biochar on the measured parameters of the C10 and C90 treatments were significantly less than in the C30, C50, and C70 treatments over the two seasons (Figure 8.). This means that adding too much or too little biochar to the soil will not be effective. The soil–plant response to biochar application may depend on the properties of the biochar [42] and the type of crop [34]. As shown in this study, on the one hand, biochar may not have a significant impact on the physical properties of the soil of the test area when the amount of biochar added is relatively small (10 t/ha); thus, the effect of biochar on soil microenvironment improvement is not obvious. On the other hand, excessive biochar (90 t/ha) may result in large increases in volatile, toxic, and harmful substances [43], thereby affecting the improvement effect of biochar on soil.
In summary, adding a certain amount of biochar can significantly facilitate plant N acquisition and can improve N use efficiency, which is conducive to improving tomato yield and PFP.
Finally, it is worth mentioning that biochar has the potential to reduce N fertiliser inputs, and the potentiality depends on the amount of biochar applied to some extent. In this study, reducing N fertiliser had no significant negative effects on tomato yield under the C30, C50, and C70 treatments compared to the normal amount of N fertiliser, and it was the same for the WUE, PFP, and total N uptake of the tomato plants (Table 6 and Figure 5). The reason is that the addition of biochar can adjust the N-related microorganisms (e.g., increase soil urease activity, MBN, MBC, and the abundance of nitrifying bacteria and reduce the ratio of MBC to MBN and the abundance of denitrifying bacteria) to promote the rate of N transformation; thus, the amount of inorganic N (NH4+ and NO3) and the yield of tomatoes will not significantly decrease even if the amount of N fertiliser is reduced by 24%.

5. Conclusions

First, a proper amount of biochar significantly adjusts the N-related microorganisms: The C30, C50, and C70 treatments increased the soil urease (23.1%, 29.9%, and 25%), the number of amoA-type nitrifiers (58.0%, 106.7%, and 84%), MBN (53.0%, 68.4%, and 69.1%), and MBC (11.9%, 18.8%, and 14.3%), as well as reduced MBC:N (25.8%, 28.7%, and 30.2%) and the number of nirS-type denitrifiers (28.3%, 50.9%, and 39%), which significantly promoted N transformation. Second, the C30, C50, and C70 treatments significantly increased the 0–60 cm soil NO3 (29.6%, 40.9%, and 35.1%) and NH4+ (12.3%, 17.4%, and 17.1%), which may have been because biochar can improve the soil water content (12.56%, 15.73%, and 12.40%). Meanwhile, adding biochar can also reduce inorganic N (NO3 and NH4+) content in the 70–100 cm soil layer, so may reduce the N lost to leaching. Finally, biochar increased the WUE, PFP, total N uptake, and yield of tomato plants, and reducing N fertilisation by 24% had no significant negative effects on the parameters compared to the normal amount of N fertiliser under the C30, C50, and C70 treatments.
Therefore, it was further calculated and recommended based on the proposed non-linear regression models that the addition of 53 t ha−1 of biochar and 190 kg ha−1 of N fertiliser would be the optimal combination in terms of tomato yield. Additionally, the addition of 44.6 t ha−1 of biochar and 190 kg ha−1 of N fertiliser would be the optimal combination in terms of net profit for local farmers (Figure 6 and Figure 7). As future research, it seems promising to investigate the roles of more parameters of the soil microenvironment, and to explore the effect of biochar on the physiology of tomato plants.

Author Contributions

Conceptualisation, L.G.; methodology, M.K.; software, M.K.; validation, L.G., H.Y. and W.N.; formal analysis, L.G.; investigation, L.G.; resources, W.N.; data curation, H.Y.; writing—original draft preparation, L.G.; writing—review and editing, H.Y.; visualisation, H.Y.; supervision, W.N.; project administration, W.N.; funding acquisition, W.N. All authors have read and agreed to the published version of the manuscript.

Funding

This research was funded by the National Key Research and Development Project (grant number: 2016YFC0400202) and the National Natural Science Foundation Program (grant number: 51679205).

Data Availability Statement

Not applicable.

Acknowledgments

This study was supported by the National Key Research and Development Project (grant number: 2016YFC0400202) and the National Natural Science Foundation Program (grant number: 51679205). Lili Guo appreciates the Chinese Scholarship Council (CSC) for supporting her study at the Faculty of Science, University of Copenhagen, Denmark.

Conflicts of Interest

The authors declare no conflict of interest.

References

  1. Laird, D.; Fleming, P.; Wang, B.; Horton, R.; Karlen, D. Biochar impact on nutrient leaching from a Midwestern agricultural soil. Geoderma 2010, 158, 436–442. [Google Scholar] [CrossRef] [Green Version]
  2. Yu, H.; Zou, W.; Chen, J.; Chen, H.; Yu, Z.; Huang, J.; Tang, H.; Wei, X.; Gao, B. Biochar amendment improves crop production in problem soils: A review. J. Environ. Manag. 2019, 232, 8–21. [Google Scholar] [CrossRef]
  3. Tan, Z.; Ye, Z.; Zhang, L.; Huang, Q. Application of the (15)N tracer method to study the effect of pyrolysis temperature and atmosphere on the distribution of biochar nitrogen in the biomass-biochar-plant system. Sci. Total Environ. 2018, 622, 79–87. [Google Scholar] [CrossRef]
  4. Nguyen, T.T.N.; Xu, C.Y.; Tahmasbian, I.; Che, R.; Xu, Z.; Zhou, X.; Wallace, H.M.; Bai, S.H. Effects of biochar on soil available inorganic nitrogen: A review and meta-analysis. Geoderma 2017, 288, 79–96. [Google Scholar] [CrossRef] [Green Version]
  5. Jeffery, S.; Memelink, I.; Hodgson, E.; Jones, S.; van de Voorde, T.F.J.; Martijn Bezemer, T.; Mommer, L.; van Groenigen, J.W. Initial biochar effects on plant productivity derive from N fertilization. Plant. Soil 2017, 415, 435–448. [Google Scholar] [CrossRef]
  6. Mandal, S.; Thangarajan, R.; Bolan, N.S.; Sarkar, B.; Khan, N.; Ok, Y.S.; Naidu, R. Biochar-induced concomitant decrease in ammonia volatilization and increase in nitrogen use efficiency by wheat. Chemosphere 2016, 142, 120–127. [Google Scholar] [CrossRef] [PubMed]
  7. Nelissen, V.; Rütting, T.; Huygens, D.; Ruysschaert, G.; Boeckx, P. Temporal evolution of biochar’s impact on soil nitrogen processes—a15N tracing study. GCB Bioenergy 2015, 7, 635–645. [Google Scholar] [CrossRef]
  8. Palansooriya, K.N.; Wong, J.T.F.; Hashimoto, Y.; Huang, L.; Rinklebe, J.; Chang, S.X.; Bolan, N.; Wang, H.; Ok, Y.S. Response of microbial communities to biochar-amended soils: A critical review. Biochar 2019, 1, 3–22. [Google Scholar] [CrossRef] [Green Version]
  9. Turner, S.; Meyer-Stüve, S.; Schippers, A.; Guggenberger, G.; Schaarschmidt, F.; Wild, B.; Richter, A.; Dohrmann, R.; Mikutta, R. Microbial utilization of mineral-associated nitrogen in soils. Soil Biol. Biochem. 2017, 104, 185–196. [Google Scholar] [CrossRef]
  10. Yang, H.; Sheng, R.; Zhang, Z.; Wang, L.; Wang, Q.; Wei, W. Responses of nitrifying and denitrifying bacteria to flooding-drying cycles in flooded rice soil. Appl. Soil Ecol. 2016, 103, 101–109. [Google Scholar] [CrossRef] [Green Version]
  11. Li, Y.; Chang, S.X.; Tian, L.; Zhang, Q. Conservation agriculture practices increase soil microbial biomass carbon and nitrogen in agricultural soils: A global meta-analysis. Soil Biol. Biochem. 2018, 121, 50–58. [Google Scholar] [CrossRef]
  12. Song, Y.; Song, C.; Hou, A.; Ren, J.; Wang, X.; Cui, Q.; Wang, M. Effects of temperature and root additions on soil carbon and nitrogen mineralization in a predominantly permafrost peatland. Catena 2018, 165, 381–389. [Google Scholar] [CrossRef]
  13. Du, Z.; Wang, Y.; Huang, J.; Lu, N.; Liu, X.; Lou, Y.; Zhang, Q. Consecutive Biochar Application Alters Soil Enzyme Activities in the Winter Wheat–Growing Season. Soil Sci. 2014, 179, 75–83. [Google Scholar] [CrossRef]
  14. Du, Y.-D.; Zhang, Q.; Cui, B.-J.; Sun, J.; Wang, Z.; Ma, L.-H.; Niu, W.-Q. Aerated irrigation improves tomato yield and nitrogen use efficiency while reducing nitrogen application rate. Agric. Water Manag. 2020, 235, 106152. [Google Scholar] [CrossRef]
  15. Li, C.; Xiong, Y.; Qu, Z.; Xu, X.; Huang, Q.; Huang, G. Impact of biochar addition on soil properties and water-fertilizer productivity of tomato in semi-arid region of Inner Mongolia, China. Geoderma 2018, 331, 100–108. [Google Scholar] [CrossRef]
  16. Du, Y.; Niu, W.; Zhang, Q.; Cui, B.; Gu, X.; Guo, L.; Liang, B. Effects of Nitrogen on Soil Microbial Abundance, Enzyme Activity, and Nitrogen Use Efficiency in Greenhouse Celery under Aerated Irrigation. Soil Sci. Soc. Am. J. 2018, 82, 606. [Google Scholar] [CrossRef] [Green Version]
  17. Kandeler, E.G. Short-term assay of soil urease activity using colorimetric determination of ammonium. Biol. Fertil. Soils 1988, 6, 68–72. [Google Scholar] [CrossRef]
  18. Wang, F.; Zhao, Y.; Xie, S.; Li, J. Implication of Nitrifying and Denitrifying Bacteria for Nitrogen Removal in a Shallow Lake. Clean Soil Air Water 2017, 45, 1500319. [Google Scholar] [CrossRef]
  19. Horita, M.; Sakai, Y.K. Specific detection and quantification of Ralstonia pseudosolanacearum race 4 strains from Zingiberaceae plant cultivation soil by MPN-PCR. J. Gen. Plant. Pathol. 2020, 86, 393–400. [Google Scholar] [CrossRef]
  20. Nakaho, Y.I.K. Sensitive quantitative detection of Ralstonia solanacearum in soil by the most probable number-polymerase chain reaction (MPN-PCR) method. Appl. Microbiol. Biotechnol. 2014, 98, 4169–4177. [Google Scholar] [CrossRef]
  21. Vance, E.D.; Brookes, P.C.; Jenkinson, D.S. An extraction method for measuring soil microbial biomass C. Soil Biol. Biochem. 1987, 19, 703–707. [Google Scholar] [CrossRef]
  22. Awad, Y.M.; Ok, Y.S.; Abrigata, J.; Beiyuan, J.; Beckers, F.; Tsang, D.C.W.; Rinklebe, J. Pine sawdust biomass and biochars at different pyrolysis temperatures change soil redox processes. Sci. Total Environ. 2018, 625, 147–154. [Google Scholar] [CrossRef] [PubMed]
  23. Ye, J.; Joseph, S.D.; Ji, M.; Nielsen, S.; Mitchell, D.R.G.; Donne, S.; Horvat, J.; Wang, J.; Munroe, P.; Thomas, T. Chemolithotrophic processes in the bacterial communities on the surface of mineral-enriched biochars. ISME J. 2017, 11, 1087–1101. [Google Scholar] [CrossRef] [PubMed]
  24. Mohamed, B.A.; Ellis, N.; Kim, C.S.; Bi, X.; Emam, A.E. Engineered biochar from microwave-assisted catalytic pyrolysis of switchgrass for increasing water-holding capacity and fertility of sandy soil. Sci. Total Environ. 2016, 566, 387–397. [Google Scholar] [CrossRef] [PubMed]
  25. Yoo, G.; Kim, H.; Chen, J.; Kim, Y. Effects of Biochar Addition on Nitrogen Leaching and Soil Structure following Fertilizer Application to Rice Paddy Soil. Soil Sci. Soc. Am. J. 2014, 78, 852–860. [Google Scholar] [CrossRef]
  26. Akhtar, S.S.; Li, G.; Andersen, M.N.; Liu, F. Biochar enhances yield and quality of tomato under reduced irrigation. Agric. Water Manag. 2014, 138, 37–44. [Google Scholar] [CrossRef]
  27. Brockhoff, S.R.; Christians, N.E.; Killorn, R.J.; Horton, R.; Davis, D.D. Physical and Mineral-Nutrition Properties of Sand-Based Turfgrass Root Zones Amended with Biochar. Agron. J. 2010, 102, 1627–1631. [Google Scholar] [CrossRef]
  28. Yang, X.; Liu, J.; McGrouther, K.; Huang, H.; Lu, K.; Guo, X.; He, L.; Lin, X.; Che, L.; Ye, Z.; et al. Effect of biochar on the extractability of heavy metals (Cd, Cu, Pb, and Zn) and enzyme activity in soil. Environ. Sci. Pollut. Res. Int. 2016, 23, 974–984. [Google Scholar] [CrossRef]
  29. Dempster, D.N.; Murphy, D.L.J.D.V. Decreased soil microbial biomass and nitrogen mineralisation with Eucalyptus biochar addition to a coarse textured soil. Plant Soil 2012. [Google Scholar] [CrossRef]
  30. Zhang, K.; Chen, L.; Li, Y.; Brookes, P.C.; Xu, J.; Luo, Y. The effects of combinations of biochar, lime, and organic fertilizer on nitrification and nitrifiers. Biol. Fertil. Soils 2016, 53, 77–87. [Google Scholar] [CrossRef]
  31. Wang, X.; Zhao, Y.; Wang, H.; Zhao, X.; Cui, H.; Wei, Z. Reducing nitrogen loss and phytotoxicity during beer vinasse composting with biochar addition. Waste Manag. 2017, 61, 150–156. [Google Scholar] [CrossRef] [PubMed]
  32. Ducey, T.F.; Ippolito, J.A.; Cantrell, K.B.; Novak, J.M.; Lentz, R.D. Addition of activated switchgrass biochar to an aridic subsoil increases microbial nitrogen cycling gene abundances. Appl. Soil Ecol. 2013, 65, 65–72. [Google Scholar] [CrossRef]
  33. DeLuca, T.; MacKenzie, M.; Gundale, M.; Holben, W. Wildfire-produced charcoal directly influences nitrogen cycling in ponderosa pine forests. Soil Sci. Soc. Am. J. 2006, 70, 448–453. [Google Scholar] [CrossRef] [Green Version]
  34. Van Zwieten, L. Influence of biochars on flux of N2O and CO2 from Ferrosol. Aust. J. Soil Res. 2010, 48, 555–568. [Google Scholar] [CrossRef]
  35. Zhou, H.; Wang, P.; Shi, G.; Cheng, K.; Bian, R.; Liu, X.; Zhang, X.; Zheng, J.; Crowley, D.E. Short-term biochar manipulation of microbial nitrogen transformation in wheat rhizosphere of a metal contaminated Inceptisol from North China plain. Sci. Total Environ. 2018, 640, 1287–1296. [Google Scholar] [CrossRef] [PubMed]
  36. Cao, H.; Ning, L.; Xun, M.; Feng, F.; Li, P.; Yue, S.; Song, J.; Zhang, W.; Yang, H. Biochar can increase nitrogen use efficiency of Malus hupehensis by modulating nitrate reduction of soil and root. Appl. Soil Ecol. 2019, 135, 25–32. [Google Scholar] [CrossRef]
  37. Dahlawi, S.; Naeem, A.; Rengel, Z.; Naidu, R. Biochar application for the remediation of salt-affected soils: Challenges and opportunities. Sci. Total Environ. 2018, 625, 320–335. [Google Scholar]
  38. Chen, J.; Sun, X.; Li, L.; Liu, X.; Zhang, B.; Zheng, J.; Pan, G. Change in active microbial community structure, abundance and carbon cycling in an acid rice paddy soil with the addition of biochar. Eur. J. Soil Sci. 2016, 67, 857–867. [Google Scholar] [CrossRef]
  39. Kushwaha, C.P.; Tripathi, S.K.; Singh, K.P. Variations in soil microbial biomass and N availability due to residue and tillage management in a dryland rice agroecosystem. Soil Tillage Res. 2000, 56, 153–166. [Google Scholar] [CrossRef]
  40. Zhang, Q.Z.; Dijkstra, F.A.; Liu, X.R.; Wang, Y.D.; Huang, J.; Lu, N. Effects of biochar on soil microbial biomass after four years of consecutive application in the north China Plain. PLoS ONE 2014, 9, e102062. [Google Scholar] [CrossRef] [Green Version]
  41. Novak, J.M.; Busscher, W.J.; Watts, D.W.; Amonette, J.E.; Ippolito, J.A.; Lima, I.M.; Gaskin, J.; Das, K.C.; Steiner, C.; Ahmedna, M.; et al. Biochars Impact on Soil-Moisture Storage in an Ultisol and Two Aridisols. Soil Sci. 2012, 177, 310–320. [Google Scholar] [CrossRef] [Green Version]
  42. Rajkovich, S. Corn growth and nitrogen nutrition after additions of biochars with varying properties to a temperate soil. Biol. Fertil. Soils 2012, 48, 271–284. [Google Scholar] [CrossRef]
  43. Ding, Y.; Liu, Y.; Liu, S.; Li, Z.; Tan, X.; Huang, X.; Zeng, G.; Zhou, L.; Zheng, B. Biochar to improve soil fertility. A review. Agron. Sustain. Dev. 2016, 36. [Google Scholar] [CrossRef] [Green Version]
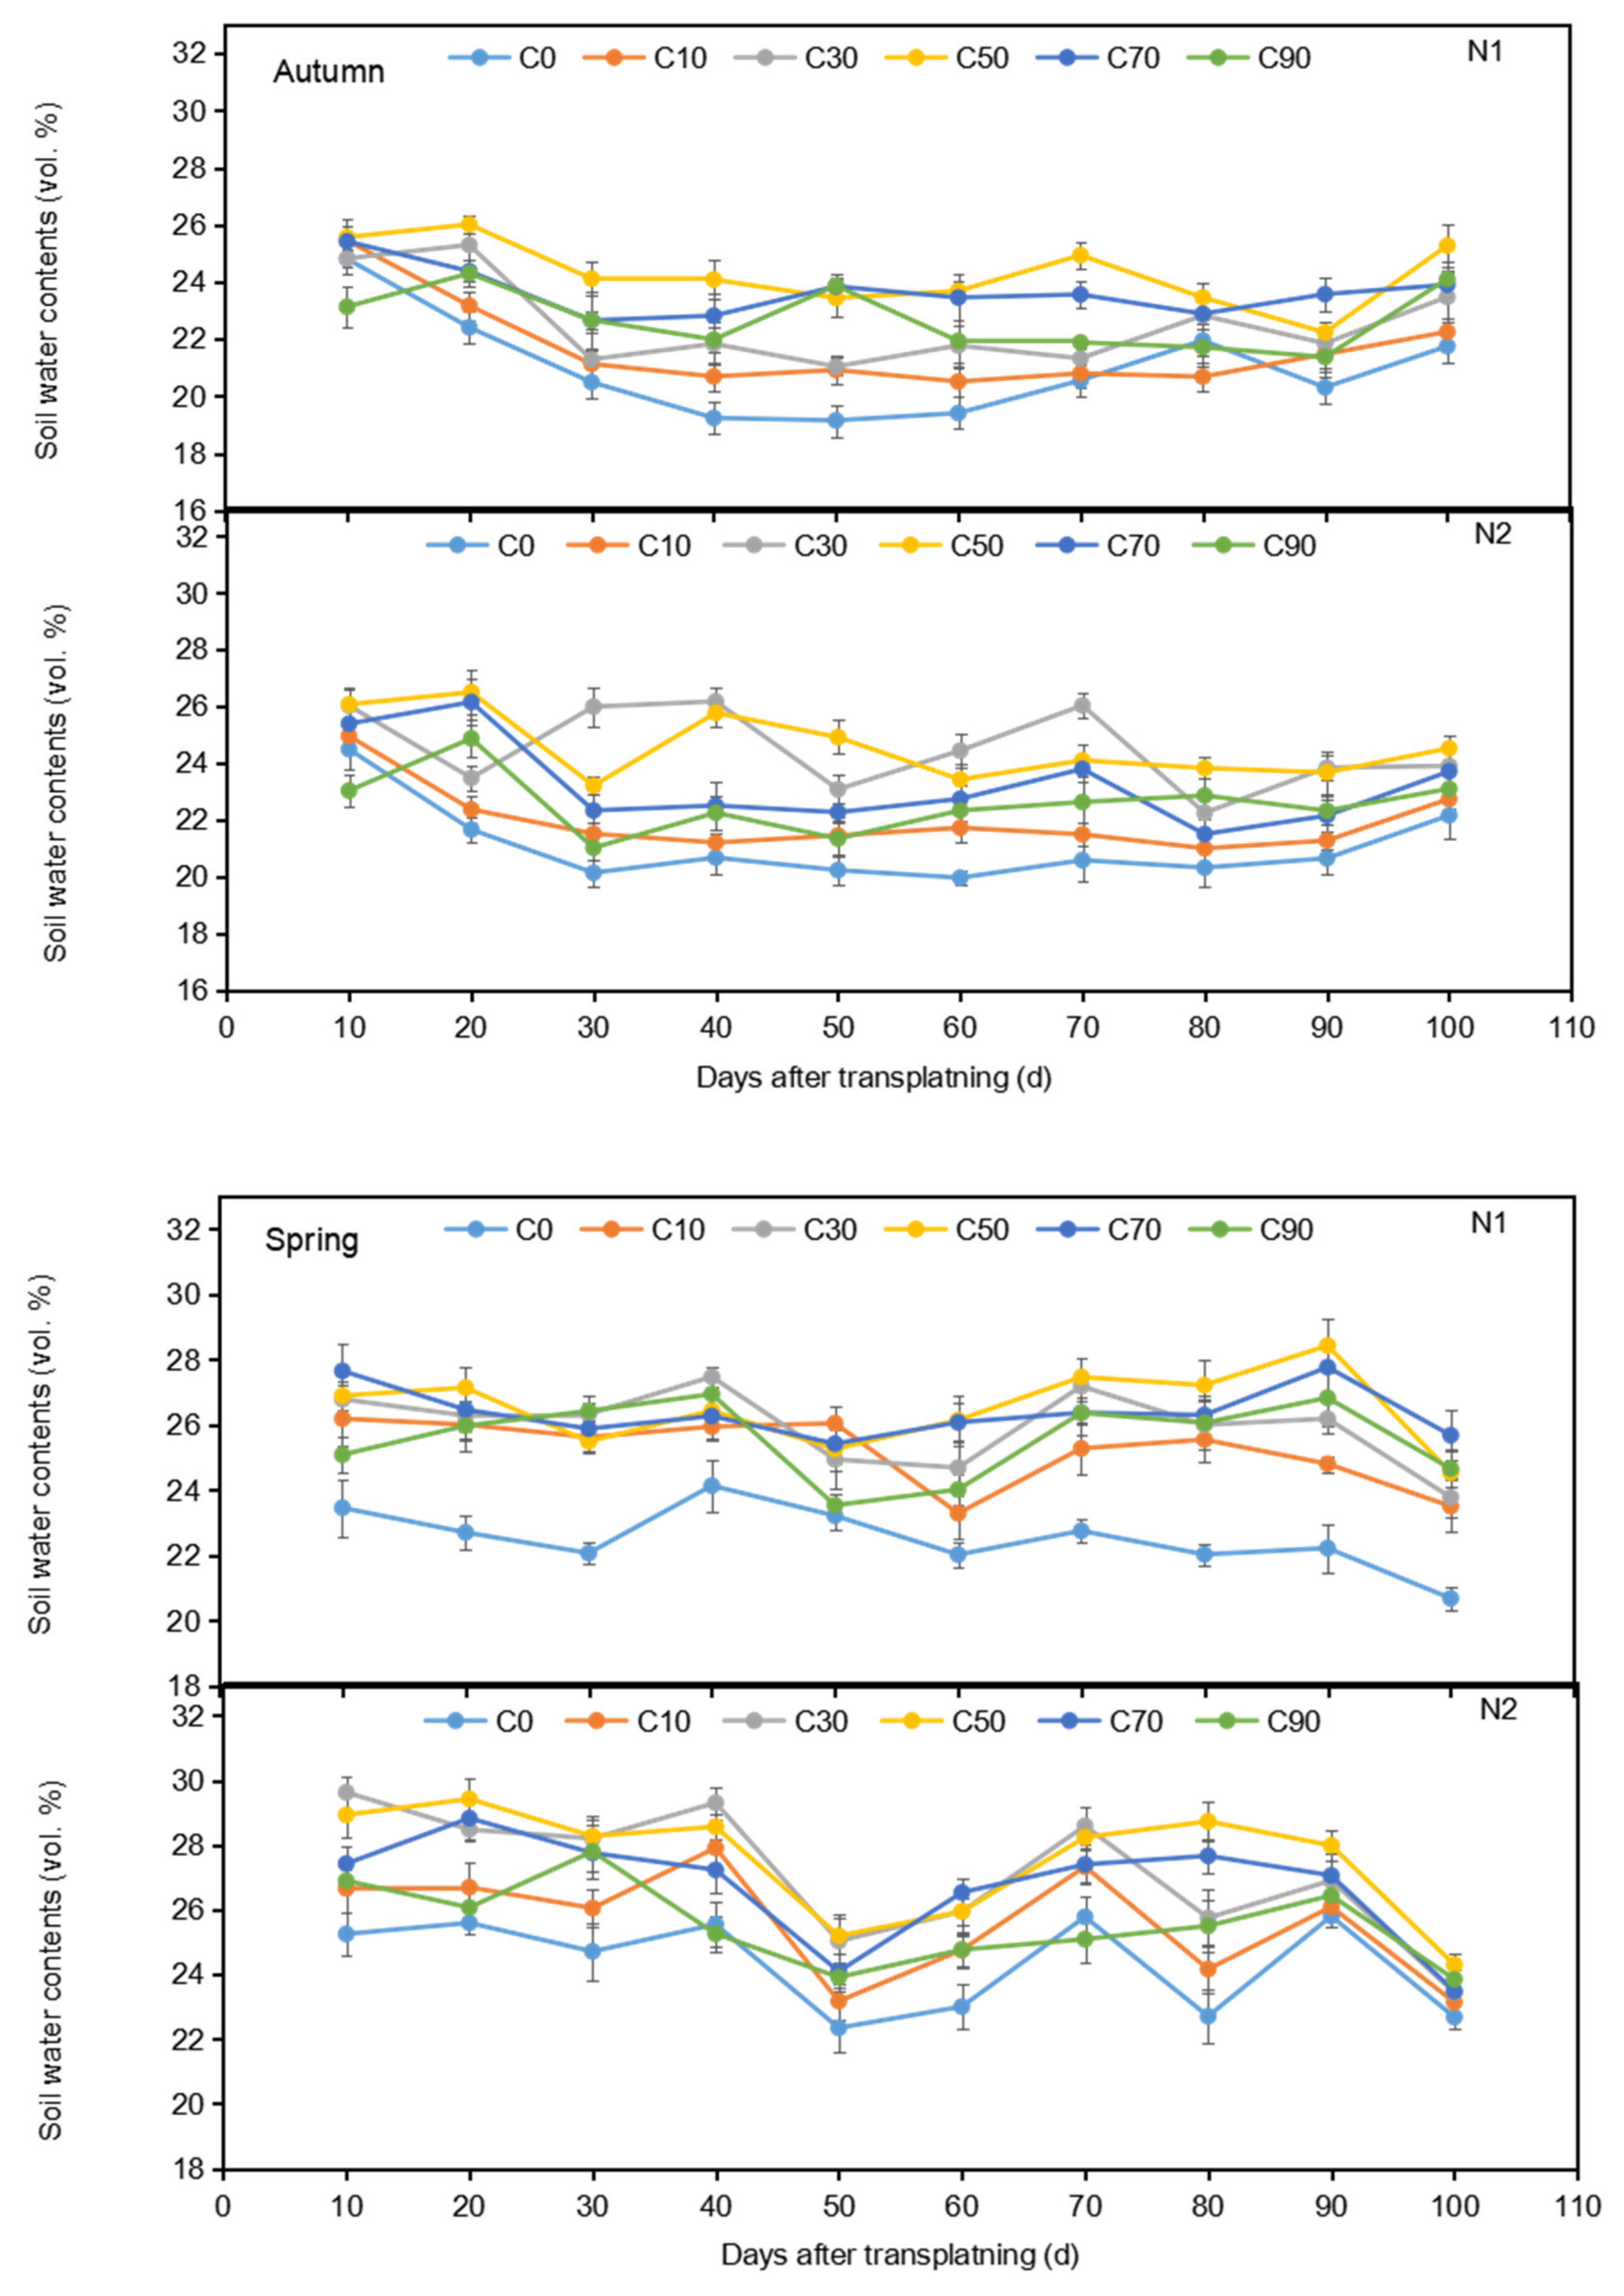
Figure 1. Daily changes of the average volumetric soil water content (%) for soil with different N fertiliser (N1 and N2) and biochar (C0, C10, C30, C50, C70, and C90) treatments. Error bars represent standard errors.
Agronomy 11 00381 g001
Figure 2. MBC, MBN, and MBC:N results for the treatments of different amounts of N fertiliser (N1 and N2) and biochar (C0, C10, C30, C50, C70, and C90). Error bars represent standard errors. Within each panel, different lowercase letters (a–i) denote significant differences among treatment means at the 0.05 level by Duncan’s MRT method.
Agronomy 11 00381 g002
Figure 3. The distribution of NO3 at different soil depths for the N fertiliser (N1 and N2) and biochar (C0, C10, C30, C50, C70, and C90) treatments. Error bars represent standard errors.
Agronomy 11 00381 g003
Figure 4. The distribution of NH4+ at different soil depths for the N fertiliser (N1 and N2) and biochar (C0, C10, C30, C50, C70, and C90) treatments. Error bars represent standard errors.
Agronomy 11 00381 g004
Figure 5. Tomato plant total N uptake (TN) in each organ for the N fertiliser (N1 and N2) and biochar (C0, C10, C30, C50, C70, and C90) treatments. Error bars represent standard errors. Different lowercase letters (a–h) denote significant differences among the treatment means at the 0.05 level by Duncan’s MRT method.
Agronomy 11 00381 g005
Figure 6. The total yield of tomatoes varied with the amount of biochar (C0, C10, C30, C50, C70, or C90) and the N fertiliser treatments (N1 and N2) in the spring and autumn.
Agronomy 11 00381 g006
Figure 7. The two-season total net profit varied with the amount of biochar (C0, C10, C30, C50, C70, or C90) and the N fertiliser treatments (N1 and N2).
Agronomy 11 00381 g007
Figure 8. Principal component analysis (PCA) of the selected parameters measured on tomato plants grown with biochar (C0, C10, C30, C50, C70, and C90) with nitrogen fertiliser (N1 and N2). The parameters were urease enzyme activity (Urease), the number of amoA-type nitrifiers (Nitrifier), the number of nirS-type denitrifiers (Denitrifier), microbial biomass carbon (MBC), microbial biomass nitrogen (MBN), microbial biomass C:N (MBC:N) ratio, NO3 (0–60 cm), NO3 (70–100 cm), NH4+ (0–60 cm), NH4+ (70–100 cm), total N uptake of tomato plant (TN), yield of tomatoes (Y), water use efficiency (WUE), and partial-factor productivity of nitrogen (PFP).
Agronomy 11 00381 g008
Table 1. Soil and biochar properties.
FactorSoilBiochar
Nominal peak temperature (°C)450
Surface area (m2 g1)87.1
Total ash (%)19.8
Bulk density (g cm−1)1.35
pH7.3510.51
organic matter (g kg−1)16.48
C (%)72.38
H (%)2.62
O (%)23.81
Mineral N (mg kg1)<3
Total N (g kg1)0.960.98
NH4+–N (mg kg1)10.11.67
NO3–N (mg kg1)15.30.59
Total K (g kg−1)10.4
Total P (g kg−1)0.870.76
Table 2. Treatments of different biochar and fertilisation combinations.
TreatmentNitrogen Fertiliser (kg/ha)Biochar (t/ha)
N1C01900
N1C1019010
N1C3019030
N1C5019050
N1C7019070
N1C9019090
N2C02500
N2C1025010
N2C3025030
N2C5025050
N2C7025070
N2C9025090
Table 3. A cost–benefit analysis for tomatoes grown with different biochar and N treatments in a single solar greenhouse.
TreatmentYield (t)Input Cost (×103 RMB)Income
(×103 RMB)
Benefit
(×103 RMB)
Net Profit
Relative to
No Biochar (×103 RMB)
BiocharFertiliser
and
Pesticide
Pipe
System
Water and
Electricity
SeedlingsOther
N1C08.210.001.162.020.102.000.5045.9540.170.00
N1C108.531.331.162.020.102.000.6047.7940.580.41
N1C3011.984.001.162.020.102.000.7067.1057.1216.95
N1C5012.726.671.162.020.102.000.8071.2358.4818.31
N1C7012.279.331.162.020.102.000.9068.7253.2113.04
N1C9010.6412.001.162.020.102.001.0059.6141.331.16
N2C09.620.001.262.020.102.000.5053.8547.970.00
N2C1010.391.331.262.020.102.000.6058.1950.882.91
N2C3012.164.001.262.020.102.000.7068.0757.9910.03
N2C5012.686.671.262.020.102.000.8071.0358.1810.22
N2C7012.099.331.262.020.102.000.9067.7052.094.12
N2C9010.8412.001.262.020.102.001.0060.7042.32-5.65
Table 4. Urease activity, number of amoA-type nitrifiers and nirS-type denitrifiers as affected by biochar (C0, C10, C30, C50, C70, and C90), and N fertiliser rates (N1 and N2).
TreatmentAutumnSpring
Urease (mg g−1 24 h−1)amoA-Type
Nitrifier (103 g−1)
nirS-Type Denitrifier (103 g−1)Urease (mg g−1 24 h−1)amoA-Type
Nitrifier (103 g−1)
nirS-Type Denitrifier (103 g−1)
N1C01.86 ± 0.04 i1.89 ± 0.11 e4.08 ± 0.07 b1.78 ± 0.02 fg1.59 ± 0.3 e4.86 ± 0.35 ab
N1C101.68 ± 0.07 j1.46 ± 0.31 e4.43 ± 0.13 a1.68 ± 0.03 g1.53 ± 0.17 e5.95 ± 0.6 a
N1C302.15 ± 0.05 efg2.53 ± 0.18 d3.66 ± 0.15 c2.09 ± 0.03 d2.44 ± 0.38 cde3.43 ± 0.46 cd
N1C502.31 ± 0.04 cd3.96 ± 0.17 b2.05 ± 0.1 g2.33 ± 0.04 b3.11 ± 0.24 bcd2.48 ± 0.64 cdef
N1C702.21 ± 0.02 def4.28 ± 0.18 ab2.04 ± 0.07 g2.27 ± 0.03 bc3.55 ± 0.34 bc2.37 ± 0.42 def
N1C902.02 ± 0.07 gh2.88 ± 0.05 cd2.87 ± 0.08 e1.94 ± 0.06 e2.17 ± 0.54 de3.92 ± 0.15 bc
N2C01.95 ± 0.07 hi2.65 ± 0.14 d3.24 ± 0.12 d1.81 ± 0.04 f2.48 ± 0.54 cde3.14 ± 0.63 cde
N2C102.06 ± 0.06 fgh2.56 ± 0.18 d3.50 ± 0.13 cd1.84 ± 0.02 ef2.1 ± 0.46 de3.56 ± 0.61 bcd
N2C302.41 ± 0.08 bc3.32 ± 0.1 c2.47 ± 0.14 f2.46 ± 0.02 a5.45 ± 0.31 a1.6 ± 0.31 f
N2C502.59 ± 0.02 a4.49 ± 0.09 a1.83 ± 0.06 g2.38 ± 0.03 ab6.28 ± 0.58 a1.22 ± 0.09 f
N2C702.48 ± 0.03 ab3.27 ± 0.12 c2.72 ± 0.05 ef2.30 ± 0.04 bc4.06 ± 0.56 b1.93 ± 0.48 ef
N2C902.27 ± 0.03 cde3.87 ± 0.12 b2.82 ± 0.16 e2.20 ± 0.06 c3.99 ± 0.38 b1.97 ± 0.06 ef
ANOVA
N******************
C******************
N×Cns**ns*********
Different lowercase letters denote significant differences among treatment means at the 0.05 level by Duncan’s MRT method. The bottom of this table reports the significant results of the two-way ANOVA. **, and *** indicate significance levels at p < 0.01, and p < 0.001, respectively; ns denotes no significance. Values are means ± standard errors of the means.
Table 5. The output of a two-way ANOVA for the yield of tomatoes, total N uptake (TN) of tomato plants, microbial biomass carbon and nitrogen (MBC and MBN), and microbial biomass C:N (MBC:N) as affected by biochar (C0, C10, C30, C50, C70, and C90) and N fertiliser rates (N1 and N2). The data are presented in Figure 2 and Figure 5.
FactorsAutumnSpring
TNMBCMBNMBC:NTNMBCMBNMBC:N
N*************nsnsns
C************************
N×C**************nsns
*, **, and *** indicate significance levels at p < 0.05, p < 0.01, and p < 0.001, respectively; ns denotes no significance.
Table 6. Yield of tomatoes (Y), water use efficiency (WUE), and partial-factor productivity of nitrogen (PFP) as affected by the addition of biochar (C0, C10, C30, C50, C70, and C90) and N fertiliser (N1 and N2).
TreatmentAutumnSpring
Y(t/ha)WUE/(kg m−3)PFPY(t/ha)WUE/(kg m−3)PFP
N1C060.80 ± 0.33 i38.48 ± 0.36 h319.99 ± 1.75 c62.28 ± 0.18 j30.17 ± 0.34 j327.79 ± 0.92 c
N1C1061.60 ± 0.36 h39.02 ± 0.53 h324.19 ± 1.89 a66.42 ± 0.19 i32.49 ± 0.52 i349.57 ± 1.04 a
N1C3088.95 ± 0.13 c57.17 ± 0.30 c468.14 ± 0.68 d90.78 ± 0.15 e44.23 ± 0.54 e477.78 ± 0.79 e
N1C5094.38 ± 0.23 a60.91 ± 0.21 a496.77 ± 1.23 b96.40 ± 0.16 a47.26 ± 0.31 a507.39 ± 0.82 b
N1C7089.87 ± 0.26 b57.43 ± 0.29 c473.02 ± 1.37 i94.21 ± 0.24 b46.05 ± 0.14 bc495.85 ± 1.29 i
N1C9076.96 ± 0.18 f49.76 ± 0.36 f405.05 ± 0.92 e82.71 ± 0.09 f40.68 ± 0.61 f435.31 ± 0.49 e
N2C071.51 ± 0.36 g45.03 ± 0.82 g286.03 ± 1.44 k72.72 ± 0.09 h35.10 ± 0.71 h290.89 ± 0.36 k
N2C1077.83 ± 0.28 e49.44 ± 0.57 f311.31 ± 1.09 f78.04 ± 0.13 g38.10 ± 0.48 g312.17 ± 0.53 f
N2C3089.07 ± 0.24 c56.02 ± 0.25 d356.27 ± 0.97 j93.27 ± 0.31 c45.30 ± 0.23 cd373.07 ± 1.24 j
N2C5094.03 ± 0.33 a59.97 ± 0.38 b376.11 ± 1.31 g96.23 ± 0.30 a46.76 ± 0.68 ab384.92 ± 1.21 g
N2C7089.43 ± 0.26 bc56.72 ± 0.63 cd357.74 ± 1.01 h91.90 ± 0.16 d44.66 ± 0.34 de367.61 ± 0.62 h
N2C9080.03 ± 0.40 d51.67 ± 0.36 e320.12 ± 1.61 c82.56 ± 0.18 f40.57 ± 0.44 f330.23 ± 0.69 c
ANOVA
B******************
N******************
B×N******************
Different lowercase letters denote significant differences among treatment means at the 0.05 level by Duncan’s MRT method. The bottom of this table reports the significance results of the two-way ANOVA. *** indicate significance level at p < 0.001, respectively; ns denotes no significance. Values are means ± standard error of the means.
Publisher’s Note: MDPI stays neutral with regard to jurisdictional claims in published maps and institutional affiliations.