Abstract
Field experiments testing rates of various nematicides, with and without NPZn fertiliser, were analysed to investigate how root-lesion nematode (Pratylenchus thornei) affects growth and yield components of susceptible/intolerant wheat cultivars in a subtropical environment. Plant response to nematode attack was assessed by regression and principal components analyses of various plant parameters at different crop development stages, in relation to different nematode population densities in the roots and root-zone soil. Reduction in P. thornei population densities by nematicides resulted in increased numbers of tillers, plant biomass, N and P concentrations and uptakes, numbers of spikes and kernels, and grain yield. Grain yield was strongly correlated with number of kernels, biomass and number of spikes, and negatively correlated with number of P. thornei in the root-zone soil at stem elongation. This study showed that P. thornei damage to roots decreased wheat yield through limiting N and P concentrations and uptakes in plant tops causing poor growth that commenced early and continued through the life of the crop. Genetic, environmental and management factors that reduce population densities of P. thornei, and decrease the impact of the nematodes starting in early crop growth, will greatly increase spike and kernel numbers and grain yield.
1. Introduction
Root-lesion nematodes (Pratylenchus spp.) infest roots of many plant species, and globally they constitute the third most economically important nematode group after cyst (Heterodera spp. and Globodera spp.) and root-knot nematodes (Meloidogyne spp.) [1,2]. In Australia, a number of species of root-lesion nematodes have been associated with yield loss of wheat (Triticum aestivum L.), particularly Pratylenchus thornei in the northern or subtropical grain region of eastern Australia [3], P. neglectus and P. thornei in the southern or temperate region [4], and P. neglectus and P. quasiterrioides in the western or mediterranean region [4,5]. There is evidence that P. thornei has been introduced to the subtropical grain region, and with continuous wheat cropping in the past, has built up to damaging population densities in many fields [6].
In the subtropical grain region of eastern Australia, as defined by Webb et al. [7], wheat is produced in the 600–800 mm median rainfall zone located ~200–400 km inland of the Pacific east coast. This region extends from the Central Highlands of Queensland (~22 °S) to the Liverpool Plains of New South Wales (~32 °S) at an elevation of ~200–500 m above sea level. Wheat is grown in the winter season (May to November) in flexible rotations with other winter cereal and legume crops, and with summer crops, particularly sorghum (Sorghum bicolor (L.) Moench). Rotation with sorghum, which is relatively resistant to P. thornei, is a key component of integrated management of P. thornei in this region [3], but other important rotational crops such as barley (Hordeum vulgare L.) [8], chickpea (Cicer arietinum L.) [9], and mungbean (Vigna radiata (L.) R.Wilczek) [10] are also hosts and together with wheat continue to increase P. thornei population densities. Use of tolerant and resistant wheat cultivars is another key component of integrated management, and tolerance and resistance ratings of wheat cultivars to P. thornei are made available to growers in annual sowing guides for the northern grain region. Resistance of wheat cultivars is assessed by final population densities of P. thornei in the plant roots and surrounding soil after 16 weeks growth in the glasshouse in soil inoculated with a standard initial population density [11]. Cultivar ratings are presented for growers in nine ordinal categories from resistant (R) to very susceptible (VS) based on data for final population densities of P. thornei from experiments combined by multi-environment trial (MET) analysis [11]. Tolerance is assessed by grain yield on managed field sites with high population densities of P. thornei. [12]. Cultivar ratings are presented for growers in nine ordinal categories from tolerant (T) to very intolerant (VI) based on data for grain yield over sites and years combined by MET analysis [12].
Grain production in this region is mainly on dark cracking clay soils known as vertisols [13], because they have high plant-available water capacity. This allows storage of soil water during fallows to supplement in-crop rainfall for dryland crop production. The initial fertility of the soils of the region has declined with grain cropping [14], and nitrogen (N) fertiliser is required to maintain yield and grain protein of the hard white spring wheat cultivars commonly grown for volume bread and noodle markets. Other fertiliser elements required for wheat production in the region are phosphorus (P) and zinc (Zn). In a previously published study in this region [15], P. thornei was shown to reduce the yield of wheat when grown after wheat following crop rotation from fallow and sorghum. Increases in wheat growth and yield were obtained from soil treatments with high rates of either of two nematicides, with the oxime carbamate aldicarb more effective than the organophosphate fenamiphos. The nematicides decreased population densities of P. thornei in the roots and root-zone soil, reduced vegetative symptoms of leaf yellowing in the wheat plants, and increased tillering, biomass production and grain yield. Furthermore, young wheat plants grown in nematicide treated soil, had increased nitrogen and phosphorus concentrations, where assessed in one experiment on a P. thornei-infested site. Since the same nematicides had no direct effects on concentrations of available nutrients in the soil, it was concluded that protection of the root system from nematode attack by the nematicides had restored root efficiency for nutrient acquisition [15].
No nematicides have been registered for use on grain crops in the subtropical grain region of eastern Australia. Following this exploratory work with two nematicides at high rates [15], experiments were conducted to test a wide range of nematicides at various rates to assess if economic control of P. thornei in this region is feasible. Many nematicides tested in these experiments have since been withdrawn from world markets for environmental concerns [16,17,18]. In this paper, the comprehensive experimental data collected in association with these experiments are examined to investigate in more detail the effects of P. thornei on nutrient concentrations, uptakes, growth and yield, and yield components of wheat in the environment of the Australian subtropical grain region. The results provide new information on the impact of the nematodes on uptake of N and P by young wheat plants and effects on the subsequent wheat growth and components of grain yield. This information is valuable (a) for designing strategies for integrated management of P. thornei on farms, (b) for modifying crop growth models in order to simulate the effects of P. thornei on wheat production in this environment, and (c) for guidance in assessing next-generation nematicides [17,18,19] for potential responses in wheat under field conditions appropriate to the region.
2. Materials and Methods
2.1. Field Sites
Four field experiments were conducted to test a range of nematicides, at a range of rates, for response of wheat crops at three locations in fields infested with P. thornei. The highest rates of most of the nematicides were also tested with and without a mixed fertiliser of N, P and Zn. The sites, all on the Darling Downs of Queensland, Australia, were near Formartin (Lat. 27.46 °S; Long. 151.43 °E; elevation 364 m), Macalister (Lat. 27.03 °S; Long. 151.07 °E; elevation 337 m) and Pirrinuan (Lat. 27.03 °S; Long. 151.23 °E; elevation 359 m). Experiment 1 (at Formartin) and Experiment 2 (at Macalister) were conducted in Year 1; Experiment 3 (at Formartin) and Experiment 4 (at Pirrinuan) were conducted in Year 2. Experiments 1 and 3 were sown on land that had grown wheat the previous winter season after long fallow (14 months) from sorghum. Experiments 2 and 4 were sown on land that had grown four and three wheat crops, respectively, after long fallow from sorghum.
2.2. Soil Properties
The soils at all three sites are Black Vertosols in the Australian classification [20] or Typic Pellusterts in the USDA classification [21]. All belong to the Waco Series [22], which are very deep (>1.8 m), black to greyish-brown, self-mulching, cracking clay soils. The soil profiles to 120 cm depth at the Formartin and Macalister sites were characterised for particle size by the pipette method ([23], and for chemical properties by other standard methods [24] under the code numbers 3A1 = electrical conductivity (1 soil: 5 water), 4A1 = pH (1 soil: 5 water), 6A1 = organic carbon, and 7A2 = total nitrogen. These results are given in Supplementary Table S1. Similar properties of the soil at the Pirrinuan site have been given elsewhere [25]. In summary, the soils at all sites are relatively uniform with high clay content (~70%) through the profile to 120 cm. They are alkaline (pH 8.5 in topsoil to 9.3 in subsoil), low in organic matter (0.9% organic C in topsoil grading to 0.6% in subsoil), low in total N (0.06 to 0.07% N in topsoil grading to 0.02 to 0.04 in subsoil), and slightly saline deeper in the profile than 60 cm as gauged by electrical conductivity (0.67 to 1.2 dS/m).
2.3. Soil Moisture, Plant Nutrients and Nematode Population Densities in the Soil Profile before Sowing
Before sowing each experiment, the soil profile to 120 cm depth was sampled in nine positions on a grid pattern across the site, with a vehicle-mounted hydraulic push corer of 45 mm diameter. The soil cores were separated into depth intervals of 0–15, 15–30, 30–45, 45–60, 60–90 and 90–120 cm and sealed in plastic bags. In Year 1, the top layers were divided into 0–10, 10–30 cm intervals. On return to the laboratory, the soil in each core from each depth interval was manually broken into pieces of <1 cm across and mixed. Soil gravimetric water content (GWC) was determined from a 100 g subsample dried in a forced draught oven at 105 °C for 2 days. Volumetric water content (VWC) was calculated from GWC and pre-determined bulk densities (BD) for each soil depth layer. Plant-available water (PAW) at sampling was calculated from VWC and pre-determined crop lower limits (CLL) for wheat at each depth and summed over the profile to 120 cm depth using the following equations:
where GWC = gravimetric water content (%), FWt = fresh weight, DWt = oven dry weight, VWC = volumetric water content (%), BD = bulk density (g/mL), PAW = plant-available water (mm), CLL = crop lower limit for wheat (%).
For other chemical analyses, four soil cores of 0–10 cm depth were collected at random within 4 m of each deep soil core and sealed in plastic bags. On return to the laboratory, the soil cores were air-dried in a forced-draught oven at 40 °C for 4 days, and ground to pass a 2 mm sieve.
Soil chemical analyses were conducted in duplicate according to standard methods [24] under the following alphanumeric test codes: (a) 7C2 mineral N (100 g field-moist soil extracted in 300 mL of 2N KCl for 1 h before auto-analysis for NH4+ and NO3−); (b) 9B2 Colwell bicarbonate-extractable P [26]; and (c) 12A1 DTPA-extractable Zn ([27]), with analysis by atomic absorption spectrometry. Mineral nitrogen concentrations (NH4+ and NO3−)-N were converted to kg/ha using the respective bulk density for each depth interval and summed over the 120 cm profile.
Nematodes were extracted from 200 mL field-moist soil subsamples for 2 days by the Whitehead tray method [28], then collected on a 63 µm mesh sieve in ~15 mL water. Pratylenchus thornei and Merlinius brevidens were identified [29,30] and counted in a 1 mL gridded slide [31] under a compound microscope at ×100 magnification. Nematode population densities were expressed per kg soil (oven dry equivalent).
2.4. Experimental Design and Application of Fertiliser and Nematicides
The nematicides and the rates used in each experiment are given in Table 1.

Table 1.
Nematicides used in the experiments.
Fertiliser treatments (nil, or a single fertiliser treatment of N120:P30:Zn15 kg/ha as a mixture of urea, triple superphosphate, and zinc sulphate monohydrate, respectively) were applied before sowing in a design allowing for factorial combinations with nematicide treatments (nil and the highest rate of each nematicide). All treatment combinations of nematicides and fertiliser (62 treatments in Experiments 1 and 2; 64 treatments in Experiments 3 and 4) were replicated in three completely randomised blocks with a separate experimental layout for each experiment. The wheat cultivar Banks (rated susceptible, and intolerant to very intolerant) in Experiments 1 and 2, and cv. Gatcher (rated susceptible to very susceptible, and very intolerant) in Experiments 3 and 4, were sown at 30 kg/ha through the seed box of a combine seed drill at 5 to 10 cm in depth. All nematicides were applied through a separate applicator on the seed drill to enter the drill row with the seed at sowing. One exception was the highest rate of aldicarb (10 kg/ha) used in Experiments 1 and 2, which was incorporated into the topsoil with several passes of the drill combine at 10 cm depth before sowing. The volatile nematicides ethylene dibromide (EDB) and 1,3-dichloropropene (1,3-D) were applied as a liquid at 95 kPa pressure through a microtubule applicator [32,33]. The oxamyl and furadan seed treater products were mixed with weighed quantities of seed in sealed jars on a roller to evenly coat the seed at the target rates of nematicide, and then allowed to air dry. This treated seed was sown via the cone of the seed drill. Three replicates of two nil control treatments were included in the experiment to compare with treatments sown through the seed box or through the cone. Field plots were sown in dimensions of 20 m in length ×9 rows at 25 cm spacing in Experiments 1 and 2, and 20 m in length ×7 rows at 25 cm spacing in Experiments 3 and 4.
2.5. Measurement of Crop Emergence, Growth and Development, and Nematode Numbers
Schedules of the field operations for the experiments are given in Table 2.
Table 2.
Schedules of field operations for Experiments 1–4.
Emerged plants were counted in 2 m lengths of row in four positions per plot at 26 to 35 days after sowing (DAS). The rows were selected at random from the middle five rows, and the four positions were spaced about equidistant along the length of the plot. The plants were at the 3-leaf stage (Zadoks growth stage Z13 [34]) in Experiments 1 (29 DAS) and 2 (26 DAS), and at early tillering (Z21–Z22) in Experiments 3 (35 DAS) and 4 (29 DAS). The plots were rated on a 0–5 scale when the plants were at late tillering in Experiment 3 (67 DAS) and Experiment 4 (63 DAS). The scale used was 0 = plant death; 1 = whole plants chlorotic and stunted; 2 = poor plant growth with obvious chlorosis; 3 = uneven poor plant growth with marked chlorosis in lower leaves; 4 = even plant growth of a light green colour; and 5 = good plant growth of a dark green colour. When plants were at the stem elongation stage in Experiment 2 (80 DAS, Z35) and Experiment 4 (72 DAS, Z32), the number of plants and tillers were counted in two quadrats of 2 m × 2 rows selected from the middle five rows positioned about equidistant along the plot length. Plants were excavated with a garden fork, taking soil with roots from an approximately 25 cm length of row × 20 cm in width × 20 cm in depth at each of four positions in the middle five rows about equidistant along the length of the plot. On return to the laboratory, roots were manually removed from the soil and extracted for nematodes by misting [35] for 4 days. Subsamples (150 g) of the root-zone soil were extracted for nematodes by the Whitehead tray method [28], and P. thornei and M. brevidens were counted as described above.
When the crop was at heading (Z55) in Experiment 2 (100 DAS), or anthesis (Z65) in Experiment 3 (114 DAS) and Experiment 4 (107 DAS), two quadrats of two rows ×1 m were sampled from about equidistant along the plot length from the middle five rows of each plot by counting number of spikes. Plants were then then cut at ground level into paper bags for determination of biomass by drying at 65 °C in a forced draught oven for 4 days. Ripened grain (Z92) was obtained with a small plot combine harvester (Kingaroy Engineering Works, Kingaroy, QLD, Australia). Grain moisture was determined by drying subsamples at 80 °C in a forced draught oven for 2 days. Grain yield was derived from the weight of grain harvested per plot, and is expressed in kg/ha at 12% moisture content equivalent. Kernel weight was determined from subsamples of 200 kernels, and used to calculate number of kernels/m2 from grain yield. Grain weight per spike was derived from grain yield and number of spikes/m2.
2.6. Observations of Root Lesions, Nematodes Inside Roots, and Root Colonisation with Arbuscular Mycorrhizal Fungi
Roots were recovered from P. thornei-affected wheat cv. Gatcher at the Macalister site by digging up six plants with a garden fork and repeated washing of the root systems to remove adhering soil. Photographs were taken of the lesioned root systems. The roots were cut into ~1 cm pieces and samples of 0.5 g in vials were covered with 0.1% acid fuchsin in lactophenol, and heated for 3 min in a boiling water bath to stain the nematodes, then stored in lactic acid with one drop of dilute hydrochloric acid to leach stain from the root tissue. Root pieces were mounted on slides and examined under a compound microscope. Other samples were stained with 0.05% acid fuchsin or 0.05% trypan blue to visualize both nematodes and arbuscular mycorrhizal fungi (AMF) in the root pieces.
A 0.3 g subsample of the roots of cv Banks, obtained at Z35 (stem elongation) for nematode extraction at 80 DAS, from each plot in Experiment 2, was stained for AMF with trypan blue after clearing root tissue with KOH [36]. The percentage root length colonised with AMF was determined by the grid intersect method [37].
2.7. Plant Chemical Analyses
For Experiments 2, 3 and 4, samples of dried plant biomass and grain were ground and subjected to micro-Kjeldahl digestion before analysis for N [38] and P [39]. Results were expressed as N and P concentrations (%), and uptakes (kg/ha) calculated from N and P concentrations and biomasses.
2.8. Rainfall
The monthly and annual rainfalls relevant to the experiments at Formartin, Macalister and Pirrinuan are given in Table 3, in comparison with average long-term monthly and annual rainfalls from the nearest Bureau of Meteorology (BOM) sites and farm records. For all experiments, there was sufficient rainfall in May to provide soil moisture for sowing. In Year 1 for Experiment 1 at Formartin, the growing season for wheat was relatively dry with little rainfall in June, average rainfall in July and August, none in September and above average in October. Similarly, in Year 1 for Experiment 2 at Macalister, there was little rainfall in both June and July, above average in August, none in September and well above average in October. In Year 2 for Experiment 3 at Formartin and Experiment 4 at Pirrinuan, there was above-average rainfall in the early part of the growing season in June and July, average in August and well below average in both September and October.
Table 3.
Monthly and annual rainfall during the experiments compared with long-term averages for (a) Formartin (farm records for 65 years, and Bureau of Meteorology (BOM) site at nearby Jondaryan for 123 years), (b) Macalister (BOM for 111 years), and (c) Wyobie (BOM for 54 years) near Pirrinuan, QLD, Australia.
2.9. Soil Water and Available Nutrients
Plant-available water stored in the soil profile (0–120 cm) before sowing crops in all experiments ranged from 77 mm for Experiment 2 to 172 mm for Experiment 1 (Table 4). Mineral nitrogen in the soil profile ranged from 109 kg N/ha for Experiment 2 to 281 kg N/ha for Experiment 3. All experiments had moderately low levels of bicarbonate-extractable P (range 13.2 to 15.7 mg P/kg soil). Levels of DTPA-extractable Zn in the topsoil were adequate for wheat in Experiments 1 and 4, but lower for Experiment 2.
Table 4.
Characterisation of experimental field sites for plant-available water and available N, P and Zn in the soil before sowing. Values are the means of nine cores ± standard deviations.
2.10. Statistical Analysis
All plant and nematode data were statistically analysed by analysis of variance (ANOVA) of all treatments, as well as by two-way ANOVA of the factorial treatment structure of ± nematicide (at highest rate) by ± fertiliser. Count data for nematodes were transformed by ln (x +1) before statistical analysis, and percentage of root length colonised with AMF was transformed by arcsin √proportion for conformation to normal distributions. For variables where the F test from ANOVA was statistically significant at P ≤ 0.05, a protected least significant difference was calculated and is presented as the l.s.d. (P = 0.05).
Principal components analysis (PCA) was conducted in Genstat [40] for Experiments 2 and 4 based on the individual treatment combinations and variates. Treatments for which no chemical analyses of plant material were available (that is, the lower rates of nematicides other than aldicarb) were not included in the principal components analysis for Experiment 4. The PCA was based on the correlation matrix between variates. Results were displayed as a bi-plot with treatment scores and variate loadings both standardised by the latent roots for the first two principal components, respectively.
Asymptotic exponential regression analysis in Genstat was used to relate grain yield to rate of the nematicide aldicarb for all experiments, and to relate various plant variables, including grain yield, to ln (P. thornei /kg root-zone soil) at Z32 (stem elongation) in Experiment 4. Linear regression was used to relate grain yield to other plant variables in Experiment 4.
3. Results
3.1. Population Densities of Pratylenchus thornei and Merlinius brevidens in the Soil Profile before Sowing
There were high population densities of P. thornei in the soil profile before sowing Experiments 2, 3 and 4 (Figure 1), which were well above the arbitrary threshold of damage of 2000/kg soil at any depth in the profile [6]. No pre-sowing nematode data were obtained for Experiment 1, but the site was known to be infested with P. thornei [15]. Maximum population densities at any depth interval were present in the soil profile for Experiment 3 with 18,120 and 17,520/kg soil in the 15–30 and 30–60 cm depth intervals, respectively. Next most P. thornei were in the soil profile for Experiment 2 with maximum population density of 14,380/kg soil in the 30–60 cm depth interval. The average pre-sowing population densities over the whole 0–90 cm profile for Experiments 2, 3 and 4 were, respectively, 8720, 7310 and 6080 P. thornei/kg soil. For Experiment 4, most P. thornei were closer to the top of the soil profile than for the other experiments, with 9740 and 10,850/kg soil in the 0–15 and 15–30 cm depth intervals, respectively. The percentage distributions of P. thornei in the three depth intervals 0–30, 30–60 and 60–90 cm were, respectively, (a) 17%, 50% and 33% for Experiment 2, (b) 27%, 53% and 20%, for Experiment 3, and (c) 49%, 37% and 14% for Experiment 4. There was a low population density of M. brevidens in the soil profile before sowing Experiment 2, with 410/kg soil at 0–15 cm, 600/kg at 15–30 and 80/kg soil at 30–60 cm depths. There was an even lower population density of M. brevidens in the soil profile before sowing Experiment 4 ranging from 60 M. brevidens/kg soil at 0–15 cm depth to 30 at 90–120 cm depth. No M. brevidens were detected in the soil profile before sowing Experiment 3.
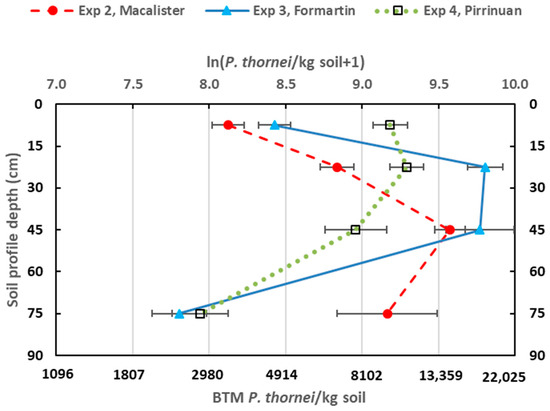
Figure 1.
Population densities of Pratylenchus thornei in the soil profile before sowing Experiments 2, 3 and 4. Means of ln (P. thornei/kg soil + 1) are plotted on the top X axis with back-transformed mean (BTM) values indicated on the bottom X axis. Bar markers are SEM.
3.2. Experimental Data
Complete sets of mean values with F probabilities for significance from ANOVA with l.s.d. values are given for the plant and nematode variables measured in Experiments 1, 2, 3 and 4 in Supplementary Tables S2, S3, S4 and S5, respectively (Supplementary Materials)
3.3. Plant Establishment
Most treatments had plant populations that were not significantly different from the untreated control when counted at the 3-leaf stage in Experiments 1 and 2. However, the nematicide ethoprop was very phytotoxic, reducing the number of plants below the untreated control by 96 and 97% at 4 kg/ha, and by 24 and 30% at the lowest rate of 0.5 kg/ha in Experiments 1 and 2, respectively. Additionally, fensulfothion at 4 kg/ha reduced the number of plants by 21 and 29% in Experiments 1 and 2, respectively. Oxamyl seed treatment reduced the number of plants by 41 and 46% with 12 g oxamyl/kg seed, and by 24 and 33% with 3 g oxamyl/kg seed, in Experiments 1 and 2, respectively. Similarly, carbofuran seed treatment reduced number of plants by 18% with 3 g carbofuran/kg seed in Experiment 1, and by 21% with 12 g/kg in Experiment 2. Consequently, ethoprop was not tested again, and the sowing rate of the seed treatments was increased by 20% in Experiments 3 and 4.
3.4. Grain Yield
There were significant effects of nematicide and fertiliser treatments on grain yield in all four experiments. Aldicarb was the nematicide that increased grain yield most consistently. The effects on grain yield of the higher rates of aldicarb with and without NPZn fertiliser are shown in Figure 2. In the first year, aldicarb resulted in yield increases of up to 36% and 20% without fertiliser, and up to 45% and 53% with fertiliser, in Experiment 1 (Figure 2a) and Experiment 2 (Figure 2b), respectively, compared to the control treatment with no nematicide or fertiliser. In these Year 1 experiments, fertiliser applied in the absence of nematicide resulted in yield decreases of 6% and 9% in Experiments 1 and 2, respectively. In the second year, aldicarb resulted in yield increases of 44% and 70% without fertiliser, and 63% and 67% with fertiliser, in Experiment 3 (Figure 2c) and Experiment 4 (Figure 2d), respectively. In these Year 2 experiments, fertiliser applied without nematicide resulted in 16% and 25% yield increases in Experiment 3 and Experiment 4, respectively.
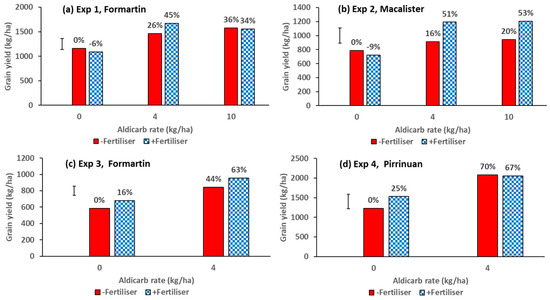
Figure 2.
Effects of the nematicide aldicarb (0, 4 or 10 kg/ha) and fertiliser (0 or N120P30Zn15 kg/ha) on grain yield from (a) Experiment 1, (b) Experiment 2, (c) Experiment 3, and (d) Experiment 4. The 4 kg/ha rate of aldicarb was applied in the seed row and the 10 kg/ha rate was incorporated in the soil before sowing. Values above bars are percentage yield increase above control treatment without nematicide or fertiliser. Bar marker = l.s.d. (P = 0.05).
Asymptotic exponential equations effectively modelled the response in grain yield to rate of aldicarb applied without fertiliser in all four experiments (Figure 3). Grain yield was most responsive to rate of aldicarb in Experiment 4.
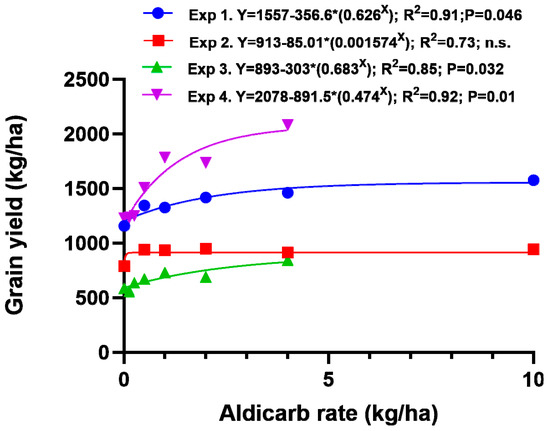
Figure 3.
Grain yield response to rate of aldicarb applied in the seed row (rates up to 4 kg/ha) or incorporated before sowing (10 kg/ha rate) without additional fertiliser in four field experiments.
3.5. Ordination of Treatments Based on Multivariate Analysis of Nematode and Plant Variates
3.5.1. Principal Components Analysis of Experiment 2
The principal components analysis of Experiment 2 captured in PC1 and PC2 57.4% of the variance of 14 nematode and plant variates determined for 58 treatments. These treatments comprised different nematicides at various rates of application, with the highest rate of each nematicide tested both with and without fertiliser (Figure 4). Strongly positive loadings for PC1 (accounting for 40.3% of the variance) were for grain yield, number of spikes/m2 and biomass at 100 DAS, N% of the grain, N% of biomass, and number of tillers/m2 at 80 DAS (Figure 4). By contrast, strongly negative loadings for PC1 were for number of P. thornei per g root, per root system and per kg of root-zone soil, and number of M. brevidens/kg root-zone soil.
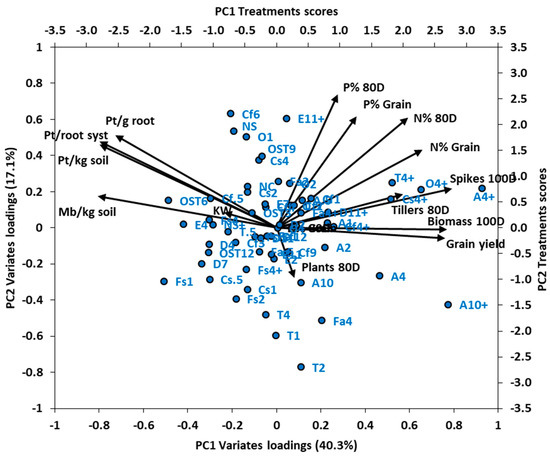
Figure 4.
Experiment 2: Bi-plot of principal components axes PC1 and PC2, depicting vectors of loadings of 14 variates, and scores for 58 nematicide and fertiliser treatment combinations as points. Percentage of variance explained by PC1 and PC2 is given in parenthesis on respective axes. Variate names in black at end of vectors have abbreviations: Pt = Pratylenchus thornei, Mb = Merlinius brevidens, D = days after sowing, KW = kernel weight. Treatment names in blue alongside points have abbreviations NS = nil nematicide (seed box), NC = nil nematicide (cone), A = aldicarb, O = oxamyl, Cf = carbofuran, Cs = carbosulfan, Cl = cleothocarb, T = terbuphos, Fa = fenamiphos, Fs = fensulphothion, E = ethylene dibromide, D = 1,3-dichloropropene, OST = oxamyl seed treatment, CfST = carbofuran seed treatment, numbers = nematicide rate (kg/ha for most nematicides; L/ha for E and D, g/kg seed for OST and CFST), + indicates fertiliser (N120P30Zn15 kg/ha.
Treatments that had high positive scores along PC1 and therefore were associated with lower nematode population densities, and better plant growth and yield, were aldicarb 4 + fertiliser, aldicarb 10 + fertiliser, oxamyl + fertiliser, carbosulfan + fertiliser, terbufos 4 + fertiliser and aldicarb 4 without fertiliser (Figure 4). Notably, all these treatments with high positive scores were for nematicides combined with fertiliser, except for aldicarb at 4 kg/ha without fertiliser.
3.5.2. Principal Components Analysis of Experiment 4
The principal components analysis of Experiment 4 captured in PC1 and PC2 63.1% of the variance of 20 nematode and plant variates for 33 treatment combinations of different nematicides at various rates of application and fertiliser (Figure 5). Strongly positive loadings for PC1 (accounting for 47.7% of the variance) were for the following variates: growth rating at 63 DAS, crop biomass at both 72 DAS and 107 DAS, number of tillers/m2 at 72 DAS, plant P concentration at 72 DAS, plant N concentration at 72 DAS, number of spikes/m2 at 107 DAS, grain yield and grain N concentration (Figure 5). Strongly negative loadings for PC1 were for number of P. thornei per g root, per root system and per kg of root-zone soil, P concentration of grain and of plant material at 107 DAS, and number of M. brevidens/kg root-zone soil. A strongly positive loading for PC2 (accounting for 15.4% of the variance) was for plant density at 72 DAS, and a strongly negative loading was for kernel weight. In the bi-plot, grain yield was diametrically opposed to ln (P. thornei/kg soil) and strongly associated with spikes/m2 and biomass at 107 DAS.
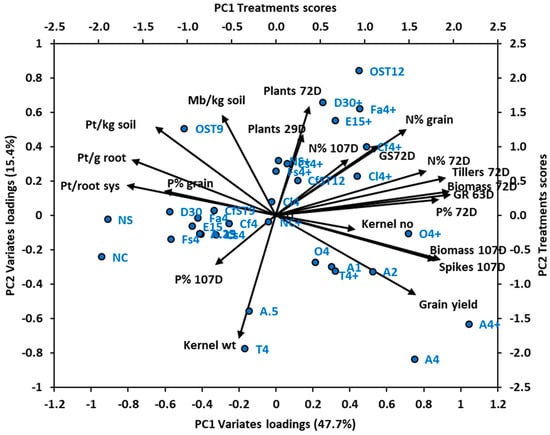
Figure 5.
Experiment 4: Bi-plot of principal components axes PC1 and PC2, depicting vectors of loadings of 20 variates, and scores for 33 nematicide and fertiliser treatment combinations. Percentage of variance explained by PC1 and PC2 is given in parenthesis on respective axes. Variate names in black at end of vectors have abbreviations: Pt = Pratylenchus thornei, Mb = Merlinius brevidens, D = days after sowing, GS = growth stage. Treatments names in blue have abbreviations NS = nil nematicide seed box control, NC = nil nematicide cone control, A = aldicarb, O = oxamyl, Cf = carbofuran, Cs = carbosulfan, Cl = cleothocarb, T = terbuphos, Fs = fensulphothion, E = ethylene dibromide, D = 1,3-dichloropropene, OST = oxamyl seed treatment, CfST = carbofuran seed treatment, numbers = nematicide rate (kg/ha for most nematicides; L/ha for E and D, g/kg seed for OST and CfST), + indicates fertiliser (N120P30Zn15 kg/ha).
Large positive scores on PC1 for individual treatments were for aldicarb 4 + fertiliser, aldicarb 4 without fertiliser, oxamyl 4 + fertiliser, and aldicarb 2 without fertiliser (Figure 5). Large negative scores on PC1 were for nil (cone), nil (seed box), 1,3-D at 30 L/ha, and fensulfothion. A large positive score on PC2 for individual treatments was for oxamyl ST 12 g/kg, and a large negative score on PC2 was for aldicarb 4 without fertiliser, and terbufos 4 without fertiliser. The individual treatments that had scores most closely associated with high grain yield were aldicarb 4 + fertiliser and aldicarb 4 without fertiliser (Figure 5).
3.6. Depression of P. thornei Population Densities in the Root-Zone Soil and in the Roots at 72 DAS in Response to Aldicarb Rate in Experiment 4
The population density of P. thornei in the root-zone soil or in the roots at 72 DAS (Z32, stem elongation), in response to rate of aldicarb in the seed row at sowing, followed exponential decline curves (Figure 6). Without aldicarb there were 9,820 P. thornei/kg root-zone soil and 392 P. thornei/g roots, and with the highest rate of 4 kg aldicarb/ha there were only 13 P. thornei/kg root-zone soil and 2 P. thornei/g roots. It was difficult to remove the roots from the clay soil manually, and it was considered that much of the fine root was left in the root-zone soil. Therefore, the effects of P. thornei on plant variables have been investigated in the following Section 3.7 using regression analysis with P. thornei in the root-zone soil as the explanatory variable.
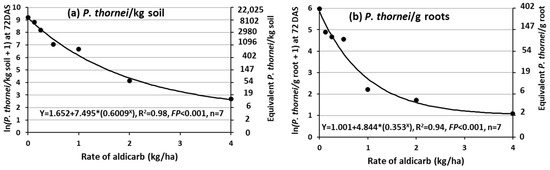
Figure 6.
Effects of rate of the nematicide aldicarb applied in the seed row at sowing of wheat on Pratylenchus thornei (a) in the root-zone soil or (b) roots of wheat at 72 DAS in Experiment 4.
3.7. Relation between Wheat Plant Variables and P. thornei Population Densities in the Root-Zone Soil at 72 DAS in Experiment 4
The effect of the nematodes on reducing crop growth was already evident in ratings made at 63 DAS (Figure 7a), and in biomass (Figure 7b), number of tillers/m2 (Figure 7c) and biomass per tiller (Figure 7d) determined at 72 DAS (Z32, stem elongation). The regression equations follow an asymptotic exponential curve when plotted against ln (P. thornei/kg soil + 1).
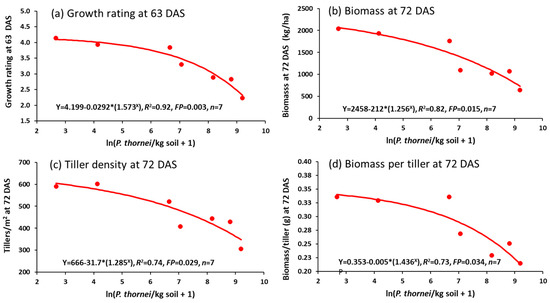
Figure 7.
Relationships between wheat growth variables of (a) growth rating at 63 DAS, (b) biomass at 72 DAS, (c) number of tillers/m2 at 72 DAS or (d) biomass per tiller, and explanatory variable ln(Pratylenchus thornei/kg root-zone soil at 72 DAS in Experiment 4.
The N and P concentrations and uptakes into the plant biomass at 72 DAS were clearly reduced with increasing P. thornei population density in the root-zone soil (Figure 8a–d, respectively).
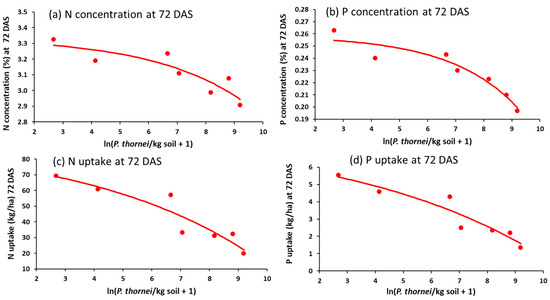
Figure 8.
Relationship between wheat nutrient variables at 72 DAS (a) N concentration, (b) N uptake, (c) P concentration, or (d) P uptake, and explanatory variable ln(Pratylenchus thornei/kg root-zone soil at 72 DAS in Experiment 4.
Later in crop growth at 107 DAS (Z65, anthesis), the higher population densities of P. thornei had substantially reduced total crop biomass and number of spikes/m2 density (Figure 9a,b). There were clear effects of higher P. thornei population densities reducing N and P uptakes (Figure 9c,d), but not N and P concentrations at this growth stage.
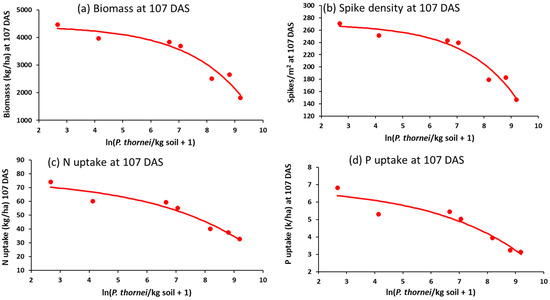
Figure 9.
Relationships between wheat growth or nutrient variables at 107 DAS, namely, (a) biomass, (b) number of spikes/m2, (c) N uptake or (d) P uptake, and explanatory variable ln(Pratylenchus thornei/kg root-zone soil at 72 DAS in Experiment 4.
Grain yield and kernel number/m2 were reduced quantitatively by increasing nematode population densities (Figure 10a,b).
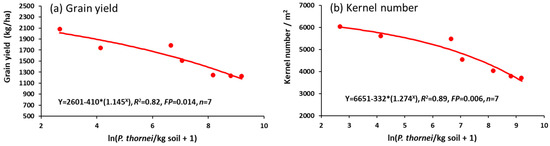
Figure 10.
Relationships between wheat grain variables (a) grain yield, or (b) kernel number/m2, and explanatory variable ln(Pratylenchus thornei/kg root-zone soil) at 72 DAS in Experiment 4.
3.8. Effects of Fertiliser and Aldicarb Treatments on Progressive Uptake of N and P in Wheat Biomass and on Grain Protein in Experiment 4
The application of fertiliser increased the N uptake in the plant tops at stem elongation; aldicarb applied alone increased it further and the combination of both increased it even more (Figure 11a). However, at anthesis, the effect of fertiliser alone was non-significant, whereas the effect of aldicarb applied either alone or in combination with fertiliser was substantial in improving N uptake (Figure 11a). The N uptake in the grain followed the same rank order with fertiliser alone giving an increase, and aldicarb alone or combined with fertiliser giving a further increase. There were very large responses in P uptake to aldicarb, but not to fertiliser in the plant biomass at stem elongation and anthesis (Figure 11b). Similarly, for P uptake in the grain there was a small increase due to P fertiliser and a larger increase due to aldicarb (Figure 11b). Grain from the untreated control treatments had 13.8% protein, which is above the threshold of 13% required for grain to be accepted into the top classification of Australian Prime Hard. Fertiliser applied alone resulted in an increase in protein to 14.8% and when combined with aldicarb to 15.2% (Figure 11c).
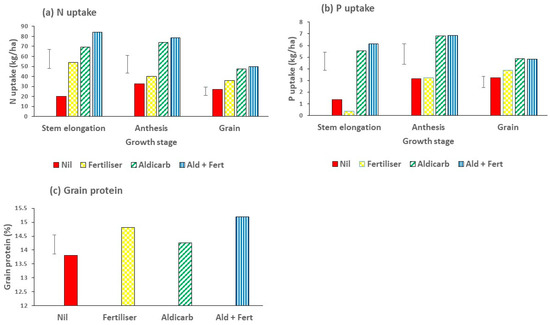
Figure 11.
Effects of the nematicide aldicarb (4 kg/ha) and fertiliser (N120P30Zn15 kg/ha) on (a) N uptake and (b) P uptake at different stages of wheat growth, namely stem elongation (Z32), anthesis (Z65) and ripened grain (Z92); and (c) grain protein in Experiment 4. Bar marker = l.s.d. (P = 0.05).
3.9. Effects of Highest Rate of All Nematicides with and without Fertiliser on Nematode Population Densities, Wheat Growth and Yield in Experiment 4
Factorial ANOVA for the highest rate of each nematicide with and without fertiliser showed a main effect of nematicide on nematode population densities at 72 DAS, but no effect of fertiliser (Supplementary Figure S1). Aldicarb was clearly superior for control of P. thornei followed by oxamyl and carbofuran, then carbosulfan, cleothocarb, terbuphos and fenamiphos. The seed treatments of oxamyl and carbofuran had small effects and EDB and 1,3-dichloropropene had no significant effect on P. thornei population densitiy. The low population density of M. brevidens was also significantly reduced by oxamyl and cleothocarb to a similar extent to aldicarb, then by terbuphos, fenamiphos, carbofuran and carbosulfan in decreasing magnitude of effect.
In early growth stages (63 and 72 DAS), oxamyl was the next most effective nematicide after aldicarb in increasing the growth rating, biomass, weight/plant, tillers/m2, and weight/tiller above untreated controls (Supplementary Figure S2). Fertiliser alone also increased these plant variables. There were significant interactions between nematicide and fertiliser treatments in plant biomass and tillers/m2 at 72 DAS (Supplementary Figure S3). Effective nematicides applied without fertiliser increased these variables substantially with then a smaller additional response to fertiliser applied with the nematicide. There were responses to fertiliser applied alone or with the ineffective nematicides, but these responses were not as great as to the combination of effective nematicides and fertiliser. (Supplementary Figure S3).
Oxamyl increased the N concentration and uptake in the plant tops at 72 DAS, the most after aldicarb, followed by cleothocarb (Supplementary Figure S4). There were also substantial main effects of fertiliser on N concentration and uptake. Aldicarb and oxamyl followed by cleothocarb increased P concentration and P uptake, with fertiliser having a significant but lesser main effect.
At 107 DAS (anthesis), the number of spikes/m2, biomass, N uptake and P uptake were greatest with aldicarb followed by oxamyl, then carbofuran and terbuphos (Supplementary Figure S5). There was also a main effect response to fertiliser, but this was not as great as to the more effective nematicides.
Greatest response in grain yield was to aldicarb, followed by oxamyl and terbuphos (Supplementary Figure S6). Terbufos produced the highest kernel weight. Kernel number/m2 was most responsive to aldicarb, followed by oxamyl and terbuphos. Kernel number/m2 was also responsive to fertiliser (Supplementary Figure S6).
3.10. Relation between Grain Yield and Other Variables of Wheat Growth in Experiment 4
Across all 64 treatments, there were highly significant linear relationships between grain yield and number of kernels/m2 (Figure 12a) and biomass at 107 DAS (Figure 12b) in particular, then number of spikes/m2 at 107 DAS (Figure 12c), biomass at 72 DAS (Figure 12d), growth rating at 63 DAS (Figure 12e) and number of tillers/m2 at 72 DAS (Figure 12f). For a selected set of 33 treatments that were analysed chemically, there were highly significant relationships between grain yield and N and P concentrations at 72 DAS (Figure 12g,h).
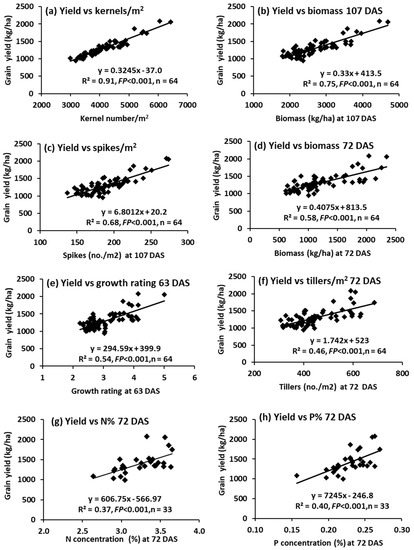
Figure 12.
Experiment 4: Regression relationships between grain yield (Y) and other plant variables (X) for all treatment combinations (n = 64 for all variables, except n = 33 for nutrient concentrations at 72 DAS): (a) kernel number/m2, (b) biomass (kg/ha) at 107 DAS, (c) number of spikes/m2 at 107 DAS, (d) biomass (kg/ha) at 72 DAS, (e) growth rating (0–6) at 63 DAS, (f) number of tillers/m2 at 72 DAS, (g) N concentration (%) at 72 DAS, and (h) P concentration (%) at 72 DAS.
The relationships between grain yield and other components of grain yield, although statistically significant, were of much lesser influence. Thus, for linear regression of grain yield as the response variable and yield components as the explanatory variable, results were for grain weight/spike R2 = 0.20, FP < 0.001, n = 64; number of kernels/spike R2 = 0.12, FP = 0.003, n = 64; and kernel weight R2 = 0.09, FP = 0.009, n = 64 (data not shown graphically).
3.11. Observations of Root Lesions, Nematodes Inside Roots and Root Colonisation with Arbuscular Mycorrhizal Fungi
Dark lesions due to P. thornei were present on both the seminal roots and crown roots of field-grown wheat cv. Gatcher (Figure 13a,b). In stained young roots under the microscope, P. thornei was visible in clusters in the inner cortex aligned parallel with the root axis (Figure 13c). Brown-pigmented lesioned areas also had many P. thornei vermiform life stages and eggs in the roots, and these areas also exhibited sloughed off epidermis and severely damaged cortex (Figure 13d). Under slight pressure on the coverslip of the slide, nematodes and eggs streamed out of the damaged roots (Figure 13e).
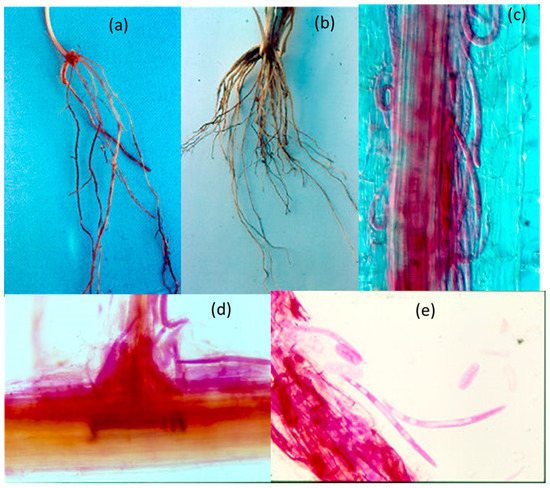
Figure 13.
Dark lesions (a) on the seminal root system and (b) crown root system of field-grown wheat cv. Gatcher at Macalister; and P. thornei (c) stained with acid fuchsin in the cortex of a young root, (d) in damaged cortical tissue at the site of a root branch, and (e) vermiform stages and eggs streaming from damaged root tissue.
Observations of roots stained to visualize both P. thornei and AMF provided no evidence of direct antagonism between them, with both vermiform nematodes and AMF hyphae seen in the cortical tissue in close proximity to each other.
There were no significant effects of either nematicide or fertiliser treatments on the percentage of the root length colonised with AMF at the booting stage of wheat cv. Banks in Experiment 2. The mean back-transformed percentage colonisation was 25.5%. Mean values for the nematicide x fertiliser treatment combinations from the ANOVA are given in Supplementary Table S6.
4. Discussion
Results from the experiments reported here indicate that P. thornei starts to affect the growth of susceptible/intolerant wheat cultivars early in their life. The nematodes residual in the soil from the previous crop invade the roots, and feed and reproduce in the root cortex, where they cause lesions, as shown here for field-grown wheat. Clearly, this nematode species is capable of severely damaging the root cortex of wheat in the field. The cavities the nematodes cause in the cortex can threaten the integrity of the stele [41], thereby restricting conduction of water and nutrients in the xylem and phloem.
The effects on the plant shoots of this type of root damage were visible early in the life of the wheat crops in our experiments as reduced growth, noticeable yellowing, particularly of the lower leaves, and leaf rolling indicating water stress. Ratings of the plant growth in field plots at 63 DAS, based on overall appearance of these symptoms, showed that they were directly related to population densities of P. thornei in the root-zone soil. Furthermore, it was shown that these growth ratings were predictive of subsequent grain yield. These symptoms are similar to those caused by deficiencies of N and P in the soil, and in fact the plants affected by nematode attack were shown to have lower concentrations and uptakes of N and P at the stem elongation growth stage, than plants protected by effective nematicide. The extent of damage to susceptible/intolerant wheat crops from P. thornei will depend on the pre-sowing population density in the soil profile, and on environmental conditions, particularly relatively high soil moisture just above field capacity to permit nematode movement to invade roots [42], as well as suitable soil temperatures for nematode reproduction in the roots. Above-ground symptoms of nematode damage have been more apparent in winter seasons where the temperature has been warmer than usual leading up to and after sowing, in line with the optimum temperature range for P. thornei reproduction being 20 to 25 °C [43].
At later growth stages (anthesis), differences in N and P concentration due to P. thornei damage were not as apparent due to growth and dilution effects, but difference in uptake of N and P in the crop biomass were still substantial. Our results indicated that nematode damage to the roots reduced N and P flow into the plants and that this could not be offset by increasing the nutrient supply in the soil with additional fertiliser. In these four experiments on sites with high densities of P. thornei in the soil profile at sowing, nematode control was more important than additional fertiliser in improving plant growth and grain yield, although both were required for maximum grain yield. Clearly, nutrient deficiencies in plants can arise from inadequate supply of available nutrients in the soil, or inefficient root systems to absorb and translocate them, in this case caused by damage from P. thornei. Past misdiagnosis as inadequate supply of soil nutrients based on plant symptoms of the effects of P. thornei [15] can now be averted through quantitative soil testing for P. thornei.
The damage to the root system of susceptible/intolerant wheat plants caused by P. thornei also reduces the capacity of the plants to access soil water, resulting in the observed symptoms of leaf rolling, even when plant-available water in the soil is adequate for wheat plants unaffected by P. thornei. In another study at the Formartin site, the susceptible/intolerant wheat cultivar Strzelecki, in soil infested with P. thornei, had a low extraction rate of soil water, which delayed the root extraction velocity down the soil profile, and effectively decreased the crop lower limit [44]. Nitrification is rapid in alkaline vertisols, and most of the available nitrogen produced from the mineralisation of soil organic matter during the fallow period, or supplied from application of urea fertiliser, is in the nitrate form when wheat is sown. Nitrate is in the soil solution and is taken up by wheat plants through mass flow of water into the roots. Thus, root damage by P. thornei that reduces water flow into the roots would also reduce nitrate flow into the roots. On the other hand, available soil P as orthophosphate is mainly sorbed onto clay minerals in vertisols and moves more slowly via diffusion to root surfaces. Therefore, slower flow of P into P. thornei-damaged roots probably results from a more direct interruption of the active root P absorption capacities of damaged epidermis and cortex, or simply from less functional root length to intercept P in the soil. Fewer tillers per plant are associated with fewer nodal (crown) roots per plant, and these are important for wheat to capture P in the topsoil. In the subtropical grain region, naturally occurring AMF are important for crop production, principally through improved exploitation of P and Zn from soil and fertiliser sources [45]. In a crop rotation experiment at the Formartin site [46], AMF contributed considerably to the biomass production and yield of wheat cv. Batavia (susceptible/intolerant to P. thornei). In our results for wheat cv. Banks in Experiment 2, there were no significant effects of nematicide or fertiliser treatments on percentage of the root length colonised with AMF, suggesting no direct effects on AMF colonisation by the nematicides or by P. thornei. However, the reduction in the total effective length of the root system that the nematodes cause would also reduce the effective length of AMF colonised root for accessing soil P.
The yield of a wheat crop depends at the highest scale on the production of a whole crop canopy of healthy photosynthesising leaves to capture maximum radiation to support biomass production and grain yield [47]. The whole crop canopy is the result of the production, growth, and abortion of shoots or tillers, which at the lowest level consist of phytomers. A phytomer is considered to be the leaf, the node plus internode above it and an axillary bud which can give rise to new shoots [47]. The root nodal bud should also be considered part of the vegetative phytomer unit. Thus, the appearance, growth and abortion or senescence of phytomers or their components can lead to dynamically changing tillers and crop canopies through the life of the crop. These developmental concepts have been adopted to increasing degrees in wheat crop simulation models [47]. The capacities of the canopy to intercept radiation and carbon dioxide, and the capacities of the root system to capture water and nutrients from the soil, control biomass production and grain yield [48]. Poor canopy development, measured as leaf area index, in the susceptible/intolerant cv. Strzelecki was shown to persist through the growing season in P. thornei-infested soil at Formartin [44]. Likewise, reduction in the extent and greenness of canopy cover of Strzelecki, due to high population densities of P. thornei, could be measured as normalised difference vegetation index (NDVI) [49].
In the experiments reported here, the early impact of P. thornei on the size of the wheat plants through fewer tillers and lower weight per tiller continued through the growing season, as the population density of P. thornei increased in the roots and as the crop became inefficient at accessing plant-available water stored in the subsoil. Thus, uncontrolled populations of P. thornei resulted in less biomass, and fewer spikes at anthesis, which were major determinants of number of kernels harvested per unit area and ultimately grain yield. Other components of grain yield, including grain weight/spike, kernel number/spike and kernel weight, were affected to a much lesser extent by P. thornei and had much less influence on grain yield. Sadras et al. [48] indicated that across sources of environmental variation, yield is primarily a function of grain number, whereas kernel weight has a secondary influence on grain yield. In Australia, emphasis has been placed on agronomic interventions to maintain kernel weight, such as reducing rate of nitrogen fertiliser to restrict early soil water usage by the crop. This emphasis has been to the detriment of kernel number and grain yield in the majority of situations [48]. Grain number in wheat is determined by crop growth rate in a critical window that begins at stem elongation and extends to approximately 10 days after anthesis [48]. Clearly, in our experiments, P. thornei reduced plant growth through this critical window, and was a major determinant of spike and kernel numbers per unit area, thereby reducing grain yield. Thus, P. thornei can be a major cause of the yield gap between realised yield and water-limited yield potential [48] in infested fields in the subtropical grain region of eastern Australia.
Aldicarb was the most effective of the nematicides tested probably because of its greater solubility, and its good systemic properties in the plant roots [50], which seem important features of a nematicide for control of nematodes in dryland crops. Although our results showed good control with aldicarb, and some other nematicides, of P. thornei in the root-zone soil from 0 to 20 cm depth, it is probable that control did not occur throughout the soil profile. In another experiment at Formartin, deep soil samples were taken a year after a crop of the susceptible wheat cv. Janz had been treated with aldicarb (10 kg/ha incorporated into the soil before sowing). Population densities of P. thornei after the aldicarb treatment were considerably less in the 0–15 and 15–30 depth intervals than after the untreated control wheat, but not at deeper intervals in the soil profile [51]. Therefore, it is probable that complete control of P. thornei in the soil profile was not achieved in our experiments, and the quantified damaging effects of P. thornei on the growth and yield of these susceptible/intolerant cultivars, demonstrated by up to 70% yield increases from effective nematicide application, are underestimates. The greater response in wheat growth to nematicide in Experiment 4 at Pirrinuan, than in the other experiments, was associated with a greater proportion of the P. thornei population in the top 30 cm of the soil profile closer to where the nematicides were applied. Additionally, above-average rainfall in June and July of Year 2 would have increased soil water to dissolve nematicide for better uptake by the young roots, and better protection of the wheat from P. thornei in Experiment 4.
It is difficult to separate roots from clay soil manually, and it was apparent that the root-zone soil contained much of the fine root. Therefore, in these experiments, we compared plant performance against population density of P. thornei in the root-zone soil, knowing it was well correlated with P. thornei/g root. On the basis of these experiments, population densities of P. thornei have been reliably quantified in subsequent experiments by extracting from the soil and roots together [11]. Aldicarb also reduced the population density of M. brevidens in the root-zone soil in Experiment 2, from 17,450/kg soil in the nil control to 50/kg soil with 4 kg/ha aldicarb. Similarly in Experiment 4, aldicarb (4 kg/ha) reduced the population density of M. brevidens from 330/kg root-zone soil to 10/kg. This nematode species feeds on root hairs and epidermal cells causing limited cell death. Migratory ectoparasitic nematodes, such as M. brevidens, are considered to have only one-sixth the damage potential to plants as migratory endoparasitic nematodes such as P. thornei [52]. Thus, it is possible that M. brevidens contributed to poorer wheat growth with the high population densities in the root-zone soil in Experiment 2, but was most unlikely to have had any impact with the low population densities in the root-zone soil in Experiment 4.
The threat to crop production from P. thornei in this region can be lessened through integrated management, involving key components of diagnosing nematode population densities in fields, and accordingly growing resistant and tolerant cultivars of the various crop species in rotations [3]. Some difficulties arise because (i) P. thornei has a wide host range, (ii) some resistant crop species such as foxtail millet (Setaria italica) and canaryseed (Phalaris canariensis) have small markets, (iii) sorghum is a major crop, but cannot be grown profitably in all areas of the region, and (iv) the two major pulse crops for this region, chickpea and mungbean, are both hosts limiting their value as rotational N-fixing crops with wheat. A further issue is that P. thornei survives well in these soils, and after the growth of a susceptible crop, at least 2 years of clean fallow and/or resistant crops are required to reduce population densities to below damage thresholds for intolerant wheat cultivars [10,53]. Continued plant breeding is required to increase the resistance and tolerance of commercial cultivars of wheat and other crop species to P. thornei. Although the symptoms in the tops of wheat from P. thornei damage to the roots can be confused with nutrient deficiencies in the soil, ratings are sufficiently predictive of grain yield to be used for screening large numbers of early generation wheat breeding lines in small plots without the need to harvest grain. To achieve reliable screening, field sites should be managed to have a high population density of P. thornei, and fertilisers should be applied at recommended rates to rule out soil deficiencies causing the symptoms.
In these experiments, there were significant responses in control of P. thornei and improved plant growth to several of the nematicides tested, but the value of the increased grain yield just covered the nematicide cost in the best cost–benefit scenario for product and rate. This economic outcome, combined with the problem of controlling nematodes deeper in the soil profile for dryland agriculture in an uncertain rainfall environment, has meant that chemical control of P. thornei has never been adopted in the subtropical grain region of eastern Australia. Nonetheless, the testing of nematicides in these experiments has shown the damage potential of P. thornei, and has led to research into the elements of integrated management through rotation with more resistant crops than wheat, and the development of some tolerant and resistant wheat cultivars [3].
The most effective oxime carbamate and organophosphate nematicides tested in this study have been largely withdrawn from world markets. Relatively effective new nematicides with greater specificity to nematodes are being tested for various world markets, among which the most promising are fluensulfone, fluopyram and fluazaindolizine [17,18]. These, and other next-generation nematicides, require thorough testing under field conditions in the environment of the subtropical grain region for effectiveness against P. thornei in wheat and other vulnerable crops. If new nematicies are shown to be biologically and economically effective against P. thornei, they could become a useful component of integrated management in this region. The results of investigations with the nematicides reported here indicate that testing of new chemicals should be undertaken in field experiments in the semi-arid environment of this region, which is characterised by dryland farming on clay soils. Nematicides that are the most water soluble and mobile in soil will likely have the greatest chance of success in this environment. Next-generation nematicides have been selected for low solubility to satisfy regulatory requirements of no leaching [17], and this may result in low efficacy against P. thornei in this region. Similarly, systemic nematicides will have a greater chance of protecting crop root systems against P. thornei than non-systemic nematicides. Probably aldicarb in these experiments had its greatest effect against P. thornei once the nematodes were feeding in roots that had taken up the nematicide. Evidence for this is from a glasshouse experiment in which aldicarb (5 mg/kg soil) reduced the population density of P. thornei in a vertisol planted with wheat cv. Gatcher to one seventh of that remaining in treated soil without a plant [54]. Organphosphate and oxime carbamate nematicides at field concentrations do not kill nematodes, but impair neuromuscular activity causing loss of mobility with consequent effects on development and reproduction [50]. The systemic movement of nematicides in plants is largely upwards in the xylem (termed apoplastic), with some nematicides having some movement downwards in the phloem as well (termed symplastic). Oxamyl, which is reputed to have better symplastic movement than other nematicides [50], was the second most effective nematicide in our experiments when applied as granules in the seed row, but was relatively ineffective when applied as a seed treatment at lower rates per hectare. Nonetheless, the possibility remains for future effective nematicides with very strong symplastic movement in the root system to control P. thornei throughout the soil profile.
5. Conclusions
Although nematicidal control of P. thornei has never been adopted in the subtropical grain region of eastern Australia, this research into efficacy of nematicides has provided valuable information on how this nematode species affects wheat growth and yield. It is apparent that P. thornei in high population densities in the soil reduces wheat growth early after invading the roots and destroying cortical tissue under suitable environmental conditions. Apart from detrimental effects on efficiency of uptake of soil water, there are similar detrimental effects on the uptake of available N and P from the soil, leading to N and P deficiencies in the young plants. This leads to compounding detrimental effects on phytomer production, tiller number and size, and nodal root numbers per plant, integrating into poor canopy cover, decreased capture of radiation and carbon dioxide, poor biomass production, and reduced numbers of spikes and kernels per unit area and ultimately reduced grain yield. With no nematicides available to growers, emphasis on integrated management, involving crop rotation with the most resistant and most tolerant commercial crop cultivars available, is essential for P. thornei-infested fields. Next-generation nematicides require testing under field conditions in this environment, and if economically effective, they could become a useful component of integrated management of P. thornei for this region.
Supplementary Materials
The following are available online at https://www.mdpi.com/2073-4395/11/2/296/s1, Table S1: Soil properties of (a) Formartin site and (b) Macalister site. Values are the means of duplicate laboratory analysis of composite core samples of nine cores from the field. Table S2: Effects of nematicides and fertiliser (N120P30Zn15 kg/ha) on plant population density of wheat cv. Banks at 29 days after sowing (3-leaf stage), and on grain yield in Experiment 1 at Formartin. Table S3: Effects of nematicides and fertiliser (N120P30Zn15 kg/ha) on plant population density of wheat cv Banks at 26 days after sowing (3-leaf stage), on plant growth and nematode population densities at 80 days after sowing (DAS), on number of spikes, plant biomass and nutrient contents at 100 DAS (booting) and on grain yield and grain N and P in Experiment 2 at Macalister. Table S4: Effects of nematicides and fertiliser (N120P30Zn15 kg/ha) on plant population of wheat cv Gatcher at 35 days after sowing (DAS), on vegetative growth at 67 DAS, on number of spikes, plant biomass and nutrient contents at 114 DAS (anthesis) and on grain yield and grain N and P in Experiment 3 at Formartin. Table S5: Experiment 4 at Pirrinuan: Effects of nematicides and fertiliser (N120P30Zn15 kg/ha) on plant population of wheat cv Gatcher at 35 days after sowing (DAS), on vegetative growth at 63 DAS, on nematode population densities and plant growth at 72 DAS, on number of spikes, plant biomass and nutrient contents at 107 DAS (anthesis) and on grain yield and grain N and P concentrations and uptakes. Table S6: Effects of nematicides with and without fertiliser (N120P30Zn15 kg/ha) on percentage of the root length colonised with arbuscular mycorrhizal fungi for wheat cv. Banks sampled at Z40 (booting) from Experiment 2 at Macalister. Values transformed by arcsin √proportion for ANOVA with back-transformed values as % in parentheses. Figure S1: Main effects of nematicides (highest rate of each) on (a) Pratylenchus thornei in the root-zone soil (0−20 cm depth), (b) P. thornei/g roots (0−20 cm depth); and (c) Merlinius brevidens in the root-zone soil (0−20 cm depth) at wheat stem elongation (Z32) at 72 days after sowing in Experiment 4 at Pirrinuan. Fertiliser had no significant effect on nematode populations. Bar markers = l.s.d. (P = 0.05). Figure S2: Main effects of nematicides (highest rate of each) and fertiliser (N120P30Zn15 kg/ha) on (a) growth rating (0–5 scale) of wheat plants at 63 DAS (b) biomass (kg/ha) at Z32 (stem elongation) 72 DAS, (c) dry weight/plant at Z32, (d) tiller number/m2 at Z32, (e) dry weight/tiller at Z32 in Experiment 4 at Pirrinuan. Bar markers = l.s.d. (P = 0.05). Figure S3: Interactive effects of nematicides (highest rate of each) and fertiliser (± N120P30Zn15 kg/ha) on (a) biomass (kg/ha) at Z32 (stem elongation at 72 DAS), and (b) tillers/m2 at Z32 in Experment 4 at Pirrinuan. Where abbreviated nematicide names are: Ald = aldicarb, Oxam = oxamyl, Carbf = carbofuran, Carbs = carbosulfan, Cleoth = cleothocarb, Terb = terbufos, Fenam = fenamiphos, Fensu = fensulphothion, EDB = ethylene dibromide, 1,3-D = 1,3-dichloropropene, Oxa S = oxamyl seed treater, and Carb S = carbofuran seed treater. Bar markers = l.s.d. (P = 0.05). Figure S4: Main effects of nematicides (highest rate of each) and fertiliser (N120P30Zn15 kg/ha) on N and P nutrition of whole plant tops at Z32 (stem elongation) 72 DAS, (a) N concentration (b) P concentration (c) N uptake/ha and (d) P uptake/ha in Experiment 4 at Pirrinuan. Bar markers = l.s.d. (P = 0.05). Figure S5: Main effects of nematicides (highest rate of each) and fertiliser (N120P30Zn15 kg/ha) on wheat plants at Z65 (anthesis) 107 DAS for (a) number of spikes/m2 (b) biomass (c) N uptake/ha and (d) P uptake/ha in Experiment 4 at Pirrinuan. Bar markers = l.s.d. (P = 0.05). Figure S6: Main effects of nematicides (highest rate of each) and fertiliser (N120P30Zn15 kg/ha) on (a) grain yield (b) kernel weight and (c) kernel number/m2 in Experiment 4 at Pirrinuan. Bar markers = l.s.d. (P = 0.05).
Author Contributions
Conceptualization, J.P.T.; methodology, J.P.T. and T.G.C.; formal analysis, J.P.T. and T.G.C.; investigation, J.P.T. and T.G.C.; resources, J.P.T. and T.G.C.; data curation, J.P.T. and T.G.C.; writing—original draft preparation, J.P.T.; writing—review and editing J.P.T. and T.G.C. All authors have read and agreed to the published version of the manuscript.
Funding
This research received no external funding.
Data Availability Statement
Data are available in the Supplementary files associated with this article.
Acknowledgments
We gratefully acknowledge previous support from Department of Agriculture and Fisheries Queensland, and the former Analytical Section of the Leslie Research Centre for chemical analyses. We thank John Mackenzie for assistance in conducting field experiments, and farm staff for driving machinery in sowing and harvesting operations. We thank growers A. Gwynne, W. Bach and E. Morris for provision of land on their farms for our field experiments.
Conflicts of Interest
The authors declare no conflict of interest.
References
- Castillo, P.; Vovlas, N. Pratylenchus (Nematoda: Pratylenchidae): Diagnosis, biology, pathogenicity and management. In Biology and Ecology of Pratylenchus, Nematology Monographs Perspectives 6; Hunt, D.J., Perry, R.N., Eds.; Brill: Leden, The Netherlands; Boston, MA, USA, 2007; pp. 305–324. [Google Scholar]
- Smiley, R.W.; Nicol, J.M. Nematodes which challenge global wheat production. In Wheat Science and Trade; Carter, B.F., Ed.; Wiley-Blackwell: Ames, IA, USA, 2009; pp. 171–187. [Google Scholar]
- Thompson, J.P.; Owen, K.J.; Stirling, G.R.; Bell, M.J. Root-lesion nematodes (Pratylenchus thornei and P. neglectus): A review of recent progress in managing a significant pest of grain crops in northern Australia. Australas. Plant Pathol. 2008, 37, 235–242. [Google Scholar] [CrossRef]
- Vanstone, V.A.; Hollaway, G.J.; Stirling, G.R. Managing nematode pests in the southern and western regions of the Australian cereal industry: Continuing progress in a challenging environment. Australas. Plant Pathol. 2008, 37, 220–224. [Google Scholar] [CrossRef]
- Hodda, M.; Collins, S.J.; Vanstone, V.A.; Hartley, D.; Wanjura, W.; Kehoe, M. Pratylenchus quasiterioides n. sp. from cereals in Western Australia. Zootaxa 2014, 3866, 277–288. [Google Scholar] [CrossRef]
- Thompson, J.P.; Clewett, T.G.; Sheedy, J.G.; Reen, R.A.; O’Reilly, M. Occurrence of root-lesion nematodes (Pratylenchus thornei and P. neglectus) and stunt nematode (Merlinius brevidens) in the northern grain region of Australia. Australas. Plant Pathol. 2010, 39, 254–264. [Google Scholar] [CrossRef]
- Webb, A.A.; Grundy, M.J.; Powell, B.; Littleboy, M. The Australian subtropical cereal belt: Soils, climate and agriculture. In Sustainable Crop Production in the Sub-tropics—An Australian Perspective; Clarke, A.L., Wylie, P.B., Eds.; Queensland Department of Primary Industries: Toowoomba, Australia, 1997; pp. 8–23. [Google Scholar]
- Owen, K.J.; Sheedy, J.G.; Thompson, J.P.; Clewett, T.G.; O’Reilly, M.M. Resistance of Australian spring barley and wheat cultivars to root lesion nematode (P. thornei). In 2007 Plant Disease Management Reports (Online); Report 2: N034; American Phytopathological Society: St. Paul, MN, USA, 2008. [Google Scholar] [CrossRef]
- Thompson, J.P.; Reen, R.A.; Clewett, T.G.; Sheedy, J.G.; Kelly, A.M.; Gogel, B.J.; Knights, E.J. Hybridisation of Australian chickpea cultivars with wild Cicer spp. increases resistance to root-lesion nematodes (Pratylenchus thornei and P. neglectus). Australas. Plant Pathol. 2011, 40, 601–611. [Google Scholar] [CrossRef]
- Owen, K.J.; Clewett, T.G.; Thompson, J.P. Wheat biomass and yield increased when populations of the root-lesion nematode (Pratylenchus thornei) were reduced through sequential rotation of partially-resistant winter and summer crops. Crop. Pasture Sci. 2014, 65, 227–241. [Google Scholar] [CrossRef]
- Thompson, J.P.; Sheedy, J.G.; Robinson, N.A. Resistance of wheat genotypes to root-lesion nematode (Pratylenchus thornei) can be used to predict final nematode population densities, crop greenness and grain yield in the field. Phytopathology 2020, 110, 505–516. [Google Scholar] [CrossRef] [PubMed]
- Thompson, J.P.; Sheedy, J.G.; Robinson, N.A.; Clewett, T.G. Tolerance of wheat (Triticum aestivum) genotypes to root-lesion nematode (Pratylenchus thornei) in the subtropical grain region of eastern Australia. Euphytica 2021, in press. [Google Scholar]
- FAO. World reference base for soil resources. In World Soil Resource Report No; FAO: Rome, Italy, 1998. [Google Scholar]
- Dalal, R.C.; Mayer, R.J. Long-term trends in fertility of soils under continuous cultivation and cereal cropping in southern Queensland. b. Rate of loss of total nitrogen from the soil profile and changes in carbon-nitrogen ratios. Aust. J. Soil Res. 1986, 24, 493–504. [Google Scholar] [CrossRef]
- Thompson, J.P.; Mackenzie, J.; Sheedy, G.H. Root-lesion nematode (Pratylenchus thornei) reduces nutrient response, biomass and yield of wheat in sorghum–fallow–wheat cropping systems in a subtropical environment. Field Crops Res. 2012, 137, 126–140. [Google Scholar] [CrossRef]
- Rich, J.; Dunn, R.; Noling, J. Nematicides: Past and present uses. Nematology 2004, 21, 1179–1200. [Google Scholar]
- Desaeger, J.; Wran, C.; Zasada, I. New reduced-risk agricultural nematicides—Rationale and review. J. Nematol. 2020, 52, 1–16. [Google Scholar] [CrossRef]
- Oka, Y. From old-generation to next-generation nematicides. Agronomy 2020, 10, 1387. [Google Scholar] [CrossRef]
- Chen, J. Chemical nematicides: Recent research progress and outlook. J. Agric. Food Chem. 2020, 68, 12175–12188. [Google Scholar] [CrossRef]
- Isbell, R.F. The Australian Soil Classification, Rev. ed.; CSIRO Publishing: Melbourne, Australia, 1996. [Google Scholar]
- Soil Survey Staff. Soil Taxonomy; U.S. Dep. Agric., Agric. Handb, 1975; No. 436; United States Government Printing Office: Washington, DC, USA, 1975.
- Beckmann, G.G.; Thompson, C.H. 1960. Soils and Land Use in the Kurrawa Area, Darling Downs, Queensland; CSIRO Division Soils, Soils Land Use Series: Melbourne, Australia, 1960; No. 37. [Google Scholar]
- Day, P.R. Particle fractionation and particle-size analysis. In Methods of Soil Analysis. Part 1. Physical and Mineralogical Properties Including Statistics of Measurement and Sampling; Black, C.A., Ed.; American Society Agronomy: Madison, WI, USA, 1965; pp. 545–567. [Google Scholar]
- Rayment, G.E.; Higginson, F.R. Australian Laboratory Handbook of Soil and Water Chemical Methods; Inkata Press: Melbourne, Australia, 1992. [Google Scholar]
- Dalal, R.C.; Mayer, R.J. Long-term trends in fertility of soils under continuous cultivation and cereal cropping in southern Queensland. I. Overall changes in soil properties and trends in winter cereal yields. Aust. J. Soil Res. 1986, 24, 265–279. [Google Scholar] [CrossRef]
- Colwell, J.D. The estimation of the phosphorus fertilizer requirements of wheat in southern New South Wales by soil analysis. Austral. J. Exp. Agric. 1963, 3, 190–197. [Google Scholar] [CrossRef]
- Lindsay, W.L.; Norvell, W.A. Development of DTPA soil test for zinc, iron, manganese and copper. Soil Sci. Soc. Am. J. 1978, 43, 421–428. [Google Scholar] [CrossRef]
- Whitehead, A.G.; Hemming, J.R. A comparison of some quantitative methods of extracting small vermiform nematodes from soil. Ann. Appl. Biol. 1965, 55, 25–38. [Google Scholar] [CrossRef]
- Fortuner, R. C.I.H. Description of Plant-parasitic Nematodes Set 7. In Pratylenchus Thornei; Commonwealth Institute of Helminthology: St Albans, UK, 1977; No. 93. [Google Scholar]
- Siddiqi, M.R. C.I.H. Description of Plant-parasitic Nematodes Set 1. In Merlinius Brevidens; Commonwealth Institute of Helminthology: St Albans, UK, 1972; No. 8. [Google Scholar]
- Peters, B.G. Toxicity tests with vinegar eelworm I. Counting and culturing. J. Helminthol. 1952, 26, 97–110. [Google Scholar] [CrossRef]
- Gurner, P.S.; Dube, A.J.; Fisher, J.M. Chemical control of cereal cyst nematode (Heterodera avenae) on wheat by a new low-volume applicator. Nematologica 1980, 26, 448–454. [Google Scholar]
- Brown, R.H. Control strategies in low value crops. In Principles and Practice of Nematode Control in Crops; Brown, R.H., Kerry, B.R., Eds.; Academic Press: Sydney, Australia, 1987; pp. 351–387. [Google Scholar]
- Zadoks, J.C.; Chang, T.T.; Konzak, C.F. A decimal code for the growth stages of cereals. Weed Res. 1974, 14, 415–421. [Google Scholar] [CrossRef]
- Southey, J.F. Laboratory Methods for Work with Plant and Soil Nematodes, 6th ed.; Great Britain. Minististry of Agriculture, Fisheries and Food Reference Book. 402, HMSO: London, UK, 1986; 148p. [Google Scholar]
- Phillips, J.M.; Hayman, D.S. Improved procedures for clearing roots and staining parasitic and vesicular-arbuscular mycorrhizal fungi for rapid assessment of infection. Trans. Br. Mycol. Soc. 1970, 55, 158–161. [Google Scholar] [CrossRef]
- Giovannetti, M.; Mosse, B. An evaluation of techniques for measuring vesicular arbuscular mycorrhizal infection in roots. New Phytol. 1980, 84, 489–500. [Google Scholar] [CrossRef]
- Best, E.K. An automated method for determining nitrate-nitrogen in soil extracts. Qld. J. Agric. Anim. Sci. 1976, 33, 161–166. [Google Scholar]
- Murphy, J.; Riley, J.P. A modified single solution method for determination of phosphate in natural waters. Anal. Chim. Acta 1962, 27, 31–36. [Google Scholar] [CrossRef]
- VSN International. GenStat for Windows, 18th ed.; VSN International: Hemel Hempstead, UK, 2015. [Google Scholar]
- Baxter, R.; Blake, C. Pratylenchus thornei-a cause of root necrosis in wheat. Nematologica 1968, 14, 351–361. [Google Scholar]
- Dropkin, V.H. Introduction to Plant Nematology; John Wiley & Sons: New York, NY, USA, 1980; pp. 48–49. [Google Scholar]
- Thompson, J.P. Modelling population densities of root-lesion nematode (Pratylenchus thornei) from soil profile temperatures to choose an optimum sowing date for wheat in a subtropical region. Field Crops Res. 2015, 183, 50–55. [Google Scholar] [CrossRef]
- Whish, J.P.M.; Thompson, J.P.; Clewett, T.G.; Lawrence, J.L.; Wood, J. Pratylenchus thornei populations reduce water uptake in intolerant wheat cultivars. Field Crops Res. 2014, 161, 1–10. [Google Scholar] [CrossRef]
- Thompson, J.P. Improving the mycorrhizal conditions of the soil through cultural practices and effects on growth and phosphorus uptake of plants. In Phosphorus Nutrition of Grain Legumes in the Semi‑Arid Tropics; Johansen, C., Lee, K.K., Sahrawat, K.L., Eds.; ICRISAT (International Crops Research Institute for the Semi-Arid Tropics): Hyderabad, India, 1991; pp. 117–137. [Google Scholar]
- Owen, K.J.; Clewett, T.G.; Thompson, J.P. Pre-cropping with canola decreased Pratylenchus thornei populations, arbuscular mycorrhizal fungi, and yield of wheat. Crop. Pasture Sci. 2010, 61, 399–410. [Google Scholar] [CrossRef]
- McMaster, G.S. Development of the wheat plant. In Wheat Science and Trade; Carter, B.F., Ed.; Wiley-Blackwell: Ames, IA, USA, 2009; pp. 31–55. [Google Scholar]
- Sadras, V.; Kirkegaard, J.; Hunt, J. Water use in rainfed systems: Physiology of grain yield and its agronomic implications. In Australian Agriculture in 2020: From Conservation to Automation; Pratley, J., Kirkegaard, J., Eds.; Agronomy Australia and Charles Sturt University: Wagga Wagga, Australia, 2019; pp. 205–219. [Google Scholar]
- Robinson, N.A.; Sheedy, J.G.; Macdonald, B.J.; Owen, K.J.; Thompson, J.P. Tolerance of wheat cultivars to root-lesion nematode (Pratylenchus thornei) assessed by Normalised Difference Vegetation Index (NDVI) is predictive of grain yield. Annal. Appl. Biol. 2019, 174, 388–401. [Google Scholar] [CrossRef]
- Hague, N.G.M.; Gowen, S.R. Chemical control of nematodes. In Principles and Practice of Nematode Control in Crops; Brown, R.H., Kerry, B.R., Eds.; Academic Press: Sydney, Australia, 1987; pp. 131–178. [Google Scholar]
- Reen, R.A.; Thompson, J.P.; Clewett, T.G.; Sheedy, J.G.; Bell, K. Yield response in chickpea cultivars and wheat following crop rotations affecting population densities of Pratylenchus thornei and arbuscular mycorrhizal fungi. Crop. Pasture Sci. 2014, 65, 428–441. [Google Scholar] [CrossRef]
- Ferris, H. Population assessment and management strategies for plant parasitic nematodes. Agric. Ecosyst. Environ. 1985, 12, 285–299. [Google Scholar] [CrossRef]
- Whish, J.P.M.; Thompson, J.P.; Clewett, T.G.; Wood, J.; Rostad, H.E. Predicting the slow decline of root lesion nematodes (Pratylenchus thornei) during host-free fallows to improve farm management decisions. Eur. J. Agron. 2017, 91, 44–53. [Google Scholar] [CrossRef]
- Thompson, J.P.; Clewett, T.G.; O’Reilly, M.M. Optimising initial population, growth time and nitrogen nutrition for assessing resistance of wheat cultivars to root-lesion nematode (Pratylenchus thornei). Australas. Plant Pathol. 2015, 44, 133–147. [Google Scholar] [CrossRef]
Publisher’s Note: MDPI stays neutral with regard to jurisdictional claims in published maps and institutional affiliations. |
© 2021 by the authors. Licensee MDPI, Basel, Switzerland. This article is an open access article distributed under the terms and conditions of the Creative Commons Attribution (CC BY) license (http://creativecommons.org/licenses/by/4.0/).