Article

Soybean Development and Productivity in Response to Organic Management above the Northern Boundary of Soybean Distribution in Europe

Institute of Agriculture, Lithuanian Research Centre for Agriculture and Forestry, Akademija, LT-58344 Kedainiai, Lithuania
*
Author to whom correspondence should be addressed.
Agronomy 2021, 11(2), 214; https://doi.org/10.3390/agronomy11020214
Submission received: 26 November 2020 / Revised: 20 January 2021 / Accepted: 21 January 2021 / Published: 23 January 2021
(This article belongs to the Special Issue Organic Agriculture at the Heart of Agroecological Transition)

Abstract

:
Climate change, new varieties, better technological abilities, and increased demand for local resources provide significant reasons to introduce soybeans in northern regions, above the typical soybean distribution area in Europe. This research examined the effects of two delayed sowing times, wide 25 cm and 50 cm row spacings, seed inoculation with Bradyrhizobium japonicum, and the interaction of all these factors on soybean development and productivity in an organic farming system. Length of soybean vegetation varied from 142 to 161 days at latitude 55° N. Yield varied from 673 to 3154 kg ha−1 in response to management factors. In the dry 2015 year, the combination of later sowing dates and wide 50-cm row spacing significantly (p < 0.01) increased the number of pods per plant by 28%, aboveground dry biomass by two times, and seed yield by 36% plant−1. In the wet 2016, yield components reached their highest values of 16.8 g dry biomass, 19.9 pods plant−1 and 7.9 g seeds plant−1 when inoculated soybeans were sown earlier, with 50-cm row spacings. Protein content significantly varied from 27.4 to 35.3%, and fat content 17.4–21.5%. This study suggests that regular soybean development could be maintained in organically managed locations above the present northern soybean distributional region, but its development, productivity, and production quality significantly depends on management practices.

1. Introduction

In stockless organic farming systems, legumes are suggested as one of the tools that might alleviate ecosystem shortcomings and reduce nutrient imbalances, but a decrease in legume cropping areas has been observed in most European agriculture with no satisfactory explanation [1]. In Europe, the ongoing climate change and the high need of domestic non-genetically modified (non-GMO) soybean markets promote the idea of soybean (Glycine max (L.) Merr.) introduction in typical organic farming systems [2]. Soybeans can become productive enough to compete with other potentially better adapted species [3], as well as adjust nutrient cycling [4,5], promote environmental biodiversity [6], enhance organic crop production [3,7], and reduce problems caused by pathogens [2]. The latest research has focused on soybean introduction in cool climate states, such as Germany, Sweden, Denmark, and Norway. The Baltic states are not typical regions for growing soybeans. Therefore, soybean growth, development and environmental conditions should be investigated to gain knowledge about optimal soybean possibilities at high latitudes [8].
The potential yield of soybean varies geographically due to the changing climate and environmental characteristics [8]. Several studies report that meteorological conditions are some of the most significant factors affecting soybean growth, development, and productivity [9,10,11,12]. Temperature and moisture can determine soybean development and production in new regions [13]. The Baltic Nordic region in Europe is characterized by long days, low temperatures, spring frosts, and short vegetation periods [14]. Temperature and photoperiods regulate the length of soybean growth cycles [15]. Earlier maturing cultivars could be adapted to high latitudes [16]. Cultivars of the 000 maturity group have been tested to function at up to the 59th latitude in southern Sweden [17].
In organically managed farming systems, management solutions play a decisive role in determining yield components under conditions of the local environments [18]. Most non-genetically modified soybean cultivars are bred and performance-tested under conventional conditions, but rarely on organic farms [19]. In organic soybean production, establishment of effective rhizobial symbiosis is crucial for soybean production and overall soil fertility [20]. Legume inoculation with Rhizobium strains is a necessary agricultural practice in most European soils, which are free of soybean specific rhizobia [21]. Soybean plants should be nodulated by specific Bradyrhizobium japonicum strains to sustain nitrogen fixing efficiency [22]. Effective inoculation with Bradyrhizobium strains increases grain yield, protein content, and protein yield [23]. Efficiency of nitrogen fixation in each region can differ according to the rhizobia genome, environmental factors, as well as different agricultural practices [24].
In organic farming, selecting the correct combination for a particular inoculum, row spacing, planting date, and maturity group will extend the productive period and maximize soybean yield [25]. Increasing the row spacing of grain legumes from the traditional 12 cm to 25 or 50 cm allows performing organic interrow cultivation [7,26]. Wider row spacing reduces the competition for light [27], and nutrients, which are often limited in organically managed soils [4]. Row spacing determines seeding density and population, maximum biomass, the time required for soybean closure and yield [28]. Often, narrow rows achieve higher net assimilation rates and result in greater seed yields than wide rows [11]. However, increasing the row spacing may result in a soybean yield penalty and sustain a higher crop yield in the organic systems, where N is less readily available [29].
Optimal planting dates for soybeans vary according to variety, cropping system, and environmental conditions [30]. The delay of typical sowing date is one of the organic techniques for effective weed control in the soybean crop [7]. Thus, late sowing decreases weed cover partially through destruction of early annual weed populations that germinate before harrowing operations [31], and adjoin to a typically drier late spring period in the Nemoral zone inhibiting weed growth [14]. However, the suitable date for sowing in areas of cool weather is very short, and this influences yield much more than in warm areas [11]. Planting prior to or later than the optimal planting date can greatly reduce early maturing soybean yield, and quality, since photoperiodism controls the amount of time available for vegetative plant growth and development [8]. Soybeans planted prior to this optimum range often lose yield from poor emergence due to inadequate soil temperature. In addition, plants sowed after the optimal range fail to develop fully [32].
The aim of this study was to assess the impact of natural and management factors on soybean development and productivity in an organic farming system above the natural distributional region. The main objectives were: (i) to evaluate the ability of soybean (Glycine max L. (Merr.)) to perform under northern climate conditions, and (ii) to investigate the effect of inoculation, sowing time, row spacing, and their interaction on soybean productivity.

2. Materials and Methods

2.1. Experimental Site and Conditions

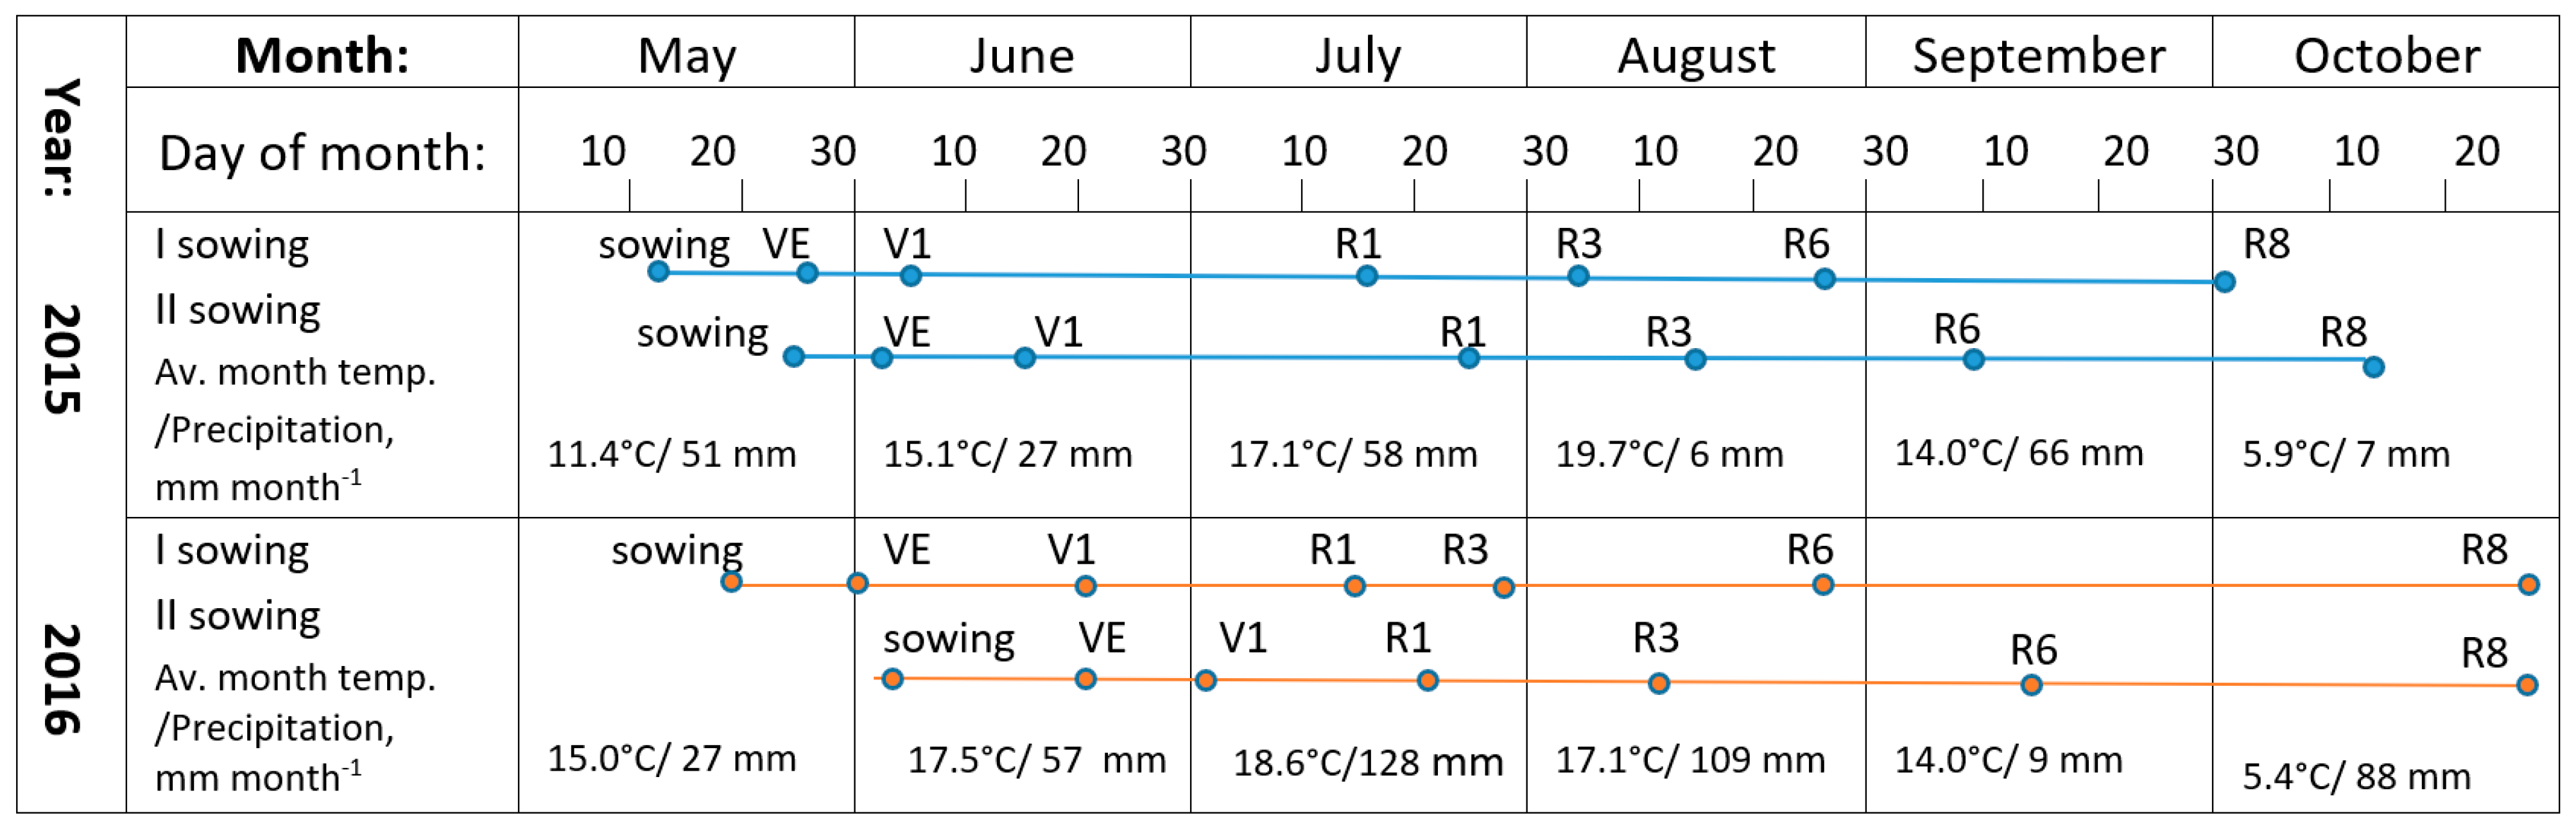
Field experiments were conducted in the 2015 and 2016 cropping seasons at the Lithuanian Centre for Agriculture and Forestry in Akademija (55°23′49″ N 23°51′40″ E), Lithuania. According to Ray et al. (2002), the typical soybean cultivation area in Europe occurs at up to the 49°N latitude. The experimental site was located above the northern boundary of soybean distribution—55°24′ N. Lithuania is in a temperate climatic zone, where the mean annual air temperature is 6.5 °C and the growing season lasts from 169 to 202 days. Weather data were collected at the stationary meteorological station located in Akademija, using the temperature and rainfall sensors (Figure 1). At the experimental site, the sum of active temperatures (ΣT > 10 °C) is 2100–2200 °C, and the average annual precipitation is 500–600 mm. In both 2015 and 2016, the temperature of growing season was higher than the 1980–2010 average, so the conditions for soybean growth were favorable. However, there was a significant difference between 2015 and 2016 in the amount of precipitation (Figure 1). The lack of moisture resulted in a few periods of droughts in 2015 (during V1, R3 and R8 soybean growing stages), whereas 2016 could be described as comparable wet.
The soil of the experimental site is a loamy Endocalcaric Epigleyic Cambisol (Drainic, Loamic) CM-can.glp-dr.lo. Characteristics of the soil arable layer (0–25 cm) were: pH 7.2, humus content 2.7%, total nitrogen 117 mg kg−1, available phosphorus (P2O5) 51 mg kg−1 and available potassium (K2O) 68 mg kg−1. Site was managed organically since 2003, with no extra irrigation, pesticides and other chemical contamination. The farming type is exceptionally crop production, where N is supplied by a high variety of grain and forage legume plants, plant-based fertilizers, and microbial substances.

2.2. Experimental Design and Treatments

Three management factors, relevant for organic soybean farming, were investigated: (i) inoculation with B. japonicum and no inoculation; (ii) two wide row spacings—50 cm and 25 cm; (iii) two delayed sowing times (the first as soon as air temperature reached 15 °C and soil temperature reached 5 °C; the second, two weeks after first sowing). Therefore, seeds were sown on 12 May and 25 May 2015, also 20 May and 3 June 2016. In contrast, typical row spacing would be 12.5 cm and typical sowing time would cover from 15 April to 7 May. Eight treatments were conducted as the interaction of all three variables. The experiment was based on a randomized complete block design with four replications. Each plot was 3.0 m wide and 12.0 m in length. The soybean was introduced for the diversification in the sequence of local crop rotation: spring wheat–soybean–spring barley–winter wheat–pea. The replication of soybean experiment in time was conducted at adjacent contiguous field plot. Soybean cultivar Merlin, belonging to an early 000-maturity group, was chosen. All plots were ploughed in an autumn (to a depth of 25 cm) and harrowed for weed control two times: in early spring (April) and day before seed sowing (May–June). Post sowing, weeds were controlled by interrow cultivator (stage V1) and mechanical weed control by hand-sorting (stage R1). The sowing rate was 120 kg ha−1. Half of the seeds were inoculated with B. japonicum; the other half were sown without previous inoculation. The inoculant contained the strain SEMIA5079 (=CPAC 15) of B. japonicum, containing 1.2 × 10⁹ colony forming units (CFU) mL−1. The dose of inoculant was calculated to deliver 1.2 × 10⁶ cells per seed.

2.3. Data Collection

Soybean development was observed and development stages recorded throughout the vegetation period. Plant height was measured on a weekly basis together with the extent of nodulation. Five plants were selected randomly from each plot and nodules from the root crown were counted and weighed. N-fixation activity was assessed by nodule color; those with pink color were counted as active. Height/length and biomass of plant shoots and roots were determined. Soybean productivity and yield components were determined for a 4 × 0.25 m2 sample area in each plot. Data collected for samples were soybean plant density, root length, and shoot height, root and shoot dry biomass, number of productive branches, and pods per plant, seed number, and seed weight for each plant and pod. Grain quality was indicated by 1000 grain weight, content of protein, fat, and moisture. All samples were taken from each plot.
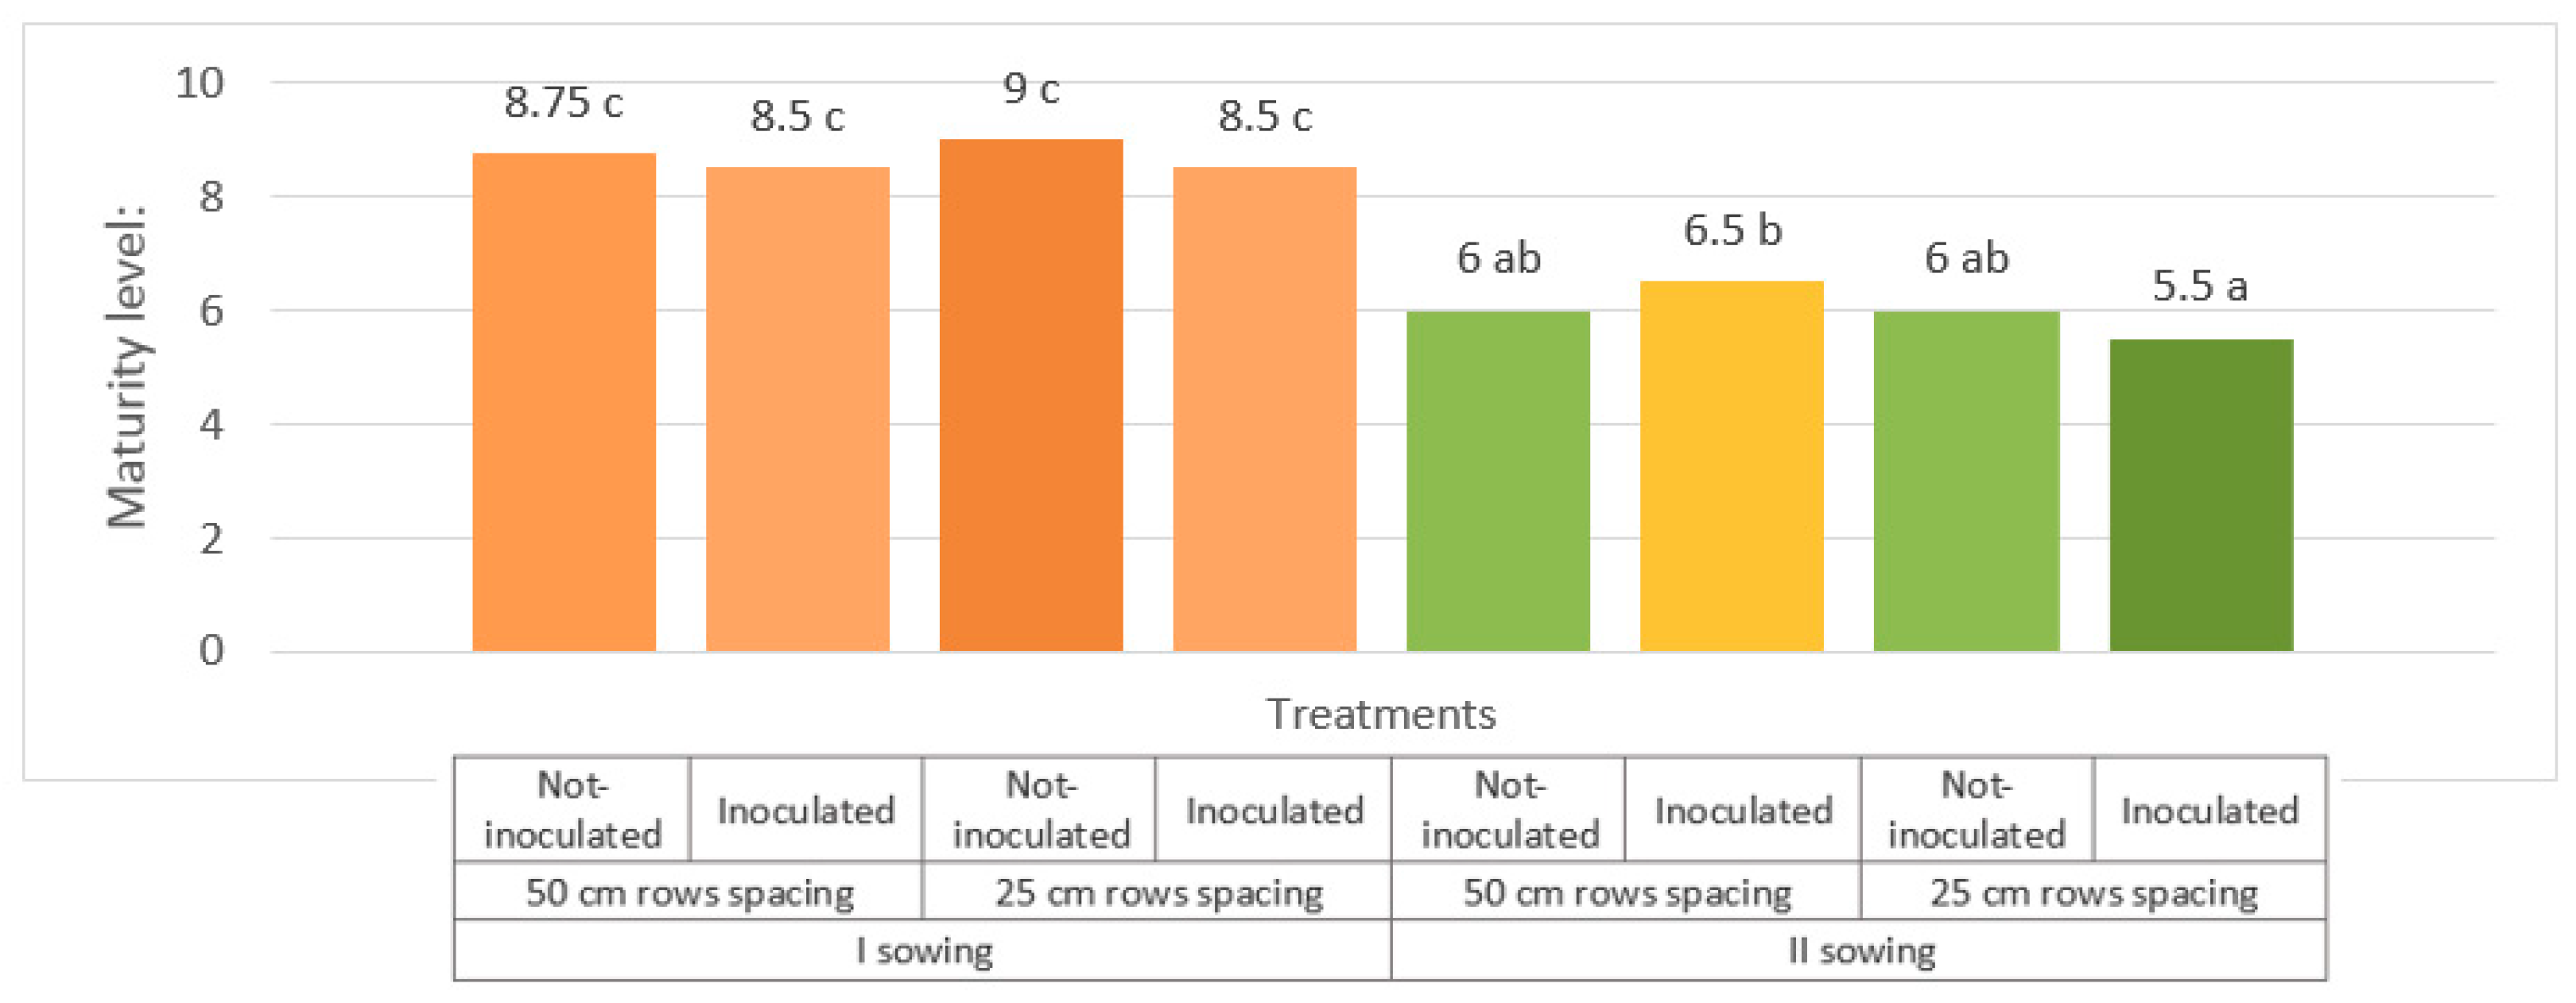
Soybean maturity was evaluated in R7–R8 (beginning maturity – full maturity) stages on 17 October 2016. Each plot was rated on a 10-score system according to phenological signs of maturity of most plants in each plot. The lowest maturity level recorded was 5 and the highest 10, based on the following: 5—plants green, with green and yellow leaves, stems still green, pods green and yellow, beans green and soft; 6—majority of plants yellow-brown, leaves brown, stems green, pods green and yellow, beans still green, wet and soft; 7—majority of plants brown, leaves brown, stems green, all pods yellow but not cracked, beans yellow, wet and soft; 8—plants brown without leaves, stems brown, pods yellow and hardly cracked, beans yellow and harder, but finger crushed and wet; 9—plants brown without leaves, stems brown, pods yellow, medium cracked, beans yellow and harder, with some moisture left; 10—plants brown without leaves, stems brown, pods yellow and easily cracked, beans yellow, hard, oval, and dry.

2.4. Data Analysis

Statistical analysis of soybean yield and traits was performed using a three-way RCB ANOVA on statistical program SAS Enterprise 7.1 computer software. The sources of variation were differences between groups (three main factors; eight treatments) and within groups (four replications for each treatment). The main factors for statistical analysis were sowing time, row spacing and with/without inoculation. The combined analysis of the interactions of factors was performed, too. Means for significant effects were separated using Duncan’s multiple range tests at the 5% probability level (p < 0.05). Homogeneity and normality were verified using Bartlett’s test.

3. Results

3.1. Development of Soybean

In experimental plots, soybean plants were fully developed in both 2015 and 2016. Length of the vegetation period varied from 142 to 161 days according to year and sowing time. In 2015, early sown soybean seeds had a vegetation period of 142 days and late sown, 144 days. In 2016, the vegetation period lasted even longer; with early sown seeds this was 161 days and with late sown 147 days. While temperature were at a suitable level in both years, development of soybean was affected by the precipitation level (Figure 2). In 2015, the vegetative growing peak with highest biomass was reached on 24 July. Low levels of precipitation in August 2015 had a positive effect on seed formation and the beginning of maturity. In comparison, in 2016, biomass accumulation was prolonged by one month, peak levels occurring on 25 August. This was caused by high levels of precipitation and a favorable temperature (109 mm and 17.1 °C, respectively) (Figure 1). In 2016, the higher temperature shortened the V1 phase compared with 2015.
In September and October 2016, meteorological conditions prolonged soybean crop formation. Maturity was behind schedule and harvest was technically harder because of high soil and seed moisture content. More detailed data showed different maturity levels according to the applied management factors (Figure 3).
Inoculation and different row spacings had no significant effect on soybean Merlin maturity term, but different sowing times remained important for maturity level. Soybean seeds sown two weeks earlier matured earlier. Beans were harvested on 1 and 14 October 2015. In 2016, maturity was delayed and soybeans in all treatments were harvested on 28 October.

3.2. Soybean Plant Productivity

Yield components were significantly influenced by various management combinations of sowing dates, rows spacing and inoculation (Table 1). Effect of management factors differed yearly with significant interactions among all treated factors in 2016 positively influenced soybean yield components, whereas in 2015 less interactions were observed.
Number of plants showed different constrains between the two years. The row spacing played the most important role on plant number in both years (Table 1). The changing meteorological conditions resulted in an effect of sowing time in 2016 (Table 1), while in 2015, sowing dates were characterized by similar conditions affecting plant emergence. In 2015, plant density varied from 28 to 76 plants m−2 and was significantly affected by the interaction of sowing time and inoculation, and also by interaction of all three factors (Table 1 and Table 2). In 2016, a significantly higher density of soybean plants was reached with narrow-spaced (25 cm) rows, no inoculation, and later sowing time (Table 2). The mean area occupied per plant in 50 cm spaced rows was 0.030 and 0.029 m−2, respectively, in 2015 and 2016; in 25 cm spaced rows, it was 0.015 and 0.019 m−2, respectively, in 2015 and 2016. The number of plants negatively correlated with the accumulated biomass per plant.
Aboveground biomass of soybean plants in 2015 was affected by different sowing times, row spacing, and interactions between these two factors (Table 1). The highest aboveground dry biomass of soybean plants was reached with a combination of later sowing date (25 May) and 50 cm row spacing. Thereby soybean gained two times more biomass than when sown two weeks earlier in 25 cm spaced rows (Table 3a). Moreover, the later sowing date and wider (50 cm) row spacing significantly (p < 0.01) increased the number of pods per plant by 28%. Seed yield per plant was formed by all three management factors and the interaction of sowing time and row spacing (Table 1). The same tendency was noticed in soybean plants cultivated in wider (50 cm) spaced rows and sown on 25 May, with a 36% higher seed yield. The lowest seed yield occurred in soybean plants cultivated with 25 cm row spacing and sown as early as 12 May (Table 3a). Interactions between sowing time and row spacing had improving effect comparing with main effects, except for pod number on plant. From the statistical data (not given) we see that the 2 weeks later sowing time (S2) being a good date could not improve the podding in 25 cm (because 25 cm limits it). In another way, 50 cm being good row spacing could not improve the podding for earlier sowing time (S1) (because S1 limits it). Therefore, because of highly limiting factors (S1 and 25), interaction could not be defined as significantly affecting pod number.
In 2016, inoculation played a greater role compared to 2015, and interaction of all three management factors caused variability in the accumulated biomass, number of pods, and seed yield per plant (Table 1). These yield components reached highest values, namely 16.8 g dry weight (DW) plant−1, 19.9 pods per plant, and 7.9 g seeds on plant, when inoculated soybean was sown on 20 May with 50-cm row spacing (Table 3b). The least productive soybean plants in 2016 were sown later, on 3 June, with 25 cm row spacing and without inoculation. The number of seeds per pod did not vary significantly and was not affected by the different treatments in 2015 and 2016 crop seasons (Table 1).
The inoculation process was affected by meteorological and soil conditions, so plants accumulated different biomass of bacteria Bradyrhizobium japonicum colonies in 2015 and 2016. Distinguishing the management factors, weight of nodules was significantly (p < 0.05) influenced by sowing date, inoculation, and the interaction of these (Table 1). Plants from inoculated and earlier sown seed accumulated 0.196 g of nodules per plant in 2015, but in 2016 had six times more of nodules with the same combination of factors (Table 4). Therefore, inoculation played a more important role in 2016 than in 2015, and seed yield increased by approximately 87% with inoculation in 2016.

3.3. Soybean Yield and Yield Quality

Soybean grain yield mostly depends on seed weight per plant and plant density in the plots. These two variables were affected by all three management factors, however, row spacing affected them inversely. Narrow (25 cm) spaced rows produced denser soybean populations, although wide (50 cm) spaced rows generated more productive soybean plants in various inoculation and row spacing combinations. Composition of these two determinants expressed in the row spacing effect on grain yield. Even so, only row spacing significantly (<0.05) affected grain yield in 2015 (Table 5).
Yield supplement reached 600 kg ha−1 when seeds were sown in narrow rows in 2015. There was no significant effect of inoculation and sowing time in 2015 (Figure 4). In 2016, grain yield varied more than in 2015. Wide row spacing slightly increased soybean yield, but difference was not significant. Most significant effect was obtained with sowing time, inoculation, and interaction of these two factors. Interaction of inoculation and earlier sowing date (20 May) increased biological yield by 2481 kg ha−1 compared with late sowing without inoculation (Figure 4). This variation was influenced by accumulated biomass of nitrogen-fixing nodules in organic farming conditions and meteorological condition at sowing time and after.
In 2015, soybean beans were comparable smaller than in 2016 regardless of various management factors. Inoculation was the only factor affecting soy beans weight in 2015 (Table 5). Inoculated soybean formed 5.8% heavier seeds. In 2016, the average 1000 grain weight varied from 155.9 to 179.5 g in response to interaction of sowing date and inoculation (Figure 5). A significantly higher positive effect was sustained by inoculation with B. japonicum regardless of earlier sowing date or later.
Yield quality varied significantly according to applied management factors, too. Protein content in various sowing times increased applying combination of inoculation and 50-cm row spacing in both years (Table 6). Non-inoculated soybeans in combination with various sowing dates and row spacing accumulated 27.4–33.6% protein content, while inoculated 30.7–35.7%. In 2015, soybean accumulated more protein than in 2016.
Moreover, soybean accumulated more fat in 2015. Fat content in 2015 was significantly affected by paired interactions of sowing time with inoculation, also inoculation with row spacing, and varied from 19.4 to 21.5% (Table 7). While in 2016, only sowing time and inoculation interaction resulted in significant differences of fat content from 17.4 to 20.0%. Highest fat content was reached in non-inoculated and earlier sowed soybeans in both years. Management factor interaction with inoculum reception responded with fat content decline.

4. Discussion

4.1. Soybean Adaptation to Northern Region

In this two-year field study, we investigated the effects of sowing date, row spacing, and inoculation on soybean productivity in a new location in Europe, Lithuania, at a latitude of 55°N. The soybean cultivar Merlin was cultivated in this experiment. In agreement with our results, research from Sweden concluded that some soybean cultivars could be cropped at up to the 59°N latitude if early warming soils are chosen [17]. Trials that took place in Denmark indicated that the southern part of Denmark could be also suitable for soybean cultivation [33]. In addition, Germany successfully cultivates soybean as a new crop in central regions [23].
In Central and Northern Europe, soybean cultivation is fairly new and investigation of early maturing soybean varieties adapted to cool growing conditions has just started [23]. The soybean cultivar Merlin is in the earliest maturity group (000) and is adapted to long days and short summers. The length of the growth cycle is regulated by temperature and photoperiod [34]. In Poland at latitude 53°N in 2015, the cultivar Merlin was harvested on 7 September [35]. However, in our study, harvest took place on 1 and 14 October 2015. This indicates that a longer period is required to reach maturity in Lithuanian climatic conditions. In 2016, maturity was even more delayed and harvest took place in late October. Researchers in Denmark also reported late harvesting due to delayed maturity [33].

4.2. Soybean Development Conditions

Our study aimed to investigate the suitability of natural meteorological conditions, so the experimental plots were not irrigated. Therefore, precipitation played an important role in our results. Trials in Denmark showed that yields in the non-irrigated plots were reduced by more than 50%, indicating the need for irrigation [33]. Studies performed in Londrina reported that maximum grain yield could be obtained with 650–700 mm of water well distributed throughout the crop cycle. Normal soybean water requirements are from 7.6 to 8.1 mm d−1 [36]. In our study, there was insufficient precipitation in 2015, with 215 mm during the growing period; in 2016, this was approximately 417 mm. The negative effect of water restriction in soybean plants depends on the phenological stage [9]. Drought in the spring affects sowing, which often results in uneven emergence, lack of seedlings and poor seedling growth [11]. In May 2015, weather in Lithuania was wet enough for sowing soybean seeds, although in 2016, the sowing date of 20 May received more rainfall than 3 June. Changes in soil moisture content occurred in 2016 at the two chosen sowing times, resulting in significantly different plant numbers and overall grain yield. It is known that the efficiency of inoculation is also affected by meteorological factors, such as moisture and temperature [24]. Our data demonstrate a significant relationship between sowing date and the number of B. japonicum nodules that had accumulated on the roots.
Sowing date also influences growth development and maturity of soybean plants, and it has close relationship with the available quantity of water [11]. In August, drought occurring at the R4 stage influences soybean yield more than at other stages [37]. In August 2015, precipitation was 6 mm; in August 2016, 109 mm was reported. These differences might have improved yield in 2016. Precipitation at a later stage could increase soybean grain yield by 24–35% due to greater seed size. It has been reported that soybean yield varies widely, from 1170 kg ha−1 to 11,700 kg ha−1, primarily due to varying water availability [38].

4.3. Soybean Yield and Quality

Soybean yield is a function of plants per unit area, pods per plant, seeds per pod, and seed weight. These yield components are influenced by environmental conditions, management practices, and cultivar [18]. Potential yield of soybeans varies geographically due to changes in climate [8]. In this study, average yield in 2015 was 1345 kg ha−1 and in 2016 was 1477 kg ha−1 in organically managed site in Lithuania. Similar cultivars grown on commercial farms in Sweden had a reported yield of 1500–2400 kg ha−1 [17]. Average yield in organically managed trials in Germany was reported as 1634 kg ha−1 in the 2012–2013 season [23]. In Poland, average soybean yield in 2015 was 1600 kg ha−1 [35]. Average seed yield worldwide is 2300 kg ha−1 [39]. The soybean cultivar Merlin has frequently been reported to be the most productive in Germany and Poland [23,34]. In 2015 in Poland, Merlin generated 1560 kg ha−1 and 1880 kg ha−1 in conventional soils with differing fertility [35].
In this study, yield quality was significantly affected by inoculation, row spacing, sowing time, and interactions of them. The soybean market requires a high-quality protein content of 35–45% and high oil content of 19–23%. In 2015 in Poland, Merlin produced beans with a protein content of 41.1% and fat content of 20.6% [35]. In our trial, non-inoculated soybeans in combination with various sowing dates and row spacing accumulated 27.4–33.6% protein content, while inoculated 30.7–35.7%. Only applying a combination of inoculation and 50-cm row spacing produced protein content higher than 35%. According to this, inoculation is essential for the amount of valuable protein when nitrogen is limited in the organically managed soil [40,41].

4.4. Influence of Management Factors

Introducing the soybean crop to a new region raises great questions about its cultivation [23]. Sowing time, inoculation, and row spacing have been investigated as the main points in soybean growing technologies worldwide [11,23,32]. Significance of inoculation of soybeans has been reported in several studies [21,42,43]. Organically managed field trials in Germany investigated the effect of inoculation in the same cultivar Merlin. Results showed that inoculation with Bradyrhizobium strains increased grain yield by 57% and protein yield by 99% [23]. In our experiment, impact of inoculation was low in dry 2015, but in 2016 B. japonicum fixed sufficient nitrogen to increase yield by 98%. Inoculation lessens the limitation of N supply [21], so can easily interact with row spacing. Moreover, inoculation can often interact with sowing date [32], because the access of moisture intensifies the symbiotic bacterial processes and N fixation [34]. These complex interactions give high additional value to organic farming systems. As we found in this study, wide spacing of rows on interactions with inoculation resulted in lower plant density but generated more productive plants and better crop quality.
Identifying the optimum sowing date is also one of the most important factors in producing high soybean yields in organic farming systems. Teasdale et al. [7] shows that delayed soybean sowing date can result just minimal effect on crop performance but advantage the control of weeds. In our study, we found that in 2015 the sowing date of 25 May was better compared to 12 May. In 2016, 20 May was better than 3 June. Similarly, researchers in Sweden recommend sowing of soybean seed from 15 May to 25 May to secure rapid germination and emergence. Appropriate dates also continue from 5 May to 10 June [17].
Interactions of adjusted sowing time and wide row spacings were shown as important factors in organic farming, increasing crop biomass, and yield components [7,26]. Sowing time is often related to the accessibility of moisture [44] and the effect of moisture could be regulated by row spacing [45]. This connection could condition the interaction between row spacing and sowing date. In 2015, the combination of later sowing date (25 May) and 50 cm row spacing significantly (p < 0.01) increased the aboveground dry biomass by two times and seed yield by 36% plant−1. Row spacing had a minor effect on yields in Sweden [17], but investigations in Denmark indicated 50 cm as the optimum row spacing [33]. Even so, our data for 2015 showed that, in some seasons, we could expect a 61% increase in yield by choosing 25-cm spacing instead of 50 cm, despite lower crop quality.

5. Conclusions

The present study shows that soybean cultivar from an early maturity group can fully develop above the northern boundary of soybean distribution. Organic management practices, namely inoculation of seeds with B. japonicum, delayed sowing time, wide row spacings and interaction of these factors have the significant effects on soybean development and productivity in new regions.
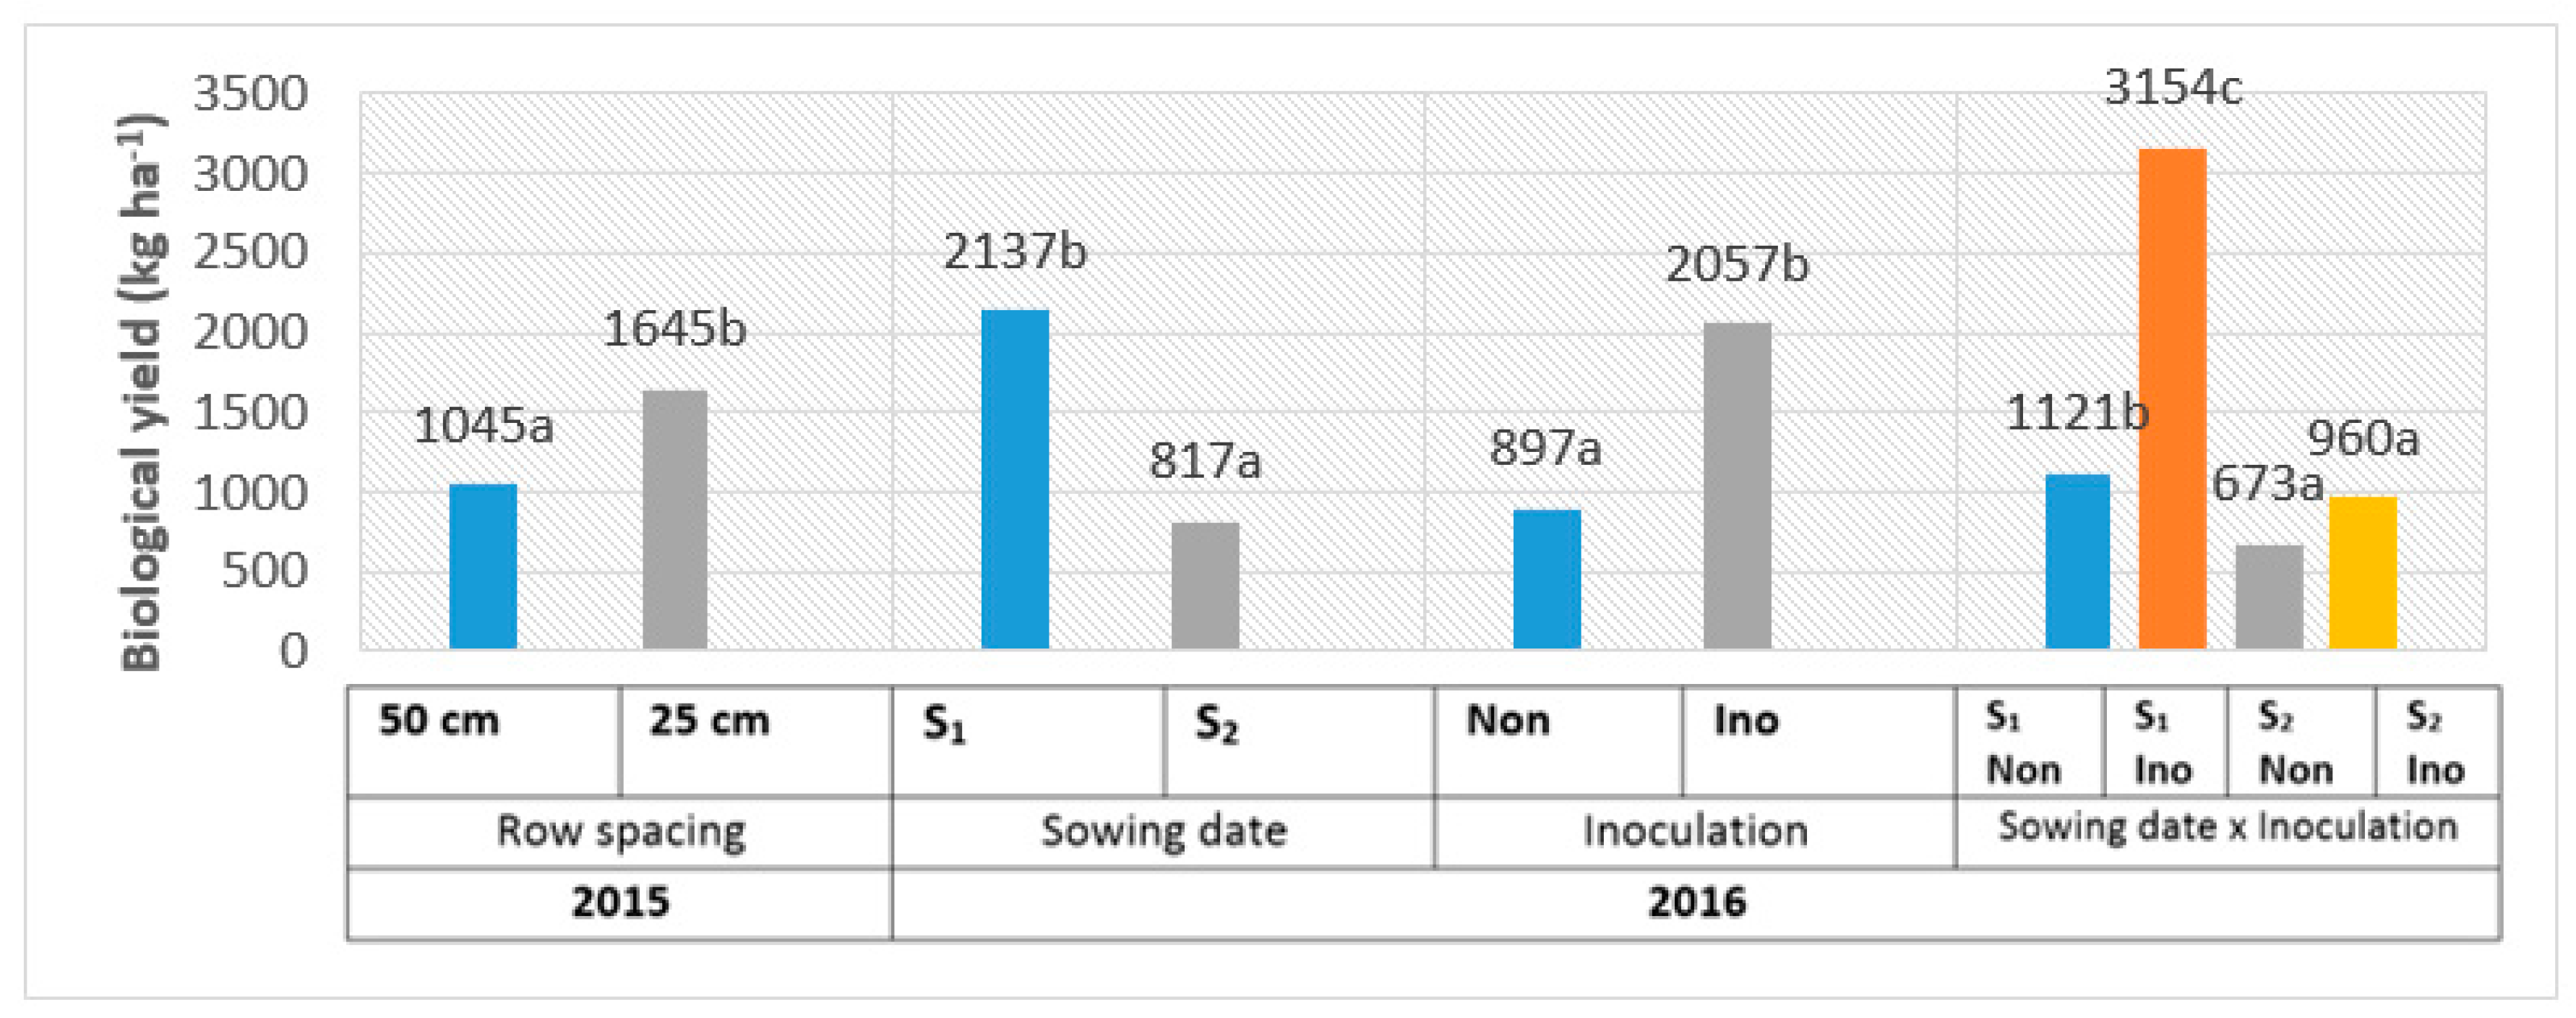
In a comparable dry 2015 year, 25 cm spaced rows significantly increased plant density and, therefore, grain yield. However, inoculated soybean plants cultivated in 50-cm spaced rows gained on average 35% more biomass, 29% more pods, and 36% higher seed yield per plant than those cultivated with 25 cm spacing.
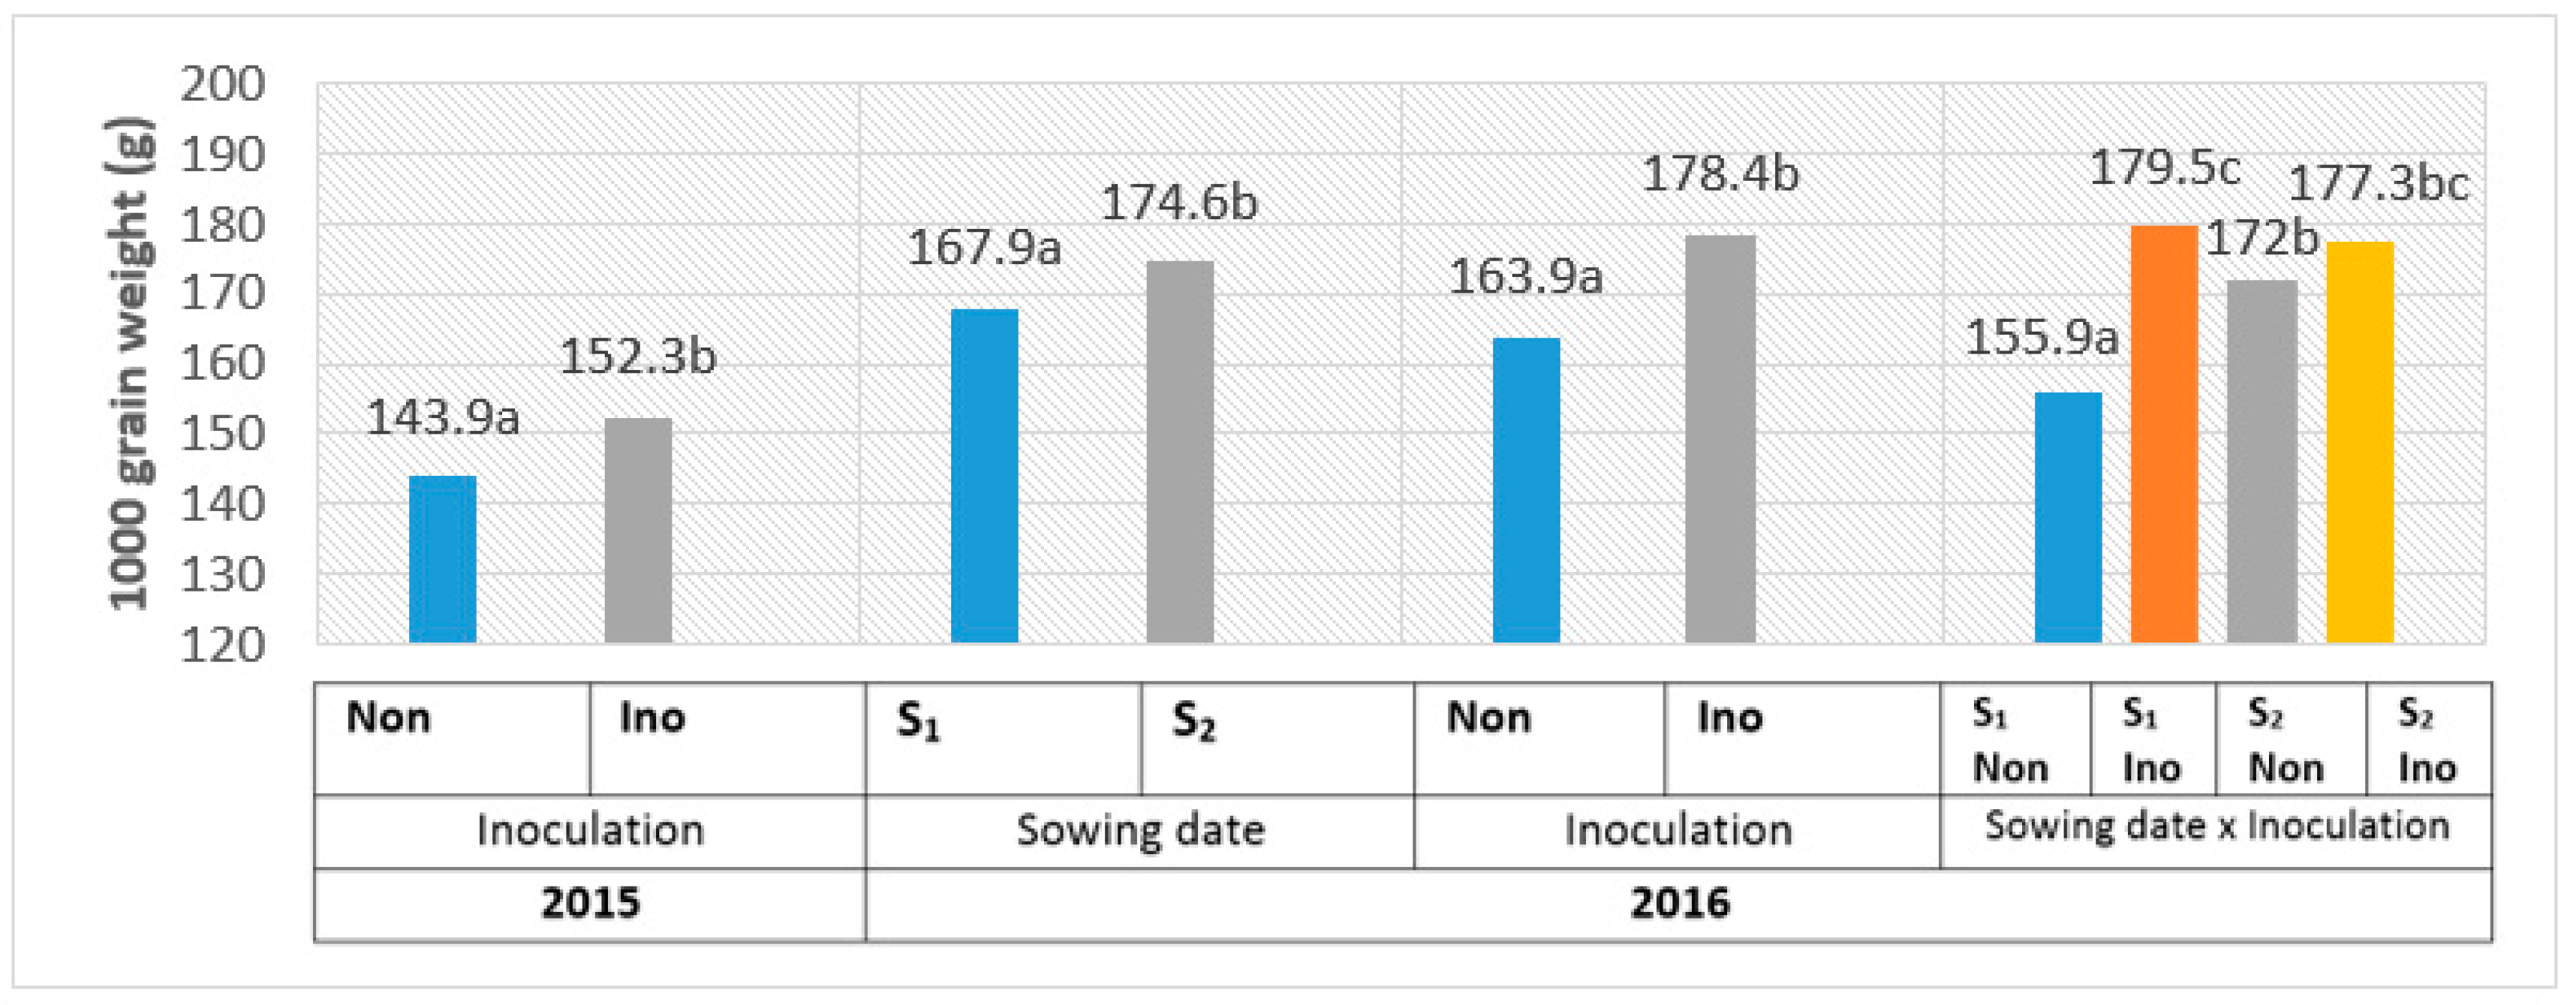
Contrarily, inoculation, sowing time, and interaction of them had a significant effect on grain yield in a comparable wet 2016 year. In the wet year, inoculated soybean accumulated a high number of nodules and inoculation increased seed yield per plant, by 98%, averaging two sowing dates. Seeds sown two weeks earlier accumulated 30% greater biomass, more pods, and 67% more seeds yield per plant than those sown later.
The interaction of management practices gave the additional value to soybean quality. Non-inoculated soybeans had an average of 31% of protein, while inoculated 34%. Only applying inoculation in combination with appropriate sowing time produced protein content higher than 35%.
This study demonstrates that use of different management practices in organic farming can cause yields to vary from 673 to 3154 kg ha−1 and greatly affect soybean quality above the northern boundary of soybean distribution.

Author Contributions

Conceptualization, Z.K., I.D. and M.T.; methodology, Z.K., I.D.; software, S.L.; formal analysis, M.T., S.L.; investigation, J.S., L.S., M.T.; resources, Z.K., J.S.; data curation, M.T., J.S.; writing—original draft preparation, M.T., Z.K., S.L.; writing—review and editing, M.T., L.S.; visualization, M.T., S.L.; supervision, Z.K.; project administration, Z.K.; funding acquisition, Z.K., L.S., I.D. All authors have read and agreed to the published version of the manuscript.

Funding

This research has received funding from the European Union’s Horizon 2020 research and innovation programme under grant agreement N°727672”. This research also was partially funded by a grant (No. MT-15-27/2015-2017) from the Ministry Agriculture of Lithuania.

Institutional Review Board Statement

Not applicable.

Data Availability Statement

Not applicable.

Conflicts of Interest

The authors declare no conflict of interest.

References

  1. Magrini, M.-B.; Anton, M.; Cholez, C.; Corre-Hellou, G.; Duc, G.; Jeuffroy, M.-H.; Meynard, J.-M.; Pelzer, E.; Voisine, A.-S.; Walrandh, S. Why are grain-legumes rarely present in cropping systems despite their environmental and nutritional benefits? Analyzing lock-in in the French agrifood system. Ecol. Econ. 2016, 126, 152–162. [Google Scholar] [CrossRef]
  2. Nemecek, T.; von Richthofen, J.-S.; Dubois, G.; Casta, P.; Charles, R.; Pahl, H. Environmental impacts of introducing grain legumes into European crop rotations. Eur. J. Agron. 2008, 28, 380–393. [Google Scholar] [CrossRef]
  3. Toleikienė, M.; Brophy, C.; Arlauskienė, A.; Rasmussen, J.; Gecaitė, V.; Kadžiulienė, Ž. The introduction of soybean in an organic crop rotation in the Nemoral zone: The impact on subsequent spring wheat productivity. Zemdirb. Agric. 2019, 106, 321–328. [Google Scholar] [CrossRef]
  4. Möller, K. Soil fertility status and nutrient input–output flows of specialised organic cropping systems: A review. Nutr. Cycl. AgroEcosyst. 2018, 112, 147–164. [Google Scholar] [CrossRef]
  5. Pandey, A.; Li, F.; Askegaard, M.; Olesen, J.E. Biological nitrogen fixation in three long-term organic and conventional arable crop rotation experiments in Denmark. Eur. J. Agron. 2017, 90, 87–95. [Google Scholar] [CrossRef]
  6. Put, J.E.; Mitchell, G.W.; Fahrig, L. Higher bat and prey abundance at organic than conventional soybean fields. Biol. Conserv. 2018, 226, 177–185. [Google Scholar] [CrossRef]
  7. Teasdale, J.R.; Mirsky, S.B.; Cavigelli, M.A. Meteorological and management factors influencing weed abundance during 18 years of organic crop rotations. Weed Sci. 2018. [Google Scholar] [CrossRef]
  8. Van Roekel, R.J.; Purcell, L.C.; Salmerón, M. Physiological and management factors contributing to soybean potential yield. Field Crops Res. 2015, 182, 86–97. [Google Scholar] [CrossRef]
  9. Cerezini, P.; Kuwano, B.H.; dos Santos., M.B.; Terassi, F.; Hungria, M.; Noguiera, M.A. Strategies to promote early nodulation in soybean under drought. Field Crops Res. 2016, 196, 160–167. [Google Scholar] [CrossRef]
  10. Schweiger, P.; Hofer, M.; Hartl, W.; Wanek, W.; Vollmann, J. N2 fixation by organically grown soybean in Central Europe: Method of quantification and agronomic effects. Eur. J. Agron. 2012, 41, 11–17. [Google Scholar] [CrossRef]
  11. Liu, X.; Jin, J.; Wang, G.; Herbert, S.J. Soybean yield physiology and development of high-yielding practices in Northeast China. Field Crops Res. 2008, 105, 157–171. [Google Scholar] [CrossRef]
  12. Nielsen, D.C.; Vigil, M.F.; Benjamin, J.G. The variable response of dryland corn yield to soil water content at planting. Agric. Water Manag. 2008, 96, 330–336. [Google Scholar] [CrossRef]
  13. Hartman, G.L.; West, E.D.; Herman, T.K. Crops that feed the world 2. Soybean—Worldwide production, use, and constraints caused by pathogens and pests. Food Secur. 2011, 3, 5–17. [Google Scholar] [CrossRef]
  14. Lazauskas, S.; Povilaitis, V.; Antanaitis, S.; Sakalauskaite, J.; Sakalauskiene, S.; Psibisauskaite, G.; Auskalniene, O.; Raudonius, S.; Duchovskis, P. Winter wheat leaf area index under low and moderate input management and climate change. J. Food Agric. Environ. 2012, 10, 588–593. [Google Scholar]
  15. Santachiara, G.; Borras, L.; Rotundo, J.L. Physiological processes leading to similar yield in contrasting soybean maturity groups. Agron. J. 2017, 109, 1–10. [Google Scholar] [CrossRef]
  16. Zhang, L.X.; Kyei-Boahen, S.; Zhang, J.; Zhang, M.H.; Freeland, T.B.; Watson, C.E.J.; Liu, X. Modifications of optimum adaptation zones for soybean maturity groups in the USA. Crop Manag. 2007, 6, 1–11. [Google Scholar] [CrossRef]
  17. Fogelberg, F.; Fogelberg, C.L. Swedish soya bean cropping—Introduction of a hot crop to a cool climate. Legume Perspect. 2013, 1, 31–32. [Google Scholar]
  18. Mandal, K.G.; Hati, K.M.; Misra, A.K. Biomass yield and energy analysis of soybean production in relation to fertilizer-NPK and organic manure. Biomass Bioenergy 2009, 33, 1670–1679. [Google Scholar] [CrossRef]
  19. Carkner, M.K.; Entz, M.H. Growing environment contributes more to soybean yield than cultivar under organic management. Field Crops Res. 2017, 207, 42–51. [Google Scholar] [CrossRef]
  20. Herridge, D.; Rose, I. Breeding for enhanced nitrogen fixation in crop legumes. Field Crops Res. 2000, 65, 229–248. [Google Scholar] [CrossRef]
  21. Albareda, M.; Rodriguez-Navarro, D.N.; Temprano, F.J. Soybean inoculation: Dose, N fertilizer supplementation and rhizobia persistence in soil. Field Crops Res. 2009, 113, 352–356. [Google Scholar] [CrossRef]
  22. Coskan, A.; Gok, M.; Onac, I.; Ortas, I. The effects of rhizobium and mycorrhiza interactions on N2-fixation, biomass and P uptake. J. Cukurova Univ. Fac. Agric. 2003, 18, 35–44. [Google Scholar]
  23. Zimmer, S.; Messmer, M.; Haase, T.; Piepho, H.-P.; Mindermann, A.; Schulz, H.; Habekuß, A.; Ordon, F.; Wilbois, K.-P.; Heß, J. Effects of soybean variety and Bradyrhizobium strains on yield, protein content and biological nitrogen fixation under cool growing conditions in Germany. Eur. J. Agron. 2016, 72, 38–46. [Google Scholar] [CrossRef]
  24. Coskan, A.; Dogan, K. Symbiotic nitrogen fixation in soybean. Soybean physiology and biochemistry. IntechOpen 2011. [Google Scholar] [CrossRef] [Green Version]
  25. Rowntree, S.C.; Suhre, J.J.; Weidenbenner, N.H.; Wilson, E.W.; Davis, V.M.; Naeve, S.L.; Casteel, S.N.; Diers, B.W.; Esker, P.D.; Conley, S.P. Physiological and phenological responses of historical soybean cultivar releases to earlier planting. Crop Sci. 2014, 54, 804–816. [Google Scholar] [CrossRef]
  26. De Notaris, Ch.; Rasmussen, J.; Sørensen, P.; Melander, B.; Olesen, J.E. Manipulating cover crop growth by adjusting sowing time and cereal interrow spacing to enhance residual nitrogen effects. Field Crops Res. 2019, 234, 15–25. [Google Scholar] [CrossRef]
  27. Kolb, L.N.; Gallandt, E.R.; Mallory, E.B. Impact of spring wheat planting density, row spacing, and mechanical weed control on yield, grain protein, and economic return in Maine. Weed Sci. 2012, 60, 244–253. [Google Scholar] [CrossRef]
  28. Liu, X.B.; Jin, J.; Herbert, S.J.; Zhang, Q.Y.; Wang, G.H. Yield components, dry matter, LAI and LAD of soybeans in Northeast China. Field Crops Res. 2005, 93, 85–93. [Google Scholar] [CrossRef]
  29. Melander, B.; Jabran, K.; De Notaris, Ch.; Znova, L.; Green, O.; Olesen, J.E. Interrow hoeing for weed control in organic spring cereals—Influence of inter-row spacing and nitrogen rate. Eur. J. Agron. 2018, 101, 49–56. [Google Scholar] [CrossRef]
  30. Balko, C.; Ordon, F. Chilling tolerance in soybean (Glycine max (L.) Merr.) from the lab to the field. Actas AEL 2015, 6, 103–104. [Google Scholar]
  31. Coulter, J.A.; Sheaffer, C.C.; Haar, M.J.; Wyse, D.L.; Orf, J.H. Soybean cultivar response to planting date and seeding rate under organic management. Agron. J. 2011, 103, 1223–1229. [Google Scholar] [CrossRef]
  32. Berger-Doyle, J.; Zhang, B.; Smith, S.F.; Chen, P. Planting date, irrigation, and row spacing effects on agronomic traits of food-grade soybean. Adv. Crop Sci. Technol. 2014, 2, 1–8. [Google Scholar]
  33. Pedersen, S.S.; Edlefsen, O.O. Soya beans—Experience from a project in Denmark. Legume Perspect. 2013, 1, 33–34. [Google Scholar]
  34. Jiang, B.; Nan, H.; Gao, Y.; Tang, L.; Yue, Y.; Lu, S. Allelic combinations of soybean maturity loci E1, E2, E3 and E4 result in diversity of maturity and adaptation to different latitudes. PLoS ONE 2014, 9, e106042. [Google Scholar]
  35. Wenda-Piesik, A.; Kazek, M. Productivity of early maturing cultivars of soybeans (Glycine Max L. Merr) in North-Western Poland. In Proceedings of the 14th ESA Congress, Edinburgh, UK, 5–9 September 2016. [Google Scholar]
  36. Kranz, W.L.; Specht, J.E. Irrigating Soybean; Neb Guide; University of Nebraska: Lincoln, NE, USA, 2012. [Google Scholar]
  37. Jin, J.; Wang, G.H.; Liu, X.B.; Pan, X.W.; Herbert, S.J. Phosphorus regulates root traits and phosphorus uptake to improve soybean adaptability to water deficit at initial flowering and full pod stage in a pot experiment. Soil Sci. Plant Nutr. 2005, 51, 953–960. [Google Scholar] [CrossRef] [Green Version]
  38. Nielsen, D.C. Forage soybean yield and quality response to water use. Field Crops Res. 2011, 124, 400–407. [Google Scholar] [CrossRef] [Green Version]
  39. Bujak, K.; Frant, M. Influence of mixtures of herbicides on yielding and weed infestation of five cultivars of soybean. Acta Agroph. 2009, 13, 601–613. [Google Scholar]
  40. Gaspar, A.P.; Laboski, C.A.M.; Naeve, S.L.; Conley, S.P. Dry matter and nitrogen uptake, partitioning, and removal across a wide range of soybean seed yield levels. Crop Sci. 2017, 57, 2170–2182. [Google Scholar] [CrossRef] [Green Version]
  41. La Menza, N.C.; Monzon, J.P.; Specht, J.E.; Grassini, P. Is soybean yield limited by nitrogen supply? Field Crops Res. 2017, 213, 204–212. [Google Scholar] [CrossRef]
  42. Hungria, M.; Franchini, J.C.; Campo, R.J.; Crispino, C.C.; Moraes, J.Z.; Rubson, N.R.; Mendes, I.C.; Arihara, J. Nitrogen nutrition of soybean in Brazil: Contributions of biological N2 fixation and N fertilizer to grain yield. Can. J. Plant Sci. 2006, 86, 927–939. [Google Scholar] [CrossRef] [Green Version]
  43. Deaker, R.; Roughley, R.J.; Kennedy, I.R. Legume seed inoculation technology—A review. Soil Biol. Biochem. 2004, 36, 1275–1288. [Google Scholar] [CrossRef]
  44. Anda, A.; Soós, G.; Menyhárt, L.; Kucserka, T.; Simon, B. Yield features of two soybean varieties under different water supplies and field conditions. Field Crops Res. 2020, 245, 107673. [Google Scholar] [CrossRef]
  45. Andrade, J.F.; Rattalino, E.J.I.; Mourtzinis, S.; Conley, S.P.; Ciampitti, I.A.; Dunphy, J.E.; Gaska, J.M.; Glewen, K.; Holshouser, D.L. Assessing the influence of row spacing on soybean yield using experimental and producer survey data. Field Crops Res. 2019, 230, 98–106. [Google Scholar] [CrossRef]
Figure 1. Meteorological conditions on soybeans cultivation time in 2015 and 2016 years, Akademija.
Agronomy 11 00214 g001
Figure 2. Development stages of soybean Merlin sowed in different dates in 2015 and 2016. Indices: VE—emergence; V1—first trifoliate, R1—beginning flowering, R3—beginning of pod formation, R6—full seed, R8—full maturity.
Agronomy 11 00214 g002
Figure 3. Maturity level of soybean Merlin on 17 October 2016, affected by various treatments. Means followed by the same letters in the same column and section do not differ one another (p ≤ 0.05).
Agronomy 11 00214 g003
Figure 4. Grain yield in response of management factors and interactions in 2015 and 2016 crop seasons. Means followed by the same letters in the same column and section do not differ one another (p ≤ 0.05). Abbreviations: ST—sowing time, S1—earlier sowing time, S2—2 weeks later sowing time, RS—rows spacing, I—inoculation.
Agronomy 11 00214 g004
Figure 5. The 1000 grain weight of soybean in response of management factors and interactions in 2015 and 2016 crop seasons. Means followed by the same letters in the same column and section do not differ one another (p ≤ 0.05). Abbreviations: ST—sowing time, S1—earlier sowing time, S2—2 weeks later sowing time, RS—rows spacing, I—inoculation.
Agronomy 11 00214 g005
Table 1. Significant effects of various treatments on Merlin soybean yield components in 2015 and 2016 crop seasons.
TreatmentsNumber of Plants (n° m−1)Aboveground Biomass (DM g Plant−1)Number of Pods (n° Plant−1)Number of Seeds in Pod (n° pod−1)Seed Yield on Plant (g Plant−1)Weight of Nodules (g Plant−1)
2015 crop season:
Sowing time (ST)ns****ns****
Rows spacing (RS)******ns**ns
Inoculation (I)*nsnsns***
ST × RSns*nsns**ns
ST × I**nsnsnsns**
RS × Insnsnsnsnsns
ST × RS × I*nsnsnsnsns
2016 crop season:
Sowing time (ST)***nsns****
Rows spacing (RS)*****ns**ns
Inoculation (I)ns****ns****
ST × RSnsnsnsns**ns
ST × I***nsns****
RS × I****nsns**ns
ST × RS × I****ns**ns
* Significant at p = 0.05; ** Significant at p = 0.01 level; NS—not significant.
Table 2. Effect of management factors and interaction on soybean plant number in 2015 and 2016 crop seasons.
Management Factors:Number of Plants (n° m−2)
20152016
ST × RS × I
S1 + 50 cm + Non28 a28 a
S1 + 50 cm + Ino34 b36 bc
S1 + 25 cm + Non73 e44 d
S1 + 25 cm + Ino62 d52 e
S2 + 50 cm + Non30 ab32 ab
S2 + 50 cm + Ino41 c41 cd
S2 + 25 cm + Non63 d66 f
S2 + 25 cm + Ino76 e45 d
Means followed by the same letters in the same column do not differ one another (p ≤ 0.05). Abbreviations: ST—sowing time, S1—earlier sowing time, S2—2 weeks later sowing time, RS—rows spacing, I—inoculation.
Table 3. Accumulated aboveground biomass, number of pods, and seed yield of soybean Merlin cultivated (a) in 2015 and (b) in 2016 crop season.
(a)
2015
Management Factors:Aboveground Biomass (DW g Plant−1)Number of Pods (n° Plant−1)Seed Yield on Plant (g Plant−1)
Sowing time
S17.9 a14.1 a2.9 a
S211.9 b18.1 b4.6 b
Rows spacing
50 cm11.5 b18.1 b5.6 b
25 cm8.3 a14.1 a 1.9 a
Inoculation
Ino10.7 ns17.2 ns4.1 b
Non9.1 ns15.1 ns3.4 a
ST × RS
S1 + 50 cm8.5 ab15.1 ns4.2 b
S1 + 25 cm7.2 a13.1 ns1.6 a
S2 + 50 cm14.5 c21.2 ns7.1 c
S2 + 25 cm9.3 b15.1 ns2.1 a
(b)
2016
Management Factors:Aboveground Biomass (DW g Plant−1)Number of Pods (n° Plant−1)Seed Yield on Plant (g Plant−1)
ST × RS × I
S1 + 50 cm + Non8.5 bc11.3 bc3.2 c
S1 + 50 cm + Ino16.8 e19.9 e7.9 d
S1 + 25 cm + Non7.1 b17.0 d1.5 a
S1 + 25 cm + Ino10.2 d11.9 bc2.4 b
S2 + 50 cm + Non8.9 cd12.9 bc2.6 b
S2 + 50 cm + Ino10.1 d13.5 c3.6 c
S2 + 25 cm + Non5.5 a7.7 a1.0 a
S2 + 25 cm + Ino8.8 cd10.9 b1.5 a
Means followed by the same letters in the same column and section do not differ one another (p ≤ 0.05). Abbreviations: ST—sowing time, S1—earlier sowing time, S2—2 weeks later sowing time, RS—rows spacing, I—inoculation, DW—dry weight.
Table 4. Weight of nodules of soybean Merlin cultivated in 2015 and 2016 crop seasons.
Management Factors:Weight of Nodules (g Plant−1)
20152016
Sowing time (ST)
S10.098 b0.616 b
S20.031 a0.024 a
Inoculation (I)
Non0.000 a0.000 a
Ino0.129 b10.240 b
ST x I
S1 + Non0.000 a0.000 a
S1 + Ino0.196 c1.233 c
S2 + Non0.000 a0.000 a
S2 + Ino0.062 b0.047 b
Means followed by the same letters in the same column and section do not differ one another (p ≤ 0.05). Abbreviations: ST—sowing time, S1—earlier sowing time, S2—2 weeks later sowing time, RS—rows spacing, I—inoculation.
Table 5. Significant effects of various treatments for soybean Merlin grain yield and yield quality in 2015 and 2016 crop seasons.
TreatmentsGrain Yield (kg ha−1)1000 Grain Weight (g Plant−1)Protein Content (%)Fat Content (%)
20152016201520162015201620152016
Significance:
Sowing time (ST)ns**ns*nsns****
Rows spacing (RS)**nsnsns******ns
Inoculation (I)ns**************
ST × RSnsnsnsns*nsnsns
ST × Ins**ns*********
RS × Insnsnsns**ns**ns
ST × RS × Insnsnsnsns**nsns
* Significant at p = 0.05; ** Significant at p = 0.01 level; NS—not significant.
Table 6. Protein content of soybean Merlin cultivated in 2015 and 2016 crop seasons.
Management Factors:Protein Content (%) in 2015
ST × RS
S1 + 50 cm34.7 c
S1 + 25 cm32.5 a
S2 + 50 cm34.2 bc
S2 + 25 cm33.8 b
ST × I
S1 + Non31.6 a
S1 + Ino35.7 d
S2 + Non33.4 b
S2 + Ino34.6 c
RS × I
50 cm + Non33.6 b
50 cm + Ino35.3 c
25 cm + Non31.3 a
25 cm + Ino35.0 c
Management Factors:Protein Content (%) in 2016
ST × RS × I
S1 + 50 cm + Non29.5 b
S1 + 50 cm + Ino34.6 g
S1 + 25 cm + Non27.4 a
S1 + 25 cm + Ino33.9 f
S2 + 50 cm + Non31.1 d
S2 + 50 cm + Ino32.0 e
S2 + 25 cm + Non31.2 d
S2 + 25 cm + Ino30.7 c
Means followed by the same letters in the same column and section do not differ one another (p ≤ 0.05). Abbreviations: ST—sowing time, S1—earlier sowing time, S2—2 weeks later sowing time, RS—rows spacing, I—inoculation, ns—not significant.
Table 7. Fat content of soybean Merlin cultivated in 2015 and 2016 crop seasons.
Management Factors:Fat Content (%)
20152016
ST × I
S1 + Non21.5 c20.0 c
S1 + Ino19.8 b18.5 b
S2 + Non19.8 b17.8 a
S2 + Ino19.4 a17.4 a
RS × I
50 cm + Non20.1 b19.0 ns
50 cm + Ino19.5 a17.9 ns
25 cm + Non21.2 c18.7 ns
25 cm + Ino19.7 a18.0 ns
Means followed by the same letters in the same column and section do not differ one another (p ≤ 0.05). Abbreviations: ST—sowing time, S1—earlier sowing time, S2—2 weeks later sowing time, RS—rows spacing, I—inoculation, ns—not significant.
Publisher’s Note: MDPI stays neutral with regard to jurisdictional claims in published maps and institutional affiliations.

