Article

Soil Quality Restoration during the Natural Succession of Abandoned Cattle Pastures in Deforested Landscapes in the Colombian Amazon

by
Carlos H. Rodríguez-León
1,2,
Clara P. Peña-Venegas
3,*,
Armando Sterling
2,
Daniel Castro
3,
Lizeth K. Mahecha-Virguez
2,
Yeny R. Virguez-Díaz
2 and
Adriana M. Silva-Olaya
4
1
Doctoral Program in Natural Sciences and Sustainable Development, Faculty of Agricultural Sciences, Universidad de la Amazonía, Florencia 180001, Caquetá, Colombia
2
Laboratory of Phytopathology, Amazonian Scientific Research Institute Sinchi—Faculty of Basic Sciences, Universidad de la Amazonía, Florencia 180001, Caquetá, Colombia
3
Laboratory of Microbiology, Amazonian Scientific Research Institute Sinchi, Leticia 910001, Amazonas, Colombia
4
Laboratory of Biogeochemical Processes, Amazonian Research Center CIMAZ-MACAGUAL, Universidad de la Amazonía, Florencia 180001, Caquetá, Colombia
*
Author to whom correspondence should be addressed.
Agronomy 2021, 11(12), 2484; https://doi.org/10.3390/agronomy11122484
Submission received: 2 November 2021 / Revised: 22 November 2021 / Accepted: 29 November 2021 / Published: 7 December 2021
(This article belongs to the Special Issue Soil Quality Evaluation Using Biological Properties)

Abstract

:
Successional processes in abandoned pastures in the Amazon region have been well-documented for the floristic component; however, soil succession has been poorly studied. This study assessed the physical, chemical and biological responses of soils in the Amazon region during the natural succession process in two main landscapes of the Colombian Amazon. Soil data on soil physico–chemical (bulk density, macroaggregates, pH and minerals) and biological (soil macrofauna) composition were evaluated along chronosequence with four successional stages: (i) degraded pastures, (ii) young (10–20-year-old), (iii) middle-age (25–40-year-old) and (iv) mature forests, in two different landscapes (hill and mountain). Individual soil variables and a synthetic indicator of soil quality (GISQ) were evaluated as tools for natural succession monitoring. The results corroborated the negative impact that cattle ranching has on Amazon soils. After 10 years of natural succession, the physico–chemical and biological soil components were widely restored. Less soil compaction and organic carbon occurred in older successional stages. Soil macrofauna richness and density increased along the chronosequence, with an evident association between the macrofauna composition and the macroaggregates in the soil. None of the individual soil properties or the GISQ indicator discriminated among natural succession stages; therefore, new soil quality indicators should be developed to monitor soil quality restoration in natural successions.

Graphical Abstract

1. Introduction

The Amazon Forest is one of the largest tropical rainforests in the world and plays an important role by providing a wide variety of ecosystem services [1,2,3,4]. However, the expansion of the agricultural frontier has promoted an extensive deforestation process, causing the loss of 2.3 million ha of primary forests in 2020 [5], with a large section in Colombia. The establishment of pastures for livestock production has caused annual forest losses of 138,000 ha, resulting in the second deforestation hotspot in the Amazon Basin [6]. The land-use change, with overgrazing of pastures and poor soil management has induced significant physical, chemical and biological degradation of soils [7,8,9,10], leading to unproductive pastures that are subsequently abandoned. The Amazon ecosystem has a high resilience [11] and considerable potential of natural regeneration [12,13,14]. Once grazing ceases and pastures are abandoned, a natural regeneration (also called regrowth or natural succession) take place.
In general, when abandoned agricultural areas go into secondary succession, changes in the soil properties are expected, but the alterations on soil functioning are complex and seem to be ecosystem dependent [15,16]. Contrasting results have been reported in recent years. While the successional stage has been found to influence the soil organic carbon (SOC) content in the Brazilian Atlantic Forest [17,18] and the Lose Plateatu in China [19], this crucial indicator of soil quality did not reach the same level of natural forests even after 40 and 60 years of natural succession in a semi-arid environment and sub-humid Mediterranean area, respectively [16,20].
Successional processes of abandoned pastures in the Amazon region have been well-documented for the floristic component [21,22,23]. However, comprehensive studies on changes in soil properties and soil quality during this process are lacking. The soil is a complex matrix composed by solid, liquid and gaseous phases, with a biotic component and multiple natural and anthropic functions [24]. Most soil studies have focused their attention in chemical (total organic matter/carbon, pH and available P) or physical (bulk density or soil water storage) variables as soil quality indicators [25,26,27]. Soil organic matter/carbon is a ubiquitous soil quality indicator. It could change with soil management and land use, but those changes are not easy to track and relate with soil quality, especially along the successional pathways [25].
Recently, soil biological indicators have been proposed [26,27,28] as they play crucial roles in soil function [29,30,31,32]. Most soil studies have used soil biomass and soil respiration as soil quality indicators, but the analysis of those parameters are limited as they require standardized techniques at the laboratory. Soil macrofauna could be a proper biological indicator of soil quality as measurements can be carried out even in the field [33]. A recent report indicated that, although inventories of soil biological groups are becoming more robust around the world, the function and role that biological communities play in soil quality and soil function [34] are still poorly understood. Edaphic organisms influence soil structuration directly [35,36,37,38], with their species composition affecting the functional structure of soils and improving soil fertility [39,40,41]; therefore, soil macrofauna can relate changes in soil physical and chemical variables with soil functioning [42]. Velasquez et al. [33] developed a General Indicator Soil of Quality (GISQ) in which to evaluate the physical state, the chemical fertility/quality and organic matter stocks of the soil, the aggregation and morphology of the topsoil, and the diversity and composition of soil macrofauna, to evaluate soil ecosystem services without defining an a priori criteria for soil quality, and that could be used to compare different plots, landscapes and sites.
Changes in the quality of Amazon soils associated to land use changes have been assessed by soil chemical indicators [43,44,45], soil physical indicators [43], soil biological indicators [46,47,48,49] and combinations of soil variables [33,41,48,49]. Pasture, as the most intense land use change, presents the most dissimilar conditions among other land uses, such as its microbial composition [50] and microbial activity [51]. Soil microbial communities seem not to be severely affected, while soil macrofauna does [47,52]. In addition, there are different soil macrofauna compositions in natural and anthropic soils due to management practices that modify soil conditions and edaphic biotic interactions [53].
Although several indexing strategies have been implemented for assessing and monitoring soil quality in different ecosystems around the world [42,54,55,56,57,58,59,60], none have been applied to a restoration process in Amazonian soil conditions. For example, the GISQ can discriminate well between mature forest and covers dominated by grasses (pastures and silvopastoral systems) [49] and between covers with different intensity of use [48], but it has not yet proven if it can also discriminate the soil quality among different successional stages. In the same way, how soil macrofauna communities are influenced by the soil quality of the Amazon region [48,61] and how sensitive they are to soil disturbances, and their relation to physical–chemical attributes and soil aggregation during the natural restoration of degraded pastures has not been widely addressed [45,62,63].
This study aimed to assess: (i) individual responses of soil physical, chemical and biological variables along the natural succession of abandoned pastures in two contrasting landscapes in the Colombian Amazon region, and (ii) evaluate individual and synthetic indicators of soil quality along the natural succession and their capacity to discriminate different successional stages along a natural restoring chronosequence.

2. Materials and Methods

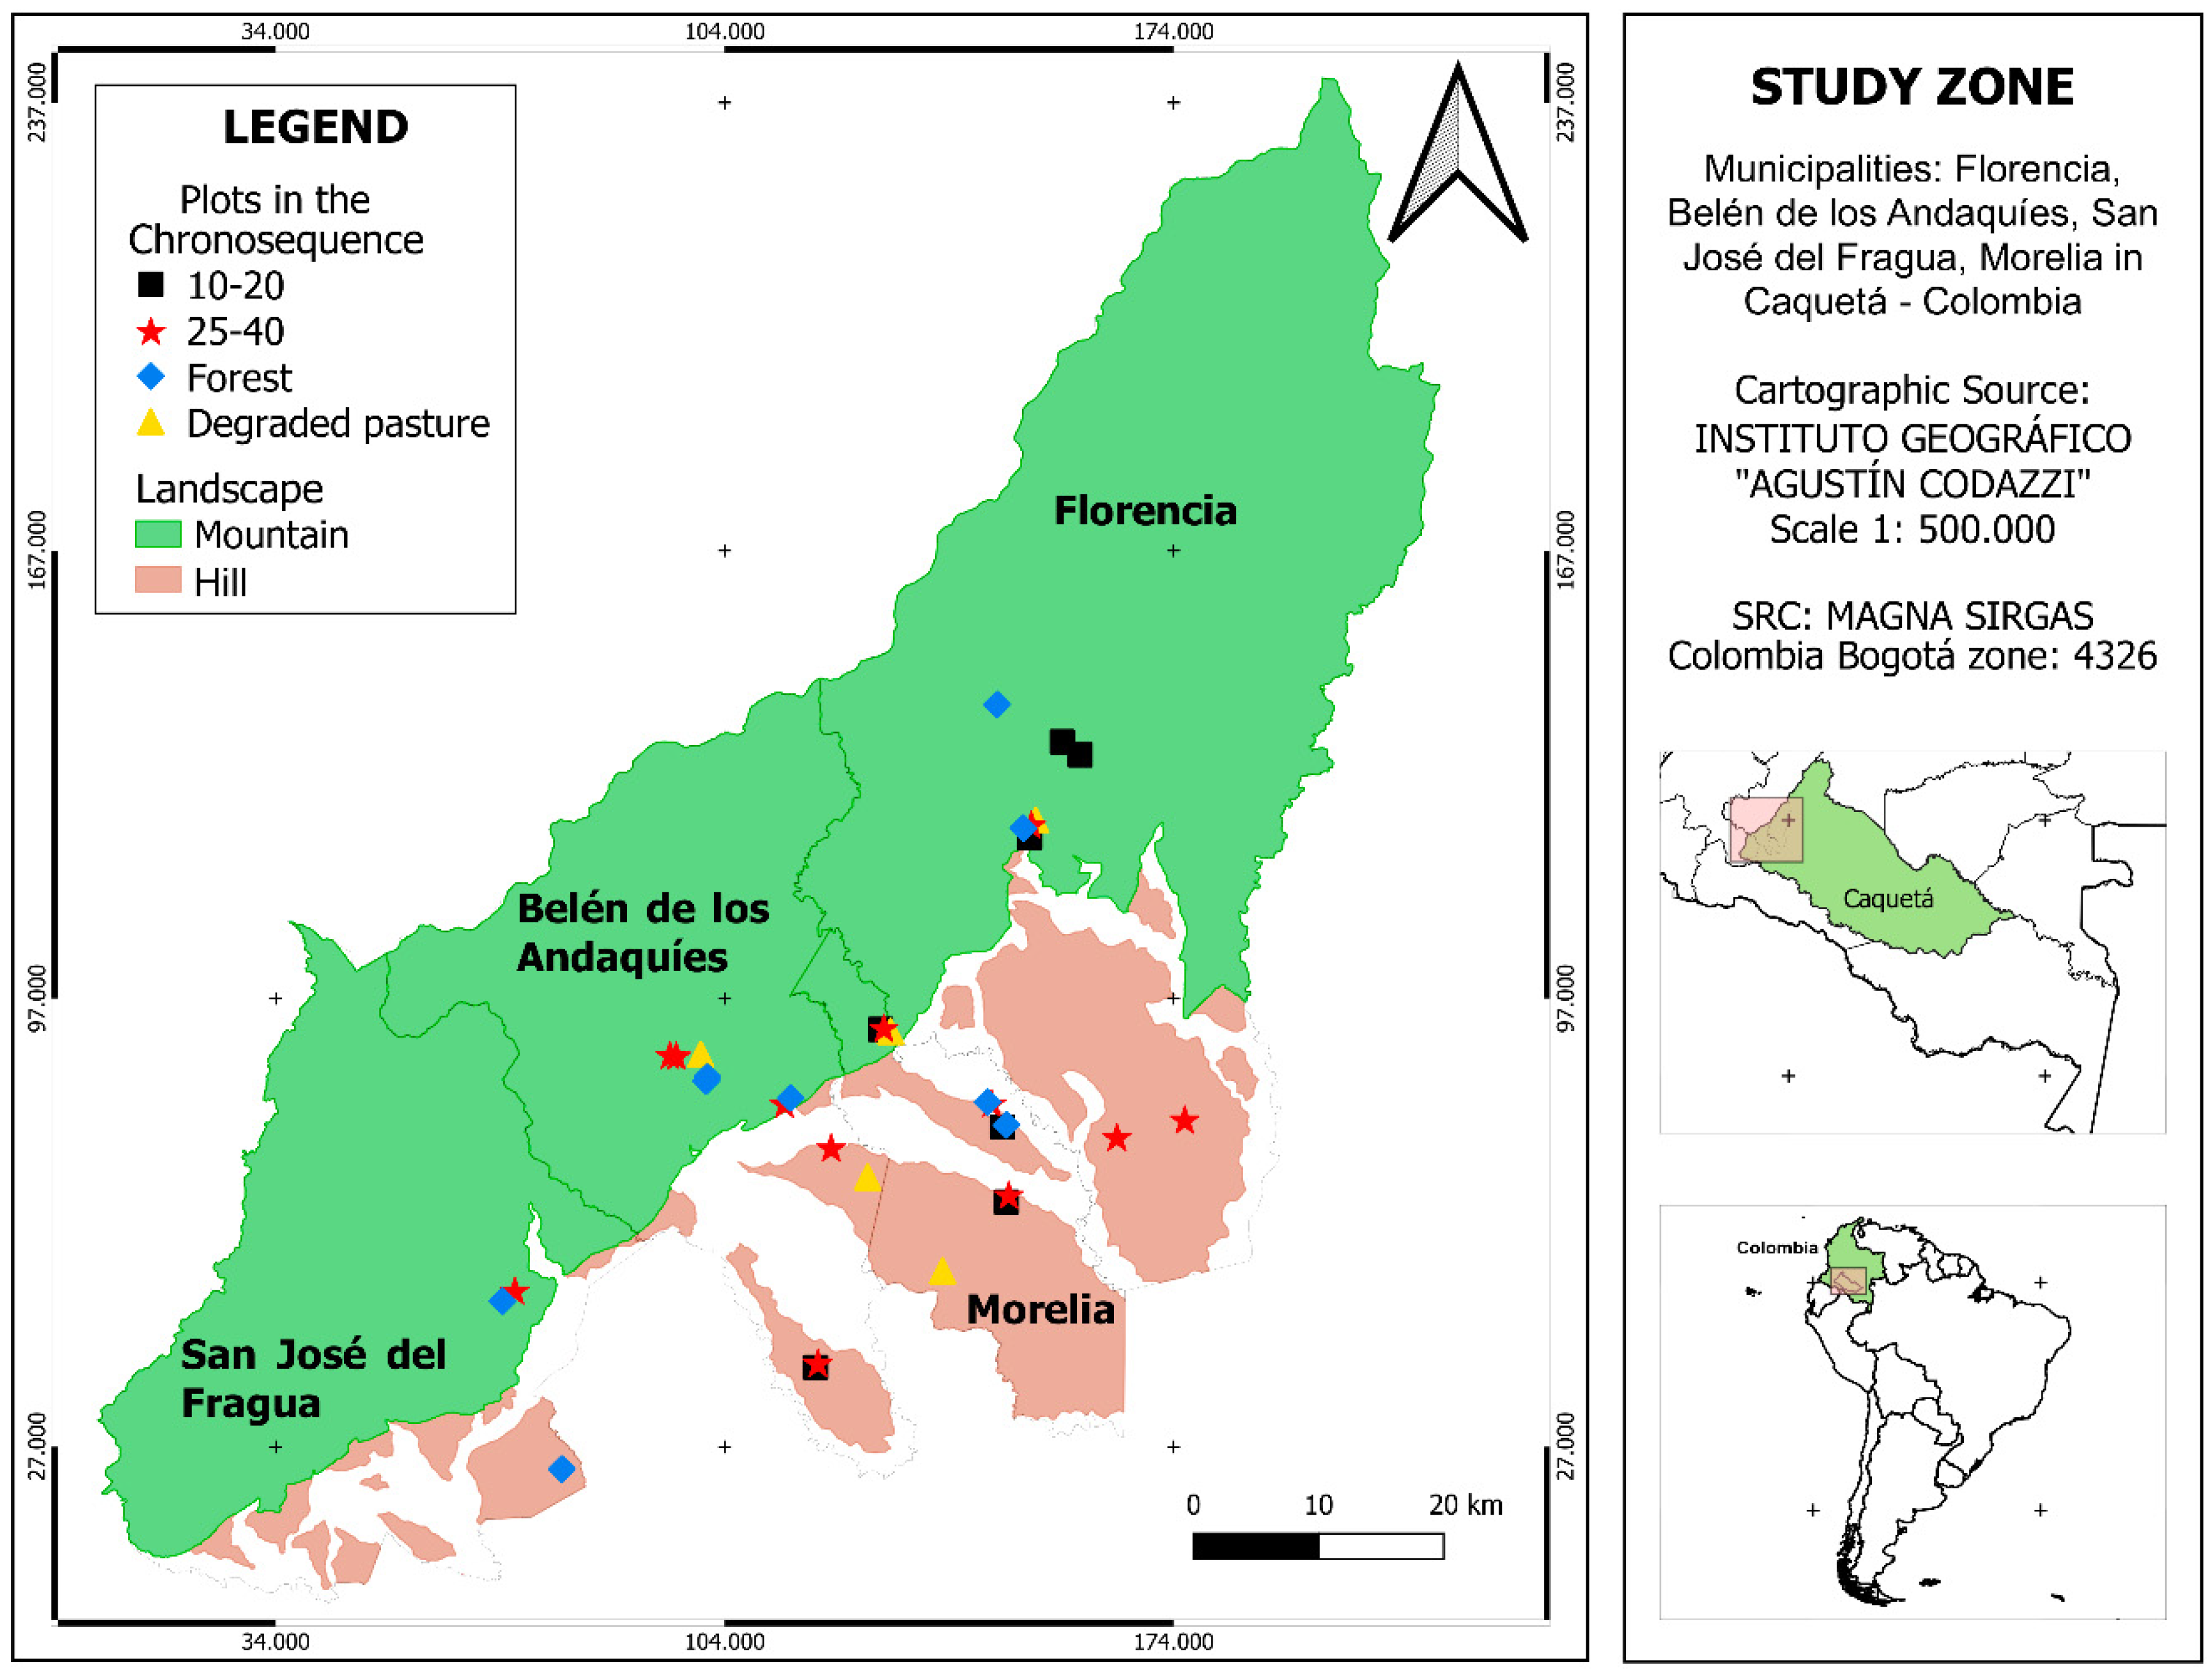
2.1. Study Area and Sampling Design

This study was performed in Caquetá, located in the northwestern Colombian Amazon, specifically in the municipalities of Florencia (1°36′50″ N; 75°36′46″ W), Morelia (1°29′09″ N; 75°43′28″ W), Belén de los Andaquíes (1° 24′59.1″ N; 75°52′21.2″ W), and San José del Fragua (1°19′52″ N; 75°58′28″ W) (Figure 1), which encompass two main landscapes of the Colombian Amazon: hills, characterized by an undulated landscape originating from the Amazonian plains and usually used for cattle ranching and, therefore, covered by pastures with a high level of degradation [64], and mountains, part of the Andean–Amazonian transition, with high slopes usually covered by a combination of natural forests, pastures and agricultural landscapes [64].
Soils in the study area are characterized by a low pH (between 4.5 and 5.8), with a high percentage of clay with kaolinite and quartz particles, classified as Oxisols and Ultisols (USDA soil classification), which show different grade of drainage limitation, aluminum saturation and low quantities of carbon, potassium, phosphorous and magnesium in the mineral horizons [65].
A random stratified sampling with optimum assignation established 14 and 19 plots of 50 × 50 m (0.25 ha) in hill and mountain landscapes, respectively. Then, a chronosequence composed of four successional categories was established in each landscape type: (i) degraded pasture, corresponding to degraded pastures with successional stages <3-year-old with shrubby vegetation, (ii) 10–20, corresponding to successional coverings between 10–20-year-old forests or young secondary forests, (iii) 25–40, corresponding to successional coverings between 25–40-year-old forest or intermediate secondary forest and (iv) forest (mature forest). A total of five, seven, twelve and nine plots were evaluated in the degraded pastures, 10–20, 25–40 and forest areas, respectively, in the two landscapes. The number of plots by successional category was different because of the availability of natural regrowth patches found in the study area that matched our selection criteria: the plots were identified from knowledge of owners of local farms about the sites-use history [17] and particular floristic attributes of the vegetation, such as the floristic composition, plant species density, truck diameter and basal area of plant species [66].
Degraded pastures included a mixed cover with degraded Brachiaria spp. grasses [67], weeds such as Urochloa decumbens (Poaceae), Homolepsis aturensis (Poaceae), Cyperus sp. (Cyperaceae), Scleria melaleuca (Cyperaceae) and Steinchisma laxum (Poaceae), and some shrub species. These areas presented the lowest plant richness, with 34 families and 103 species, with Melastomataceae (17), Annonaceae (9), Burseraceae (8), and Euphorbiaceae (7), as the most representative families, and plant species, such as Miconia elata (163), Miconia minutiflora (156) and Miconia lourtegiana (103).
Plots of 10–20-year-old forests were dominated by shrubs from the families Melastomataceae (27), Mimosaceae (20), Rubiaceae (18), Moraceae (15), Annonaceae (14), Euphorbiaceae (13), Lauraceae (13), Myrtaceae (10), Flacourtiaceae (9), and Arecaceae, Burseraceae, Caesalpiniaceae, Cecropiaceae, Fabaceae, and Fabaceae, with one species from each. The most abundant plant species were Siparuna guianensiss (138) Henriettea fascicularis (89), Adenocalymma aspericarpum (76), Piptocoma discolor (71) and Inga thibaudiana (69).
Plots of 25–40-year-old forests were characterized by pioneer tree species dominating the canopy, which included species from the families Rubiaceae (43), Melastomataceae (40), Mimosaceae (33), Moraceae (33), Fabaceae (30), Annonaceae (28), Lauraceae (27), Burseraceae (18), Clusiaceae (18), Euphorbiaceae (18) and Myristicaceae (17). The most dominant plant species were Tapirira guianensis (134), Siparuna guianensiss (120), Adenocalymma aspericarpum (114), Casearia arborea (87), Henriettea fascicularis (61), Matayba inelegans (49) and Guatteria punctata (49).
The forest corresponded to an old-growth or mature forest with the highest plant richness, a complex structure and diverse plant composition with trees, arborescent ferns and a well-developed understory and a well-stratified canopy. The richest plant families were Lauraceae (43), Rubiaceae (39), Melastomataceae (38), Fabaceae (36), Burseraceae (27), Sapotaceae (27), Moraceae (25), Mimosaceae (23), Annonaceae (22), Euphorbiaceae (19) y Chrysobalanaceae (16) Elaeocarpaceae (12), Meliaceae (12), Arecaceae (10), Myristicaceae (10), Sapindaceae (9), Caesalpiniaceae (8) Clusiaceae (7), Nyctaginaceae (7) and Lecythidaceae(6). The most abundant plant species were: Pseudosenefeldera inclinata (197), Wettinia praemorsa (135), Virola elongata (87), Ladenbergia muzonensis (56), Graffenrieda colombiana (50) and Geonoma maxima (47).
The degraded pasture, 10–20 and 25–40 categories were pooled and identified as “disturbed”, and the forest was identified as “undisturbed” to compare the mean values of the soil biological, physical and chemical properties between both areas. Detailed information on the studied plots and soil samples is in Table S1 (Supplementary Materials).

2.2. Soil Sampling and Evaluation of Soil Quality

The soil sampling was performed in 2018 during the dry season (November to February). In each 50 × 50 m plot, five sampling points (the four corners and center of the plot) were established to collect different soil samples and evaluate the biological (soil macrofauna), morphological (macroaggregates) and physicochemical soil properties [48,60,68].

2.2.1. Soil Macrofauna

The soil macrofauna was collected following the methodology proposed by TSBF/ISO 23611–5 [69,70]. In each sampling point, a soil monolith of 25 × 25 cm and 30 cm depth was collected, which was stratified in four layers: litter, 0–10 cm depth, 10–20 cm depth and 20–30 cm depth. The soil macrofauna was extracted from each layer by hand-sorting all faunal individuals visible to the naked eye, which were preserved and labeled in a plastic vial with ethanol 80%. At the laboratory, all macrofauna individuals were cleaned, counted, separated by morphotype, and identified in taxonomic groups [29,71]. Additionally, the macrofauna density was calculated by quantifying the number of individuals m−2 of each biological group. All specimens were deposited in “Colección de artrópodos terrestres de la Amazonia Colombiana—CATAC” of the Sinchi Institute in the city of Leticia, Amazonas.

2.2.2. Soil Macroaggregation

The soil macro aggregates were evaluated following the methodology proposed by Velasquez et al. [60]. In each sampling point a soil monolith (10 × 10 × 10 cm) was collected and transported in a plastic container to the laboratory, where it was broken up and separated into aggregate morphologies [48,60], including (i) biogenic macroaggregates created by soil ecosystem engineers (earthworms, termites and ants), created by biological activity such as galleries, nests and coprolites; (ii) root macroaggregates created by roots, roots exudates and soil particles bonded together; (iii) physical macroaggregates created by bonded mineral particles, which usually present geometric shapes and edges in angles; and (iv) non-aggregated soil. Other soil components, including leaves, roots, and wood fragments, were also quantified to obtain the total percentage for the sample [48]. Macroaggregates were then dried at room temperature and weighed separately to determine the proportion (as percentage) of each macroaggregate in the soil sample.

2.2.3. Soil Physico–Chemical Properties

A small trench (30 × 30 × 30 cm) was opened in each sampling point to collect both undisturbed and disturbed soil samples at 10 cm increments until reaching a 30 cm depth (i.e., three soil layers), which were submitted to further analysis.
Different soil physical properties were evaluated through both in situ and laboratory methodologies. In the field, penetration resistance (MPa) was assessed by using an Eijkelkamp hand penetrometer. The laboratory soil samples were assessed for texture (sand, clay and silt) (as percentage) with Bouyoucos [72], bulk density (g cm−3) based on the mass/volume relationship [73], total porosity (as percentage) based on the bulk density and particle density [74], soil moisture (as percentage) estimated after drying of a composed soil sample in a forced-air oven at 105 °C for 24 h [74] and structural stability index, SI (%), using the Equation (1), as proposed by Pieri [75]:
SI = 1.724   SOC ( Silt + Clay ) × 100 ;   0   SI <
where, soil organic carbon content (SOC) is the percentage of soil organic carbon, Silt and Clay correspond to particles size fractions expressed in percentages, and 1.724 converts SOC to soil organic matter. According to Pieri [75]: SI > 9% indicates stable structure, 7% < SI ≤ 9% indicates low risk of structural degradation, 5% < SI ≤ 7% indicates high risk of degradation, and SI ≤ 5% indicates structurally degraded soil.
Soil chemical properties related to soil fertility [48,60] such as pH (conductimetric method), cation exchange capacity (CEC) (meq 100 g−1) (with ammonium acetate), electric conductivity (EC) (dS m−1) (conductimetric method), available phosphorus (P) (mg kg−1) (Bray II), exchangeable acidity (EA) (mg kg−1) (KCl 1N/Volumetric), soil organic carbon content (SOC) (%) (Walkley and Black method), total nitrogen (N) (%) (Kjeldhal), calcium (Ca) (mg kg−1), magnesium (Mg) (mg kg−1) (with ammonium acetate and atomic absorption spectroscopy) and potassium (K) (mg kg−1) (with ammonium acetate and atomic emission spectroscopy) were determined.

2.2.4. Soil Quality Assessment

To perform an overall evaluation for the 0–30 cm soil surface, soil data from the 0–10, 10–20 and 20–30 cm layers were grouped to an average value for each physical and chemical property. Similarly, the soil macrofauna data from the litter, 0–10, 10–20 and 20–30 cm layers were grouped to an average value for each taxonomic group. The soil macroaggregation data for the 0–10 cm soil layer were analyzed to an average value for each property evaluated. Then, we calculated a sub-indicator of soil quality for each data set (macrofauna, macroaggregation, physical and chemical) following the methodology proposed by Velásquez et al. [60]. First, a principal component analysis (PCA) of each of the four data set was performed, and the variables that contributed more than 50% of the maximum variability captured for PC1 and PC2 of the PCA were selected. At the second stage, the values of each variable were multiplied by their weight factors (variability explained by the component and variable contribution) and summed, obtaining a sub-indicator of (i) biodiversity, (ii) macroaggregation, (iii) chemical and (iv) physical, according to the Equation (2):
Y =   PC 1 ( α 1 a + β 1 b + γ 1 c ) +   PC 2 ( α 2 a + β 2 b + γ 2 c )
where Y is the sub-indicator value, PC is the captured variability (%) by the corresponding principal component, α, β and γ represent the contribution of the variables for their respective axes, and a, b and c, represent the variables values on their corresponding axes.
At the third stage, the values of the sub-indicators were normalized between 0.1 to 1, using Equation (3):
Y   = 0.1 + ( ( x   +   b ) / ( a   +   b ) )     0.9
where, Y is the transformed variable, x is the non-transformed variable, a is the maximum value of the variable, and b is the minimum value of the variable.
Finally, the General Indicator Soil of Quality (GISQ) was calculated from four sub-indicators of soil quality (biodiversity, macroaggregation, physical and chemical) using the same procedure for the sub-indicators calculation.

2.3. Statistical Analysis

The data were organized in four data sets: (i) macrofauna, (ii) macroaggregates, (iii) physical properties and (iv) chemical properties. To test the effects of landscapes and the successional categories as well as their interaction with the macroaggregates, physical and chemical soil properties, linear mixed-effects (LME) models were adjusted by considering plots as random effects. The normality and homoscedasticity were validated through exploratory analyses (QQ-plot and fitted-plot) of model residuals. Mean separation was carried out through an LSD Fisher test. Contrast of hypothesis was used to compare disturbed and undisturbed plots, using 5% significance. Macrofauna density was analyzed using generalized linear mixed-effects (GLME) models with negative binomial distribution and Poisson for taxonomic groups [48]. A PCA was done for each data set using a Monte-Carlo test (999 permutations) to evaluate significance (α = 0.05) in the stages of the chronosequence or landscapes. A PCA with a Monte-Carlo test (999 permutations) was performed on the matrix of sub-indicators and GISQ to relate them on the ordination plane with the successional categories and landscapes. In addition, LME models, Fisher’s LSD tests and box plots were used to compare the sub-indicators and GISQ between successional categories and landscapes. Finally, a co-inertia analysis was performed with the Monte-Carlo test (999 permutations) [76,77] to test significance in the covariation of the data sets. The LME and GLME models were fitted with the functions lme (package nlme) [78] and glmer (package lme4) [79] from R v.4.0.3 language [80] using the interface in InfoStat v.2020 [81]. The box plots were visualized with the ggplot function in R package ggplot 2 [82]. The PCA, Monte-Carlo test and coinertia analysis were performed in the ade4 [83] and factoextra [84] packages from R.

3. Results

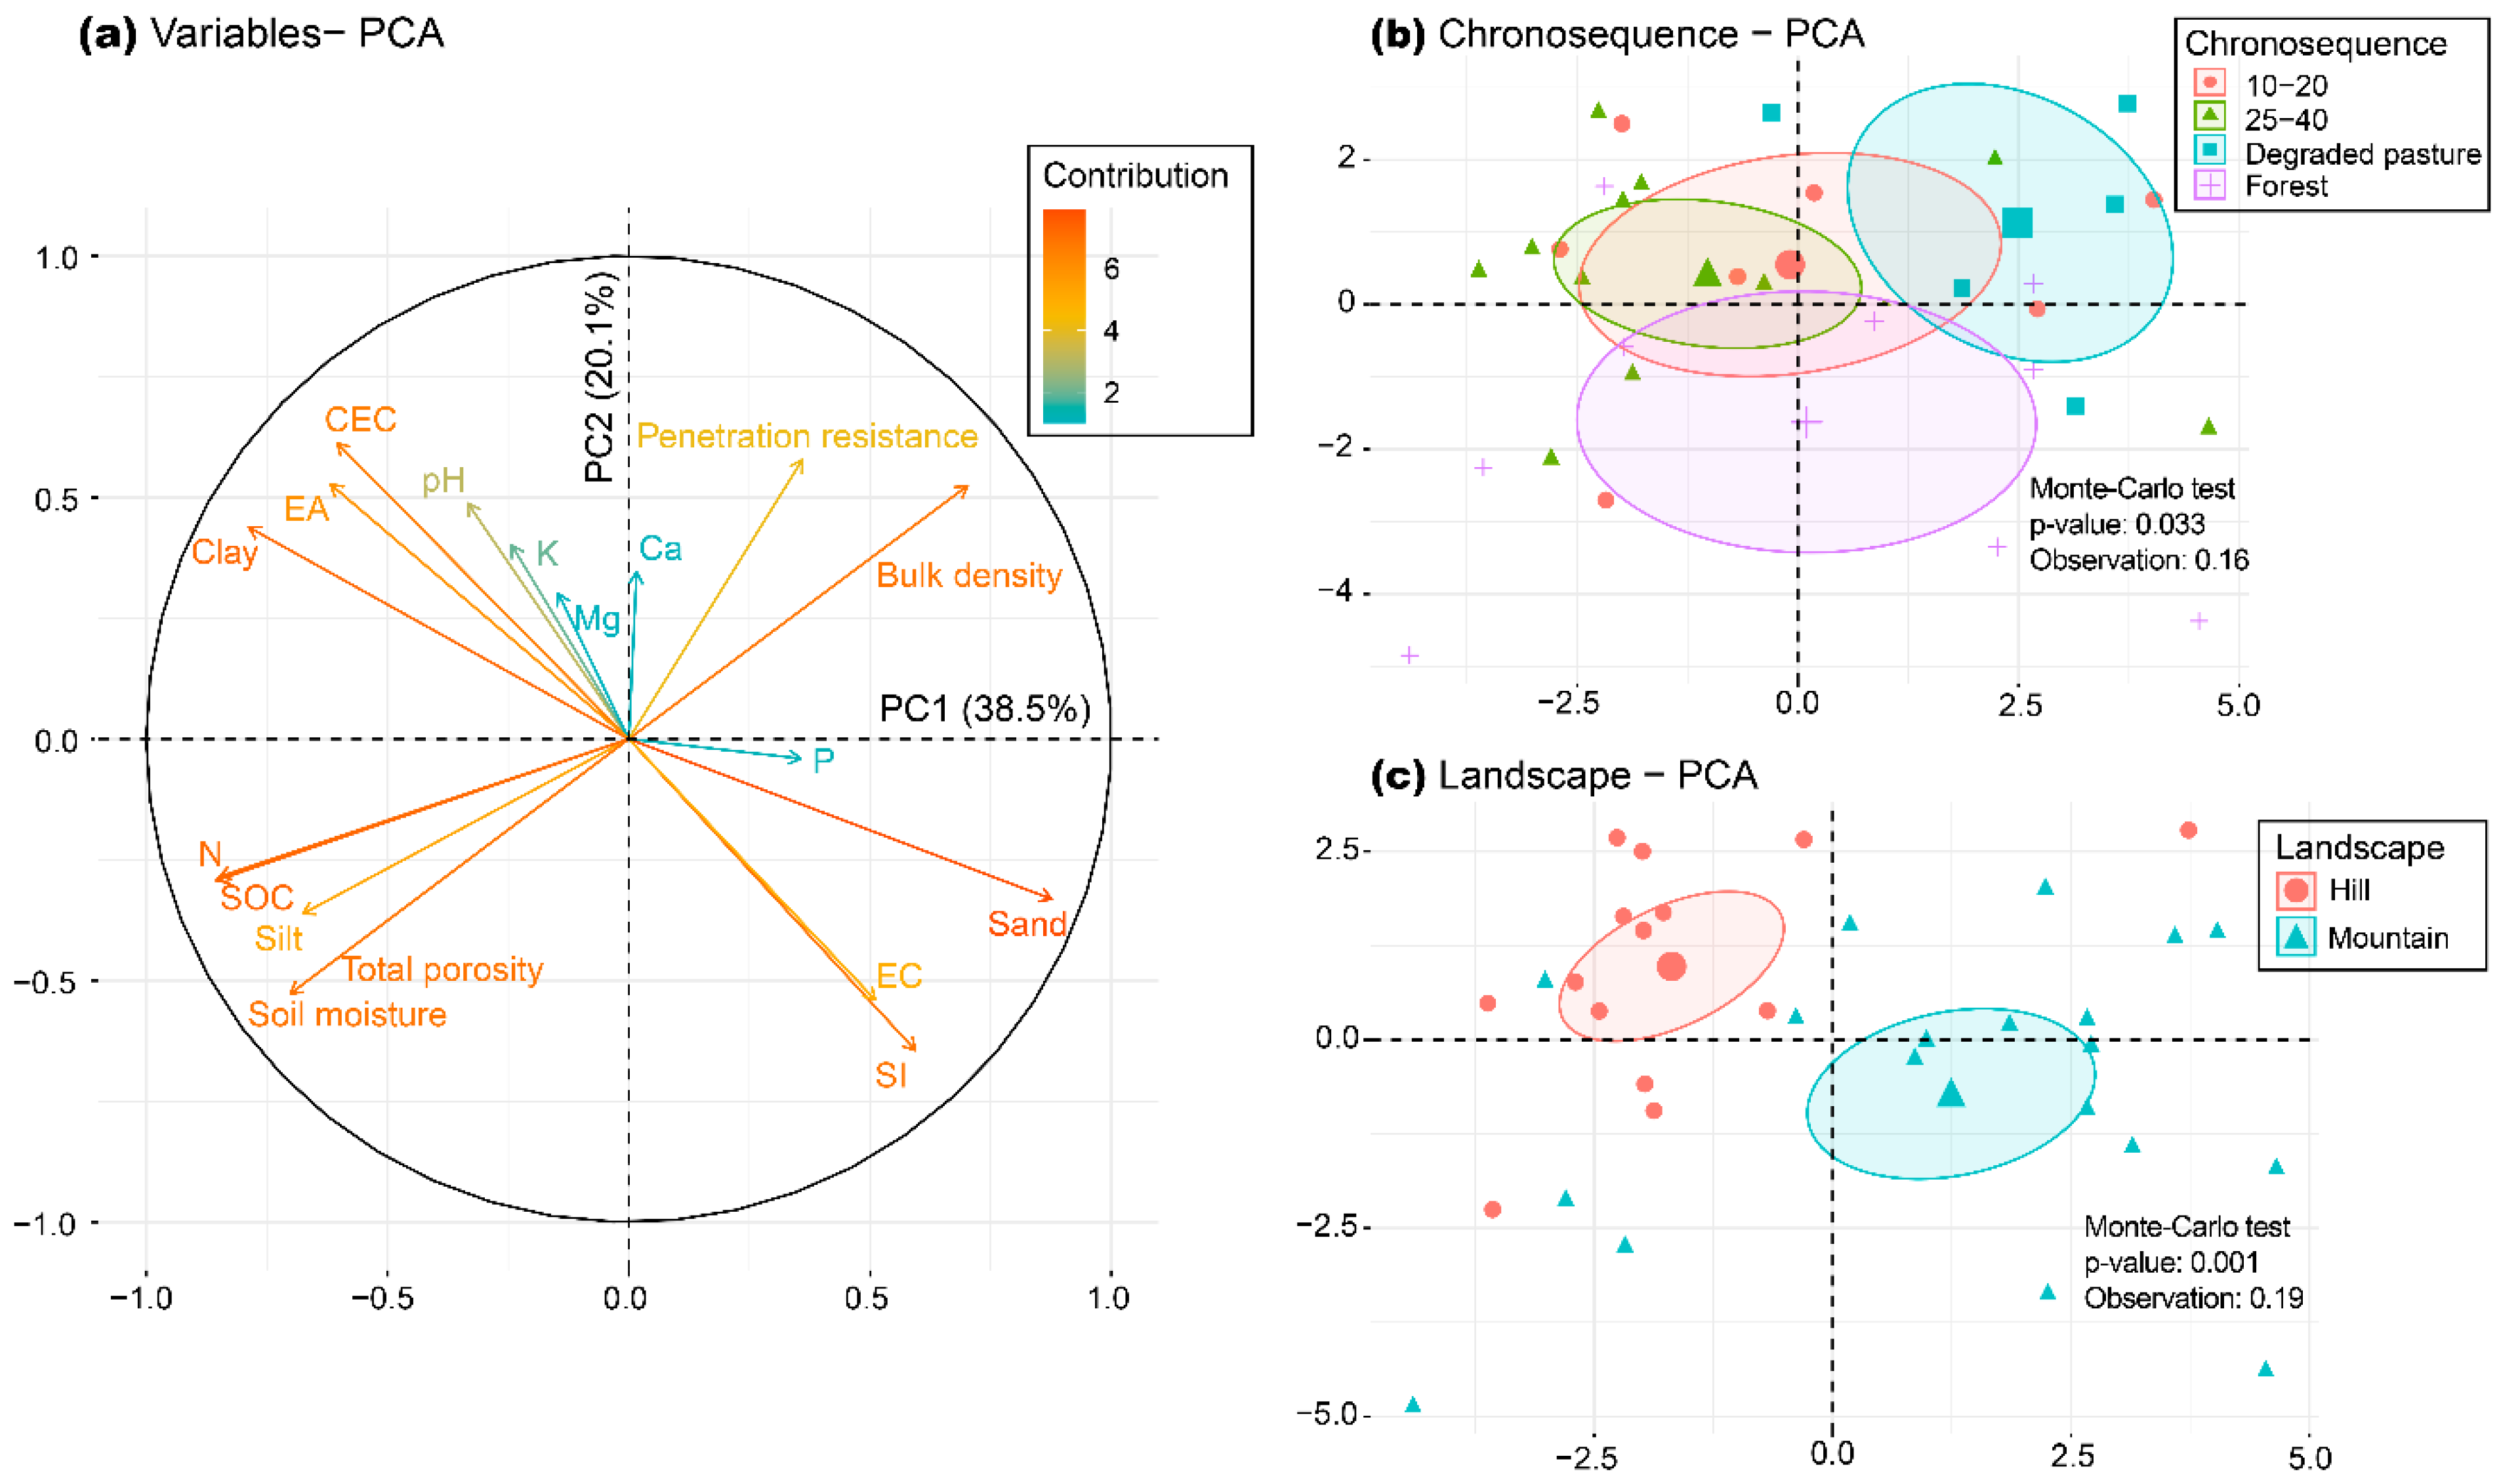
3.1. Changes in Soil Physico–Chemical Properties

The differences between the successional categories in the chronosequence were mainly related to the soil physical properties, such as penetration resistance and bulk density, which had higher values in the degraded pastures than the successional plots. Low values of SOC, N, EC and EA were also observed in the degraded pastures (Table 1).
In addition, the bulk density and penetration resistance were significantly higher in the disturbed areas, while the total porosity and moisture soil were higher in the undisturbed areas (Table 1). Significantly higher acidity and high CEC values were observed in the undisturbed areas.
The relationship between the soil physico–chemical properties, the landscapes and the successional categories was evaluated with PCA (Figure 2).
The first two components explained 58.6% of the variance, with the physico–chemical composition of soils grouped into clusters clearly defined according to the landscapes (Figure 2c) (p < 0.01; 19% of explained variance) and the successional categories (Figure 2b), showing a significant effect from the chronosequence (p < 0.05; 16%).
The interaction between the chronosequence and landscape was not significant for any chemical and physical property (p > 0.05); therefore, the principal effects were interpreted directly (Table 1). The main differences between the landscapes occurred in the soil texture and soil acidity. Differences in soil texture were also reflected as differences in some physical properties, such as bulk density, total porosity, soil moisture and SI. Differences in the pH were also reflected as differences in some associated chemical properties, such as CEC, EC and EA.

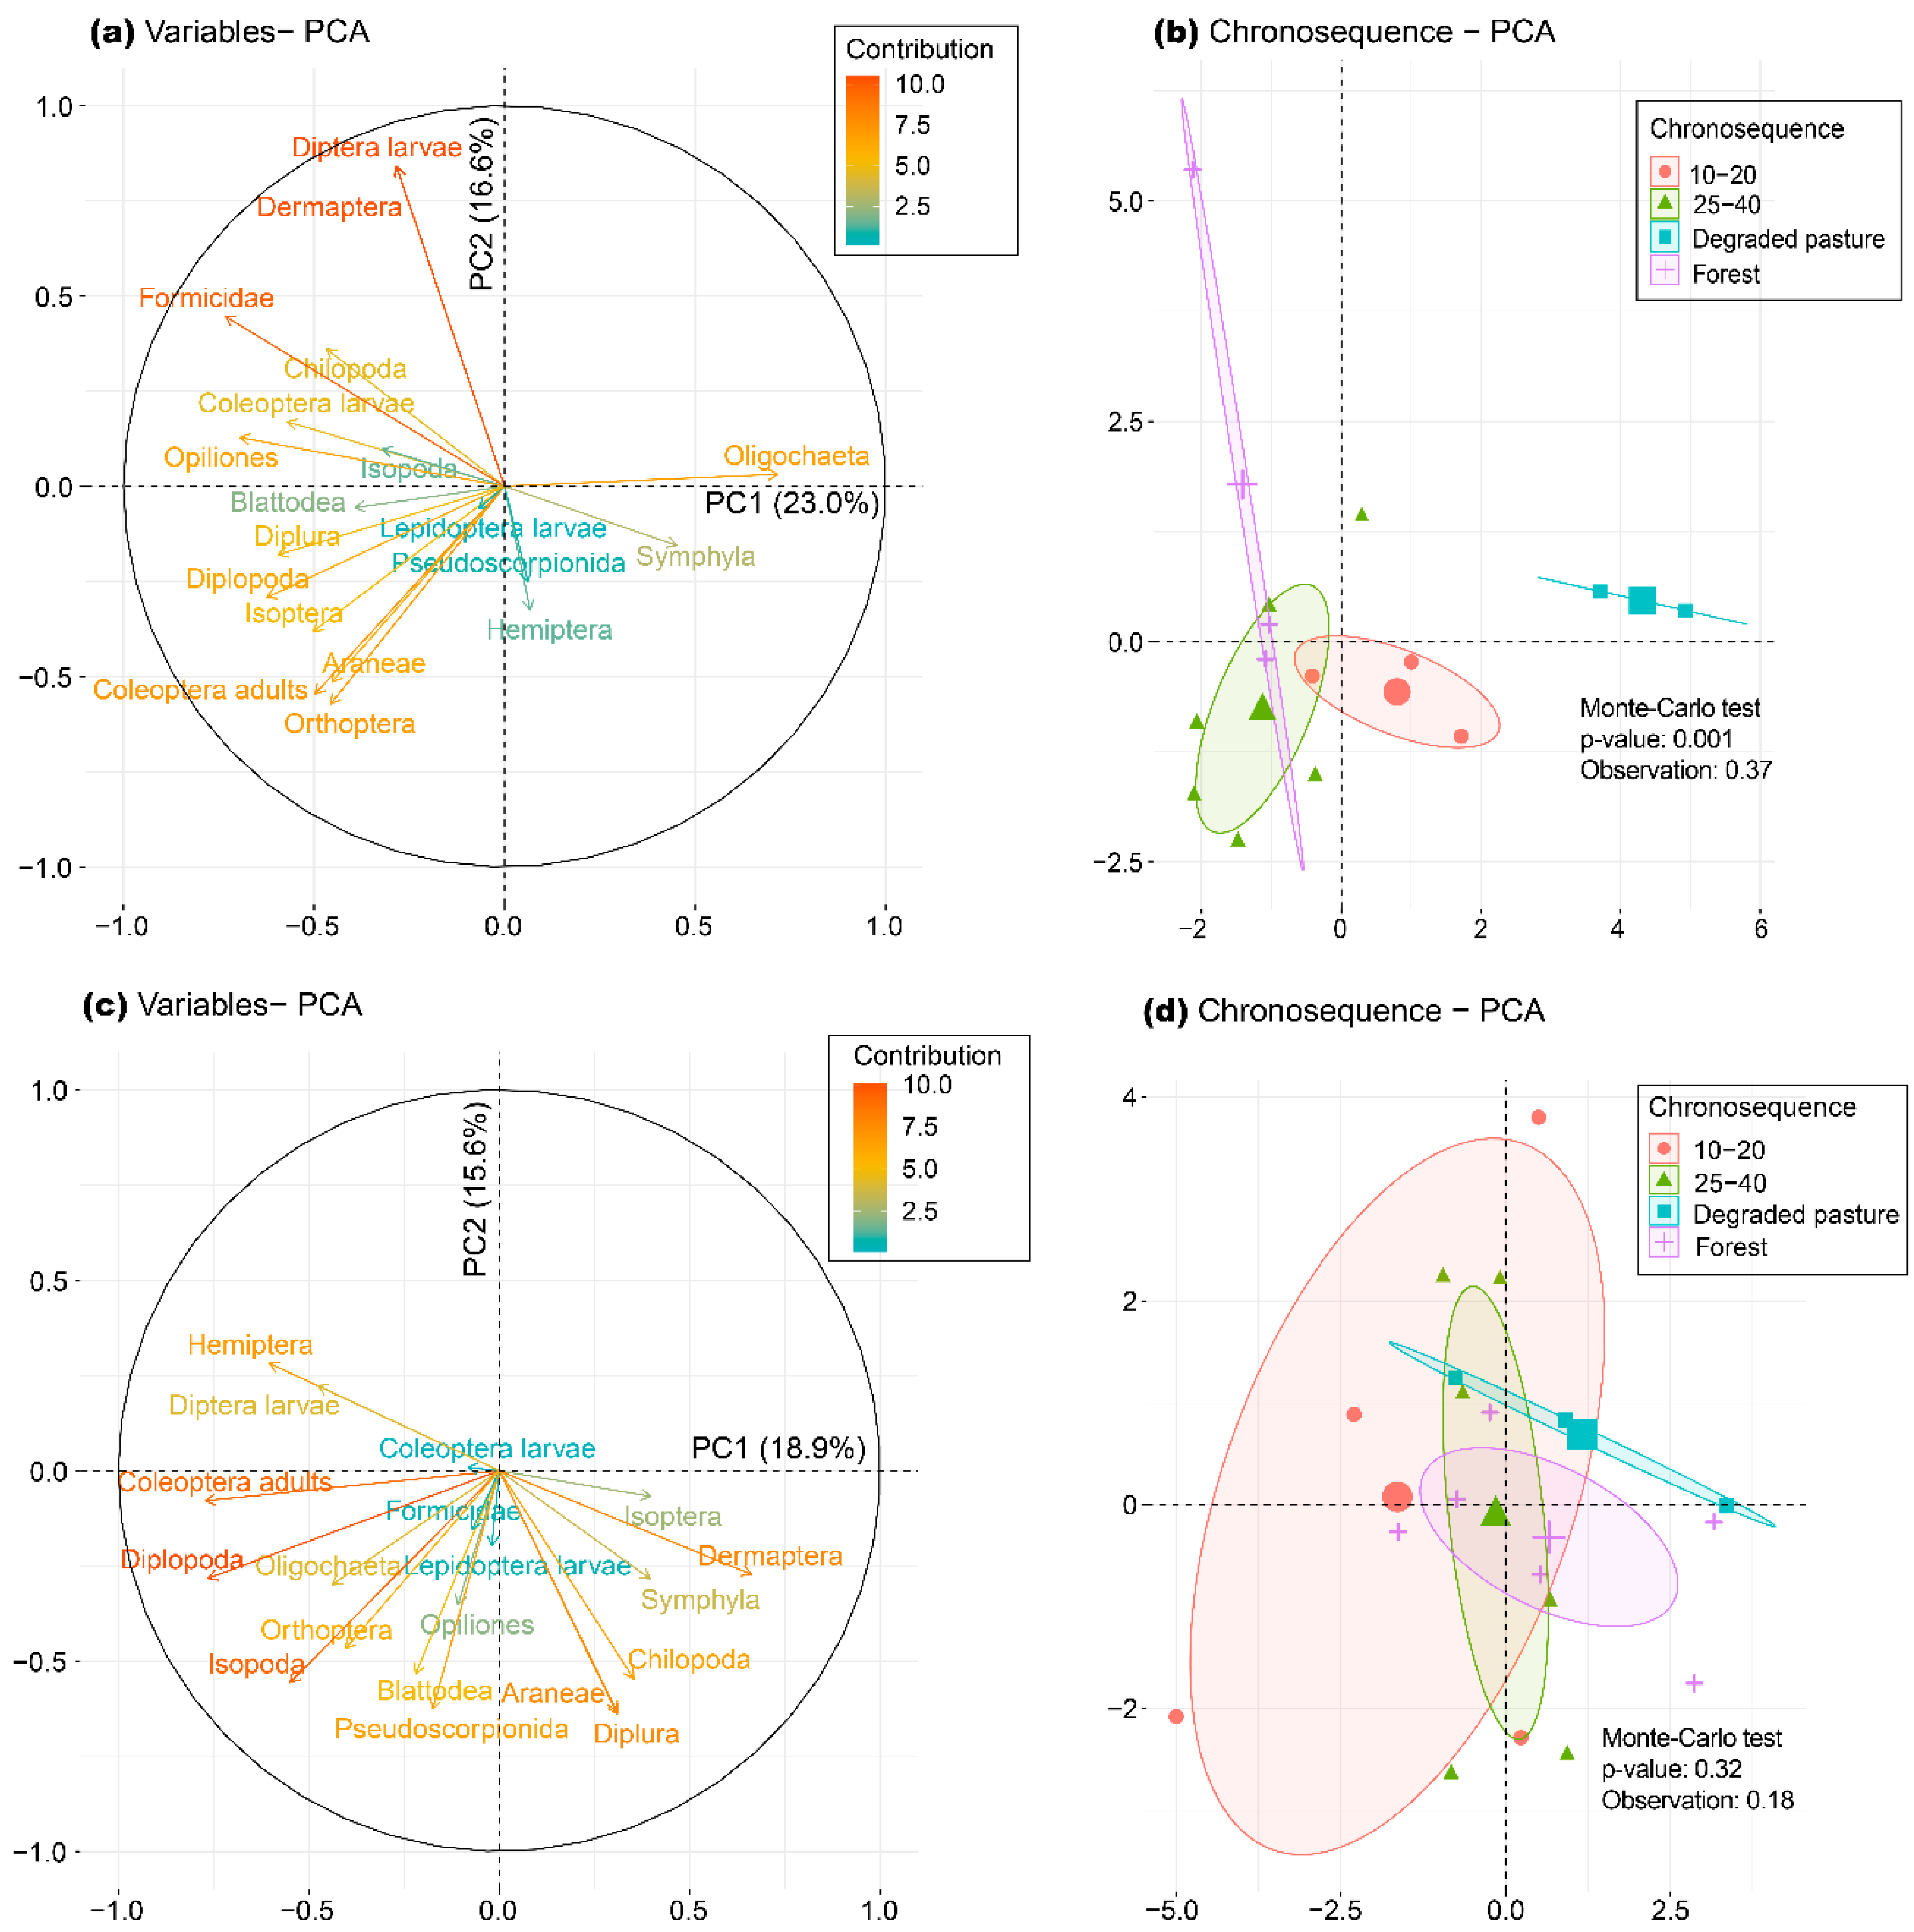
3.2. Responses of Soil Macrofauna Communities to Narural Succesion

The linear mixed effects analysis showed that the interaction between the chronosequence and landscape was not significant for any soil macrofauna (p > 0.05), with the exception of some macrofauna groups (Araneae, Coleoptera larvae, Isoptera and Pseudoscorpionidae) (Table 2). Thus, in the hills, Araneae, Coleoptera larvae and Isoptera were significantly lower in the degraded pastures, while Pseudoscorpionidae was lower in the forest. In the mountains, the highest density of Pseudoscorpionidae was evidenced in the 25–40 category, while Isoptera was significantly higher in the forest as compared to the degraded pasture (Table S2; Supplementary Materials).
Overall, a total of 19 soil macrofauna taxa were identified, with higher densities of Araneae, Coleoptera adults, Diplopoda and Isoptera in the forest, 25–40 and 10–20 than in the degraded pasture (Table 2).
The successional category affected the density and richness of soil macroinvertebrates. An increase in the number of individuals per m−2 in the 0–30 cm deep soil layer was detected, with values ranging from 2334 individual m−2 in the degraded pasture to the average value of 7202 individual m−2 in the 25–40 category and forest areas. The taxonomic richness was also lower in the degraded pasture than in the area with the most advanced stage of natural succession (25–40 category) and mature forest (Table 2).
Isoptera and Formicidae were the densest groups in the successional categories, representing 53.98 and 19.93% of the collected macrofauna, respectively. Differences in the density of taxonomic groups between the landscapes were only observed in Coleoptera-larvae, Dermaptera and Pseudoscorpionida (Table 2).
By grouping the sites according to disturbance, the Araneae, Coleoptera-adults, Coleoptera-larvae, Formicidade, Isoptera and Pseudoscorpionida groups showed significantly lower densities in the disturbed areas than in the undisturbed areas (Table 2).
A PCA analysis was performed to assess the relationship between the soil macrofauna taxonomic groups composition and the successional categories conforming the chronosequence in each landscape (Figure 3). The two first PCA axes explained 39.6% and 34.5% of the total variance of soil macrofauna species composition in the hills and mountains, respectively (Figure 3a,c). Formicidae, Dermaptera, Diptera-larvae, Oligochaeta, Coleoptera-adults, and Orthoptera were the taxonomic groups with higher contribution to the differentiation of successional stages in the hill areas. In contrast, in the mountain landscape, Diplopoda, Isopoda, Coleoptera adults, Dermaptera, Isopoda, Diplura, Araneaea, and Pseudoscorpionida contributed to the variance.
The soil macrofauna communities in the two landscapes were structured differently. The degraded pastures in the hills had a different soil macrofauna composition than the rest of successional categories (p < 0.01; 37% of explained variance) (Figure 3a,b). The successional 10–20 and 25–40 categories clustered together, showing a different composition from the mature forest. The mountains presented similar soil macrofauna composition along the chronosequence (p > 0.05; 18%) (Figure 3c,d), where the forests and middle-age succession (25–40) had the most similar soil macrofauna composition.

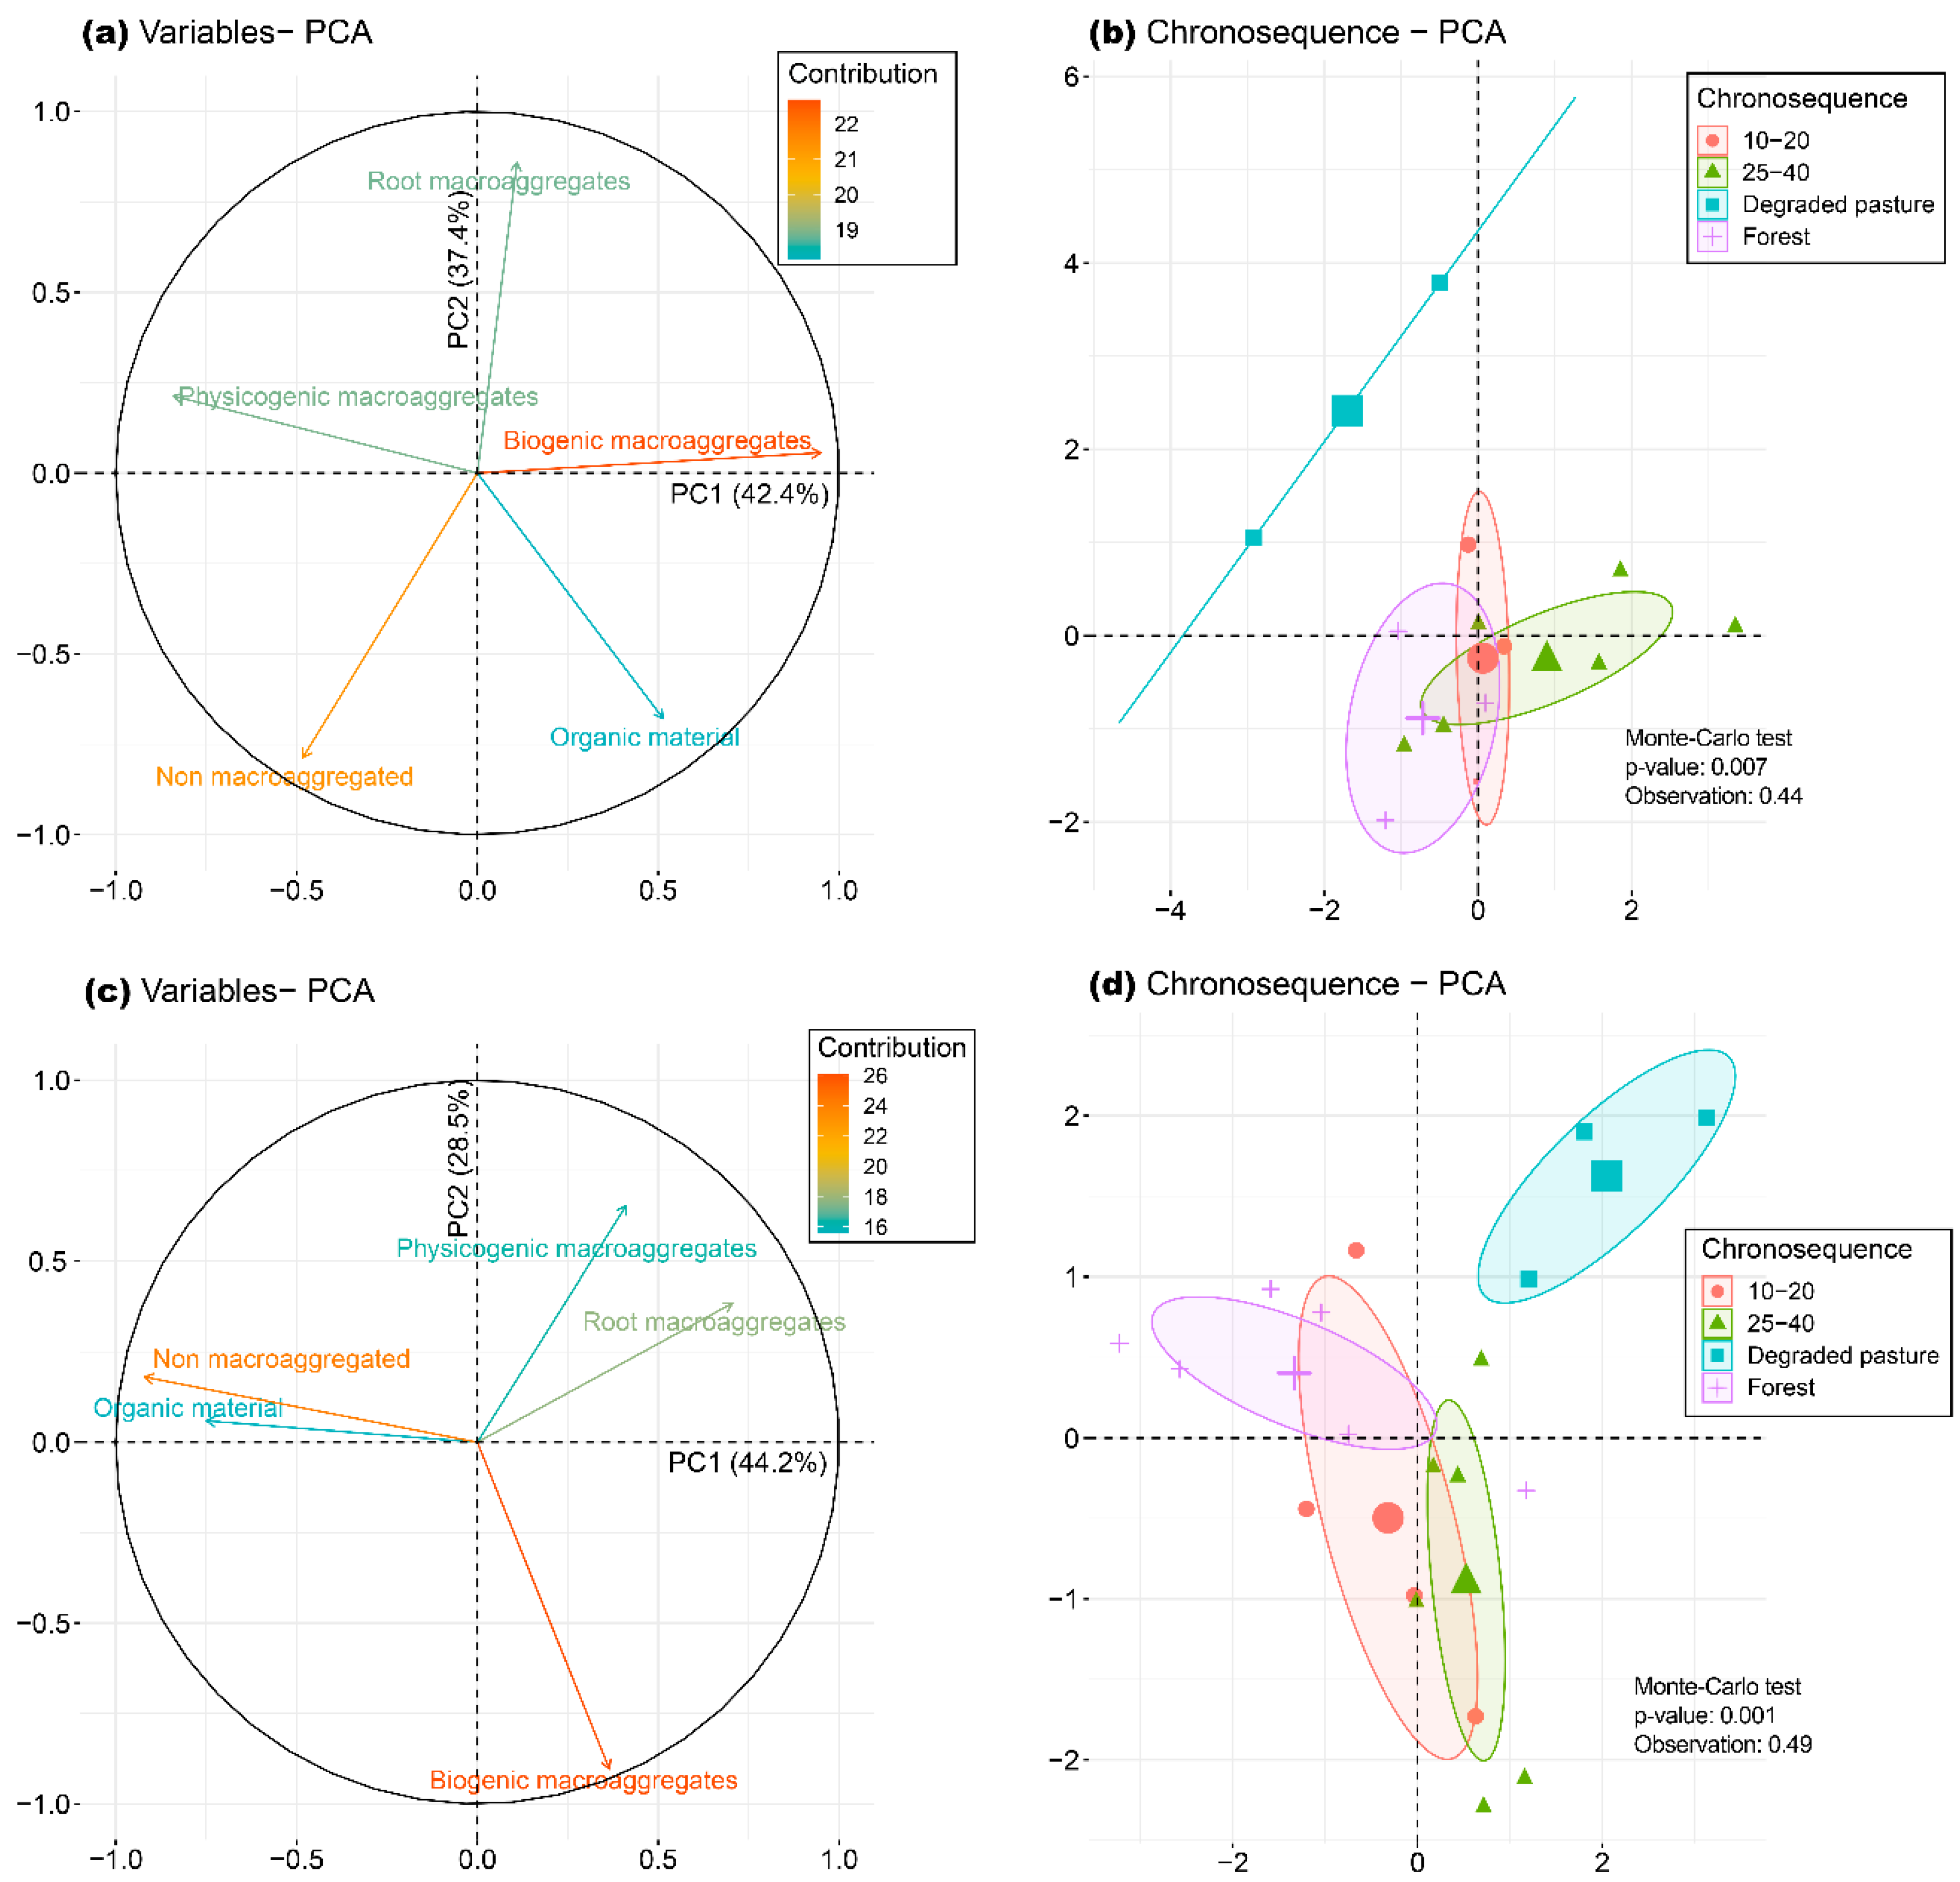
3.3. Soil Macroaggregation

Similar to the physico–chemical properties, the linear mixed effects analysis showed that the interaction between the chronosequence and landscape was not significant for any soil macroaggregation property (p > 0.05) (Table 3). The landscape and successional categories influenced the soil macroaggregation. The hills presented higher physicogenic macroaggregates and lower organic material than the mountains. Alterations in the physicogenic and root macroaggregates were observed because of the natural succession process, with higher values of these soil aggregates in the degraded pastures. In contrast, the largest proportion of biogenic macroaggregates was in the young and middle-age successional stages (25–40 and 10–20 study areas).
The non-macroaggregates and organic material were significantly lower in the disturbed areas than in the undisturbed one, while the biogenic macroaggregates were higher in the disturbed areas (Table 3).
PCA analysis of the data matrix performed by landscape type showed that the first two components of the PCA explained 79.8% of the soil aggregation variance in the hills, and 72.7% in the mountains (Figure 4a,c). Biogenic macroaggregates and non-macroaggregated explained most of the variance in both landscapes.
The successional categories clustered together according to the soil macroaggregate composition, following similar patterns in both landscapes. Clearly, the degraded pastures presented a different macroaggregate composition (p < 0.01), separated by PC1 in both landscapes (Figure 4b,d).

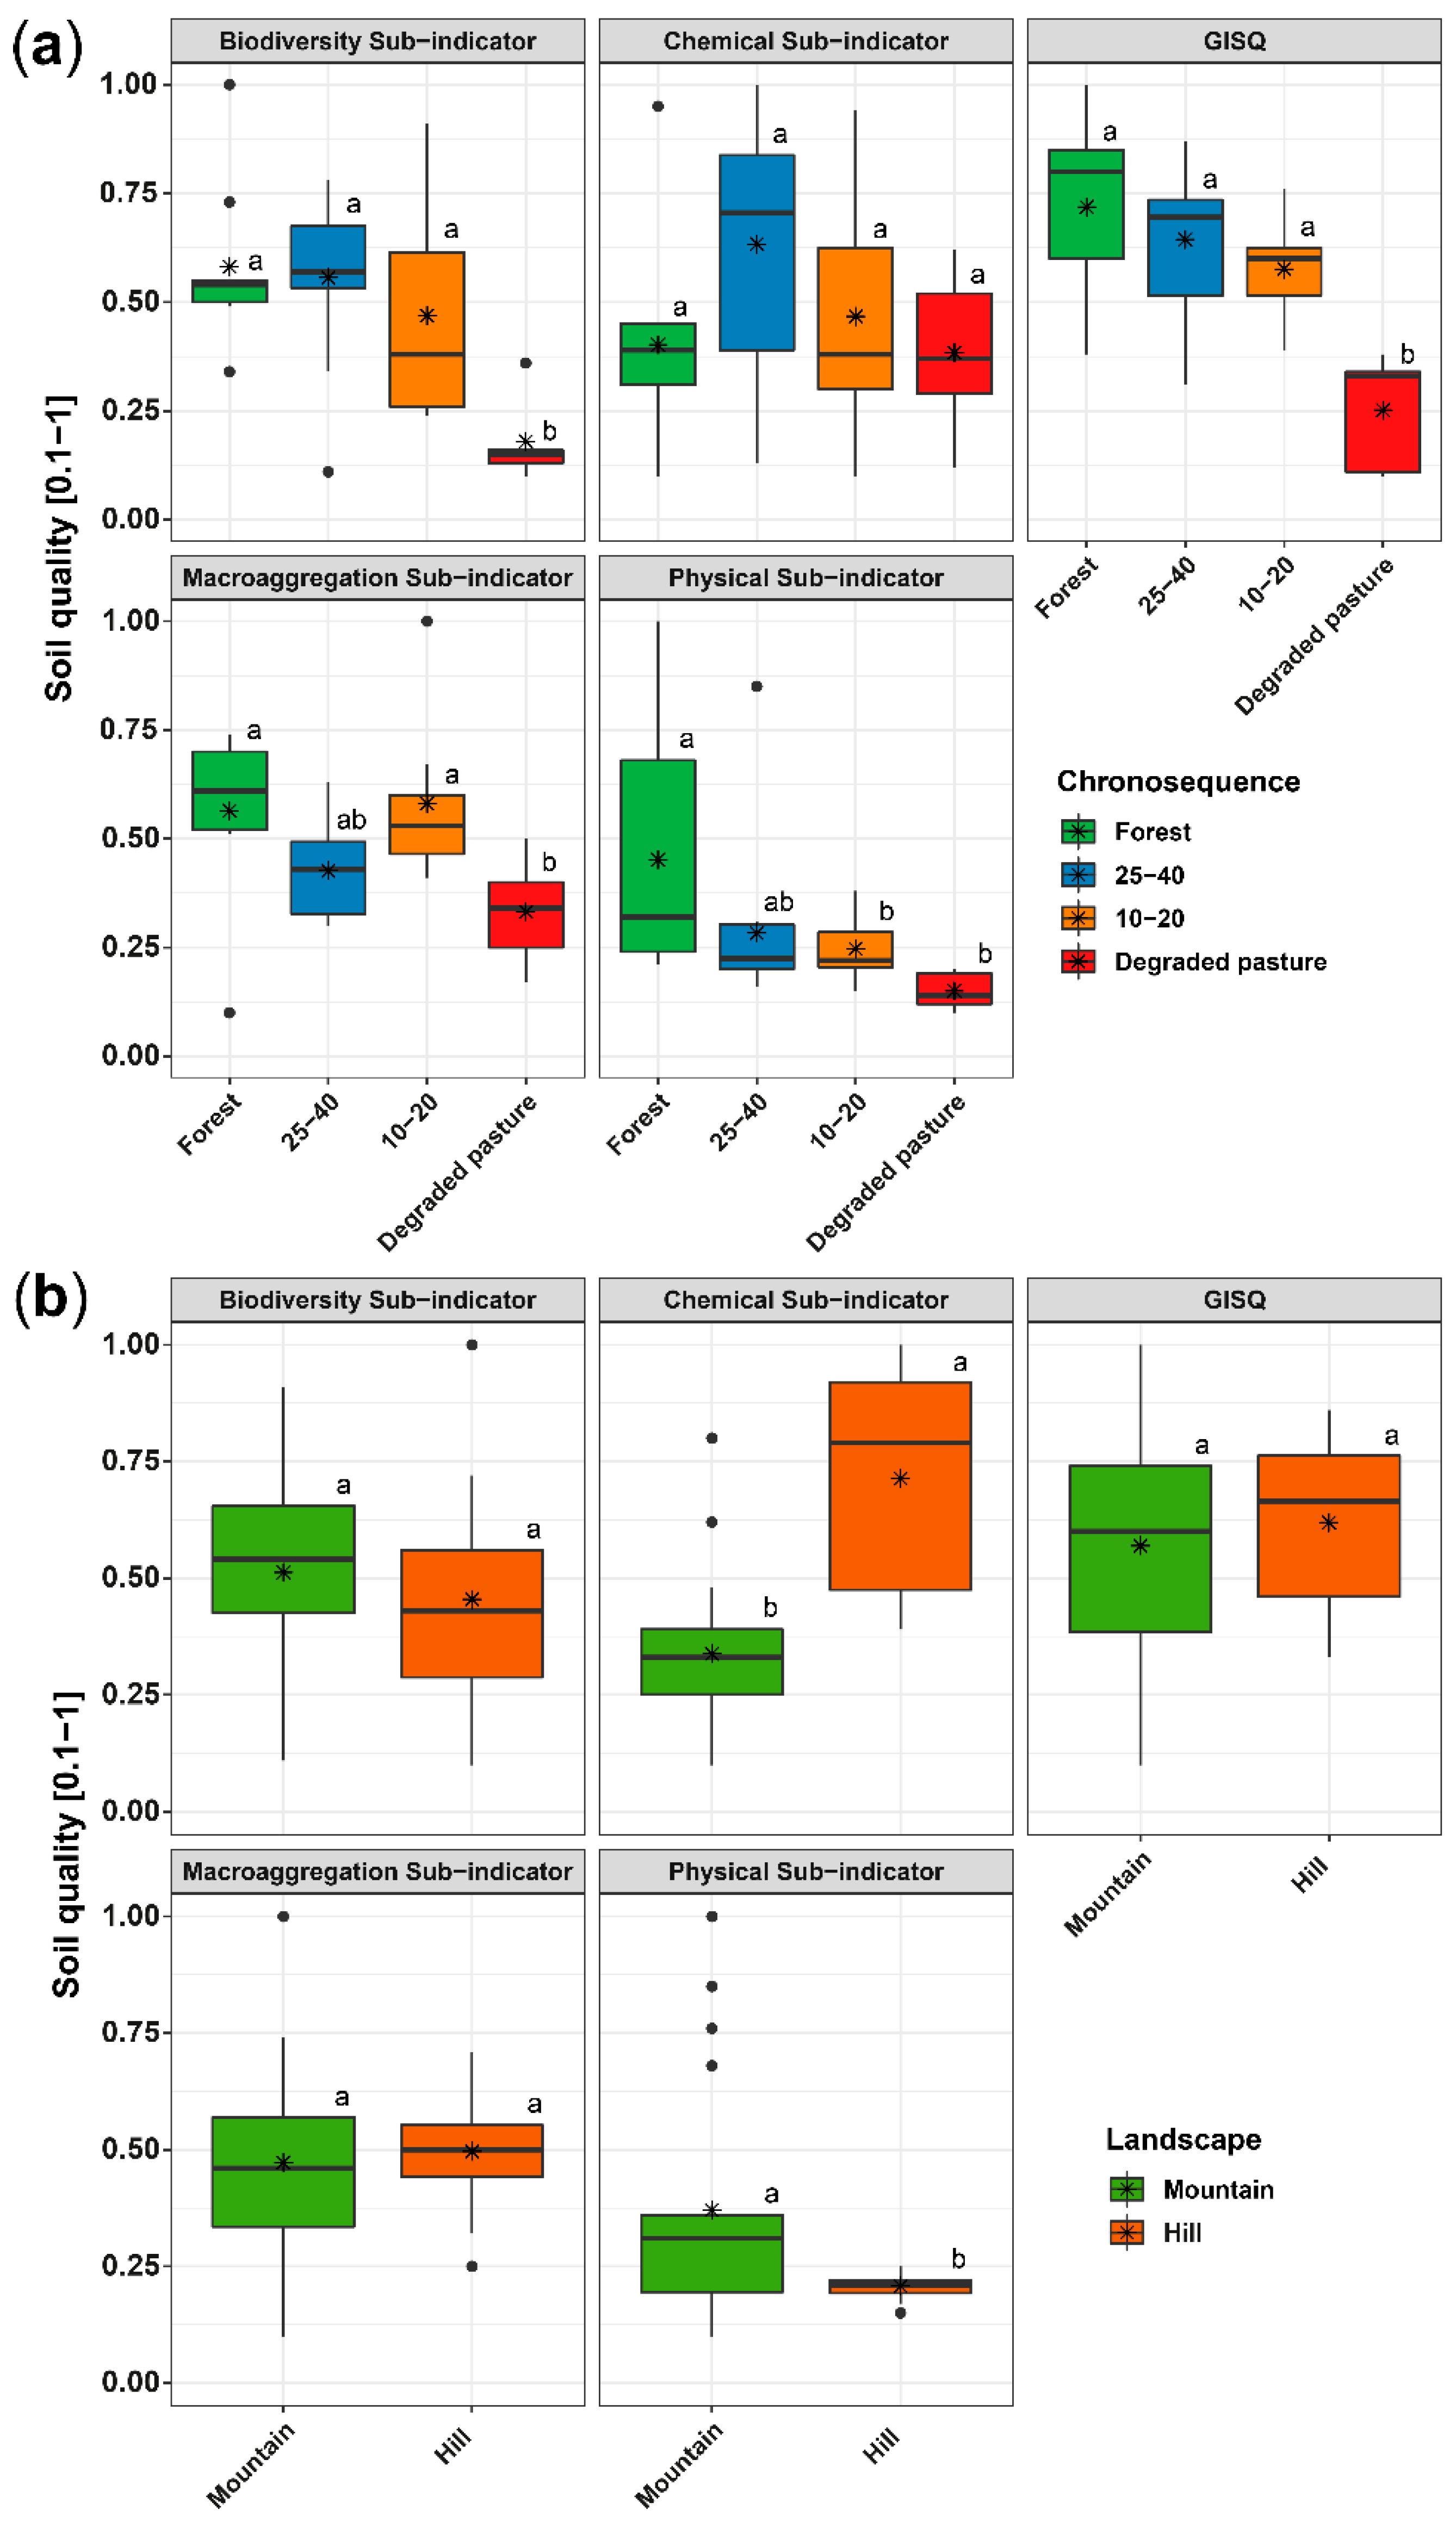
3.4. Soil Quality Indicator (GISQ)

After integrating 41 soil properties into four soil quality sub-indicators and then into a GISQ, an increasing trend of soil quality was verified when degraded pastures are abandoned, allowing the natural succession process (Figure 5). A lower GISQ was observed in the degraded pastures than in the areas with young, middle-age successional stages (10–20, 25–40 study areas) and forests.
Differences between the succession categories conforming the chronosequence were also detected in the soil quality sub-indicators physical, biodiversity (soil macrofauna species composition) and macroaggregation, which showed lower values in the degraded pastures than in the successional stages (Figure 5a). On the other hand, while a non-significant interaction between the chronosequence and landscape was observed for all soil quality sub-indicators (p > 0.05), the landscape affected the physical and chemical sub-indicators (Figure 5b).
A PCA of the soil quality sub-indicators and the GISQ ranked the study areas by landscape type and successional stage. The soil quality sub-indicators explained 75.28% of the variance in the first two axes (Figure 6a). GISQ and chemical sub-indicators were the indicators with the highest contribution to the ordination (Figure 6a). PC1 separated the degraded pasture with the lowest soil quality from the forest with the highest soil quality index (Figure 6b).
The soils in the mountain landscape showed a higher physical quality, while a higher soil chemical quality was observed in the hills (Figure 6c). PC2 represented mainly the 25–40 category with a higher soil chemical quality.

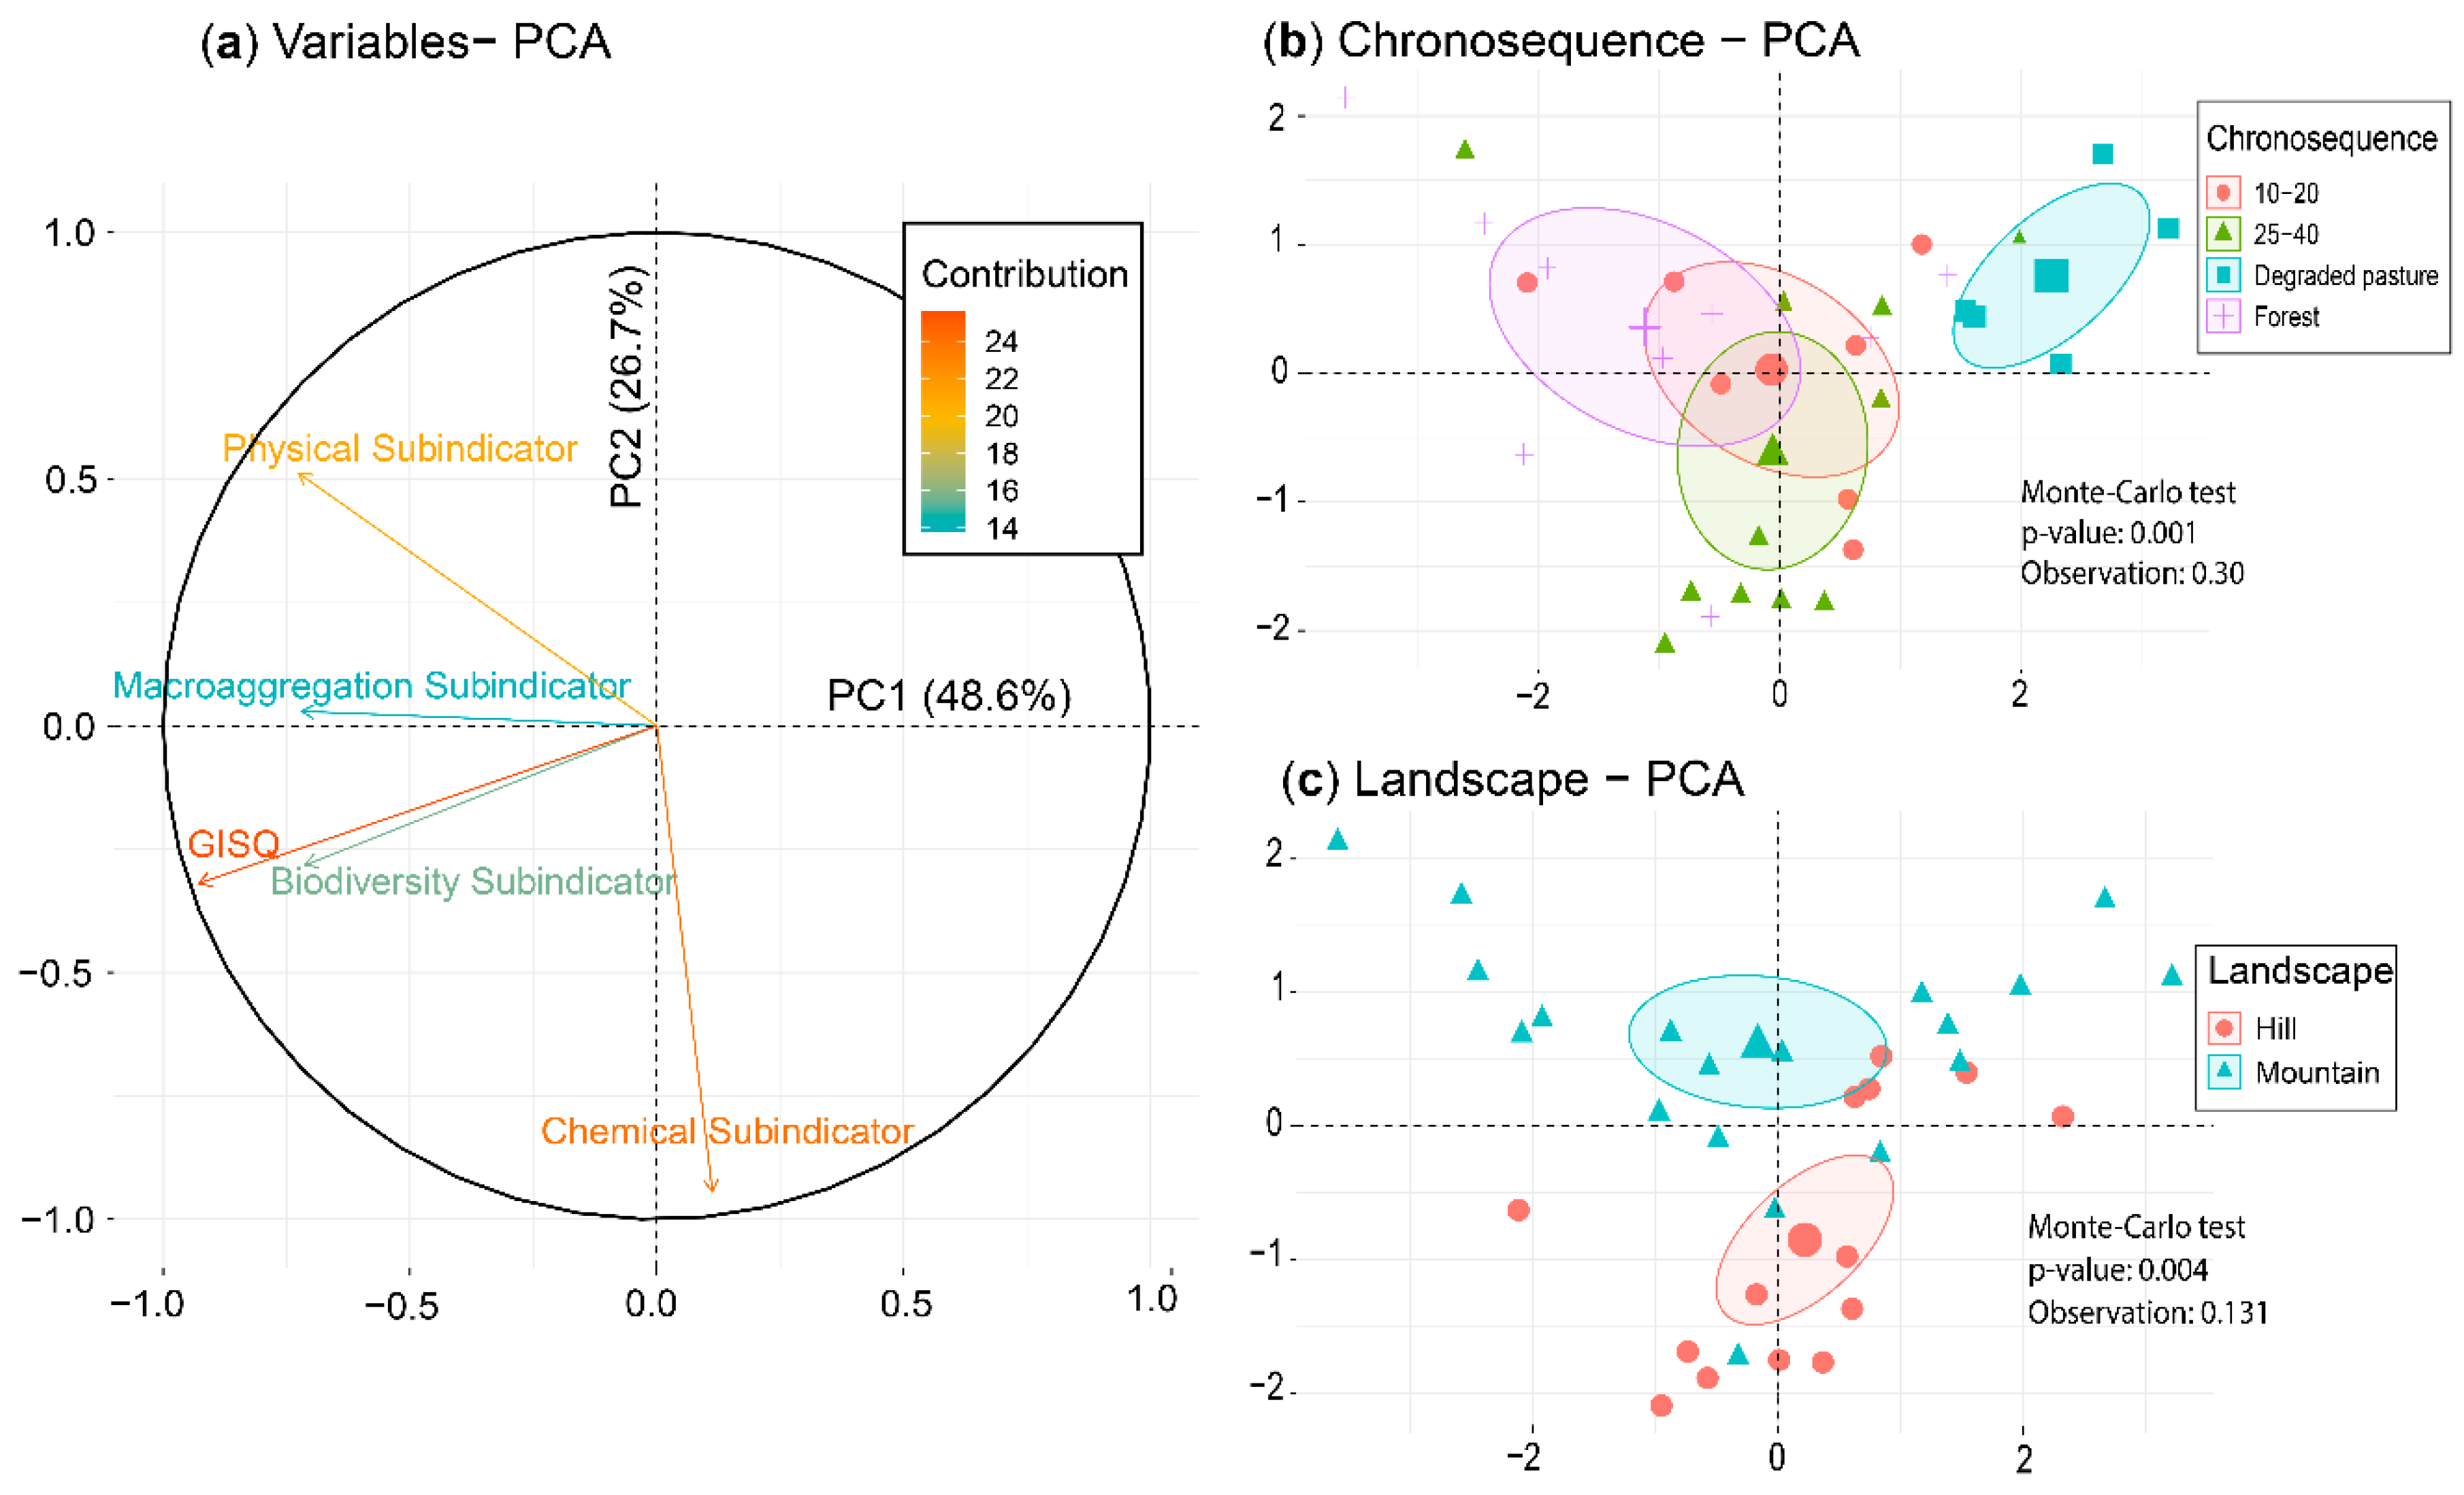
3.5. Relationship between Data Matrices

A coinertia analysis between the data set matrices showed a significant relationship (p < 0.05) between the correlation coefficients, with percentages ranging between 14% and 53% (Table 4). The covariation showed that there were more biogenic macroaggregates where the macrofauna diversity was higher. However, Oligochaeta and Symphyla were more related to physical and root macroaggregation. Chilopoda, Dermaptera and Coleoptera larvae were more significant in the forest and old-growth successional stages (Figures S1–S6; Supplementary Materials).

4. Discussion

Overall, the soil quality assessment reveled how the soil quality was improved throughout a natural succession of the degraded pastures in two different landscapes of the Colombian Amazon. The results evidenced that, although the physical and chemical composition soils varied among the landscapes, the soil quality indicator of mature forest and young/middle-age successional stages (25–40 and 10–20 study areas) was similar, with soil macroaggregation and macrofauna playing an important role in the soil quality improvement. Additionally, none of the individual variables or composed indicators could discriminate among different successional stages.
Soil is a fundamental component of ecosystems; therefore, enhancement and maintenance of soil quality is necessary to guarantee environmental sustainability and successful forest recovery [42,85]. Soil chemical properties in this study reflected the typical characteristics of Amazon soils, with high acidity and poor fertility from an intense weathering process. Alterations were observed mainly in the biological and physical indicators in response to pasture abandonment, denoting the impact of livestock production on soil quality. Long periods of grazing and cattle trampling have direct effects on soil structure by increasing soil compaction [86], thereby degrading the soil physical quality over time. Furthermore, the burning of pastures, a management practice commonly used to improve pasture soil quality [87] with short-term benefits [88], reduces the soil organic matter, soil biodiversity, nutrient content, soil moisture and aggregate stability [89,90,91,92], thus accelerating the soil degradation.
Despite the fact that the lowest soil macrofauna richness and density were observed in the degraded pasture, the soil engineers (Isoptera, Formicidae and Oligochaeta) exhibited higher densities that the other taxonomic groups. Formicidae are usually very abundant in deforested areas [38,93,94], with many species commonly reported in agricultural and urban ecosystems [95]. Earthworms are resistant towards degraded soils [31,61] and can change soil physical properties and biogeochemical processes [96]. Isoptera, although reported as very sensitive to soil disturbances [97,98,99], has some indicator species such as Apicotermitinae morphospecies that have been found in Amazon soils [100]. This study had abundant Apicotermitinae in the most degraded soils, which might indicate that, even in very degraded soils, the soil could hold part of that particular diversity, providing an important tool for restoration.
Macroaggregates are structural units that participate in the regulation of nutrient cycling and the organic matter dynamics [101], which also depend on the carbon availability and the biological activity [48,102,103], leading to improved soil quality [104]. The presence of higher physical and root macroaggregates in pastures might be the result of macroinvertebrates, together with the dense root system of pastures, that through mechanical reinforcement, promote soil aggregation, binding the soil and releasing exudates that acts as soil binding agents [105,106,107]. The presence of the large number of grasses, related to a high abundance of rhizophagous organisms [23], such as Coleoptera larvae and Symphyla was evidenced. However, contrary to the results reported by Rodríguez et al. [48], there was not a higher proportion of biogenic macroaggregates in the pastures with abundant earthworms. Particularly, in this study, degraded pastures included plots with successional stages <3-year-old with shrubby vegetation, and where the earthworm Pontoscolex corethrurus was abundant. This earthworm has been directly associated with pastures [108,109,110,111] and identified as a promotor of soil compaction [96,111,112], which could explain these results.
After some years of pasture abandonment, soil macrofauna tend to recover during the first 10 years [46,113]. Nevertheless, the recovery of edaphic macrofauna communities can continue for 50 years, with minor changes [38]. The fast natural recovery of degraded pastures is associated with a high activity of edaphic communities and a fast recovery of plant species [114]. The soil restoration process obtained naturally through succession was similar to the one reported through active restoration [48,49]. However, there were some differences in the type of soil macroaggregates associated with each successional stage In this study, the biogenic macroaggregates were more important in the successional categories with more soil engineer activity. The creation of nests and tunnels not only increases the biogenic macroaggregates proportion but also incorporates macronutrients into the soil, favoring soil fertility [115,116]. Rodriguez et al. [48] found that biogenic macroaggegates were more abundant in silvopastoral systems dominated by grasses, as well as in pastures. It seems that the natural recovery of vegetation, which includes a more diverse plant community with shrubs and pioneer trees, favor soil macrofauna activity and the formation of biogenic aggregates. Since more forested ecosystems are not preferred by P. corethrurus, the higher amount of biogenic macroaggregates in middle- and old-successional stages could be the product of other soil engineer communities, such as Isoptera [117].
Macroaggregates are a source of food for soil macrofauna and influence the density of groups. Detritivore organism densities were also shown to be greater in the soils with a high concentration of organic material (Forest and 25–40) [23,38,118], that corresponded to Isopoda, Diplura (Campodeidae), Diplopoda, Blattodea (non-Isoptera) and some Opiliones. Those organisms were also favored by a low pH [119] (Table 1). In addition, high densities of detritivore organisms increase the offer of food for predators (Araneae, Chilipoda, Diplura-Japigydae, and Dermaptera).
The coinertia analysis showed significant correlations between the macrofauna and other soil indicators (RV > 0.20), as reported in other studies in the Amazon region [48,49]. Our study confirmed that physico–chemical properties of the soil are determinant in the configuration of soil macrofaunal communities [41,49] and revealed how groups, such as Coleoptera, Blattodea and Dermaptera, can contribute positively with the restoration of the soil physical quality, soil stability and macroaggregation process. In addition, a strong positive association was evidenced between the Araneae, Diplura, Formicidae and Isoptera groups, and N and SOC indicators, and also between the Coleoptera-larvae and P content. The results showed the capacity of these organisms to improve soil chemical fertility by promoting increased nutrient availability in the soil [41,48].
As none of the individual soil physico–chemical or biological variables discriminate among the natural successional stages of the chronosequence, a synthetic multiparametric indicator was evaluated. The GISQ indicator and its sub-indicators showed a wide contrast between the pastures and successional categories, but not among successional stages. Differences in the GISQ and its sub-indicators have been reported among different land uses [33,48,49] and therefore, could differentiate contrasting successional stages (pastures vs. mature forests), but not intermediate stages. Other methodologies used other biological indicators to better discriminate between mature restoration stages [120,121]. In our study, there was a significant number of Diplura, used in methodologies, such as IBS-bf and in QBS-ar [122], as target groups. Additionally, in terms of the applied methodology, the use of narrow age-ranges along the natural succession could help to better discriminate the changes that occurred in the soil as the initial years of the natural succession is where the greatest changes occurred [123], and could be crucial for soil responses.

5. Conclusions

Different physical, chemical and biological changes occur in Amazon soils during recovery through natural succession. Soil physical and chemical changes are more influenced by the soil composition of the landscape in which the degraded pasture is located.
In the early stages, soil restoration was fast, then, changes occurred more slowly, with no differences among the soils in the successional stages and forests. Soil macroaggregates, as physical and structural variables of soil that impact in the porosity, water-holding capacity and soil fertility, were directly related to the macrofauna composition of the soils. Earthworms were more related to the degraded pastures with compacted soils and physical macroaggregates, while Isoptera and Formicidae were more related to the successional plots with more biogenic macroaggregates.
The degraded pasture presented the most negative physical, chemical and biological variables, and the lowest General Indicator Soil Quality (GISQ) and differed in all variables from the forest and subsequent successional stages. Signs of soil restoration became evident after the first 10 years of natural succession.
Regarding the impact of restoration strategies on the recovery of soil, our data indicate that there are no accurate indicators to monitor soil restoration in natural successions yet. New variables and soil quality indicators, more sensitive to soil changes will be required.

Supplementary Materials

The following are available online at https://www.mdpi.com/article/10.3390/agronomy11122484/s1, Figure S1: Coinertia analysis PC1/PC2 plane with the projection of macrofauna communities (a) and soil macroaggregates (b); Figure S2: Coinertia analysis PC1/PC2 plane with the projection of macrofauna communities (a) and soil physical properties (b); Figure S3: Coinertia analysis PC1/PC2 plane with the projection of macrofauna communities (a) and soil chemical properties (b); Figure S4: Coinertia analysis PC1/PC2 plane with the projection of soil chemical properties (a) and soil macroaggregates (b); Figure S5: Coinertia analysis PC1/PC2 plane with the projection of soil chemical properties (a) and soil physical properties (b); Figure S6: Coinertia analysis PC1/PC2 plane with the projection of soil physical properties (a) and soil macroaggregates (b). Table S1: Details of plots and soil samples collected and analyzed; Table S2: Density of soil macrofauna communities (individuals⋅m−2) in the 0–30 cm layer for the significant interaction between chronosequence and landscape.

Author Contributions

Conceptualization, C.H.R.-L. and C.P.P.-V.; methodology, C.P.P.-V. and D.C.; software, A.S.; validation, A.S. and C.P.P.-V.; formal analysis, A.S.; investigation, C.H.R.-L., C.P.P.-V., D.C., L.K.M.-V. and Y.R.V.-D.; resources, C.H.R.-L.; data curation, C.P.P.-V., D.C., L.K.M.-V., Y.R.V.-D. and A.S.; writing—original draft preparation, C.H.R.-L., C.P.P.-V. and L.K.M.-V.; writing—review and editing, C.H.R.-L., C.P.P.-V., A.S. and A.M.S.-O.; visualization, A.S. and L.K.M.-V.; supervision, C.H.R.-L., C.P.P.-V. and A.M.S.-O.; project administration, C.H.R.-L.; funding acquisition, C.H.R.-L. All authors have read and agreed to the published version of the manuscript.

Funding

This research is part of the “Restauración de Áreas Disturbadas por Implementación de Sistemas Productivos Agropecuarios en zonas de Alta Intervención en el Caquetá” project, funding by Fondo de Ciencia, Tecnología e Innovación FCTeI—SGR, Contract 60/2013 Instituto Amazónico de Investigaciones Científicas SINCHI—Gobernación del Caquetá—the Universidad de la Amazonía—the Asociación de Reforestadores y Cultivadores de Caucho del Caquetá ASOHECA—and the Federación Departamental de Ganaderos del Caquetá FEDEGANGA; and by the Government of Colombia through project BPIN 2017011000137 “Investigación en conservación y aprovechamiento sostenible de la diversidad biológica, socioeconómica y cultural de la Amazonia colombiana”.

Data Availability Statement

Data are available from the authors upon request.

Acknowledgments

We also thank all the farmers of the study area for their help and support during the fieldwork, Herminton Muñoz Ramirez for his support in graphical editing.

Conflicts of Interest

The authors declare no conflict of interest. The funders had no role in the design of the study; in the collection, analyses, or interpretation of data; in the writing of the manuscript, or in the decision to publish the results.

References

  1. Dirzo, R.; Raven, P.H. Global State of Biodiversity and Loss. Annu. Rev. Environ. Resour. 2003, 28, 137–167. [Google Scholar] [CrossRef] [Green Version]
  2. Figueiredo, F.O.G.; Zuquim, G.; Tuomisto, H.; Moulatlet, G.M.; Balslev, H.; Costa, F.R.C. Beyond climate control on species range: The importance of soil data to predict distribution of Amazonian plant species. J. Biogeogr. 2017, 45, 190–200. [Google Scholar] [CrossRef]
  3. Pan, Y.; Birdsey, R.A.; Fang, J.; Houghton, R.; Kauppi, P.E.; Kurz, W.A.; Phillips, O.L.; Shvidenko, A.; Lewis, S.L.; Canadell, J.G.; et al. A Large and Persistent Carbon Sink in the World’s Forests. Science 2011, 333, 988–993. [Google Scholar] [CrossRef] [PubMed] [Green Version]
  4. Wang, Y.; Ziv, G.; Adami, M.; de Almeida, C.A.; Antunes, J.F.G.; Coutinho, A.C.; Esquerdo, J.C.D.M.; Gomes, A.R.; Galbraith, D. Upturn in secondary forest clearing buffers primary forest loss in the Brazilian Amazon. Nat. Sustain. 2020, 3, 290–295. [Google Scholar] [CrossRef]
  5. Finer, M.; Mamani, N. Deforestación En La Amazonía 2020 (Final) MAAP #136. Canada. 2020. Available online: https://maaproject.org/2021/amazon-hotspots-2020-final/ (accessed on 22 November 2021).
  6. Murad, C.A.; Pearse, J. Landsat study of deforestation in the Amazon region of Colombia: Departments of Caquetá and Putumayo. Remote. Sens. Appl. Soc. Environ. 2018, 11, 161–171. [Google Scholar] [CrossRef]
  7. Melo, V.F.; Orrutéa, A.G.; Motta, A.C.V.; Testoni, S.A. Land Use and Changes in Soil Morphology and Physical-Chemical Properties in Southern Amazon. Rev. Bras. Cienc. Solo 2017, 41, 1–14. [Google Scholar] [CrossRef]
  8. Nóbrega, R.L.B.; Guzha, A.C.; Torres, G.N.; Kovacs, K.; Lamparter, G.; Amorim, R.S.S.; Couto, E.; Gerold, G. Correction: Effects of conversion of native cerrado vegetation to pasture on soil hydro-physical properties, evapotranspiration and streamflow on the Amazonian agricultural frontier. PLoS ONE 2020, 15, e0236236. [Google Scholar] [CrossRef]
  9. Olaya-Montes, A.; Llanos-Cabrera, M.P.; Cherubin, M.R.; Herrera-Valencia, W.; Ortiz-Morea, F.A.; Silva-Olaya, A.M. Restoring soil carbon and chemical properties through silvopastoral adoption in the Colombian Amazon region. Land Degrad. Dev. 2021, 32, 3720–3730. [Google Scholar] [CrossRef]
  10. Polanía-Hincapié, K.L.; Olaya-Montes, A.; Cherubin, M.R.; Herrera-Valencia, W.; Ortiz-Morea, F.A.; Silva-Olaya, A.M. Soil physical quality responses to silvopastoral implementation in Colombian Amazon. Geoderma 2021, 386, 114900. [Google Scholar] [CrossRef]
  11. Davidson, E.A.; de Araüjo, A.C.; Artaxo, P.; Balch, J.K.; Brown, I.F.; Mercedes, M.M.; Coe, M.T.; Defries, R.S.; Keller, M.; Longo, M.; et al. The Amazon basin in transition. Nature 2012, 481, 321–328, Erratum in Nature 2012, 483, 232. [Google Scholar] [CrossRef]
  12. Mesquita, R.D.; Massoca, P.E.; Jakovac, C.C.; Bentos, T.V.; Williamson, G.B. Amazon Rain Forest Succession: Stochasticity or Land-Use Legacy? BioScience 2015, 65, 849–861. [Google Scholar] [CrossRef]
  13. Jakovac, C.C.; Peña-Claros, M.; Kuyper, T.W.; Bongers, F. Loss of secondary-forest resilience by land-use intensification in the Amazon. J. Ecol. 2015, 103, 67–77. [Google Scholar] [CrossRef]
  14. Höfer, H.; Hanagarth, W.; Garcia, M.; Martius, C.; Franklin, E.; Römbke, J.; Beck, L. Structure and function of soil fauna communities in Amazonian anthropogenic and natural ecosystems. Eur. J. Soil Biol. 2001, 37, 229–235. [Google Scholar] [CrossRef] [Green Version]
  15. Van Hall, R.L.; Cammeraat, L.H.; Keesstra, S.D.; Zorn, M. Impact of secondary vegetation succession on soil quality in a humid Mediterranean landscape. Catena 2017, 149, 836–843. [Google Scholar] [CrossRef]
  16. Nadal-Romero, E.; Cammeraat, E.; Pérez-Cardiel, E.; Lasanta, T. Effects of secondary succession and afforestation practices on soil properties after cropland abandonment in humid Mediterranean mountain areas. Agric. Ecosyst. Environ. 2016, 228, 91–100. [Google Scholar] [CrossRef] [Green Version]
  17. Teixeira, H.M.; Cardoso, I.M.; Bianchi, F.J.J.A.; da Cruz Silva, A.; Jamme, D.; Peña-Claros, M. Linking vegetation and soil functions during secondary forest succession in the Atlantic forest. For. Ecol. Manag. 2019, 457, 117696. [Google Scholar] [CrossRef]
  18. Robinson, S.J.B.; van den Berg, E.; Meirelles, G.S.; Ostle, N. Factors influencing early secondary succession and ecosystem carbon stocks in Brazilian Atlantic Forest. Biodivers. Conserv. 2015, 24, 2273–2291. [Google Scholar] [CrossRef]
  19. Deng, L.; Shangguan, Z.P.; Sweeney, S. “Grain for Green” driven land use change and carbon sequestration on the Loess Plateau, China. Sci. Rep. 2014, 4, 7039. [Google Scholar] [CrossRef]
  20. Lesschen, J.P.; Cammeraat, L.H.; Kooijman, A.M.; van Wesemael, B. Development of spatial heterogeneity in vegetation and soil properties after land abandonment in a semi-arid ecosystem. J. Arid. Environ. 2008, 72, 2082–2092. [Google Scholar] [CrossRef]
  21. Guerra, C.A.; Heintz-Buschart, A.; Sikorski, J.; Chatzinotas, A.; Guerrero-Ramírez, N.; Cesarz, S.; Beaumelle, L.; Rillig, M.C.; Maestre, F.T.; Delgado-Baquerizo, M.; et al. Blind spots in global soil biodiversity and ecosystem function research. Nat. Commun. 2020, 11, 3870. [Google Scholar] [CrossRef]
  22. Fengler, F.H.; Bressane, A.; Carvalho, M.M.; Longo, R.M.; De Medeiros, G.A.; De Melo, W.J.; Jakovac, C.C.; Ribeiro, A.I. Forest restoration assessment in Brazilian Amazonia: A new clustering-based methodology considering the reference ecosystem. Ecol. Eng. 2017, 108, 93–99. [Google Scholar] [CrossRef] [Green Version]
  23. Uhl, C.; Buschbacher, R.; Serrao, E.A.S. Abandoned Pastures in Eastern Amazonia. I. Patterns of Plant Succession. J. Ecol. 1988, 76, 663. [Google Scholar] [CrossRef]
  24. Nortcliff, S. Standardisation of soil quality attributes. Agric. Ecosyst. Environ. 2002, 88, 161–168. [Google Scholar] [CrossRef]
  25. Jakovac, C.C.; Junqueira, A.B.; Crouzeilles, R.; Peña-Claros, M.; Mesquita, R.C.G.; Bongers, F. The role of land-use history in driving successional pathways and its implications for the restoration of tropical forests. Biol. Rev. 2021, 96, 1114–1134. [Google Scholar] [CrossRef] [PubMed]
  26. Onet, A.; Dincă, L.C.; Grenni, P.; Laslo, V.; Teusdea, A.C.; Vasile, D.L.; Enescu, R.E.; Crisan, V.E. Biological indicators for evaluating soil quality improvement in a soil degraded by erosion processes. J. Soils Sediments 2019, 19, 2393–2404. [Google Scholar] [CrossRef]
  27. Al-Maliki, S.; Al-Taey, D.K.; Al-Mammori, H.Z. Earthworms and eco-consequences: Considerations to soil biological indicators and plant function: A review. Acta Ecol. Sin. 2021, 41, 512–523. [Google Scholar] [CrossRef]
  28. Viana, R.M.; Ferraz, J.B.S.; Neves, A.F.; Vieira, G.; Pereira, B.F. Soil quality indicators for different restoration stages on Amazon rainforest. Soil Tillage Res. 2014, 140, 1–7. [Google Scholar] [CrossRef]
  29. Brussaard, L. Soil fauna, guilds, functional groups and ecosystem processes. Appl. Soil Ecol. 1998, 9, 123–135. [Google Scholar] [CrossRef]
  30. Lavelle, P.; Blanchart, E.; Martin, A.; Martin, S. Impact of Soil Fauna on the Properties of Soils in the Humid Tropics. In Myths and Science of Soils of the Tropics; Lal, R., Sanchez, P., Eds.; Soil Science Society of America and American Society of Agronomy: Madison, WI, USA, 1992; pp. 157–185. [Google Scholar]
  31. Lavelle, P. Faunal Activities and Soil Processes: Adaptative Strategy That Determine Ecosystem Function. Adv. Ecol. Res. 1997, 24, 93–132. [Google Scholar] [CrossRef] [Green Version]
  32. Bahram, M.; Hildebrand, F.; Forslund, S.K.; Anderson, J.L.; Soudzilovskaia, N.A.; van Bodegom, P.; Bengtsson-Palme, J.; Anslan, S.; Coelho, L.P.; Harend, H.; et al. Structure and function of the global topsoil microbiome. Nat. Cell Biol. 2018, 560, 233–237. [Google Scholar] [CrossRef]
  33. Velasquez, E.; Lavelle, P. Soil macrofauna as an indicator for evaluating soil based ecosystem services in agricultural landscapes. Acta Oecol. 2019, 100, 103446. [Google Scholar] [CrossRef]
  34. FAO; ITPS; GSBI; CBD; EC. State of Knowledge of Soil Biodiversity—Status, Challenges and Potentialities; Food and Agriculture Organization of the United Nations: Rome, Italy, 2020; ISBN 9789251335826. [Google Scholar]
  35. Cole, R.J.; Holl, K.D.; Zahawi, R.A.; Wickey, P.; Townsend, A.R. Leaf litter arthropod responses to tropical forest restoration. Ecol. Evol. 2016, 6, 5158–5168. [Google Scholar] [CrossRef] [PubMed] [Green Version]
  36. Vieira, D.L.M.; Rodrigues, S.B.; Jakovac, C.C.; da Rocha, G.P.E.; Reis, F.; Borges, A. Active Restoration Initiates High Quality Forest Succession in a Deforested Landscape in Amazonia. Forests 2021, 12, 1022. [Google Scholar] [CrossRef]
  37. Decaëns, T.; Jiménez, J.J.; Barros, E.; Chauvel, A.; Blanchart, E.; Fragoso, C.; Lavelle, P. Soil macrofaunal communities in permanent pastures derived from tropical forest or savanna. Agric. Ecosyst. Environ. 2004, 103, 301–312. [Google Scholar] [CrossRef]
  38. Serra, R.T.; Santos, C.D.; Rousseau, G.X.; Triana, S.P.; Muñoz Gutiérrez, J.A.; Burgos Guerrero, J.E. Fast recovery of soil macrofauna in regenerating forests of the Amazon. J. Anim. Ecol. 2021, 90, 2094–2108. [Google Scholar] [CrossRef]
  39. Sofo, A.; Mininni, A.N.; Ricciuti, P. Soil Macrofauna: A Key Factor for Increasing Soil Fertility and Promoting Sustainable Soil Use in Fruit Orchard Agrosystems. Agronomy 2020, 10, 456. [Google Scholar] [CrossRef] [Green Version]
  40. Brussaard, L.; Behan-Pelletier, V.M.; Bignell, D.E.; Brown, V.K.; Didden, W.; Folgarait, P.; Fragoso, C.; Freckman, D.W.; Gupta, V.V.S.R.; Hattori’S, T.; et al. Biodiversity and Ecosystem Functioning in Soil. Ambio 1997, 26, 563–570. [Google Scholar] [CrossRef]
  41. Marichal, R.; Grimaldi, M.; Feijoo, M.A.; Oszwald, J.; Praxedes, C.; Ruiz Cobo, D.H.; del Pilar Hurtado, M.; Desjardins, T.; da Silva Junior, M.L.; da Silva Costa, L.G.; et al. Soil macroinvertebrate communities and ecosystem services in deforested landscapes of Amazonia. Appl. Soil Ecol. 2014, 83, 177–185. [Google Scholar] [CrossRef]
  42. Bünemann, E.K.; Bongiorno, G.; Bai, Z.; Creamer, R.E.; De Deyn, G.; de Goede, R.; Fleskens, L.; Geissen, V.; Kuyper, T.W.; Mäder, P.; et al. Soil quality—A critical review. Soil Biol. Biochem. 2018, 120, 105–125. [Google Scholar] [CrossRef]
  43. Grimaldi, M.; Oszwald, J.; Dolédec, S.; Hurtado, M.D.P.; Miranda, I.D.S.; De Sartre, X.A.; De Assis, W.S.; Castañeda, E.; Desjardins, T.; Dubs, F.; et al. Ecosystem services of regulation and support in Amazonian pioneer fronts: Searching for landscape drivers. Landsc. Ecol. 2014, 29, 311–328. [Google Scholar] [CrossRef]
  44. Bush, M.B.; Nascimento, M.N.; Åkesson, C.M.; Cárdenes-Sandí, G.M.; Maezumi, S.Y.; Behling, H.; Correa-Metrio, A.; Church, W.; Huisman, S.N.; Kelly, T.; et al. Widespread reforestation before European influence on Amazonia. Science 2021, 372, 484–487. [Google Scholar] [CrossRef] [PubMed]
  45. Suárez, L.R.; Josa, Y.T.P.; Samboni, E.J.A.; Cifuentes, K.D.L.; Bautista, E.H.D.; Salazar, J.C.S. Soil macrofauna under different land uses in the Colombian Amazon. Pesqui. Agropecuária Bras. 2018, 53, 1383–1391. [Google Scholar] [CrossRef]
  46. Amazonas, N.T.; Viani, R.A.G.; Rego, M.G.A.; Camargo, F.F.; Fujihara, R.T.; Valsechi, O.A. Soil macrofauna density and diversity across a chronosequence of tropical forest restoration in Southeastern Brazil. Braz. J. Biol. 2017, 78, 449–456. [Google Scholar] [CrossRef] [Green Version]
  47. Franco, A.L.C.; Sobral, B.W.; Silva, A.L.C.; Wall, D.H. Amazonian deforestation and soil biodiversity. Conserv. Biol. 2018, 33, 590–600. [Google Scholar] [CrossRef]
  48. Rodríguez, L.; Suárez, J.C.; Rodriguez, W.; Artunduaga, K.J.; Lavelle, P. Agroforestry systems impact soil macroaggregation and enhance carbon storage in Colombian deforested Amazonia. Geoderma 2020, 384, 114810. [Google Scholar] [CrossRef]
  49. Rodríguez, L.; Suárez Salazar, J.C.; Casanoves, F.; Ngo Bieng, M.A. Cacao Agroforestry Systems Improve Soil Fertility: Comparison of Soil Properties between Forest, Cacao Agroforestry Systems, and Pasture in the Colombian Amazon. Agric. Ecosyst. Environ. 2021, 314, 107349. [Google Scholar] [CrossRef]
  50. Pedrinho, A.; Mendes, L.W.; Merloti, L.F.; de Cassia Da Fonseca, M.; de Souza Cannavan, F.; Tsai, S.M. Forest-to-pasture conversion and recovery based on assessment of microbial communities in Eastern Amazon rainforest. FEMS Microbiol. Ecol. 2019, 95, fiy236. [Google Scholar] [CrossRef] [PubMed] [Green Version]
  51. Silva, M.D.; Barajas-Aceves, M.; Araújo, A.S.; Ara´ujo, F.F.; Melo, W.J. Soil Microbial Biomass After Three-Year Consecutive Composted Tannery Sludge Amendment. Pedosphere 2014, 24, 469–475. [Google Scholar] [CrossRef]
  52. Rousseau, G.X.; dos Santos Silva, P.R.; Celentano, D.; de Carvalho, C.J.R. Macrofauna do solo em uma cronosequência de capoeiras, florestas e pastos no Centro de Endemismo Belém, Amazônia Oriental. Acta Amaz. 2014, 44, 499–512. [Google Scholar] [CrossRef] [Green Version]
  53. Huera-Lucero, T.; Labrador-Moreno, J.; Blanco-Salas, J.; Ruiz-Téllez, T. A Framework to Incorporate Biological Soil Quality Indicators into Assessing the Sustainability of Territories in the Ecuadorian Amazon. Sustainability 2020, 12, 3007. [Google Scholar] [CrossRef] [Green Version]
  54. Lehmann, J.; Bossio, D.A.; Kögel-Knabner, I.; Rillig, M.C. The concept and future prospects of soil health. Nat. Rev. Earth Environ. 2020, 1, 544–553. [Google Scholar] [CrossRef] [PubMed]
  55. Rinot, O.; Levy, G.J.; Steinberger, Y.; Svoray, T.; Eshel, G. Soil health assessment: A critical review of current methodologies and a proposed new approach. Sci. Total. Environ. 2019, 648, 1484–1491. [Google Scholar] [CrossRef] [PubMed]
  56. Andrews, S.S.; Karlen, D.L.; Cambardella, C.A. The Soil Management Assessment Framework. Soil Sci. Soc. Am. J. 2004, 68, 1945–1962. [Google Scholar] [CrossRef]
  57. Thoumazeau, A.; Bustany, C.; Rodrigues, J.; Bessou, C. Using the LANCA® Model to Account for Soil Quality Within LCA: First Application and Approach Comparison in Two Contrasted Tropical Case Studies. Indones. J. Life Cycle Assess. Sustain. 2019, 3, 1. [Google Scholar] [CrossRef]
  58. Cherubin, M.R.; Karlen, D.L.; Cerri, C.E.P.; Franco, A.L.C.; Tormena, C.A.; Davies, C.A.; Cerri, C.C. Soil Quality Indexing Strategies for Evaluating Sugarcane Expansion in Brazil. PLoS ONE 2016, 11, e0150860. [Google Scholar] [CrossRef] [PubMed]
  59. Purakayastha, T.J.; Pathak, H.; Kumari, S.; Biswas, S.; Chakrabarty, B.; Padaria, R.N.; Kamble, K.; Pandey, M.; Sasmal, S.; Singh, A. Soil health card development for efficient soil management in Haryana, India. Soil Tillage Res. 2019, 191, 294–305. [Google Scholar] [CrossRef]
  60. Velasquez, E.; Lavelle, P.; Andrade, M. GISQ, a multifunctional indicator of soil quality. Soil Biol. Biochem. 2007, 39, 3066–3080. [Google Scholar] [CrossRef]
  61. Velásquez, E.; Fonte, S.J.; Barot, S.; Grimaldi, M.; Desjardins, T.; Lavelle, P. Soil macrofauna-mediated impacts of plant species composition on soil functioning in Amazonian pastures. Appl. Soil Ecol. 2012, 56, 43–50. [Google Scholar] [CrossRef]
  62. Cherubin, M.R.; Chavarro-Bermeo, J.P.; Silva-Olaya, A.M. Agroforestry Systems Improve Soil Physical Quality in Northwestern Colombian Amazon. Agrofor. Syst. 2019, 93, 1741–1753. [Google Scholar] [CrossRef]
  63. Duran-Bautista, E.H.; Muñoz, Y.; Galindo, J.D.; Ortiz, T.; Bermúdez, M. Soil Physical Quality and Relationship to Changes in Termite Community in Northwestern Colombian Amazon. Front. Ecol. Evol. 2020, 8, 419. [Google Scholar] [CrossRef]
  64. IGAC. Estudio General de Suelos y Zonificación de Tierras Departamento de Caquetá; IGAC: Boulder, CO, USA, 2014; ISBN 978958832373-2. [Google Scholar]
  65. Instituto Geográfico Agustin Codazzi (IGAC). Caquetá, Características Geográficas; Imprenta nacional de Colombia: Bogotá, Colombia, 2010. [Google Scholar]
  66. Norden, N.; Angarita, H.A.; Bongers, F.; Martínez-Ramos, M.; La Cerda, I.G.D.; Van Breugel, M.; Lebrija-Trejos, E.; Meave, J.A.; Vandermeer, J.; Williamson, G.B.; et al. Successional dynamics in Neotropical forests are as uncertain as they are predictable. Proc. Natl. Acad. Sci. USA 2015, 112, 8013–8018. [Google Scholar] [CrossRef] [Green Version]
  67. Blanco, J.C.; Rojas, A.C.; Rodrìguez, C.H.; Malagon, R. Relación Entre Índices de Vegetación y Estados de Degradación de Pasturas En Zonas de Lomerío Del Departamento de Caquetá. Momentos Cienc. 2014, 11, 35–41. [Google Scholar]
  68. Lavelle, P.; Rodríguez, N.; Arguello, O.; Bernal, J.; Botero, C.; Chaparro, P.; Gómez, Y.; Gutiérrez, A.; del Pilar Hurtado, M.; Loaiza, S.; et al. Soil ecosystem services and land use in the rapidly changing Orinoco River Basin of Colombia. Agric. Ecosyst. Environ. 2014, 185, 106–117. [Google Scholar] [CrossRef]
  69. ISO, I.O. for S. ISO 23611-5 Soil Quality: Sampling of Soil Invertebrates. Part 5: Sampling and Extraction of Soil Macro-Invertebrates; ISO: Geneva, Switzerland, 2011; p. 12. [Google Scholar]
  70. Anderson, J.M.; Ingram, J. Tropical Soil Biology and Fertility: A Handbook of Methods, 2nd ed.; CAB International: Wallingford, UK, 1993. [Google Scholar]
  71. Ruiz, N.; Lavelle, P.; Jiménez, J. Soil Macrofauna Field Manual; FAO: Rome, Italy, 2008. [Google Scholar]
  72. Sarkar, D.; Haldar, A. Physical and Chemical Methods in Soil Analysis; New Age International Pvt Ltd. Publishers: New Dehli, India, 2005. [Google Scholar]
  73. Blake, G.R.; Hartge, K.H. Bulk Density. Methods of Soil Analysis: Part 1—Physical and Mineralogical Methods; Encyclopedia of Earth Sciences Series; Klute, A., Ed.; American Society of Agronomy—Soil Science Society of America: Madison, WI, USA, 1986; pp. 363–375. [Google Scholar]
  74. Zamudio, A.M.; Carrascal Carrascal, M.L.; Pulido Roa, C.E.; Gallardo, J.F.; Gómez Guzmán, I.D. Métodos Analíticos del Laboratorio de Suelos; Instituto Geografico Agustin Codazzi (IGAC): Bogotá, Colombia, 2006; p. 6. ISBN 9789589067987. [Google Scholar]
  75. Pieri, C.J.M.G. Fertility of Soils: A Future for Farming in the West African Savannah; Springer: Berlin/Heidelberg, Germany, 1992; Volume 10, ISBN 978-3-642-84322-8. [Google Scholar]
  76. Thioulouse, J.; Dray, S.; Dufour, A.-B.; Siberchicot, A.; Jombart, T.; Pavoine, S. Multivariate Analysis of Ecological Data with Ade4; Springer: Berlin/Heidelberg, Germany, 2018; ISBN 978-1-4939-8848-8. [Google Scholar]
  77. Dolédec, S.; Chessel, D. Co-inertia analysis: An alternative method for studying species-environment relationships. Freshw. Biol. 1994, 31, 277–294. [Google Scholar] [CrossRef]
  78. Pinheiro, J.; Bates, D.; DebRoy, S.; Sarkar, D. Nlme: Linear and Nonlinear Mixed Effects Models. R Package Version 3.1-131.1; R Foundation for Statistical Computing: Vienna, Austria, 2018. [Google Scholar]
  79. Bates, D.; Maechler, M.; Bolker, B.; Walker, S.; Bojesen, R.H.; Singmann, H.; Dai, B.; Scheipl, F.; Grothendieck, G.; Green, P.; et al. Package Lme4:Linear Mixed-Effects Models Using “Eigen” and S4 Package Version: 1.1-27; R Foundation for Statistical Computing: Vienna, Austria, 2021. [Google Scholar]
  80. R Core Team. R: A Language and Environment for Statistical Computing; R Foundation for Statistical Computing: Vienna, Austria, 2020. [Google Scholar]
  81. Di Rienzo, J.A.; Casanoves, F.; Balzarini, M.G.; Gonzalez, L.; Tablada, M.; Robledo, C.W. InfoStat; Grupo InfoStat, FCA, Universidad Nacional de Córdoba: Córdoba, Argentina, 2020. [Google Scholar]
  82. Wickham, H.; Chang, W.; Henry, L.; Pedersen, T.; Takahashi, K.; Wilke, C.; Woo, K.; Yutani, H.; Dunnington, D. Package ‘ggplot2’: Create Elegant Data Visualisations Using the Grammar of Graphics Version 3.3.3; R Foundation for Statistical Computing: Vienna, Austria, 2020. [Google Scholar]
  83. Dray, S.; Dufour, A.B. The Ade4 Package: Implementing the Duality Diagram for Ecologists. J. Stat. Softw. 2007, 22, 1–20. [Google Scholar] [CrossRef] [Green Version]
  84. Kassambara, A.; Mundt, F. Factoextra: Extract and Visualize the Results of Multivariate Data Analyses. R Package Version 1.0.7; R Foundation for Statistical Computing: Vienna, Austria, 2020; p. 84. [Google Scholar]
  85. Schoenholtz, S.H.; Van Miegroet, H.; Burger, J.A. A review of chemical and physical properties as indicators of forest soil quality: Challenges and opportunities. For. Ecol. Manag. 2000, 138, 335–356. [Google Scholar] [CrossRef]
  86. Mathieu, J.; Grimaldi, M.; Jouquet, P.; Rouland, C.; Lavelle, P.; Desjardins, T.; Rossi, J.-P. Spatial patterns of grasses influence soil macrofauna biodiversity in Amazonian pastures. Soil Biol. Biochem. 2009, 41, 586–593. [Google Scholar] [CrossRef]
  87. McGrath, D.A.; Smith, C.K.; Gholz, H.L.; Oliveira, F. de A. Effects of Land-Use Change on Soil Nutrient Dynamics in Amazônia. Ecosystems 2001, 4, 625–645. [Google Scholar] [CrossRef]
  88. Pereira, P.; Francos, M.; Brevik, E.C.; Ubeda, X.; Bogunovic, I. Post-fire soil management. Curr. Opin. Environ. Sci. Health 2018, 5, 26–32. [Google Scholar] [CrossRef]
  89. San Emeterio, L.; Múgica, L.; Ugarte, M.D.; Goicoa, T.; Canals, R.M. Sustainability of traditional pastoral fires in highlands under global change: Effects on soil function and nutrient cycling. Agric. Ecosyst. Environ. 2016, 235, 155–163. [Google Scholar] [CrossRef]
  90. Alcañiz, M.; Outeiro, L.; Francos, M.; Úbeda, X. Effects of prescribed fires on soil properties: A review. Sci. Total Environ. 2018, 613–614, 944–957. [Google Scholar] [CrossRef] [PubMed]
  91. Girona-García, A.; Ortiz-Perpiñá, O.; Badía-Villas, D. Dynamics of topsoil carbon stocks after prescribed burning for pasture restoration in shrublands of the Central Pyrenees (NE-Spain). J. Environ. Manag. 2019, 233, 695–705. [Google Scholar] [CrossRef]
  92. Navarrete, D.; Sitch, S.; Aragão, L.E.O.C.; Pedroni, L.; Duque, A. Conversion from forests to pastures in the Colombian Amazon leads to differences in dead wood dynamics depending on land management practices. J. Environ. Manag. 2016, 171, 42–51. [Google Scholar] [CrossRef] [PubMed]
  93. Vasconcelos, H.L. Effects of forest disturbance on the structure of ground-foraging ant communities in central Amazonia. Biodivers. Conserv. 1999, 8, 407–418. [Google Scholar] [CrossRef]
  94. Marchão, R.L.; Lavelle, P.; Leonide, C.; Balbino, C.; Vilela, L.; Becquer, T. Soil macrofauna under integrated crop-livestock systems in a Brazilian Cerrado Ferralsol. Pesq. Agropec. Bras. 2009, 44, 1011–1020. [Google Scholar] [CrossRef]
  95. Castro, D.; Fernández, F.; Meneses, A.D.; Tocora, M.C.; Sanchez, S.; Peña-Venegas, C.P. A preliminary checklist of soil ants (Hymenoptera: Formicidae) of Colombian Amazon. Biodivers. Data J. 2018, 6, e29278. [Google Scholar] [CrossRef]
  96. Marichal, R.; Martinez, A.F.; Praxedes, C.; Ruiz, D.; Carvajal, A.F.; Oszwald, J.; del Pilar Hurtado, M.; Brown, G.G.; Grimaldi, M.; Desjardins, T.; et al. Invasion of Pontoscolex corethrurus (Glossoscolecidae, Oligochaeta) in landscapes of the Amazonian deforestation arc. Appl. Soil Ecol. 2010, 46, 443–449. [Google Scholar] [CrossRef]
  97. Jones, D.T.; Susilo, F.X.; Bignell, D.E.; Hardiwinoto, S.; Gillison, A.N.; Eggleton, P. Termite assemblage collapse along a land-use intensification gradient in lowland central Sumatra, Indonesia. J. Appl. Ecol. 2003, 40, 380–391. [Google Scholar] [CrossRef] [Green Version]
  98. Bandeira, A.G.; Vasconcellos, A.; Silva, M.P.; Constantino, R. Effects of Habitat Disturbance on the Termite Fauna in a Highland Humid Forest in the Caatinga Domain, Brazil. Sociobiology 2003, 42, 117–128. [Google Scholar]
  99. Bourguignon, T.; Dahlsjö, C.A.L.; Salim, K.A.; Evans, T.A. Termite diversity and species composition in heath forests, mixed dipterocarp forests, and pristine and selectively logged tropical peat swamp forests in Brunei. Insectes Sociaux 2018, 65, 439–444. [Google Scholar] [CrossRef]
  100. Castro, D.; Carrijo, T.F.; Serna, F.J.; Peña-Venegas, C.P. Can Rubber Crop Systems Recover Termite Diversity in Previously Degraded Pastures in the Colombian Amazon Region? Neotrop. Entomol. 2021, 50, 899–911. [Google Scholar] [CrossRef] [PubMed]
  101. Chen, C.; Liu, W.; Jiang, X.; Wu, J. Effects of rubber-based agroforestry systems on soil aggregation and associated soil organic carbon: Implications for land use. Geoderma 2017, 299, 13–24. [Google Scholar] [CrossRef]
  102. Baumert, V.L.; Vasilyeva, N.A.; Vladimirov, A.A.; Meier, I.C.; Kögel-Knabner, I.; Mueller, C.W. Root Exudates Induce Soil Macroaggregation Facilitated by Fungi in Subsoil. Front. Environ. Sci. 2018, 6, 140. [Google Scholar] [CrossRef]
  103. Rodríguez, L.; Audor, L.C.U.; Salazar, J.C.S. Formation of Macroaggregates and Organic Carbon in Cocoa Agroforestry Systems. Floresta Ambient. 2019, 26, 1–12. [Google Scholar] [CrossRef]
  104. Gehring, C.A. Introduction: Mycorrhizas and Soil Structure, Moisture, and Salinity; Johnson, N.C., Gehring, C., Jansa, J.B.T.-M.M., Eds.; Elsevier: Amsterdam, The Netherlands, 2017; pp. 235–240. ISBN 978-0-12-804312-7. [Google Scholar]
  105. Sandoval, M.A.; Celis, J.E.; Morales, P. Structural remediation of an alfisol by means of sewage sludge amendments in association with yellow serradela (Ornithopus compressus L.). J. Soil Sci. Plant Nutr. 2011, 11, 68–78. [Google Scholar] [CrossRef] [Green Version]
  106. Vial, A.M.; Sandoval, E.M. Soil structural condition and its relationship with pastures under different conditions in the Simpson Valley (Humid western Patagonia, Chile). Idesia 2015, 33, 31–40. [Google Scholar] [CrossRef] [Green Version]
  107. Baptistella, J.L.C.; de Andrade, S.A.L.; Favarin, J.L.; Mazzafera, P. Urochloa in Tropical Agroecosystems. Front. Sustain. Food Syst. 2020, 4, 119. [Google Scholar] [CrossRef]
  108. Barros, E.; Pashanasi, B.; Constantino, R.; Lavelle, P. Effects of land-use system on the soil macrofauna in western Brazilian Amazonia. Biol. Fertil. Soils 2002, 35, 338–347. [Google Scholar] [CrossRef]
  109. Decaëns, T.; Mariani, L.; Lavelle, P. Soil surface macrofaunal communities associated with earthworm casts in grasslands of the Eastern Plains of Colombia. Appl. Soil Ecol. 1999, 13, 87–100. [Google Scholar] [CrossRef]
  110. Barros, E.; Neves, A.; Blanchart, E.; Fernandes, E.C.M.; Wandelli, E.; Lavelle, P. Development of the soil macrofauna community under silvopastoral and agrosilvicultural systems in Amazonia. Pedobiologia 2003, 47, 273–280. [Google Scholar] [CrossRef]
  111. Barros, E.; Grimaldi, M.; Sarrazin, M.; Chauvel, A.; Mitja, D.; Desjardins, T.; Thierry, D.; Lavelle, P. Soil physical degradation and changes in macrofaunal communities in Central Amazon. Appl. Soil Ecol. 2004, 26, 157–168. [Google Scholar] [CrossRef]
  112. Ramírez Pisco, R.; Guzmán Álvarez, M.E.; Leiva Rojas, E.I. Population Dynamics of Earthworms in an Andisol under Different Soil Use Systems. Rev. Fac. Nac. Agr. Medellín 2013, 66, 7045–7055. [Google Scholar]
  113. Meloni, F.; Varanda, E.M. Litter and soil arthropod colonization in reforested semi-deciduous seasonal Atlantic forests. Restor. Ecol. 2015, 23, 690–697. [Google Scholar] [CrossRef]
  114. Rocha, G.P.E.; Vieira, D.L.M.; Simon, M.F. Fast natural regeneration in abandoned pastures in southern Amazonia. For. Ecol. Manag. 2016, 370, 93–101. [Google Scholar] [CrossRef]
  115. Domínguez, J.; Bohlen, P.J.; Parmelee, R.W. Earthworms Increase Nitrogen Leaching to Greater Soil Depths in Row Crop Agroecosystems. Ecosystems 2004, 7, 672–685. [Google Scholar] [CrossRef]
  116. Mora, P.; Miambi, E.; Jiménez, J.J.; Decaëns, T.; Rouland, C. Functional complement of biogenic structures produced by earthworms, termites and ants in the neotropical savannas. Soil Biol. Biochem. 2005, 37, 1043–1048. [Google Scholar] [CrossRef]
  117. Bottinelli, N.; Jouquet, P.; Capowiez, Y.; Podwojewski, P.; Grimaldi, M.; Peng, X. Why is the influence of soil macrofauna on soil structure only considered by soil ecologists? Soil Tillage Res. 2014, 146, 118–124. [Google Scholar] [CrossRef]
  118. Snyder, B.A.; Hendrix, P.F. Current and Potential Roles of Soil Macroinvertebrates (Earthworms, Millipedes, and Isopods) in Ecological Restoration. Restor. Ecol. 2008, 16, 629–636. [Google Scholar] [CrossRef]
  119. Pollierer, M.M.; Klarner, B.; Ott, D.; Digel, C.; Ehnes, R.B.; Eitzinger, B.; Erdmann, G.; Brose, U.; Maraun, M.; Scheu, S. Diversity and functional structure of soil animal communities suggest soil animal food webs to be buffered against changes in forest land use. Oecologia 2021, 196, 195–209. [Google Scholar] [CrossRef]
  120. Menta, C.; Remelli, S. Soil Health and Arthropods: From Complex System to Worthwhile Investigation. Insects 2020, 11, 54. [Google Scholar] [CrossRef] [Green Version]
  121. Rousseau, G.X.; Rogério, P.; Silva, S.; Reis De Carvalho, C.J. Earthworms, Ants and Other Arthropods as Soil Health Indicators in Traditional and No-Fire Agro-Ecosystems from Eastern Brazilian Amazonia. Acta Zool. Mex. 2010, 2, 117–134. [Google Scholar]
  122. Menta, C.; Conti, F.D.; Pinto, S.; Bodini, A. Soil Biological Quality index (QBS-ar): 15 years of application at global scale. Ecol. Indic. 2018, 85, 773–780. [Google Scholar] [CrossRef]
  123. Domínguez-Haydar, Y.; Velásquez, E.; Carmona, J.; Lavelle, P.; Chavez, L.F.; Jiménez, J.J. Evaluation of reclamation success in an open-pit coal mine using integrated soil physical, chemical and biological quality indicators. Ecol. Indic. 2019, 103, 182–193. [Google Scholar] [CrossRef]
Figure 1. Location of the study sites (Caquetá state, Northwestern of the Colombian Amazon).
Agronomy 11 02484 g001
Figure 2. Principal component analysis (PCA) with the soil physical-chemical properties and the sampling plots projected on the ordination plane PC1/PC2. (a) Correlation circle of soil physical-chemical variables; the color of the vectors indicates the contribution of the variables to the PCs. (b,c), sampling plots grouped by chronosequence and landscape; 95% confidence ellipses. Degraded pasture, 10–20 and 25–40: <3, 10–20 and 25–40 years of abandonment; forest: mature forest.
Agronomy 11 02484 g002
Figure 3. Principal component analysis (PCA) with the soil macrofauna taxonomic groups composition and the sampling plots projected on the ordination plane PC1/PC2. Correlation circle of soil macrofauna groups compositions; the color of the vectors indicates the contribution of the variables to the PCs, and sampling plots grouped by chronosequence: (a,b) hill areas, and (c,d) mountain areas; 95% confidence ellipses. Degraded pasture, 10–20 and 25–40: <3, 10–20 and 25–40 years of abandonment; forest: mature forest.
Agronomy 11 02484 g003
Figure 4. Principal component analysis (PCA) with the soil macroaggregation variables and the sampling plots projected on the ordination plane PC1/PC2. Correlation circle of soil macroaggregation variables; the color of the vectors indicates the contribution of the variables to the PCs, and sampling plots grouped by chronosequence: (a,b) hill areas, and (c,d) mountain areas; 95% confidence ellipses. Degraded pasture, 10–20 and 25–40: <3, 10–20 and 25–40 years of abandonment; forest: mature forest.
Agronomy 11 02484 g004
Figure 5. Soil quality sub-indicators and GISQ (general indicator of soil quality) according to successional stages of the chronosequence (Degraded pasture, 10–20 and 25–40 years of abandonment, and Forest) (a) and landscape (b). Mean values (*) between successional categories or landscapes followed by the same letter do not differ statistically (Fisher’s least significant difference LSD test, p < 0.05).
Agronomy 11 02484 g005
Figure 6. Principal component analysis (PCA) with the sub-indicators of soil quality, GISQ (general indicator of soil quality), and the sampling plots projected on the ordination plane PC1/PC2. (a) Correlation circle of the sub-indicators of soil quality and GISQ; the color of the vectors indicates the contribution of the variables to the PCs. (b,c), sampling plots grouped by chronosequence and landscape, respectively; 95% confidence ellipses. Degraded pasture, 10–20 and 25–40: <3, 10–20 and 25–40 years of abandonment; forest: mature forest.
Agronomy 11 02484 g006
Table 1. Soil physical and chemical properties (0–30 cm layer) along a chronosequence composed of four successional categories in two contrasting landscapes in the northwestern Colombian Amazon.
ChronosequenceLandscapeDisturbed vs. UndisturbedChronosequence vs. Landscape
Forest25–4010–20Degraded PastureHillMountainp-Valuep-Value
Physical Properties
Bulk density (g cm−3)1.32 ± 0.02 b1.35 ± 0.02 b1.38 ± 0.03 ab1.45 ± 0.03 a1.35 ± 0.01 b1.40 ± 0.02 a0.01250.8855
Clay (%)35.56 ± 0.33 a39.44 ± 2.93 a37.47 ± 3.76 a29.50 ± 4.44 a47.44 ± 2.25 a23.54 ± 2.88 b0.98340.6259
Sand (%)55.17 ± 3.62 ab51.08 ± 3.25 b53.08 ± 4.14 ab64.17 ± 4.87 a43.93 ± 2.24 b67.82 ± 3.33 a0.82940.4442
Silt (%)9.28 ± 1.10 a9.47 ± 1.02 a9.50 ± 1.28 a6.33 ± 1.50 a8.65 ± 0.56 a8.64 ± 1.11 a0.53040.4606
Total porosity (%)44.77 ± 0.93 a43.62 ± 0.84 a42.37 ± 1.07 ab39.30 ± 1.26 b42.62 ± 0.57 a41.41 ± 0.87 b0.01260.8836
Soil moisture (%)25.34 ± 1.59 a23.38 ± 1.44 a21.24 ± 1.82 ab16.01 ± 2.14 b23.3 ± 0.97 a19.60 ± 1.48 b0.01260.8837
SI (%)7.13 ± 0.70 a6.26 ± 0.98 a5.95 ± 0.69 a5.47 ± 0.85 a4.33 ± 0.17 b8.08 ± 0.79 a0.15840.5881
Chemical properties
pH4.27 ± 0.07 a4.50 ± 0.07 a4.49 ± 0.09 a4.50 ± 0.10 a4.54 ± 0.03 a4.34 ± 0.08 b0.01860.4958
CEC (meq 100 g−1)5.48 ± 0.72 a7.00 ± 0.57 a6.98 ± 0.77 a5.25 ± 0.92 a7.48 ± 0.61 a4.87 ± 0.45 b0.28260.9651
N (%) 0.13 ± 0.01 a0.12 ± 0.01 a0.12 ± 0.01 ab0.09 ± 0.01 b0.12 ± 0.004 a0.11 ± 0.01 a0.12910.7007
K (mg kg−1)55.26 ± 6.54 a54.52 ± 5.12 a55.26 ± 6.54 a34.81 ± 7.70 a45.59 ± 3.71 a49.37 ± 5.15 a0.68060.6354
P (mg kg−1)3.26 ± 0.27 a3.13 ± 0.25 a3.49 ± 0.31 a2.80 ± 0.37 a3.03 ± 0.17 a3.30 ± 0.25 a0.70770.5883
EC (dS m−1)0.40 ± 10.04 a0.25 ± 0.03 bc0.32 ± 0.04 ab0.17 ± 0.05 c0.15 ± 0.01 b0.42 ± 0.04 a0.00110.0511
SOC (%)1.49 ± 0.14 a1.47 ± 0.08 a1.41 ± 0.14 ab1.06 ± 0.10 b1.40 ± 0.09 a1.32 ± 0.08 a0.26280.6628
Ca (mg kg−1)226.22 ± 6.35 a236.89 ± 10.76 a244.61 ± 8.94 a232.42 ± 8.53 a234.74 ± 6.60 a235.33 ± 5.80 a0.17310.2061
Mg (mg kg−1)39.03 ± 1.23 a42.97 ± 3.12 a42.11 ± 1.53 a36.81 ± 2.02 a39.15 ± 1.55 a41.31 ± 1.41 a0.38620.4765
EA (mg kg−1)342.40 ± 51.37 ab478.25 ±49.77 a377.54 ± 52.92 ab315.89 ± 38.35 b511.79 ± 37.02 a245.25 ± 31.25 b0.41590.8071
Values corresponded to mean and standard error. Values between rows in the chronosequence or landscape followed by the same letter do not differ statistically (Fisher’s least significant difference LSD test, p < 0.05). Degraded pasture, 10–20 and 25–40: <3, 10–20 and 25–40 years of abandonment, respectively; forest: mature forest. The categories: degraded pasture, 10–20 and 25–40 were combined (disturbed) to compare to Forest (undisturbed).
Table 2. Density of soil macrofauna communities (individuals⋅m−2) in the 0–30 cm layer along a chronosequence composed of four successional categories in two contrasting landscapes in the northwestern Colombian Amazon.
Taxonomic GroupChronosequenceLandscapeDisturbed vs. UndisturbedChronosequence vs. Landscape
Forest25–4010–20Degraded PastureHillMountainp-Valuep-Value
Araneae107.93 ± 18.46 a98.95 ± 13.86 a96.55 ± 17.88 a24.87 ± 6.27 b 62.18 ± 9.45 a81.45 ± 9.50 a0.00690.0003
Blattodea37.17 ± 17.07 a29.99 ± 11.27 a29.21 ± 14.54 a9.24 ± 5.61 a20.79 ± 7.89 a26.38 ± 8.26 a0.25700.9621
Chilopoda131.99 ± 24.86 a99.12 ± 15.32 ab110.22 ± 22.48 ab60.22 ± 15.02 b86.52 ± 13.52 a107.70 ± 13.78 a0.06130.0776
Coleoptera adults98.34 ± 10.83 a74.02 ± 6.79 a94.26 ± 11.26 a50.60 ± 7.56 b80.25 ± 7.38 a73.42 ± 5.60 a0.01160.3860
Coleoptera-larvae104.92 ± 20.41 a86.16 ± 13.73 a69.04 ± 14.61 ab41.31 ± 10.90 b55.52 ± 9.12 b91.46 ± 12.08 a0.02560.0235
Dermaptera11.83 ± 4.63 a2.67 ± 3.78 a0.00 ± 5.00 a8.00 ± 5.97 a0.00 ± 3.78 b11.25 ± 3.13 a0.14150.3063
Diplopoda98.34 ± 26.47 a118.65 ± 26.05 a126.21 ± 36.64 a32.66 ± 11.54 b90.49 ± 19.97 a76.64 ± 14.08 a0.48560.7487
Diplura71.55 ± 31.77 a55.23 ± 20.05 a26.83 ± 13.02 a16.65 ± 9.77 a28.58 ± 10.55 a46.49 ± 14.02 a0.08710.2728
Diptera-larvae6.67 ± 7.87 a17.33 ± 6.43 a8.67 ± 8.50 a5.33 ± 10.16 a 4.00 ± 6.43 a15.00 ± 5.33 a0.68730.2184
Formicidae1411.66 ± 139.70 a1287.51 ± 104.08 ab977.15 ± 104.68 b656.26 ± 84.28 c999.79 ± 81.01 a1079.82 ± 72.51 a0.00050.6544
Hemiptera23.85 ± 7.70 b42.86 ± 11.16 ab95.20 ± 32.55 a20.66 ± 8.66 b39.07 ± 10.28 a36.29 ± 7.87 a0.10910.5139
Isopoda40.00 ± 12.11 a25.78 ± 9.89 a30.67 ± 13.08 a5.33 ± 15.64 a28.22 ± 9.89 a22.67 ± 8.20 a0.18620.2600
Isoptera4867.72 ± 1187.70 a4806.44 ± 957.57 a3648.65 ± 961.68 a728.25 ± 229.81 b3032.86 ± 604.81 a2599.73 ± 429.56 a0.01080.0369
Lepidoptera-larvae15.92 ± 46.32 a10.67 ± 37.82 a140.33 ± 50.03 a5.33 ± 59.79 a72.67 ± 37.82 a13.46 ± 31.36 a0.51330.1868
Oligochaeta214.00 ± 47.61 a115.44 ± 21.08 b276.09 ± 66.27 a416.60 ± 120.18 a255.54 ± 46.37 a209.35 ± 31.54 a0.69260.9039
Opiliones39.19 ± 12.20 ab53.18 ± 13.47 a19.60 ± 6.71 b23.55 ± 9.80 ab23.66 ± 6.19 a41.46 ± 8.74 a0.41790.1224
Orthoptera9.33 ± 3.84 a10.67 ± 3.13 a8.00 ± 4.14 a2.67 ± 4.95 a5.33 ± 3.13 a10.00 ± 2.60 a0.62740.3721
Pseudoscorpionida18.50 ± 1.52 b34.82 ± 1.72 a22.63 ± 1.83 b22.63 ± 2.16 b27.36 ± 1.52 a20.99 ± 1.17 b0.0002<0.0001
Symphyla1.33 ± 3.86 b6.67 ± 3.16 ab0.00 ± 4.17 b16.00 ± 4.99 a7.33 ± 3.16 a4.67 ± 2.62 a0.18400.4342
Rychness †14.99 ± 1.36 a14.16 ± 1.09 a8.08 ± 1.08 b5.92 ± 1.14 b10.06 ± 1.04 a10.02 ± 0.81 a<0.00010.6995
Density7324.98 ± 937.89 a7079.25 ± 740.13 a5995.62 ± 829.30 a2333.66 ± 386.24 b5743.31 ± 600.78 a4689.98 ± 406.72 a0.00230.0609
Values corresponded to mean and standard error. Values between rows in the chronosequence or landscape followed by the same letter do not differ statistically (Fisher’s least significant difference LSD test, p < 0.05). Degraded pasture, 10–20 and 25–40: <3, 10–20 and 25–40 years of abandonment; forest: mature forest. The categories: degraded pasture, 10–20 and 25–40 were combined (disturbed) to compare to forest (undisturbed). † Per monolith.
Table 3. Soil macroaggregates (%) in top layer (0–10 cm) along a chronosequence composed of four successional categories in two contrasting landscapes in the northwestern Colombian Amazon.
Soil MacroaggregatesChronosequenceLandscapeDisturbed vs. UndisturbedChronosequence vs. Landscape
Forest25–4010–20Degraded PastureLomeríoMountainp-Valuep-Value
Biogenic macroaggregates19.72 ± 4.14 b44.11 ± 3.38 a33.40 ± 4.47 a15.41 ± 5.35 b24.52 ± 3.38 a31.80 ± 2.80 a0.02970.9865
Non-macroaggregated49.86 ± 4.67 a27.02 ± 3.82 b41.26 ± 5.05 a22.18 ± 6.03 b36.50 ± 3.82 a33.66 ± 3.16 a0.00140.8059
Organic material0.97 ± 0.15 a0.65 ± 0.14 ab0.44 ± 0.18 bc0.04 ± 0.20 c0.32 ± 0.05 b0.73 ± 0.16 a0.00290.2140
Physicogenic macroaggregates19.64 ± 3.51 b20.41 ± 2.87 b16.55 ± 3.80 b33.80 ± 4.54 a27.05 ± 2.87 a18.15 ± 2.38 b0.34910.6347
Root macroaggregates9.81 ± 2.60 b7.81 ± 2.12 b8.35 ± 2.80 b28.58 ± 3.35 a11.62 ± 2.12 a15.65 ± 1.76 a0.10790.8565
Values corresponded to mean and standard error. Values between rows in the chronosequence or landscape followed by the same letter do not differ statistically (Fisher’s least significant difference LSD test, p < 0.05). Degraded pasture, 10–20 and 25–40: <3, 10–20 and 25–40 years of abandonment, respectively; forest: mature forest. The categories: degraded pasture, 10–20 and 25–40 were combined (disturbed) to compare to forest (undisturbed).
Table 4. Matrix correlation coefficients (RV) between four data matrices (i.e., macrofauna, physical, chemical and macroaggregation) obtained from the coinertia analysis.
Coinertia AnalysisProjected InertiaRVp-Value
Axis 1Axis 2
Macrofauna vs. Chemical52.321.10.240.035
Macrofauna vs. Physical51.639.10.230.036
Macrofauna vs. Macroaggregation68.322.10.210.040
Chemical vs. Physical79.616.70.530.001
Chemical vs. Macroaggregation51.239.90.170.043
Physical vs. Macroaggregation73.922.80.140.044
Publisher’s Note: MDPI stays neutral with regard to jurisdictional claims in published maps and institutional affiliations.

