Article

DArTseq Genotypic and Phenotypic Diversity of Barley Landraces Originating from Different Countries

National Centre for Plant Genetic Resources, Plant Breeding and Acclimatization Institute—National Research Institute, Błonie, 05-870 Radzików, Poland
*
Author to whom correspondence should be addressed.
Agronomy 2021, 11(11), 2330; https://doi.org/10.3390/agronomy11112330
Submission received: 2 September 2021 / Revised: 11 November 2021 / Accepted: 16 November 2021 / Published: 18 November 2021
(This article belongs to the Special Issue Old Germplasm for New Needs: Managing Crop Genetic Resources)

Abstract

:
Landraces are considered a key element of agrobiodiversity because of their high variability and adaptation to local environmental conditions, but at the same time, they represent a breeding potential hidden in gene banks that has not yet been fully appreciated and utilized. Here, we present a genome-wide DArTseq analysis of the diversity of 116 spring barley landraces preserved in the collection of the Polish gene bank. Genetic analysis revealed considerable variation in this collection and several distinct groups related to the landraces’ country of origin and the grain type were identified. The genetic distinctness of hulless accessions may provide a basis for pro-quality breeding aimed at functional food production. However, the variable level of accession heterogeneity can be a significant obstacle. A solution to this problem is the establishment of special collections composed of pure lines that are accessible to breeders. Regions lacking genetic diversity have also been identified on 1H and 4H chromosomes. A small region of reduced heterogeneity was also present in the hulless forms in the vicinity of the nud gene that determines the hulless grain type. However, the SNPs present in this area may also be important in selection for traits related to grain weight and size because their QTLs were found there. This may support breeding of hulless forms of spring barley which may have applications in the production of high-quality foods with health-promoting values.

1. Introduction

The progressive genetic erosion of agricultural ecosystems and the associated irreversible loss of this vital part of the global biodiversity essential to sustaining humankind is a fact that no one discusses anymore. Agrobiodiversity is recognized as a finite global resource that is known to be eroded or lost in part because of imprudent, unsustainable human practices [1]. Landraces are considered to be a key element of agrobiodiversity [2]. Several definitions of landrace exist in the scientific literature so far. Among them is the one proposed by V. Negri, which combines several other definitions. “A landrace of a seed-propagated crop can be defined as a variable population, which is identifiable and usually has a local name. It lacks “formal” crop improvement, is characterized by a specific adaptation to the environmental conditions of the area of cultivation (tolerant to the biotic and abiotic stresses of that area) and is closely associated with the traditional uses, knowledge, habits, dialects, and celebrations of the people who developed and continue to grow it” [1]. The list of factors that contribute to the genetic erosion of landraces is long. Changes in agricultural practices and land use are highlighted as the main ones. Mechanization, crop protection chemicals, and irrigation promote the displacement of landraces by modern cultivars. National registration and certification systems that restrict the sale of crop seeds if a cultivar is not included in the national or regional list of registered cultivars are factors as well. Moreover, the depopulation of rural areas and the resulting loss of traditional knowledge and cultivation systems for landraces have a tremendous impact. Changes in consumer habits and food standards that limit the supply of landraces are also important. Unfortunately, one of the factors is the lack of education and consequent awareness of the value of plant genetic resources as a valuable local and national heritage. In addition, a major threat that is becoming more serious every year is global warming and changing weather patterns. This is because landraces are very often cultivated on marginal land under conditions that are close to species limits. An irretrievable loss of landraces also occurs due to armed conflicts and political instability [3].
Loss of diversity is common in modern crops of major species that have been developed by large, focused, “industrial” breeding programs. Overall, the ideotype is well defined by market needs and regional adaptations [4]. In barley, as in most crops, the current elite cultivars are less genetically diverse than their wild relatives or early domesticated forms at the majority of loci [5,6,7]. Nearly all modern cultivars arose from the reshuffling of selected alleles, leading to a limited number of alleles present within the gene pool [8]. Barley breeders use almost exclusively elite lines with which they are familiar to meet short-term breeding goals [9]. The major emphasis has been put on high yields and tolerance to biotic stresses [10]. Elite cultivars produce high yields under optimal conditions; however, they can fail under harsh environmental conditions [11]. Barley landraces can produce up to 61% higher grain yield under unfavorable conditions compared to improved cultivars [12]. However, it should be kept in mind that under conditions of modern, intensive farming, landraces yield at a much lower level than commercial cultivars and are unable to feed the world [13]. Precisely, these unique morphological, physiological, and genetic traits of landraces that allowed them to survive and to be productive despite the pressure of biotic and abiotic factors should be used to develop new cultivars resistant to climatic conditions and new aggressive races of pathogens [10].
While elite lines have been widely used in breeding programs, introgression of potentially new genes from landraces has received too little attention [14]. Underutilization of landraces in breeding programs is most likely due to the time-consuming and labor-intensive nature of pre-breeding associated with both the necessity to break linkage drag and the potential loss of important gene complexes [10]. Nevertheless, landraces have been used in breeding as a source of resistance to viruses, fungal pathogens, and pests [15,16,17,18,19]. The potential of landraces as a source of valuable traits for breeding has been widely discussed by Dawson, et al. [20], Pietrusińska, et al. [21], Hernandez, et al. [22] and Kumar et al. [10]. Introgression of the landrace’s gene pool into ongoing breeding programs is a prerequisite for improving tolerance of biotic and abiotic stresses, grain nutritional value, and ensuring future food security.
Over the years, the diversity of barley germplasm has been the subject of many studies concerning agronomic, morphological, as well as genetic traits. A wide range of biochemical and molecular techniques, i.e., Restriction Fragment Length Polymorphisms (RFLP), Random Amplified Polymorphic DNA (RAPD), Amplified Fragment Length Polymorphism (AFLP), Inter Simple Sequence Repeat (ISSR), or Simple Sequence Repeat (SSR), has been used to characterize barley germplasm [23,24,25,26,27,28,29,30,31,32,33,34,35,36,37]. The portfolio of techniques used has changed over time and followed the latest trends and availability of cutting-edge tools. A group of tools for SNP-based genotyping has recently been put into the hands of scientists working on barley genetic variation. Among them are those based on the Kompetitive Allele Specific PCR (KASP) technology, microarrays, and next-generation sequencing (NGS) [38,39,40,41,42,43,44,45,46].
In this study, DArTseq derived SNPs were used (a) for genetic analysis and population structure of barley spring landraces preserved in Polish gene bank; (b) to assess the level of within-accession heterogeneity; (c) to evaluate chromosome level diversity with an emphasis on the region adjacent to the nud gene; and (d) to assist in the selection of materials useful for breeding programs. By doing so, it is hoped to increase breeders’ interest in barley germplasm. A side goal of the study was a comparison of results obtained with classical molecular markers and a modern NGS-based method to prove that a properly performed old-school analysis can generate valid results. This study analyzed unique material that had never been genotyped by sequencing before.

2. Materials and Methods

2.1. Plant Material

In the study, 116 spring barley accessions were investigated. All of them were assigned as landrace/traditional cultivars and are preserved by the National Center for Plant Genetic Resources (NCPGR), i.e., the Polish gene bank. The accessions originating from Poland make up 60% of the studied accessions and their detailed biological, geographical agro-morphological characteristics were described in detail in Dziurdziak et al. [32]. The remaining 40% of the studied materials come from foreign field expeditions (Table S1, Figure 1). In the 1970s and 1980s, accessions were collected in the USSR (13% of the foreign accessions) and Czechoslovakia (4%). The remaining accessions were acquired in 2004 from Iran (15% of the remaining accessions) and Georgia (7%), and during three field expeditions in the years 2011–2013 from Lithuania (60% of the remaining accessions). Only 12 accessions represent hulless barley, the rest were hulled. All hulless accessions originated from Poland (Table S1). Scans of grains in the active collection of the NCPGR long-term storage facility were made for all accessions examined. Each accession was represented by approximately 400 grains sourced from an active collection. The grains were scattered uniformly on a CanoScan LiDE 700 F flatbed desktop scanner surface. Scans with a resolution of 300 dpi were saved in jpg format and forwarded to the EGISET database [47] (Figure 2).

2.2. Agro-Morphological Features

Data were obtained from EGISET, the NCPGR database [47]. Accessions were evaluated as described by Dziurdziak et al. [32]. Data were collected between 1978 and 2016. The variation coefficient was defined as:
C v = σ μ
where σ is the standard deviation and μ is an arithmetic mean, and was used to measure the dispersion of traits.

2.3. DNA Isolation

Seeds obtained from long-term storage were sown and tissue was harvested from healthy seedlings that were in the second leaf stage and the middle part of the second leaf (about 10 mm long) was taken. Each accession was represented by eight random plantlets that formed a bulk sample. Total genomic DNA was extracted using a modified CTAB protocol [48,49]. The quality and quantity of DNA samples were assessed by spectrophotometric analysis by a NanoDrop ND-1000 spectrophotometer (NanoDrop Technologies, Willmington, DA, USA) followed by agarose gel electrophoresis (1.5% agarose).

2.4. DArTseq Genotyping

Genotyping of 116 spring barley landraces was performed using the genome-wide profiling DArTseq method as previously described [50]. Extracted genomic DNA samples were sent to Diversity Arrays Technology Pty Ltd (http://www.diversityarrays.com accessed on 1 September 2021). The resulting sequences were aligned against the Morex barley genome assembly [51]. Raw data are available on the platform Center for Open Science at https://osf.io/mh4tn/ (accessed on 23 October 2021). (doi 10.17605/OSF.IO/MH4TN).

2.5. ISSR Analysis

Previous data for some accessions studied here, obtained using the ISSR method, were also used. The ISSR analysis and its results are described in detail by Dziurdziak et al. [32]. Results of previous studies were used to compare different methods of genetic diversity analysis.

2.6. Marker Data Analysis

The results of DArTseq genotyping were generated as a table listing single nucleotide polymorphisms (codominant) markers that were detected in the sequenced fragments of genome representations. SNP markers were then transformed into a binary matrix. To preserve their codominant nature, each locus was represented by two consecutive lines. The presence of a SNP relative to the reference sequence was denoted as 1, while the absence of a SNP was denoted as 0. Thus, in the array, homozygotes were denoted as 1/1 or 0/0 and heterozygotes as 1/0. The analyzed markers were filtered by reproducibility (RepAvg ≥ 0.95), call rate (CallRate ≥ 0.95), and the minor allele frequency (MAF > 0.01).
The percentage of polymorphic fragments and the polymorphic information content ratios (PIC) were calculated. The PIC formula was:
PIC = 1 i = 1 n p i 2
where i is the ith allele of the jth marker, n is the number of alleles of the jth marker, and p is an allele frequency.
The expected heterozygosity (uHe) was estimated using Nei’s gene diversity coefficient was calculated as follows:
u H e = 2 N 2 N 1 ( 1 i = 1 n p i 2 )
where pi is the frequency of the ith allele, n is the number of alleles of the jth marker, and N is the sample size.
The observed heterozygosity for the codominant data (uHo) was calculated as follows:
u H o = 2 N 2 N 1 ( N o . _ o f _ H e t s N )
where the number of heterozygotic loci was determined by direct counting and N is the sample size. The Fixation Index for codominant data (F) was calculated as follows:
F = u H e u H o u H e
where uHe is the expected heterozygous and uHo is the observed heterozygosity.
Allelic richness for groups was calculated based on rarefaction due to a different number of accessions originating from each country [52].
PIC and Ho values along chromosomes were assessed by a sliding window approach with 500 kb windows at 250 positions along the chromosomes.
The data for observed heterozygosity were divided into groups based on accession origin countries. The means in these groups were compared using analysis of variance (ANOVA) and Tukey’s post hoc test. The binary data matrix was used to calculate the Jaccard dissimilarity coefficient. The Principal Coordinate Analysis (PCoA) was performed to determine the relationship between the accessions.
The genetic structure of the germplasm was analyzed by clustering based on the Bayesian model implemented in STRUCTURE v.2.3.4 [53]. The search for the most probable K value was performed in the range from 1 to 10 with ten independent repetitions for each K value. The number of burn-ins and MCMC replicates were 5 × 10⁴ and 1.5 × 10⁵ respectively in each run. Batch runs were carried out on a LINUX cluster hosted by the Interdisciplinary Centre for Mathematical and Computational Modelling at the Warsaw University.
The determination of the number of true clusters was performed based on the posteriori data probability for a given K and ΔK [54]. The best match for replicated cluster analysis results was performed using the full search algorithm. The maximum probability coefficient was used to assign landrace to clusters with a 0.8 probability limit of being assigned to a cluster.
Correlation between the dissimilarity matrix of morphometric and genetic data was performed using the Mantel test (104 permutations). A consensus configuration for these two sets of data was obtained by the Generalized Procrustes Analysis (GPA) [55].
All above-mentioned analyses were performed using the Microsoft Excel 2016, XLSTAT Ecology (Addinsoft, Inc., Brooklyn, NY, USA), GenAlEx 6.501 [56], HP-RARE 1.1 [57], STRUCTURE v2.3.4 [53], CLUMPAK [58]. The data analysis was performed within the framework of the Computational Grant (G72-19) of the Interdisciplinary Centre for Mathematical and Computational Modelling, University of Warsaw (ICM UW).

3. Results

3.1. Agro-Morphological Diversity

All agro-morphological data were historical and sourced from field observations between 1978 and 2016. So far, no evaluation has been conducted for five accessions. A summary of all analyzed traits was presented in Table 1.

3.2. Genetic Analysis

3.2.1. Data Quality Analysis

By using the genome reduction method, 77,817 polymorphic SNP loci were generated. To avoid errors in statistical analysis, loci with low reproducibility (RepAvg ≤ 0.95), low call rate (CallRate ≤ 0.95), and low minor allele frequency (MAF < 0.01) were removed. Therefore, 66,815 SNP loci were excluded from the analysis, and 11,002 SNP loci met all quality parameters and were classified for further analysis.
Analysis of the distribution of SNP loci on chromosomes before and after filtering the results was performed. Filtering of the results did not disturb their distribution, and they were positioned almost equally across chromosomes, ranging from 10% on chromosome 1H and 6H to a maximum of 15% on chromosome 2H (Figure S1). There was a relatively high proportion (18% raw data, 16% filtered data) of loci with an unknown chromosomal location.
Analysis was also performed to examine loci distribution along each chromosome (Figure 3). For all chromosomes, there was the same pattern of distribution of the studied loci, i.e., their proportion was higher at the ends of the chromosome arms and decreased toward the centromeres. Moreover, on both chromosomes 1H and 4H, a negligible number of loci among the analyzed DArTseq loci were in the centromeric and pericentromeric regions. On 1H, this “empty” region was about 105 Mbp long and contained only 6 analyzed loci and on 4H, only 24 loci were present in a fragment of about 243 Mbp surrounding the centromere. As a result, the average PIC and Ho for these regions were very low. For the other chromosomes, the number of loci analyzed in the centromere region was higher, although still significantly lower than for the regions located closer to the telomeres. PIC and Ho values were evenly distributed along chromosome 3H. In contrast, there were two regions of low heterogeneity on 2HL, with one directly adjacent to the centromere (~104 Mbp) and the other slightly shorter, i.e., ~89 Mbp terminating at the midpoint of the arm length. On 5H, the region of reduced heterogeneity occurred on the short arm in the direct vicinity of the centromere and was ~54 Mbp long.

3.2.2. Genetic Diversity

For all analyzed loci, the mean polymorphic information content (PIC) value was 0.22 and the median was 0.20. About 30% of loci had PIC below 0.1, while about 18% of loci had PIC above 0.4 thus were highly informative (Figure S2).
The genetic variation parameters, such as observed heterozygosity (uHo), expected heterozygosity (uHe), and fixation index (F) for the entire set of accessions had the values 0.114, 0.232, and 0.519 respectively. Because the analysis was performed on pooled samples, the observed heterozygosity coefficient actually shows the heterogeneity of individuals within the accessions. The lowest observed heterogeneity (uHo) had PL 41430 (0.010) while the highest was found in PL 503844 (0.422) (Table S1). This indicates the presence of significant differences in the level of heterogeneity of the accessions studied, which may have significant consequences for the phenotypic differentiation within the accessions. In groups according to country of origin, accessions originating from Georgia had the highest observed heterogeneity (0.206) and the lowest fixation index (−0.628) while accessions originating from Iran had the lowest uHo (0.072) and the highest F (0.722). This indicates significant internal differentiation among the accessions from Georgia. However, there is little qualitative difference in SNPs between the accessions. The opposite situation occurred in the case of accessions from Iran, where there were significant qualitative differences in SNPs between accessions, while individuals within each accession were genetically very similar. Allele richness was highest in the group of accessions from Georgia and lowest in those from Poland. All three coefficients were also calculated considering their chromosomal location. Observed heterogeneity for individual chromosomes ranged from 0.093 (chr 1H) to 0.124 (chr 6H) and this difference was significant (Figure 4). However, when it was combined with a classification by country, it turned out that for Poland, Iran, and Georgia, the greatest number of heterogenous loci occurred on chromosome 6H, for Lithuania on chr 5H, and the USSR on chr 4H. The greatest homozygosity was observed on chromosome 1H in the accessions from Lithuania and the USSR, on chr 4H in the accessions from Poland, and chr 5H in those from Georgia and Iran (Figure 4). These differences were statistically significant.
The number of unique SNPs for the studied countries was also determined. The maximum number of unique SNPs was found in accessions originating from Iran (775) and the minimum in those from the former Czechoslovakia (13). Their distribution on chromosomes was as follows: the highest number of unique SNPs occurred on chr 2H (326) and the lowest on chr 6H (162) (Figure 4)

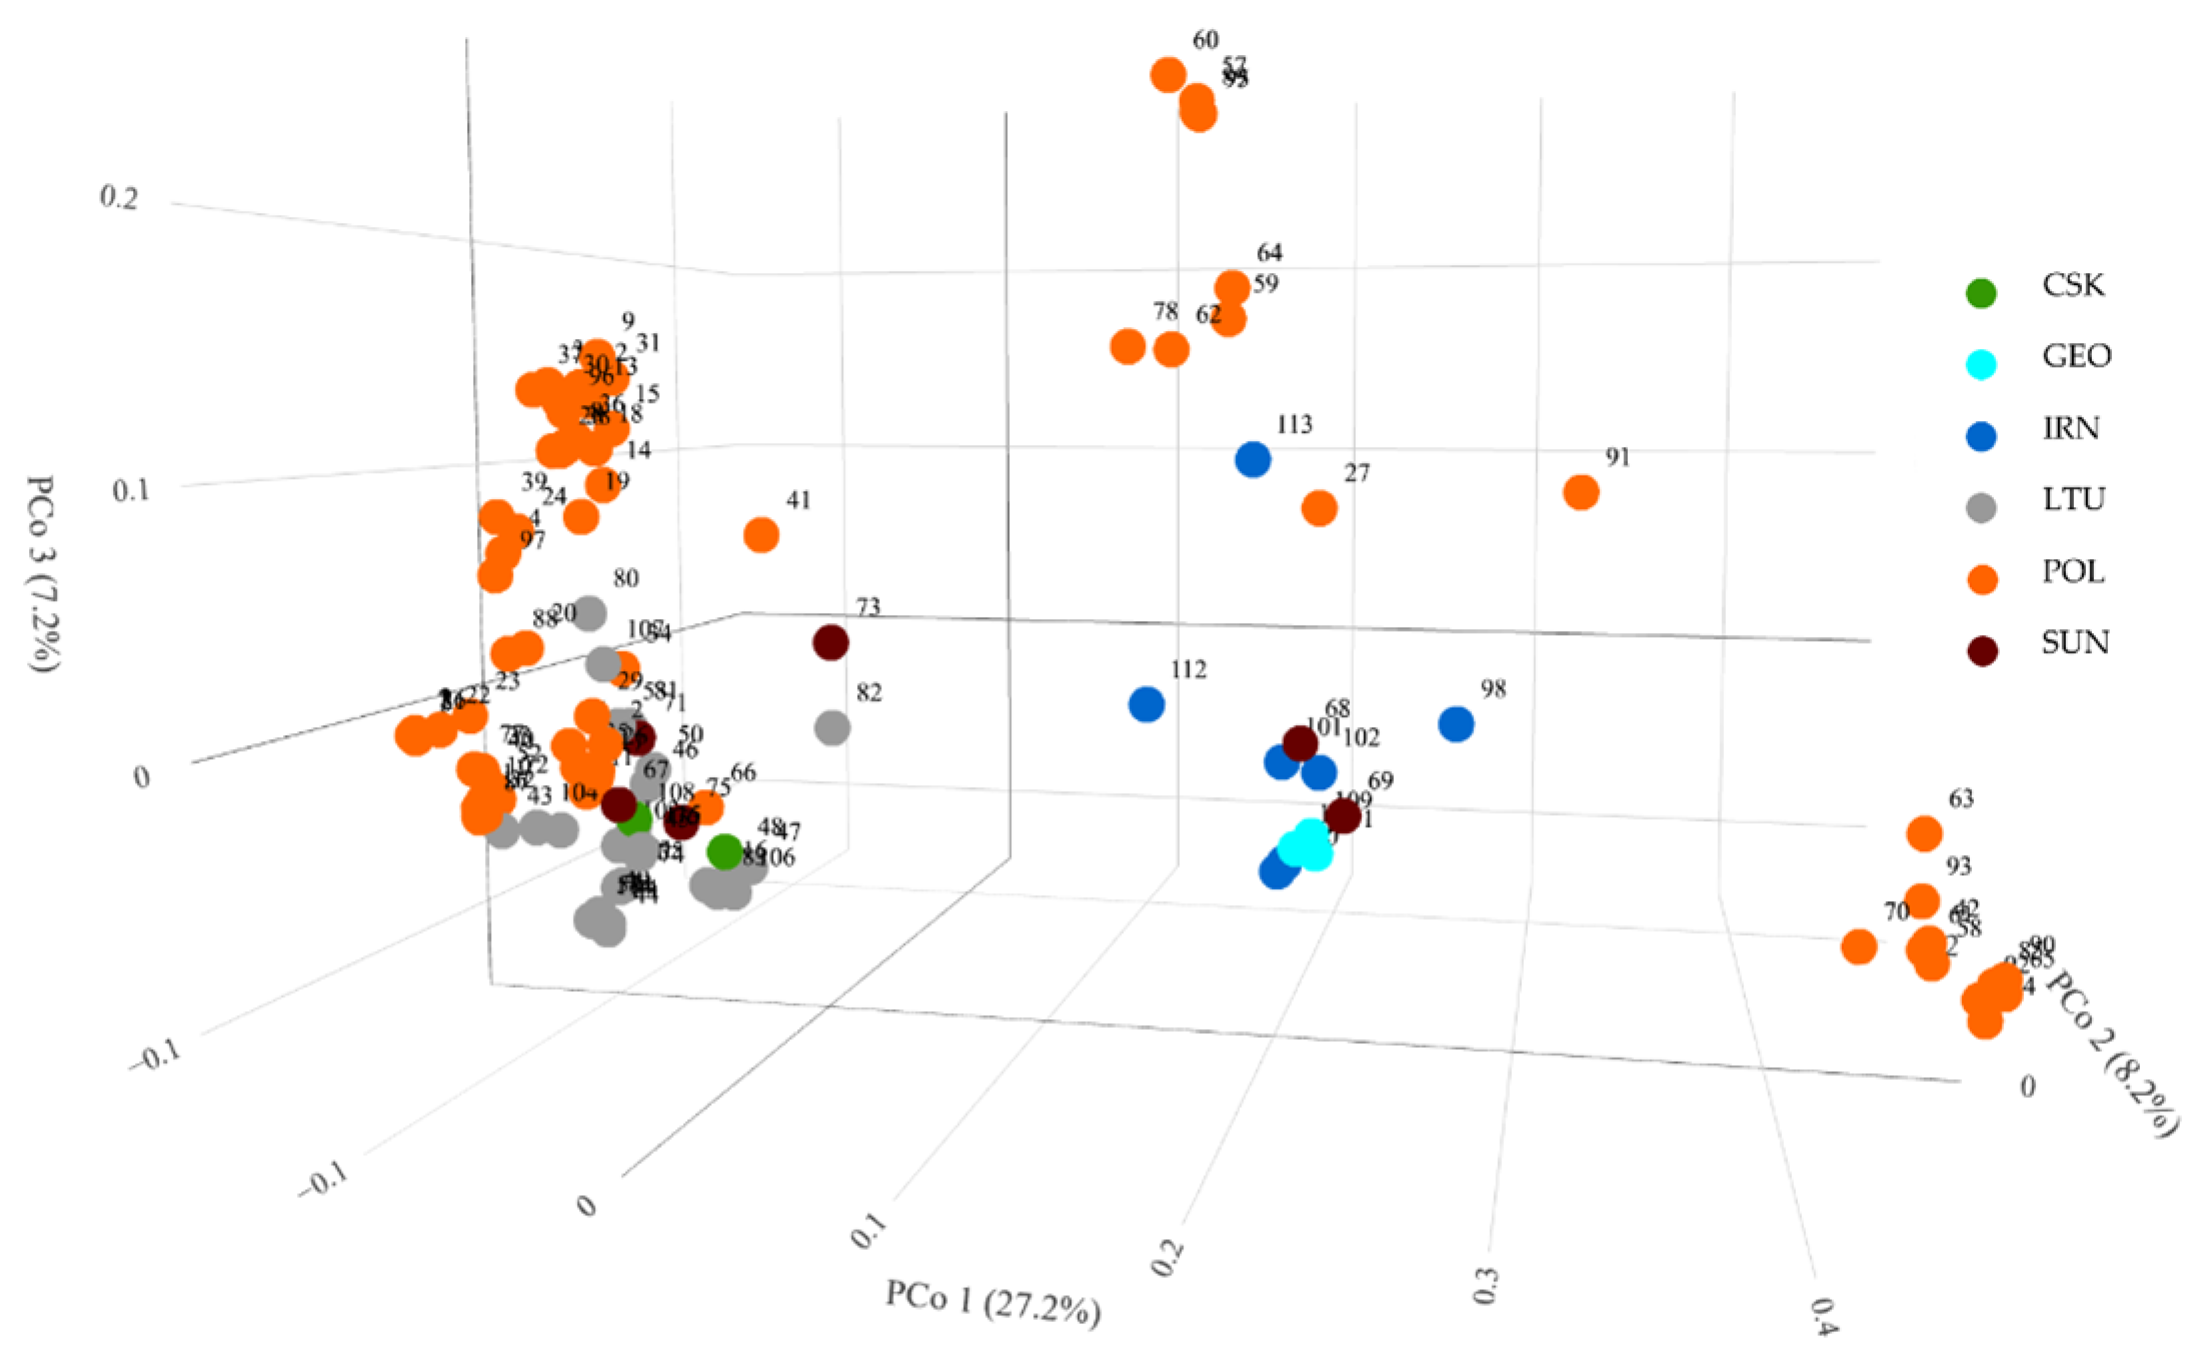
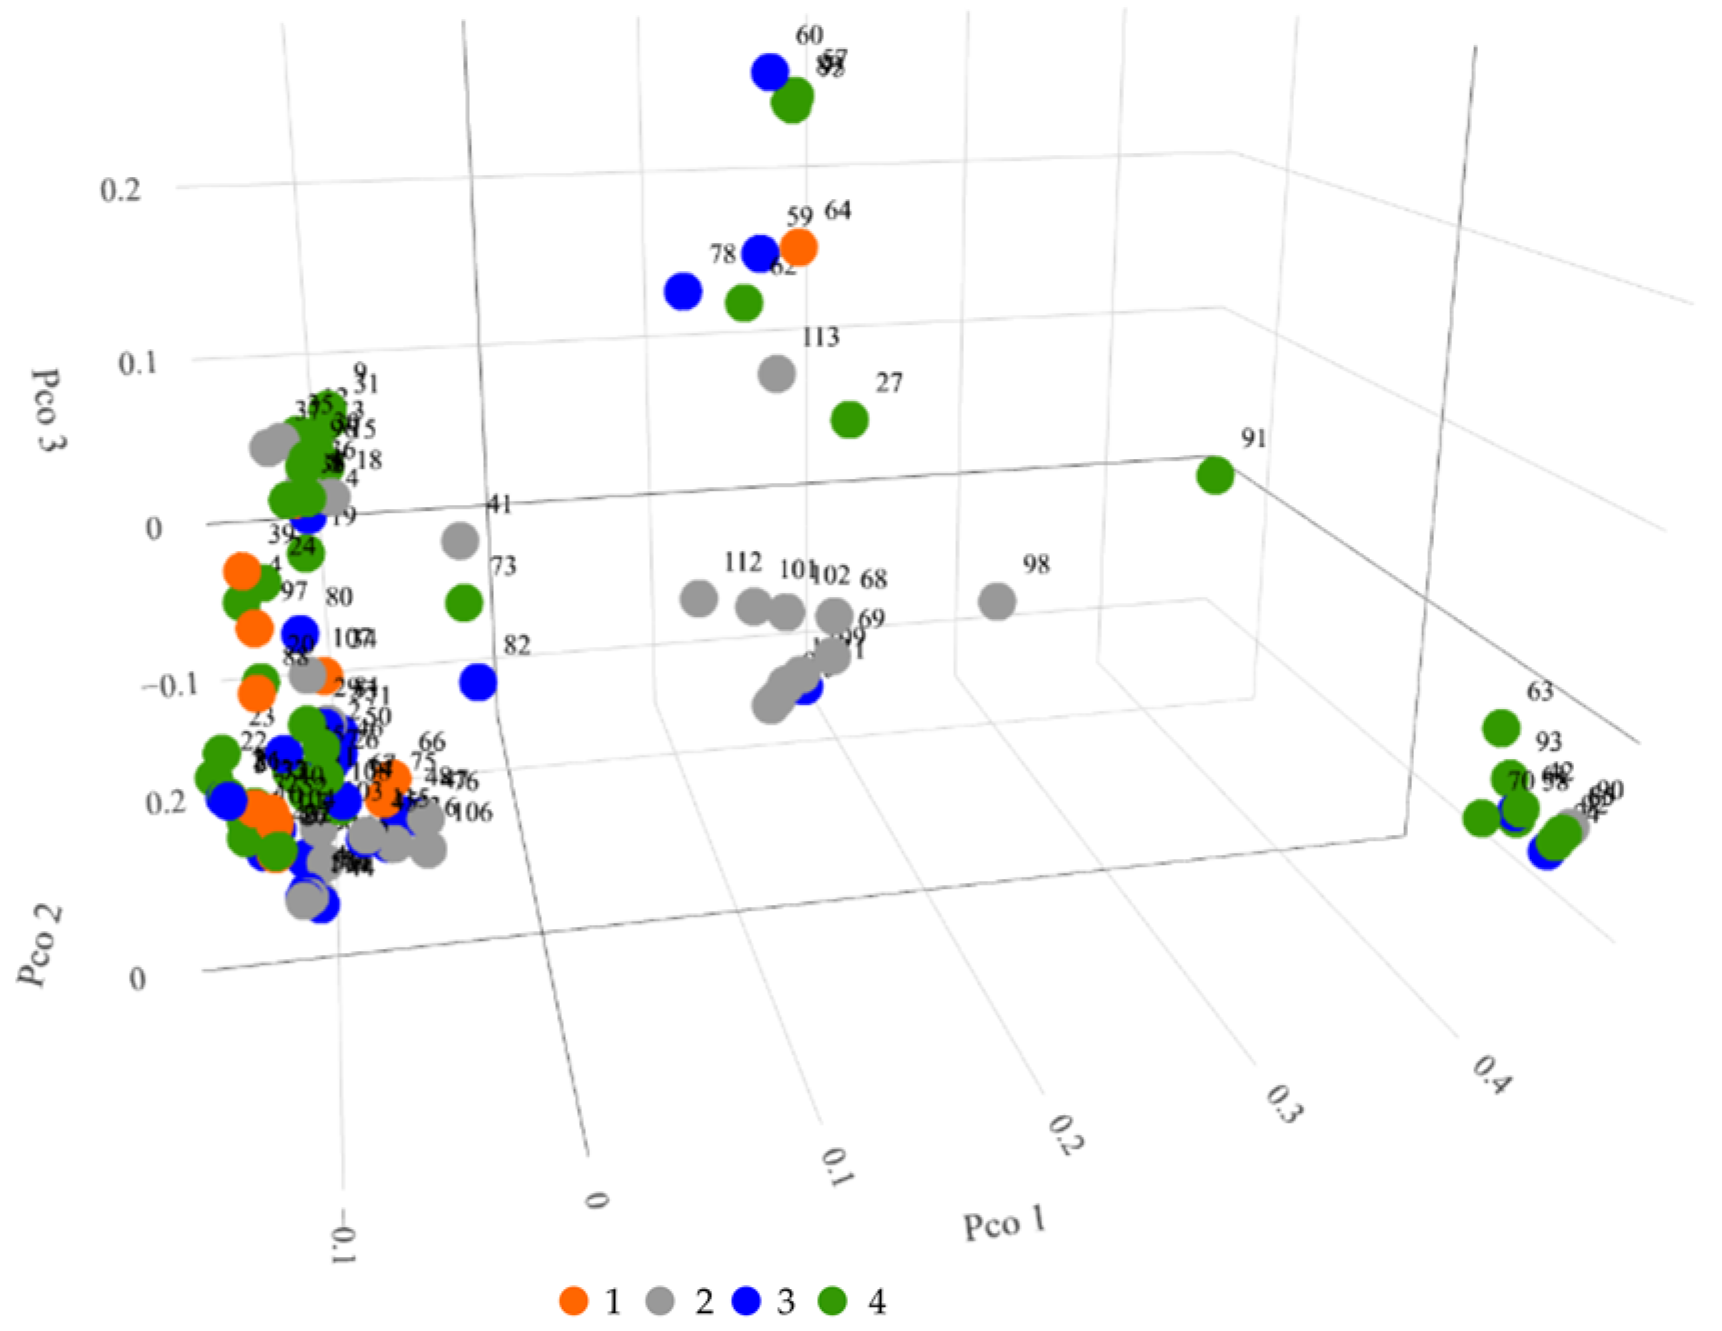
3.2.3. Principal Coordinate Analysis

Principal Coordinate Analysis (PCoA) showed that 42.5% of the variation was explained by the first three axes (27.2%, 8.2%, and 7.2% of the variation, respectively). Graphical presentation of the results in a 3D plot of the first three coordinates divided the studied accessions into three groups (Figure 5). The first and the largest group on the left side of the plot comprised 85 accessions, as a conglomeration of landraces collected in Poland, Lithuania, and former Czechoslovakia. Although the accessions from Poland and Lithuania form this large group, one can see a shift of the Lithuanian accessions in relation to the second and third coordinates. This indicates that gene pools from these neighboring countries are similar, but not identical. Outliers from this group were PL 41633, PL 43357, and PL 503844. The second distinct group, on the right side of the 3D chart, was formed by 11 accessions that originated from Poland. All of them were hulless and accession PL 41867 was an outlier from this group. In the space between these two main groups, a low-density cluster of accessions was found. Its upper part consisted of 6-row landraces collected in Poland, while the lower one was composed of accessions originating from Iran, Georgia, and the former Soviet Union.

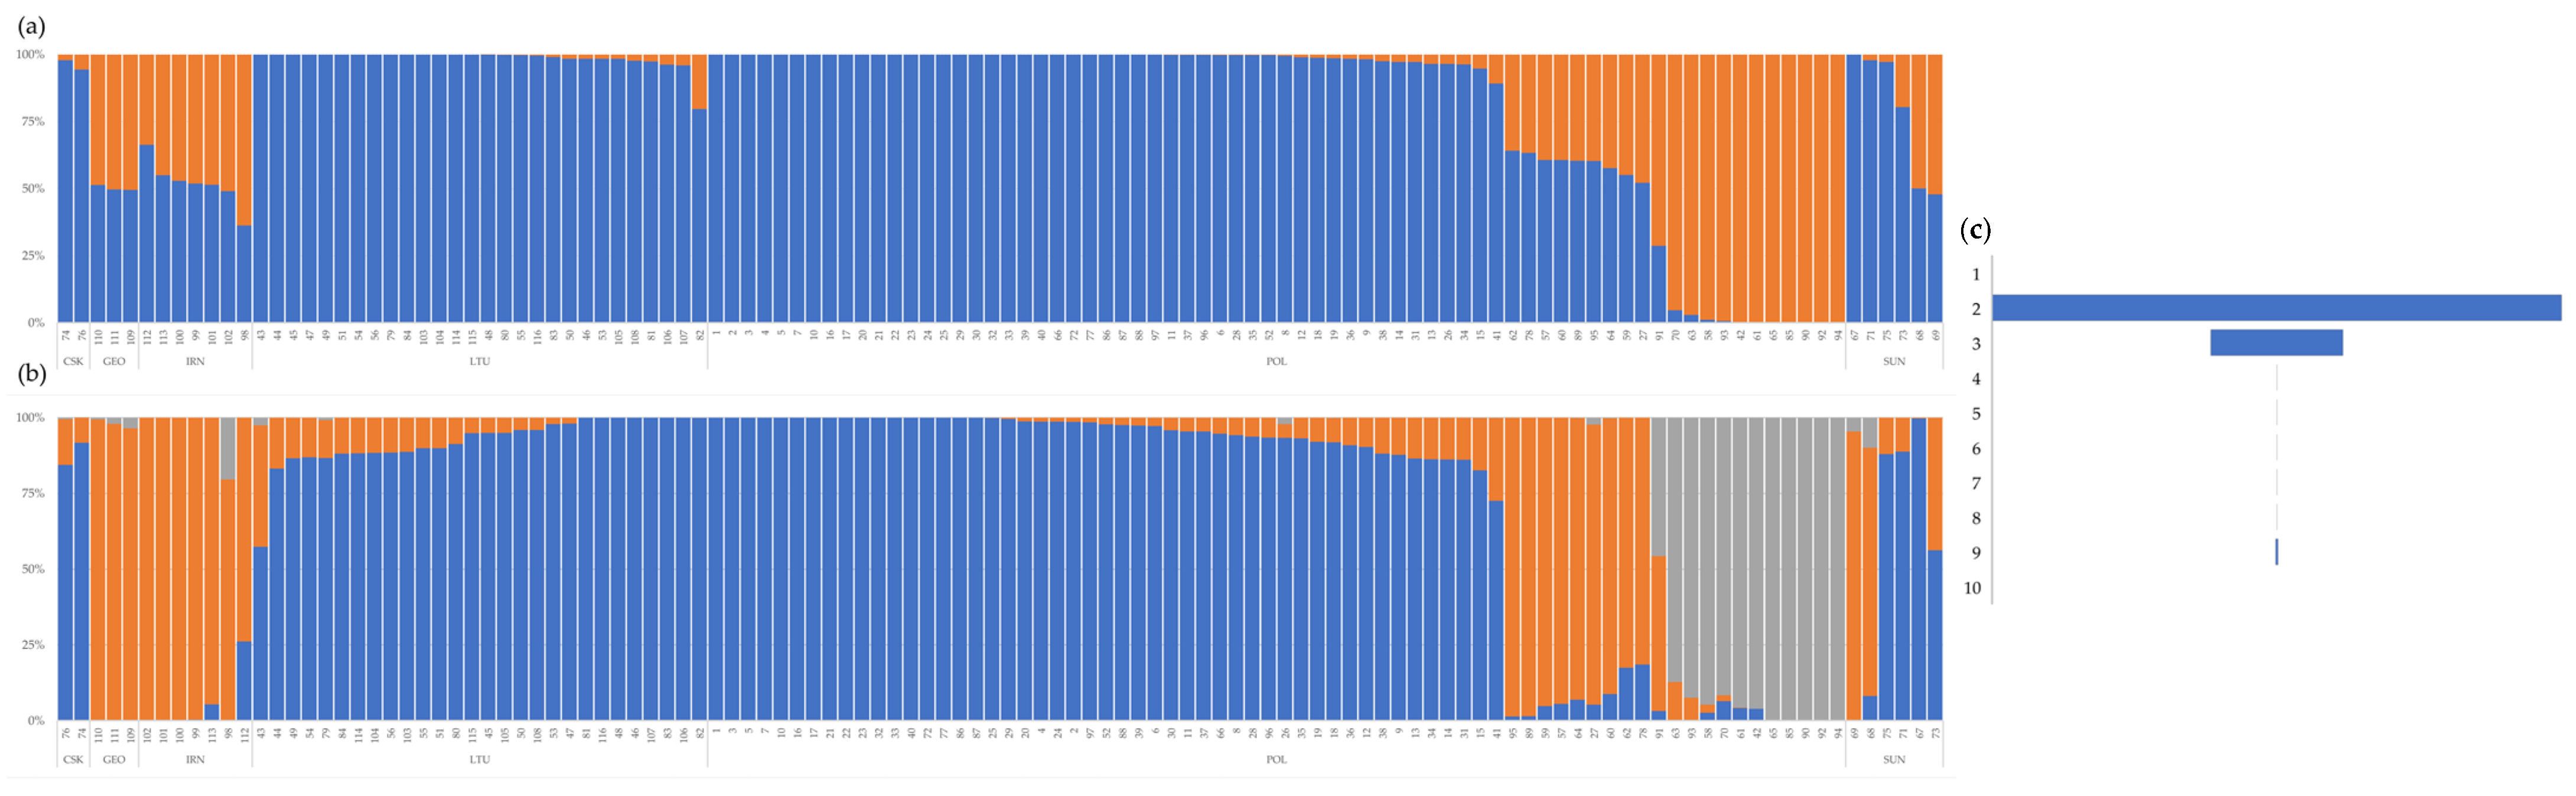
3.2.4. Population Structure
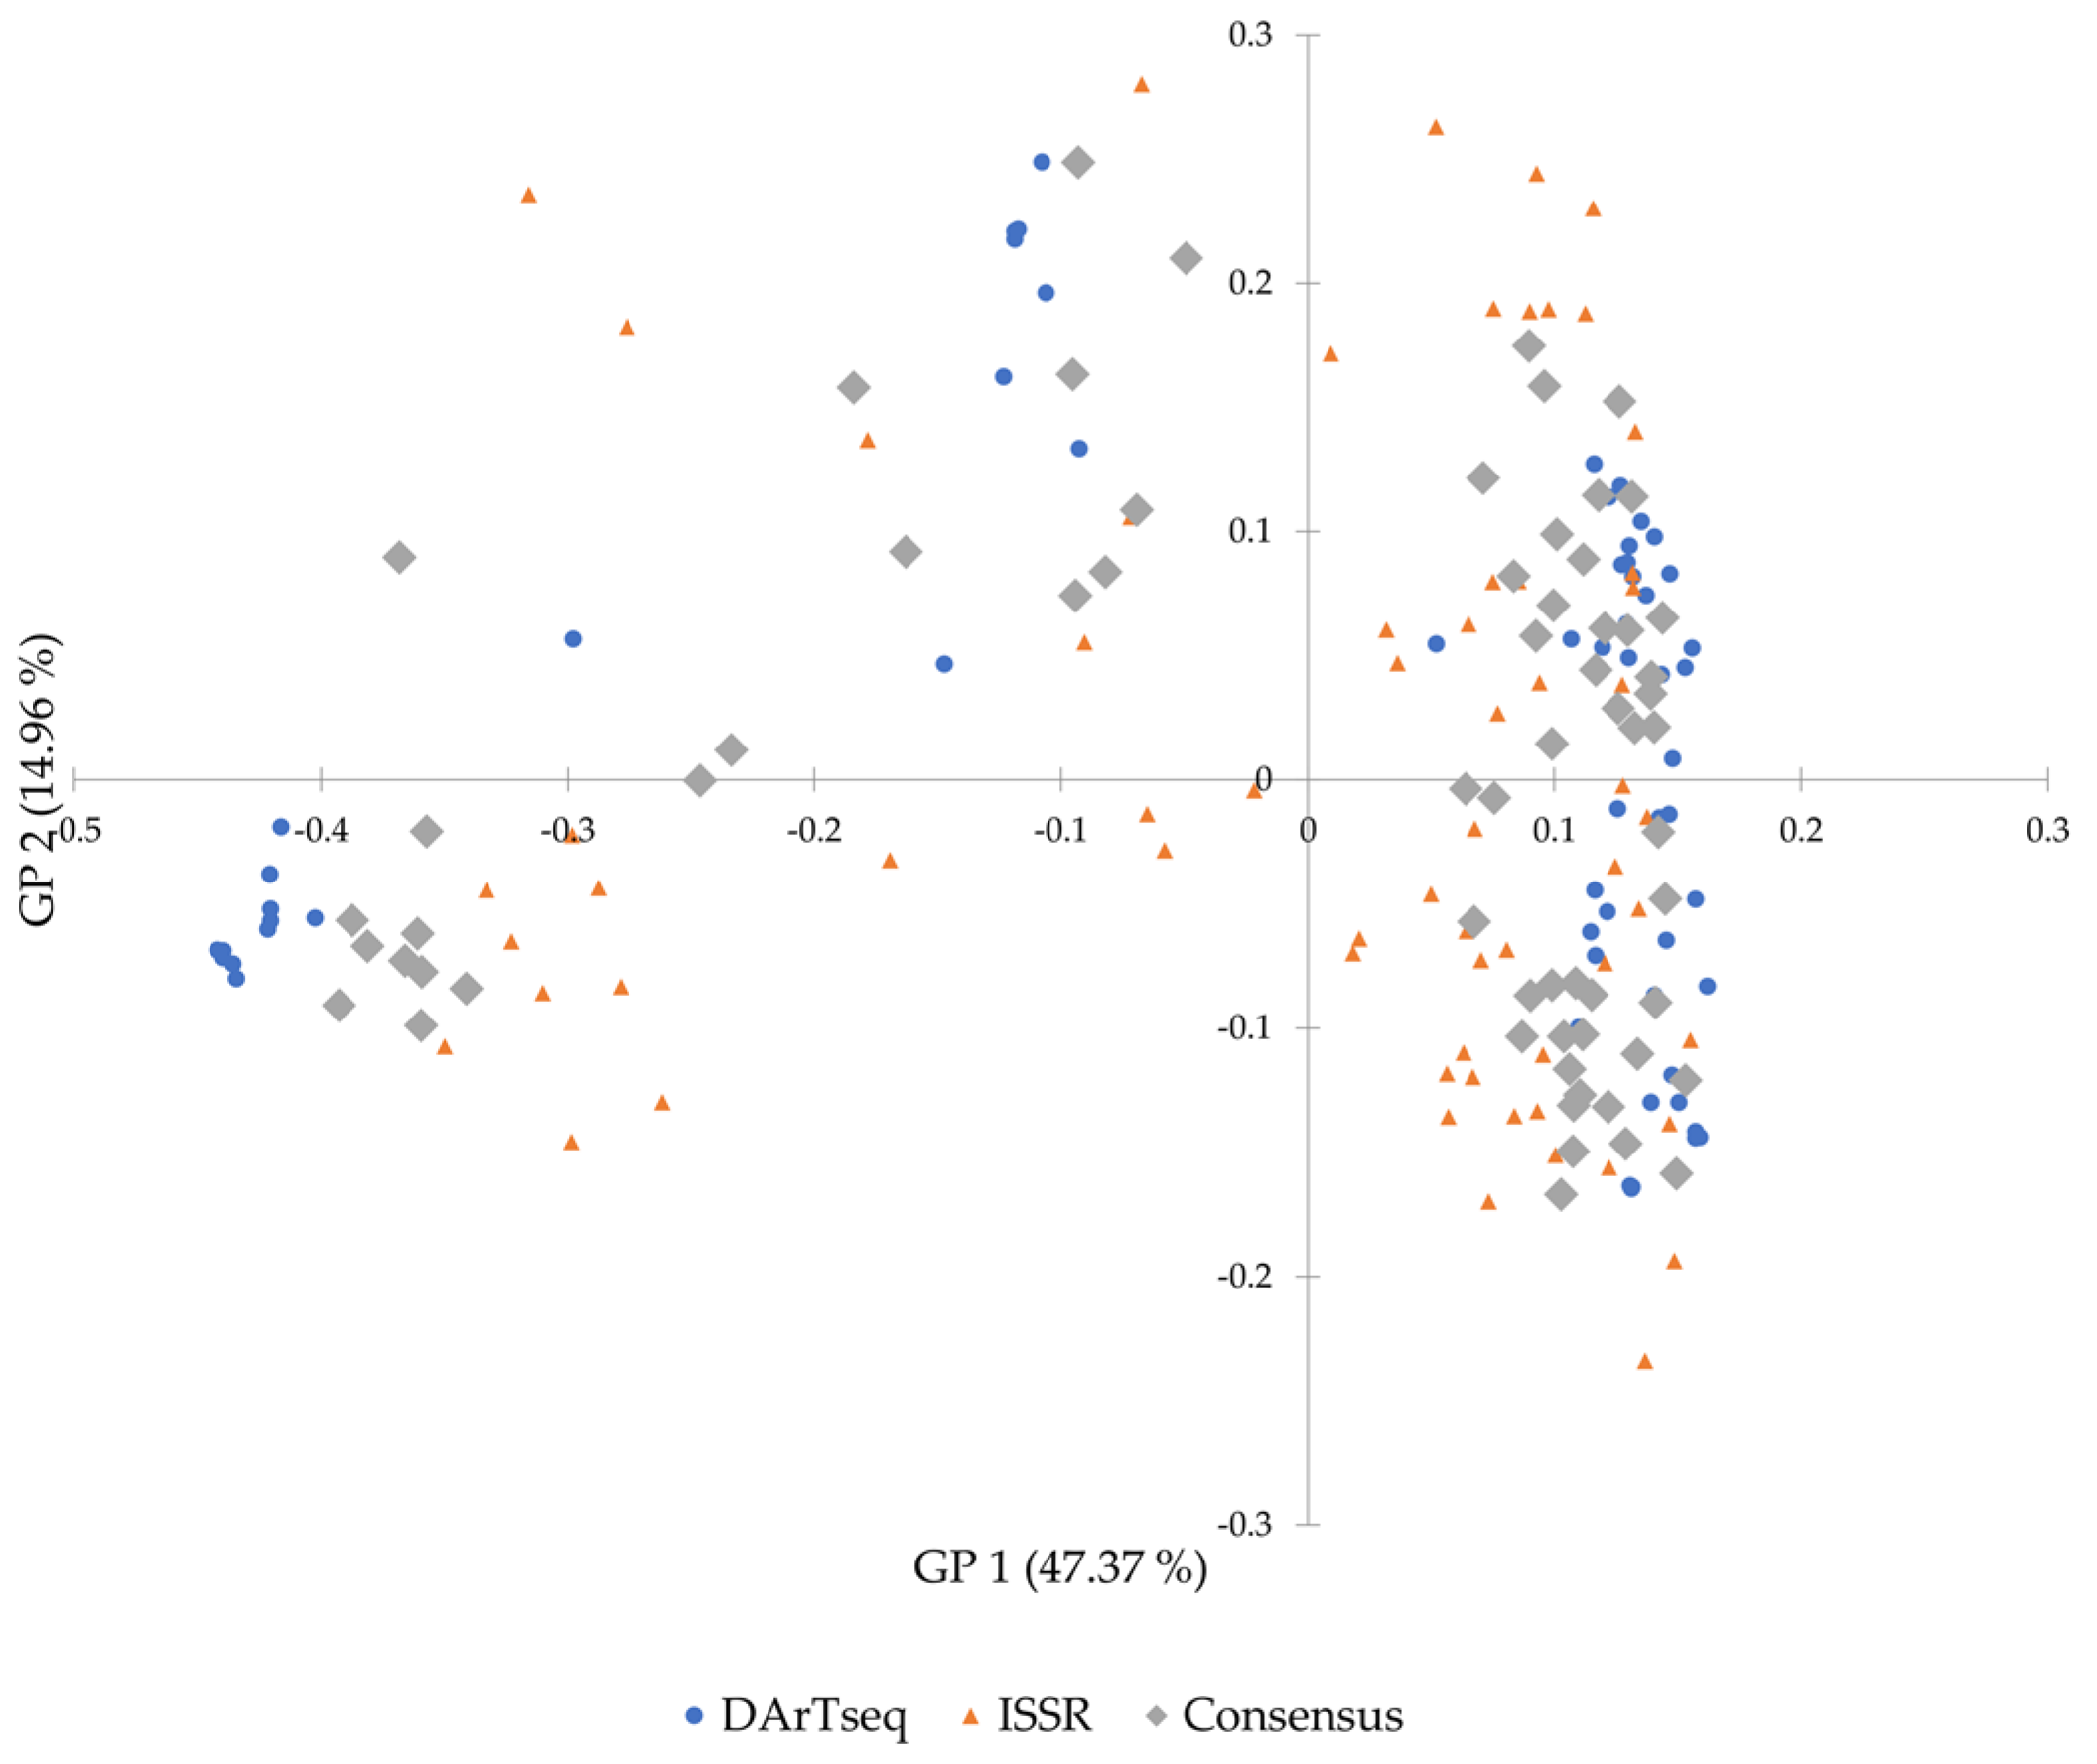
Analysis of molecular variance AMOVA for barley landraces showed that only 15% of genetic variation could be associated with the country of accession origin. Grain coverage had a far greater influence on population structure. Here, 41% of the variability was related to this trait.
The STRUCTURE analysis [53] showed that population structure is evident in the studied spring barley landraces. According to an ad hoc statistic ΔK based on the second-order rate of change of the likelihood function regarding K, it was assumed that in the investigated landraces, a primary structure existed in which two gene pools took part. The presence of a low-order structure was also detected, indicating three gene pools. Individuals were assigned into groups based on an 80% membership threshold. At the primary level, 82 accessions were classified into the first gene pool and 11 accessions were classified into the second one. The remaining 23 accessions displayed a varying admixture. Here, as in previous analyses, a group of hulless accessions was isolated (Figure 6a). Three gene pools were partitioned at the lower level (Figure 6b). The first comprised 80 accessions. Compared to the primary structure, two accessions were mixed (PL 43357 and PL 41633). The second gene pool corresponded fully to the hulless one separated in the primary structure. In contrast, the third gene pool was formed from 19 accessions originally considered as admixed. Six accessions that were not assigned unambiguously to either gene pool in the PCoA analysis were considered as outliers. The results of the population structure and PCoA analysis were consistent.

3.3. Joint Analysis

Combining the results of PCoA analysis and agro-morphological data enabled identifying accessions exhibiting both high levels of resistance to the studied diseases and genetic distinctiveness. Accessions showing high levels of resistance to three out of four tested diseases were in all three groups (Figure 7). Most of them belonged to the largest group, previously described as group one. These accessions originated from Poland and were hulled. On the other hand, accessions originated from Lithuania showed resistance to lodging. Among the group of hulless accessions, nine were highly resistant to the three diseases studied, but none of them was resistant to lodging. The middle group included seven accessions resistant to three diseases and four ones resistant to lodging. Landraces of Iranian origin, although genetically distinct, showed a high level of resistance only to scald.

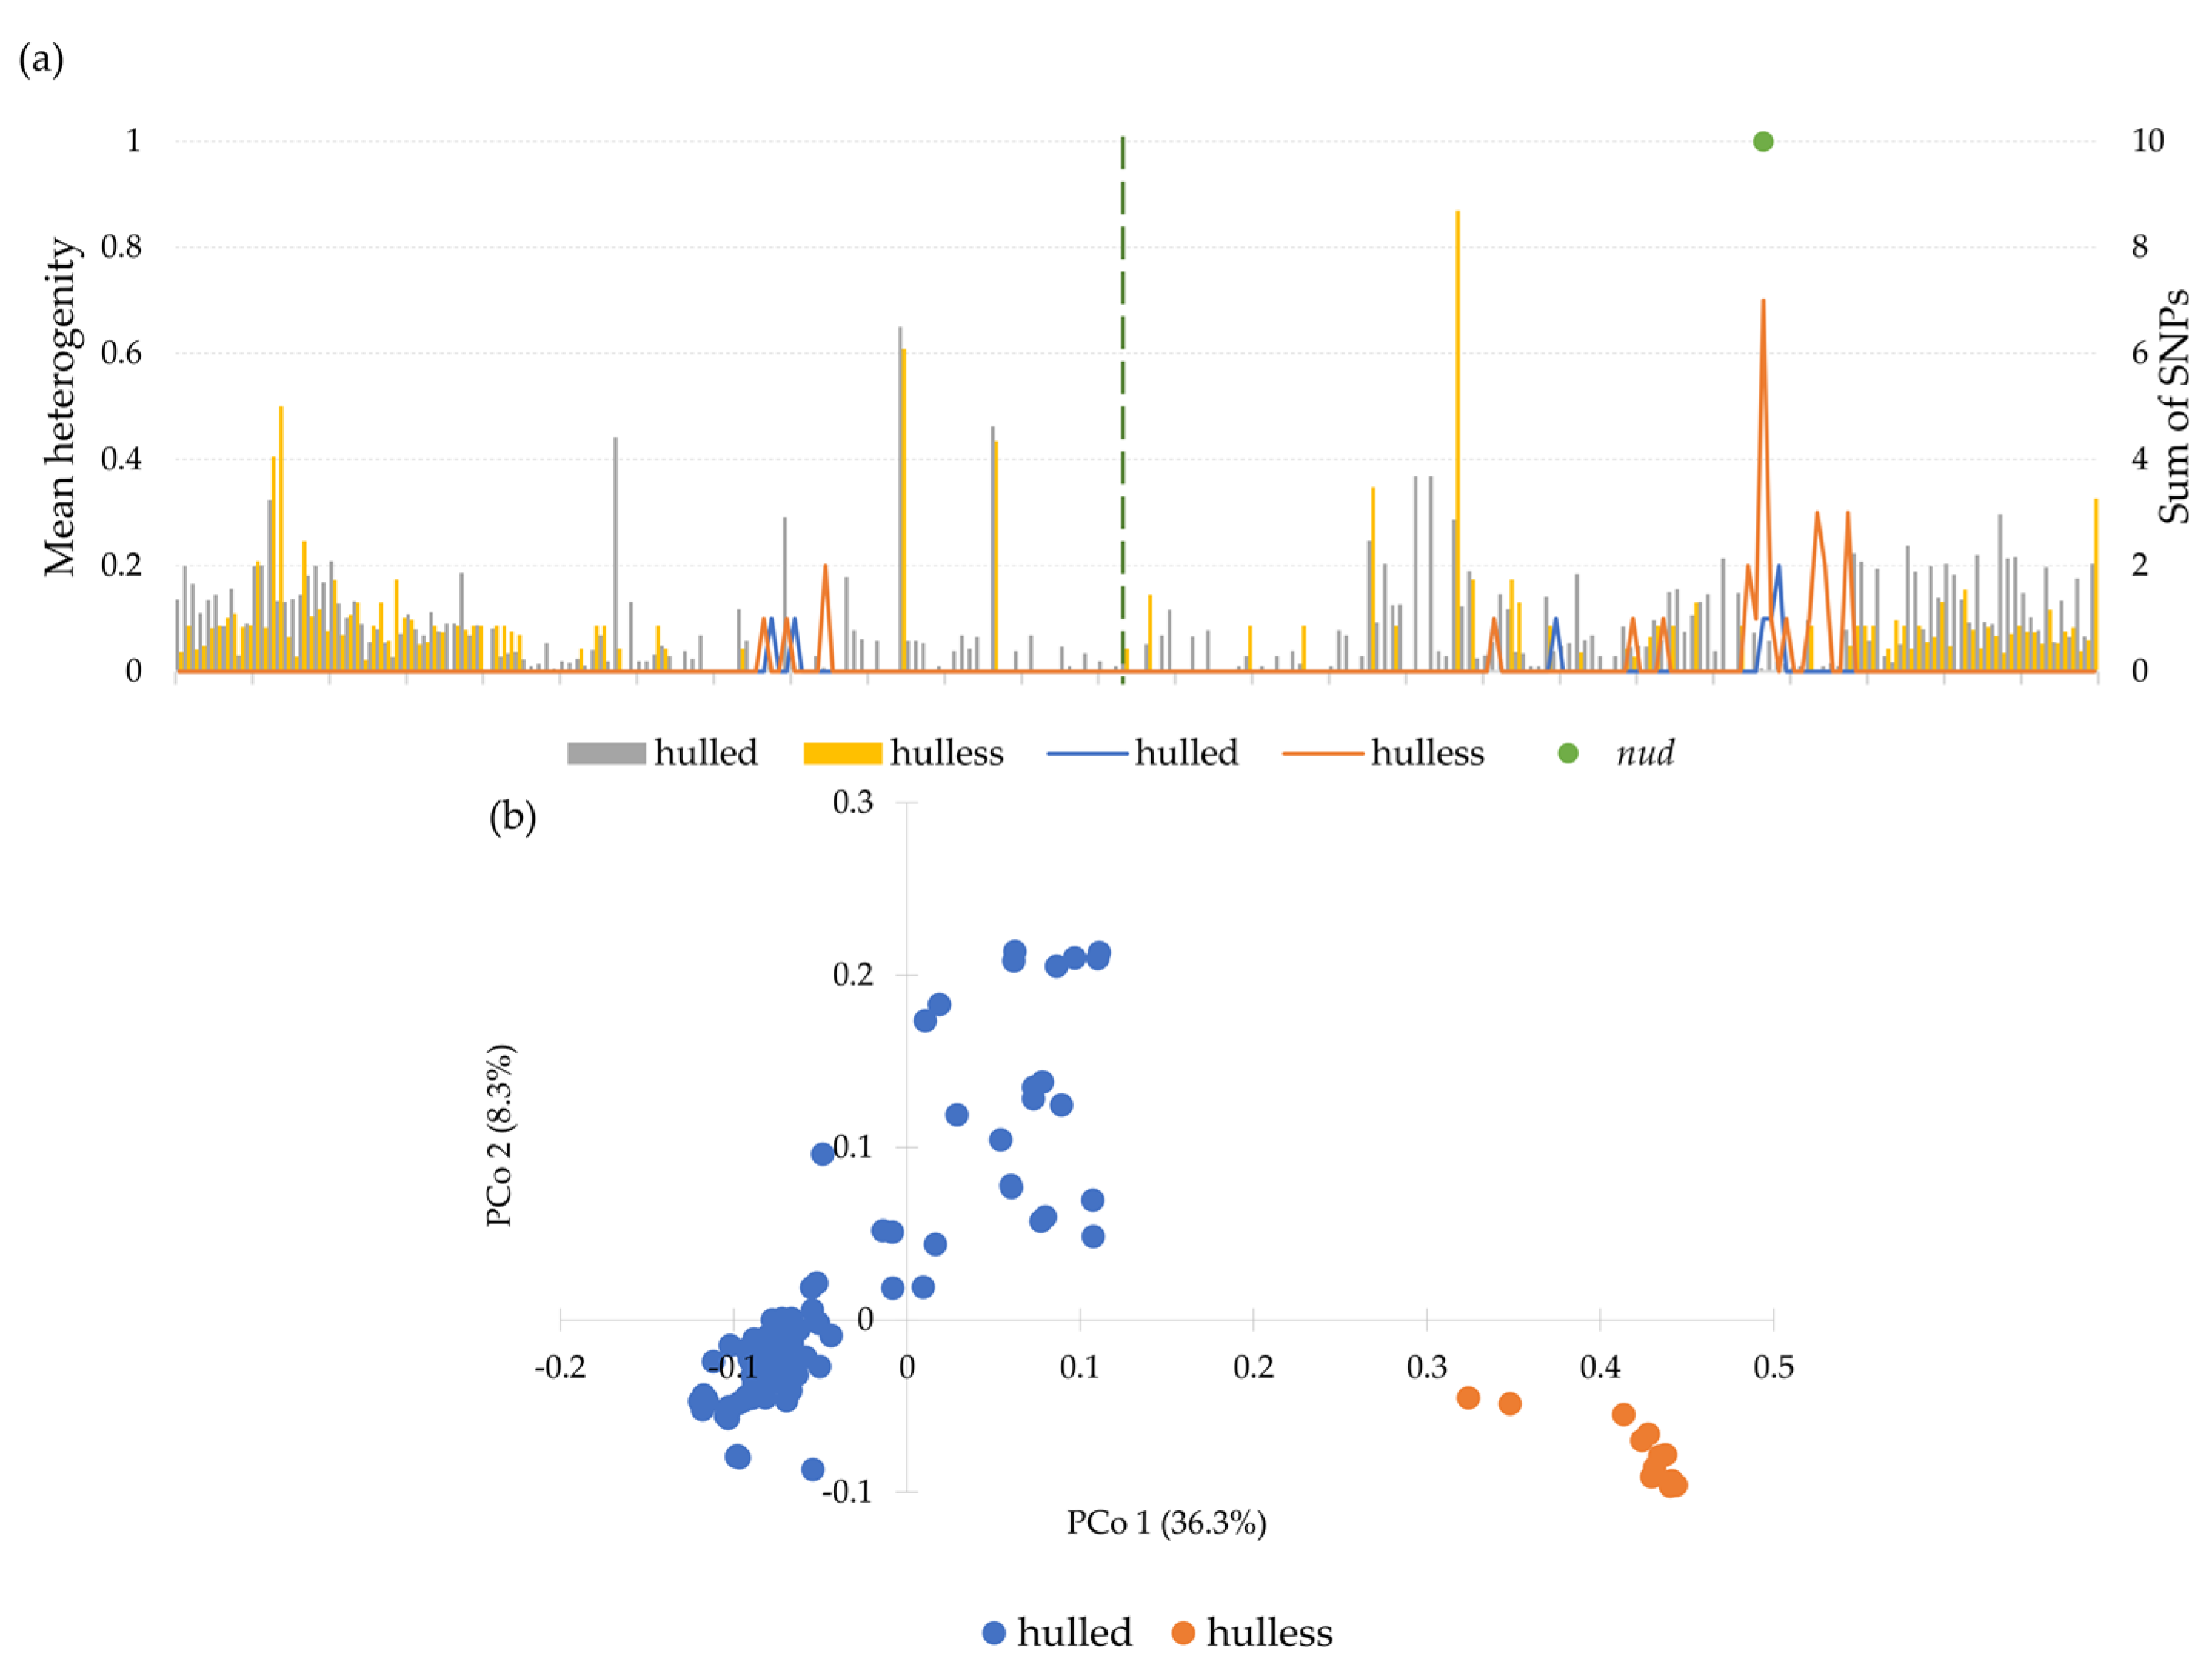
3.4. Diversity of Chromosome 7H

Due to the genetic distinctness of the hulless and hulled forms, diversity analysis was performed within chr 7H on which the nud gene for hullessness is located. None of the analyzed SNPs was located adjacent to the nud gene. However, there was a group of 25 SNPs in its proximity, most of which were unique to hulless forms. At the same time, there was a very low proportion of heterozygous loci in this region, which indicates a significant homogeneity of accessions in this region. PCoA analysis showed that variation occurring within chromosome 7H differentiated accessions into hulled and hulless groups (Figure 8).

3.5. Comparison between DArTseq and ISSR Data

In the previous study, 64 landraces from Poland were used and genetic analysis was performed using ISSR markers [32]. From the results obtained here, a subgroup containing the same accessions was extracted. For obtained dissimilarity matrices, the Mantel test was performed. It showed a moderate uphill correlation between results obtained by ISSR and DArTseq method (0.552, p < 0.0001). Generalized Procrustes Analysis (GPA) was carried out to obtain a consensus configuration of ISSR and DArTseq data. The most effective transformation was scaling and followed by a rotation. Both types of data matched the consensus configuration at a similar level as pointed out by the equal value of residuals by configuration after the transformation. The results of the consensus test indicated the authenticity of the configuration. The first three factors contributed to 74.72% of the original variability. A scatter plot showed that the studied accessions formed three groups (Figure 9). On the left side of the coordinate system, there were all the accessions with hulless grain type. Out of them, three outliers were identified, i.e., PL 42867, PL 41869, and PL 41871.

4. Discussion

The analysis presented here is the initial step towards genome-wide high-density genotyping of the barley collection preserved in the Polish gene bank. The results obtained should complement the passport data, characterization, and evaluation of accessions in the collection. Molecular and especially genome-wide studies provide extremely valuable information that will become increasingly important to gene bank managers. Molecular data enable identification of duplicates in a collection, assessment of loss of genetic integrity, and an informed selection of materials for further study and breeding.
Here, 116 spring barley landraces acquired during expeditions between 1977 and 2013 were evaluated. The value of the coefficient of variation (uHe = 0.232) indicates rather average genetic variability of the collection. Detailed analysis showed that this value is significantly influenced by a substantial proportion of loci with low levels of variation. In earlier studies, using ISSR markers, the diversity of landraces from Poland was assessed [32]. The level of variation detected there was 0.185 and was a little lower than that recorded now (0.226). These differences may be derived from the greater uniformity of SNP distribution in the genome, their greater number, and higher resolution compared to the ISSR technique. However, ISSR markers are considered as a group of highly informative, multi-allelic loci that provide highly discriminating information with good reproducibility and are relatively common [59].
Among the accessions studied here, there was a large variation in observed heterozygosity values ranging from 0.01 to 0.42. In the sample, 51% of all investigated accessions had a heterozygosity level above 0.1. The occurrence of heterozygous loci in the barley collection, which is a self-pollinating species, directly results from the way the analysis was performed. In the study presented here, pooled samples of eight individuals representing the accession were used. Thus, the level of heterozygosity of an accession indicates the heterogeneity of the comprising individuals. The use of pooled samples significantly reduced the cost of analysis, but the heterogeneity assessed in this way is affected by higher error than in the analysis of individuals. Furthermore, the frequency of SNPs in the accession cannot be assessed in this way. Heterogeneity of landraces is consistent both with their definition and with previous results of analyses conducted on a group of individuals representing landraces of self-pollinated cereals [7,60,61]. The obtained results provide an important indication for researchers and breeders that the seed sample obtained from the gene bank will be a mixture of different genotypes. Keeping the accessions in heterogeneous form is advantageous from the point of view of maintaining diversity, but it is a significant obstacle for breeders. Using heterogeneous accessions in breeding programs forces an additional workload associated with the selection of pure lines. Heterozygous loci were identified on all chromosomes. Looking at the entire collection, the proportion of heterozygous loci on individual chromosomes was stable at about 10%.
Detailed analysis of loci distribution, their polymorphism, and heterogeneity showed significant variation at the chromosome level. All chromosomes showed a similar pattern of loci occurrence, i.e., a decrease in their frequency from distal parts towards the centromere. This pattern is consistent with previous results of high-throughput SNP analyses for barley, durum wheat, and soybean [51,62,63]. “Empty” regions adjacent to centromeres were present for certain chromosomes. The lack of analyzed loci in these regions was a consequence of polymorphism absence in the loci occurring there. As a result of data filtering, these loci were removed from the analysis. Similar results were obtained by Mascher et al. [51] who analyzed homozygous inbred elite barley lines. Within spring forms, these authors identified segments completely lacking variation in the centromeric and pericentromeric regions of chromosomes 1H, 2H, and 7H, while in winter lines at 5H. In the spring landraces analyzed here, highly homogeneous regions bilaterally surrounded the centromere on 1H and 4H. On chromosome 5H, such a region was present only on the short arm, whereas on 2H on the long arm but not in the direct vicinity of the centromere. For the remaining chromosomes, the level of variation remained relatively high along their entire length. The different pattern of highly homogenous regions, landraces, and elite lines may reflect the different selection pressures applied to elite materials during the breeding process and landraces during their establishment on farms. Considering that the landraces studied here came from different geographic locations, it can be assumed that the regional reduction in variability in these regions may also be the result of domestication, as has been demonstrated for durum wheat [64]. Moreover, both the level of heterozygosity and unique SNPs frequency on individual chromosomes showed differentiation in groups consistent with the country of origin. A different share of heterozygous loci and unique SNPs on individual chromosomes may result from the adaptation of landraces to specific eco-climatic conditions or from a targeted selection by farmers for a specific trait. It should be kept in mind, however, that the number of accessions analyzed from different countries showed considerable variation. Therefore, the results obtained in this study cannot be generalized to the genetic diversity of landraces occurring in the countries concerned, nor to the size of the native gene pools. The results obtained during this analysis present only the diversity of accessions that were collected by the Polish gene bank. Only the accessions from Poland can be considered representing the full preserved genetic diversity of native landraces. This study is even more valuable because Polish landraces have not previously been subjected to high-throughput genotyping using SNPs. In a study by Milner et al. [43], only eight, and in Bustos-Korts et al. [65] only four landraces from Poland were included. Unique results were also obtained for accessions originating from Lithuania. Accessions from this country were not included in previous studies either [43,65]. Overall, the accessions from Lithuania and Poland had a similar average level of heterogeneity. Based on the results of the PCoA analysis, the gene pools from these countries are similar, but not identical. Eight of the twenty-eight Lithuanian accessions were highly homogeneous. Because expeditions took place relatively recently, in 2011–2013, and the collected grain samples were not critically small, it can be assumed that these accessions may not be landraces, but are cultivars, although not from the group of the most contemporary ones. This is also supported by high genetic similarity of two of them, i.e., PL 503854 and PL 501965. Out of 22 K SNPs examined, these accessions differed only by 130, even though they were collected in different locations.
The group of accessions originating from Iran had the lowest level of heterozygous loci. This may result from collecting too few seeds during the expedition or losing some material during reproduction in the gene bank. Nevertheless, this collection is characterized by high diversity among the accessions. The high number of unique alleles is also significant. Although in the studied set only seven accessions originated from Iran, as many as 775 unique alleles were identified for them, whereas for the collection of 70 accessions of Polish landraces, 598 SNPs were unique, including alleles unique for hulless forms. This indicates that landraces from Iran may contain a significant number of alleles absent in the European gene pool. Accessions from the Middle East also showed genetic distinctness from those originated from Europe and the former Soviet Union in earlier studies [43]. Considering the above results and the data of agro-morphological traits evaluation, it should be assumed that the collection of Iranian landraces stored in the Polish gene bank can be a valuable source of genetic variability. These accessions were characterized by high resistance to scald; there were also accessions highly resistant to lodging among them, which may relate to low plant height. Thus, they make up a reservoir of variability which may be valuable for future breeding.
The accessions originating from Georgia were characterized by a high level of internal heterogeneity and low differentiation between accessions. This may indicate that their gene pools overlap significantly and that they may share a common ancestor. This will also influence the strategy for finding useful traits in collections from these countries. In the case of accessions from Georgia, screening should be conducted on a much larger number of individuals representing the accession than in the case of accessions from Iran, where more emphasis should be placed on the number of accessions analyzed. The results of DArTseq analysis also showed some distinctness of the six-row forms from the two-row ones. However, it was not as significant as in studies of other barley germplasm collections [66,67,68]. In contrast, in our previous study of only Polish landraces using ISSRs, the distinctiveness of these groups was not apparent [32]. Some distinctness of the six-row forms here may be derived from both an increase in the number of accessions studied and a change in the analysis method.
The result that integrates the previous analysis by ISSR and the current one by DArTseq is the distinctness of hulless and hulled accessions [32]. The correlation level of the dissimilarity matrix of both methods was at a moderate level. It was significantly lower compared to previous barley studies using SSRs and SNPs. However, it should be taken into account that ISSRs are dominant markers in contrast to SNPs and SSRs [33,34]. Moreover, in the present and previous analysis, although the same accessions were analyzed, the DNA matrices were not the same, i.e., for ISSR analysis, bulk samples comprising 24 individuals were used, whereas for DArTseq only eight individuals per accession were used. The distinctness of hulless and hulled accessions was also indicated by grain morphometry. The grain of the hulless forms is considerably smaller than hulled ones. It is believed that the domestication of hulless barley followed the hulled type and this was around 6500 BC [69]. The most likely origin of hulless barley is monophyletic. It probably arose from a single mutation of either wild barley (H. vulgare subsp. spontaneum) or domesticated hulled barley [70,71]. The hulless grain is a very stable trait and environmental conditions have little influence on its expression. It is determined by a single recessive gene “nud” on the long arm of chromosome 7H [72]. At this locus, there is a gene encoding a transcription factor of the Ethylene Response Factor (ERF) family belonging to the WIN1/SHN1 (Wax Inducer 1/Shine 1) transcription factor group [73]. The hulless grain trait is associated with either a 17kb deletion or amino acid conversion of T643A at the NUD locus [74]. Compared to hulled barley, hulless barley is rich in nutrients such as limiting amino acids (lysine, methionine, threonine, and tryptophan), starch, fiber, and β-glucan [75]. The grain of hulless barley is not only cholesterol-free but also has cholesterol-lowering properties due to its high β-glucan content. In addition, barley fiber is a source of niacin (vitamin B), which decreases platelet aggregation, total cholesterol, lipoproteins, and free radicals [76,77]. It is also a valuable source of thiamine, selenium, iron, magnesium, zinc, phosphorus, and copper. Depending on the genotype, the content of mineral nutrients ranges from 2 to 3% [78]. All these properties make hulless barley a part of a healthy diet. All except one of the hulless accessions analyzed here originated from Poland. They are therefore adapted to central European climatic conditions and were characterized by high resistance to net blotch, scald, and steam rust. Therefore, they have the potential to be used in pro-quality breeding. Moreover, naked barley appears as one of the future and climate-smart crops due to its hardiness, ability to grow under low input conditions, and potential for use in climate change adaptation [79]. However, due to accessions heterogeneity, prior selection of pure lines and their evaluation for agronomic traits, yield, and nutrient content will be necessary. By mapping the DArTseq results to the barley reference genome, it was possible to identify the exact chromosomal locations of the loci analyzed. Detailed analysis of chromosome 7H showed that in the region of the nud gene, there were multiple SNPs unique to the hulless form and the heterogeneity in this chromosome fragment was significantly reduced. This is consistent with previous findings that indicated both low variability and extensive linkage disequilibrium in the vicinity of the nud gene [70,80]. No pleiotropic effect of the nud gene was found on agronomic traits such as grain yield and weight, plant height, or heading date [81,82]. In this region, Wang et al. [83] localized a QTL hotspot region underlying traits related to grain size and weight. In addition, numerous previous works indicate the presence of QTLs of grain yield and thousand-grain weight in this region [81,84,85]. Thus, the identified SNPs may also be associated with grain weight and size which may be useful in breeding high-yielding cultivars of hulless barley. Currently, the yield of hulless barley is much lower than that of hulled barley, which is mainly due to the adhering husk on hulled barley, which accounts for about 10–13% of the weight and volume of harvested barley grain [86]. Intensification of breeding work to improve the yield of hulless-grain barley to that of hulled barley, therefore, seems reasonable. The Cas9 RNA-guided endonuclease used to knockout the nud gene in hulled cultivars seems to be an interesting tool in this context [82].
Another important aspect is the color of barley grain. The mature barley grain could have different seed coat colors including but not limited to yellow, blue, purple, and black [87]. The color of the seed coat is related to flavonoids and specifically to the synthesis of anthocyanins. It is believed that proanthocyanidins synthesized in the testa are responsible for the yellow color, and purple pigmentation is due to the synthesis of anthocyanins in the pericarp and glumes [88,89,90]. Four loci of purple seed coat color (Psc) were located on chromosome 7H [91]. One of them is in a region where an accumulation of SNPs unique to hulless forms was identified. Its sequence is 95% homologous to Arabidopsis F3′M (AK366933.1), which belongs to the cytochrome P450 family and is associated with flavonoid biosynthesis [92]. In crop plants, seed coat color is an important agronomic trait because of its association with unique biological activity and, hence, function in health care [93]. The continuously growing market of functional food may be a trigger for the development of breeding colored barley cultivars containing high levels of natural antioxidants such as phenolic compounds, anthocyanins, and essential amino acids [94]. Using barley flour, which itself has antioxidant properties, in the production of bread, pasta, or confectionery products, is becoming increasingly popular. Thus, the use of colored grains for flour, groats, or whole-grain flakes as a trendy health food will become feasible as soon as more cultivars with colored grains are available in the market. In the collection studied, there were both accessions with very light and almost black grain color. The presence of accessions with dark grain may be the beginning of targeted breeding programs. A detailed further analysis of barley collections in the Polish gene bank will probably provide a larger number of accessions with colored grains, including probably also old varieties and breeding materials. Integrating seed morphometric analysis, genome-wide genotyping, and agronomic traits evaluation supplemented with a selection of pure lines as a part of core activities of the gene bank may significantly contribute to the development of pro-quality barley breeding. Parallel educational and information campaigns will contribute to the production and consumption of healthier food and the reduction of civilization diseases in society.

5. Conclusions

The landraces collection in the Polish gene bank displays both genetic and morphological diversity. Worth noting is the fact of varying levels of genetic diversity depending on both the chromosome and the accession country of origin. The gene pools of Polish and Lithuanian landraces show considerable similarity but are not identical. Accessions originating from Iran are characterized by significant genetic distinctiveness from most of the collection and contain many unique loci. The preserved accessions have a variable level of internal heterogeneity. DArTseq analysis confirmed the genetic distinctiveness of hulless forms indicated by ISSR markers in the previous study. It also enabled the identification of unique SNPs located on chromosome 7H within the region carrying the nud gene that determines the hulled/hulless caryopsis phenotype. These SNPs may also be important in the selection for traits related to grain weight and size because their QTLs were found there. To improve landraces use in breeding, it is necessary to create special collections for commercial use containing pure lines representing accessions and to provide them with the most comprehensive characterization possible. Such actions are necessary to inject new variability into modern breeding, which must cope with both global warming and increasing consumer expectations for quality and pro-health traits.

Supplementary Materials

The following are available online at https://www.mdpi.com/article/10.3390/agronomy11112330/s1: Table S1: The list of accessions used in the study with eco-geographic description of collection sites; Figure S1: Summary of the number of loci from the raw data and the number of loci that remained after filtering; Figure S2: The distribution of polymorphic information content (PIC) at the loci studied; Figure S3: 3D plot of results of Principal Coordinate Analysis (PCoA) for 116 spring barley landraces with indication of the country of origin. The accession numbers according to Table S1; Figure S4: 3D plot of results of Principal Coordinate Analysis (PCoA) for 116 spring barley landraces with indication of ear type. The accession numbers according to Table S1; Figure S5: 3D plot of results of Principal Coordinate Analysis (PCoA) for 116 spring barley landraces with indication of grain type. The accession numbers according to Table S1; Figure S6: 3D plot of results of Principal Coordinate Analysis (PCoA) for 116 spring barley landraces with indication disease resistance. The accession numbers according to Table S1.

Author Contributions

Conceptualization, M.B.; methodology, M.B.; formal analysis, M.B.; investigation, J.D., J.G. and G.G.; resources, W.P.; data curation, J.D. and M.B.; writing—original draft preparation, J.D.; writing—review and editing, M.B.; visualization, J.D. and M.B.; supervision, M.B.; project administration, W.P. and M.B.; funding acquisition, W.P. All authors have read and agreed to the published version of the manuscript.

Funding

This work was supported by the Multi-annual program: 2015–2020 “Establishment of a scientific basis for biological progress and preservation of plant genetic resources as a source of innovation to support sustainable agriculture and food security of the country” coordinated by Plant Breeding and Acclimatization Institute (IHAR) National Research Institute and financed by the Ministry of Agriculture and Rural Development of Poland. The calculations were performed at the Interdisciplinary Centre for Mathematical and Computational Modelling, University of Warsaw (ICM UW) within the framework of Computational Grant No. G72–19.

Institutional Review Board Statement

Not applicable.

Informed Consent Statement

Not applicable.

Data Availability Statement

The row data of DArTseq SNP used in this study are openly available on the platform Center for Open Science at https://osf.io/mh4tn/ (accessed on 23 October 2021). (doi 10.17605/OSF.IO/MH4TN).

Acknowledgments

The authors would like to express their gratitude to Boguslaw Lapinski for his constructive comments on the manuscript.

Conflicts of Interest

The authors declare no conflict of interest. The funders had no role in the design of the study; in the collection, analyses, or interpretation of data; in the writing of the manuscript, or in the decision to publish the results.

References

  1. Veteläinen, M.; Negri, V.; Maxted, N. European Landraces: On-Farm Conservation, Management and Use; Bioversity International: Rome, Italy, 2009; pp. 1–22. [Google Scholar]
  2. Marone, D.; Russo, M.A.; Mores, A.; Ficco, D.; Laidò, G.; Mastrangelo, A.M.; Borrelli, G.M. Importance of Landraces in Cereal Breeding for Stress Tolerance. Plants 2021, 10, 1267. [Google Scholar] [CrossRef] [PubMed]
  3. FAO. Voluntary Guidelines for the Conservation and Sustainable Use of Farmers’ Varieties/Landraces; FAO: Rome, Italy, 2017. [Google Scholar]
  4. Maxted, N.; Dulloo, M.E.; Ford-Lloyd, B.V. Enhancing Crop Genepool Use: Capturing Wild Relative and Landrace Diversity for Crop Improvement; CABI: Boston, MA, USA, 2016. [Google Scholar]
  5. Doebley, J.F.; Gaut, B.S.; Smith, B.D. The molecular genetics of crop domestication. Cell 2006, 127, 1309–1321. [Google Scholar] [CrossRef] [PubMed] [Green Version]
  6. Kilian, B.; Özkan, H.; Kohl, J.; von Haeseler, A.; Barale, F.; Deusch, O.; Brandolini, A.; Yucel, C.; Martin, W.; Salamini, F. Haplotype structure at seven barley genes: Relevance to gene pool bottlenecks, phylogeny of ear type and site of barley domestication. Mol. Genet. Genom. 2006, 276, 230–241. [Google Scholar] [CrossRef] [PubMed] [Green Version]
  7. Boczkowska, M.; Łapiński, B.; Kordulasińska, I.; Dostatny, D.F.; Czembor, J.H. Promoting the use of common oat genetic resources through diversity analysis and core collection construction. PLoS ONE 2016, 11, e0167855. [Google Scholar]
  8. Ellis, R.P.; Forster, B.P.; Robinson, D.; Handley, L.; Gordon, D.C.; Russell, J.R.; Powell, W. Wild barley: A source of genes for crop improvement in the 21st century? J. Exp. Bot. 2000, 51, 9–17. [Google Scholar] [CrossRef]
  9. Sharma, S.; Upadhyaya, H.D.; Varshney, R.K.; Gowda, C. Pre-breeding for diversification of primary gene pool and genetic enhancement of grain legumes. Front. Plant Sci. 2013, 4, 309. [Google Scholar] [CrossRef] [Green Version]
  10. Kumar, A.; Verma, R.P.S.; Singh, A.; Sharma, H.K.; Devi, G. Barley landraces: Ecological heritage for edaphic stress adaptations and sustainable production. Environ. Sustain. Indic. 2020, 6, 100035. [Google Scholar] [CrossRef]
  11. Pasam, R.K.; Sharma, R.; Walther, A.; Özkan, H.; Graner, A.; Kilian, B. Genetic diversity and population structure in a legacy collection of spring barley landraces adapted to a wide range of climates. PLoS ONE 2014, 9, e116164. [Google Scholar] [CrossRef] [Green Version]
  12. Ceccarelli, S. Positive interpretation of genotype by environment interactions in relation to sustainability and biodiversity. In Plant Adaptation and Crop Improvement; IRRI: Manila, Philippines, 1996; pp. 467–486. [Google Scholar]
  13. Grausgruber, H.; Bointner, H.; Tumpold, R.; Ruckenbauer, P.; Fischbeck, G. Genetic improvement of agronomic and qualitative traits of spring barley. Plant Breed. 2002, 121, 411–416. [Google Scholar] [CrossRef]
  14. Rasmusson, D.; Phillips, R. Plant breeding progress and genetic diversity from de novo variation and elevated epistasis. Crop Sci. 1997, 37, 303–310. [Google Scholar] [CrossRef]
  15. Okada, Y.; Kanatani, R.; Arai, S.; Ito, K. Interaction between barley yellow mosaic disease-resistance genes rym1 and rym5, in the response to BaYMV strains. Breed. Sci. 2004, 54, 319–325. [Google Scholar] [CrossRef] [Green Version]
  16. Steffenson, B.J. Analysis of durable resistance to stem rust in barley. Euphytica 1992, 63, 153–167. [Google Scholar] [CrossRef]
  17. Bregitzer, P.; Mornhinweg, D.; Hammon, R.; Stack, M.; Baltensperger, D.; Hein, G.; O’neill, M.; Whitmore, J.; Fiedler, D. Registration of ‘Burton’ barley. Crop Sci. 2005, 45, 1166–1168. [Google Scholar] [CrossRef]
  18. Burnett, P.; Comeau, A.; Qualset, C. Host plant tolerance or resistance for control of barley yellow dwarf. In Barley Yellow Dwarf: 40 Years of Progress; D’Arcy, C.J., Burnett, P.A., Eds.; APS Press: Saint Paul, MN, USA, 1995; pp. 321–343. [Google Scholar]
  19. Piffanelli, P.; Ramsay, L.; Waugh, R.; Benabdelmouna, A.; D’Hont, A.; Hollricher, K.; Jørgensen, J.H.; Schulze-Lefert, P.; Panstruga, R. A barley cultivation-associated polymorphism conveys resistance to powdery mildew. Nature 2004, 430, 887–891. [Google Scholar] [CrossRef] [Green Version]
  20. Dawson, I.K.; Russell, J.; Powell, W.; Steffenson, B.; Thomas, W.T.; Waugh, R. Barley: A translational model for adaptation to climate change. New Phytol. 2015, 206, 913–931. [Google Scholar] [CrossRef] [PubMed]
  21. Pietrusińska, A.; Żurek, M.; Piechota, U.; Słowacki, P.; Smolińska, K. Searching for diseases resistance sources in old cultivars, landraces and wild relatives of cereals. A review. Agron. Sci. 2018, 73, 45–60. [Google Scholar] [CrossRef]
  22. Hernandez, J.; Meints, B.; Hayes, P. Introgression breeding in barley: Perspectives and case studies. Front. Plant Sci. 2020, 11, 761. [Google Scholar] [CrossRef]
  23. Jaradat, A.; Shahid, M. Population and multilocus isozyme structures in a barley landrace. Plant Genet. Resour. 2006, 4, 108–116. [Google Scholar] [CrossRef] [Green Version]
  24. Bjørnstad, A.; Demissie, A.; Kilian, A.; Kleinhofs, A. The distinctness and diversity of Ethiopian barleys. Theor. Appl. Genet. 1997, 94, 514. [Google Scholar] [CrossRef]
  25. Demissie, A.; Bjørnstad, Å.; Kleinhofs, A. Restriction Fragment Length Polymorphisms in Landrace Barleys from Ethiopia in Relation to Geographic, Altitude, and Agro-Ecological Factors. Crop Sci. 1998, 38, 237–243. [Google Scholar] [CrossRef]
  26. Manjunatha, T.; Bisht, I.; Bhat, K.; Singh, B. Genetic diversity in barley (Hordeum vulgare L. ssp. vulgare) landraces from Uttaranchal Himalaya of India. Genet. Resour. Crop Evol. 2007, 54, 55–65. [Google Scholar] [CrossRef]
  27. Abdellaoui, R.; M’Hamed, H.C.; Naceur, M.B.; Bettaieb-Kaab, L.; Hamida, J.B. Morpho-physiological and molecular characterization of some Tunisian barley ecotypes. Asian J. Plant Sci. 2007, 6, 26–268. [Google Scholar] [CrossRef]
  28. Yahiaoui, S.; Igartua, E.; Moralejo, M.; Ramsay, L.; Molina-Cano, J.L.; Lasa, J.; Gracia, M.; Casas, A. Patterns of genetic and eco-geographical diversity in Spanish barleys. Theor. Appl. Genet. 2008, 116, 271–282. [Google Scholar] [CrossRef] [PubMed] [Green Version]
  29. Feng, Z.-Y.; Zhang, L.-L.; Zhang, Y.-Z.; Ling, H.-Q. Genetic diversity and geographical differentiation of cultivated six-rowed naked barley landraces from the Qinghai-Tibet plateau of China detected by SSR analysis. Genet. Mol. Biol. 2006, 29, 330–338. [Google Scholar] [CrossRef] [Green Version]
  30. Hamza, S.; Hamida, W.B.; Rebaï, A.; Harrabi, M. SSR-based genetic diversity assessment among Tunisian winter barley and relationship with morphological traits. Euphytica 2004, 135, 107–118. [Google Scholar] [CrossRef]
  31. Van Treuren, R.; Tchoudinova, I.; Van Soest, L.; van Hintum, T.J. Marker-assisted acquisition and core collection formation: A case study in barley using AFLPs and pedigree data. Genet. Resour. Crop Evol. 2006, 53, 43–52. [Google Scholar] [CrossRef] [Green Version]
  32. Dziurdziak, J.; Bolc, P.; Wlodarczyk, S.; Puchta, M.; Gryziak, G.; Podyma, W.; Boczkowska, M. Multifaceted Analysis of Barley Landraces Collected during Gene Bank Expeditions in Poland at the End of the 20th Century. Agronomy 2020, 10, 1958. [Google Scholar] [CrossRef]
  33. Varshney, R.; Baum, M.; Guo, P.; Grando, S.; Ceccarelli, S.; Graner, A. Features of SNP and SSR diversity in a set of ICARDA barley germplasm collection. Mol. Breed. 2010, 26, 229–242. [Google Scholar] [CrossRef]
  34. Varshney, R.; Thiel, T.; Sretenovic-Rajicic, T.; Baum, M.; Valkoun, J.; Guo, P.; Grando, S.; Ceccarelli, S.; Graner, A. Identification and validation of a core set of informative genic SSR and SNP markers for assaying functional diversity in barley. Mol. Breed. 2008, 22, 1–13. [Google Scholar] [CrossRef] [Green Version]
  35. Russell, J.R.; Ellis, R.P.; Thomas, W.T.; Waugh, R.; Provan, J.; Booth, A.; Fuller, J.; Lawrence, P.; Young, G.; Powell, W. A retrospective analysis of spring barley germplasm development fromfoundation genotypes’ to currently successful cultivars. Mol. Breed. 2000, 6, 553–568. [Google Scholar] [CrossRef]
  36. Nandha, P.S.; Singh, J. Comparative assessment of genetic diversity between wild and cultivated barley using g SSR and EST-SSR markers. Plant Breed. 2014, 133, 28–35. [Google Scholar] [CrossRef]
  37. Mohammadi, S.A.; Sisi, N.A.; Sadeghzadeh, B. The influence of breeding history, origin and growth type on population structure of barley as revealed by SSR markers. Sci. Rep. 2020, 10, 19165. [Google Scholar] [CrossRef]
  38. Lister, D.L.; Jones, H.; Jones, M.K.; O’Sullivan, D.M.; Cockram, J. Analysis of DNA polymorphism in ancient barley herbarium material: Validation of the KASP SNP genotyping platform. Taxon 2013, 62, 779–789. [Google Scholar] [CrossRef]
  39. Close, T.J.; Bhat, P.R.; Lonardi, S.; Wu, Y.; Rostoks, N.; Ramsay, L.; Druka, A.; Stein, N.; Svensson, J.T.; Wanamaker, S. Development and implementation of high-throughput SNP genotyping in barley. BMC Genom. 2009, 10, 582. [Google Scholar] [CrossRef] [PubMed] [Green Version]
  40. Bayer, M.M.; Rapazote-Flores, P.; Ganal, M.; Hedley, P.E.; Macaulay, M.; Plieske, J.; Ramsay, L.; Russell, J.; Shaw, P.D.; Thomas, W. Development and evaluation of a barley 50k iSelect SNP array. Front. Plant Sci. 2017, 8, 1792. [Google Scholar] [CrossRef] [PubMed] [Green Version]
  41. Comadran, J.; Kilian, B.; Russell, J.; Ramsay, L.; Stein, N.; Ganal, M.; Shaw, P.; Bayer, M.; Thomas, W.; Marshall, D. Natural variation in a homolog of Antirrhinum CENTRORADIALIS contributed to spring growth habit and environmental adaptation in cultivated barley. Nat. Genet. 2012, 44, 1388–1392. [Google Scholar] [CrossRef]
  42. Torkamaneh, D.; Laroche, J.; Bastien, M.; Abed, A.; Belzile, F. Fast-GBS: A new pipeline for the efficient and highly accurate calling of SNPs from genotyping-by-sequencing data. BMC Bioinform. 2017, 18, 5. [Google Scholar] [CrossRef] [PubMed] [Green Version]
  43. Milner, S.G.; Jost, M.; Taketa, S.; Mazón, E.R.; Himmelbach, A.; Oppermann, M.; Weise, S.; Knüpffer, H.; Basterrechea, M.; König, P. Genebank genomics highlights the diversity of a global barley collection. Nat. Genet. 2019, 51, 319–326. [Google Scholar] [CrossRef] [PubMed] [Green Version]
  44. Wenzl, P.; Carling, J.; Kudrna, D.; Jaccoud, D.; Huttner, E.; Kleinhofs, A.; Kilian, A. Diversity Arrays Technology (DArT) for whole-genome profiling of barley. Proc. Natl. Acad. Sci. USA 2004, 101, 9915–9920. [Google Scholar] [CrossRef] [Green Version]
  45. Bengtsson, T.; Manninen, O.; Jahoor, A.; Orabi, J. Genetic diversity, population structure and linkage disequilibrium in Nordic spring barley (Hordeum vulgare L. subsp. vulgare). Genet. Resour. Crop Evol. 2017, 64, 2021–2033. [Google Scholar] [CrossRef] [Green Version]
  46. Moragues, M.; Comadran, J.; Waugh, R.; Milne, I.; Flavell, A.; Russell, J.R. Effects of ascertainment bias and marker number on estimations of barley diversity from high-throughput SNP genotype data. Theor. Appl. Genet. 2010, 120, 1525–1534. [Google Scholar] [CrossRef] [PubMed]
  47. NCPGR. EGISET. Available online: https://wyszukiwarka.ihar.edu.pl/pl (accessed on 15 August 2021).
  48. Doyle, J.J.; Doyle, J.L. Isolation ofplant DNA from fresh tissue. Focus 1990, 12, 39–40. [Google Scholar]
  49. Edwards, K.; Johnstone, C.; Thompson, C. A simple and rapid method for the preparation of plant genomic DNA for PCR analysis. Nucleic Acids Res. 1991, 19, 1349. [Google Scholar] [CrossRef] [PubMed]
  50. Wójcik-Jagła, M.; Rapacz, M.; Barcik, W.; Janowiak, F. Differential regulation of barley (Hordeum distichon) HVA1 and SRG6 transcript accumulation during the induction of soil and leaf water deficit. Acta Physiol. Plant. 2012, 34, 2069–2078. [Google Scholar] [CrossRef] [Green Version]
  51. Mascher, M.; Gundlach, H.; Himmelbach, A.; Beier, S.; Twardziok, S.O.; Wicker, T.; Radchuk, V.; Dockter, C.; Hedley, P.E.; Russell, J. A chromosome conformation capture ordered sequence of the barley genome. Nature 2017, 544, 427–433. [Google Scholar] [CrossRef] [Green Version]
  52. Leberg, P. Estimating allelic richness: Effects of sample size and bottlenecks. Mol. Ecol. 2002, 11, 2445–2449. [Google Scholar] [CrossRef]
  53. Hubisz, M.J.; Falush, D.; Stephens, M.; Pritchard, J.K. Inferring weak population structure with the assistance of sample group information. Mol. Ecol. Resour. 2009, 9, 1322–1332. [Google Scholar] [CrossRef] [Green Version]
  54. Evanno, G.; Regnaut, S.; Goudet, J. Detecting the Number of Clusters of Individuals Using the Software Structure: A Simulation Study. Mol. Ecol. 2005, 14, 2611–2620. [Google Scholar] [CrossRef] [Green Version]
  55. Gower, J.C. Generalized procrustes analysis. Psychometrika 1975, 40, 33–51. [Google Scholar] [CrossRef]
  56. Peakall, R.; Smouse, P.E. Genalex 6: Genetic analysis in Excel. Population genetic software for teaching and research. Bioinformatics 2012, 28, 2537–2539. [Google Scholar] [CrossRef] [Green Version]
  57. Kalinowski, S.T. hp-rare 1.0: A computer program for performing rarefaction on measures of allelic richness. Mol. Ecol. Notes 2005, 5, 187–189. [Google Scholar] [CrossRef]
  58. Kopelman, N.M.; Mayzel, J.; Jakobsson, M.; Rosenberg, N.A.; Mayrose, I. Clumpak: A program for identifying clustering modes and packaging population structure inferences across K. Mol. Ecol. Resour. 2015, 15, 1179–1191. [Google Scholar] [CrossRef] [Green Version]
  59. Zietkiewicz, E.; Rafalski, A.; Labuda, D. Genome fingerprinting by simple sequence repeat (SSR)-anchored polymerase chain reaction amplification. Genomics 1994, 20, 176–183. [Google Scholar] [CrossRef] [PubMed]
  60. Villa, T.C.C.; Maxted, N.; Scholten, M.; Ford-Lloyd, B. Defining and identifying crop landraces. Plant Genet. Resour. 2005, 3, 373–384. [Google Scholar] [CrossRef] [Green Version]
  61. Podyma, W.; Boczkowska, M.; Wolko, B.; Dostatny, D.F. Morphological, isoenzymatic and ISSRs-based description of diversity of eight sand oat (Avena strigosa Schreb.) landraces. Genet. Resour. Crop Evol. 2017, 64, 1661–1674. [Google Scholar] [CrossRef]
  62. Ávila, C.M.; Requena-Ramírez, M.D.; Rodríguez-Suárez, C.; Flores, F.; Sillero, J.C.; Atienza, S.G. Genome-Wide Association Analysis for Stem Cross Section Properties, Height and Heading Date in a Collection of Spanish Durum Wheat Landraces. Plants 2021, 10, 1123. [Google Scholar] [CrossRef]
  63. Hahn, V.; Würschum, T. Molecular genetic characterization of Central European soybean breeding germplasm. Plant Breed. 2014, 133, 748–755. [Google Scholar] [CrossRef]
  64. Maccaferri, M.; Harris, N.S.; Twardziok, S.O.; Pasam, R.K.; Gundlach, H.; Spannagl, M.; Ormanbekova, D.; Lux, T.; Prade, V.M.; Milner, S.G. Durum wheat genome highlights past domestication signatures and future improvement targets. Nat. Genet. 2019, 51, 885–895. [Google Scholar] [CrossRef] [PubMed] [Green Version]
  65. Bustos-Korts, D.; Dawson, I.K.; Russell, J.; Tondelli, A.; Guerra, D.; Ferrandi, C.; Strozzi, F.; Nicolazzi, E.L.; Molnar-Lang, M.; Ozkan, H. Exome sequences and multi-environment field trials elucidate the genetic basis of adaptation in barley. Plant J. 2019, 99, 1172–1191. [Google Scholar] [CrossRef] [Green Version]
  66. Amezrou, R.; Gyawali, S.; Belqadi, L.; Chao, S.; Arbaoui, M.; Mamidi, S.; Rehman, S.; Sreedasyam, A.; Verma, R.P.S. Molecular and phenotypic diversity of ICARDA spring barley (Hordeum vulgare L.) collection. Genet. Resour. Crop Evol. 2018, 65, 255–269. [Google Scholar] [CrossRef]
  67. Chen, F.; Chen, D.; Vallés, M.-P.; Gao, Z.; Chen, X. Analysis of diversity in Chinese cultivated barley with simple sequence repeats: Differences between eco-geographic populations. Biochem. Genet. 2010, 48, 44–56. [Google Scholar] [CrossRef]
  68. Lasa, J.; Igartua, E.; Ciudad, F.; Codesal, P.; Garcíaa, E.; Gracia, M.; Medina, B.; Romagosa, I.; Molina-Cano, J.; Montoya, J. Morphological and agronomical diversity patterns in the Spanish barley core collection. Hereditas 2001, 135, 217–225. [Google Scholar] [CrossRef] [PubMed] [Green Version]
  69. Zohary, D.; Hopf, M.; Weiss, E. Domestication of Plants in the Old World: The Origin and Spread of Domesticated Plants in Southwest Asia, Europe, and the Mediterranean Basin; Oxford University Press on Demand: Oxford, UK, 2012. [Google Scholar]
  70. Taketa, S.; Kikuchi, S.; Awayama, T.; Yamamoto, S.; Ichii, M.; Kawasaki, S. Monophyletic origin of naked barley inferred from molecular analyses of a marker closely linked to the naked caryopsis gene (nud). Theor. Appl. Genet. 2004, 108, 1236–1242. [Google Scholar] [CrossRef] [PubMed]
  71. Zeng, X.; Guo, Y.; Xu, Q.; Mascher, M.; Guo, G.; Li, S.; Mao, L.; Liu, Q.; Xia, Z.; Zhou, J. Origin and evolution of qingke barley in Tibet. Nat. Commun. 2018, 9, 5433. [Google Scholar] [CrossRef]
  72. Kikuchi, S.; Taketa, S.; Ichii, M.; Kawasaki, S. Efficient fine mapping of the naked caryopsis gene (nud) by HEGS (High Efficiency Genome Scanning)/AFLP in barley. Theor. Appl. Genet. 2003, 108, 73–78. [Google Scholar] [CrossRef] [PubMed]
  73. Taketa, S.; Amano, S.; Tsujino, Y.; Sato, T.; Saisho, D.; Kakeda, K.; Nomura, M.; Suzuki, T.; Matsumoto, T.; Sato, K. Barley grain with adhering hulls is controlled by an ERF family transcription factor gene regulating a lipid biosynthesis pathway. Proc. Natl. Acad. Sci. USA 2008, 105, 4062–4067. [Google Scholar] [CrossRef] [PubMed] [Green Version]
  74. Yu, S.; Long, H.; Deng, G.; Pan, Z.; Liang, J.; Zeng, X.; Tang, Y.; Tashi, N.; Yu, M. A single nucleotide polymorphism of Nud converts the caryopsis type of barley (Hordeum vulgare L.). Plant Mol. Biol. Report. 2016, 34, 242–248. [Google Scholar] [CrossRef] [Green Version]
  75. Boros, D.; Rek-Cieply, B.; Cyran, M. A note on the composition and nutritional value of hulless barley. J. Anim. Feed Sci. 1996, 5, 417–424. [Google Scholar] [CrossRef] [Green Version]
  76. Brennan, C.S. Dietary fibre, glycaemic response, and diabetes. Mol. Nutr. Food Res. 2005, 49, 560–570. [Google Scholar] [CrossRef]
  77. Jood, S.; Kalra, S. Chemical composition and nutritional characteristics of some hull less and hulled barley cultivars grown in India. Food/Nahr. 2001, 45, 35–39. [Google Scholar] [CrossRef]
  78. Owen, B.; Farmer, M.; Sosuski, F.; Wu, K. Variation in mineral content of Saskatchewan feed grains. Can. J. Anim. Sci. 1977, 57, 679–687. [Google Scholar] [CrossRef] [Green Version]
  79. Yadav, R.; Gautam, S.; Palikhey, E.; Joshi, B.; Ghimire, K.; Gurung, R.; Adhikari, A.; Pudasaini, N.; Dhakal, R. Agro-morphological diversity of Nepalese naked barley landraces. Agric. Food Secur. 2018, 7, 86. [Google Scholar] [CrossRef]
  80. Muñoz-Amatriaín, M.; Cuesta-Marcos, A.; Endelman, J.B.; Comadran, J.; Bonman, J.M.; Bockelman, H.E.; Chao, S.; Russell, J.; Waugh, R.; Hayes, P.M. The USDA barley core collection: Genetic diversity, population structure, and potential for genome-wide association studies. PLoS ONE 2014, 9, e94688. [Google Scholar]
  81. Barabaschi, D.; Francia, E.; Tondelli, A.; Gianinetti, A.; Stanca, A.M.; Pecchioni, N. Effect of the nud gene on grain yield in barley. Czech J. Genet. Plant Breed. 2012, 48, 10–22. [Google Scholar] [CrossRef] [Green Version]
  82. Gerasimova, S.V.; Hertig, C.; Korotkova, A.M.; Kolosovskaya, E.V.; Otto, I.; Hiekel, S.; Kochetov, A.V.; Khlestkina, E.K.; Kumlehn, J. Conversion of hulled into naked barley by Cas endonuclease-mediated knockout of the NUD gene. BMC Plant Biol. 2020, 20, 255. [Google Scholar] [CrossRef] [PubMed]
  83. Wang, Q.; Sun, G.; Ren, X.; Du, B.; Cheng, Y.; Wang, Y.; Li, C.; Sun, D. Dissecting the genetic basis of grain size and weight in barley (Hordeum vulgare L.) by QTL and comparative genetic analyses. Front. Plant Sci. 2019, 10, 469. [Google Scholar] [CrossRef]
  84. Tondelli, A.; Francia, E.; Visioni, A.; Comadran, J.; Mastrangelo, A.; Akar, T.; Al-Yassin, A.; Ceccarelli, S.; Grando, S.; Benbelkacem, A. QTLs for barley yield adaptation to Mediterranean environments in the ‘Nure’×’Tremois’ biparental population. Euphytica 2014, 197, 73–86. [Google Scholar] [CrossRef]
  85. Gong, X.; Wheeler, R.; Bovill, W.D.; McDonald, G.K. QTL mapping of grain yield and phosphorus efficiency in barley in a Mediterranean-like environment. Theor. Appl. Genet. 2016, 129, 1657–1672. [Google Scholar] [CrossRef]
  86. Rey, J.; Hayes, P.; Petrie, S.; Corey, A.; Flowers, M.; Ohm, J.-B.; Ong, C.; Rhinhart, K.; Ross, A. Production of dryland barley for human food: Quality and agronomic performance. Crop Sci. 2009, 4, 347–355. [Google Scholar] [CrossRef] [Green Version]
  87. Shoeva, O.Y.; Mock, H.-P.; Kukoeva, T.V.; Börner, A.; Khlestkina, E.K. Regulation of the flavonoid biosynthesis pathway genes in purple and black grains of Hordeum vulgare. PLoS ONE 2016, 11, e0163782. [Google Scholar]
  88. Aastrup, S.; Outtrup, H.; Erdal, K. Location of the proanthocyanidins in the barley grain. Carlsberg Res. Commun. 1984, 49, 105–109. [Google Scholar] [CrossRef] [Green Version]
  89. Kim, M.-J.; Hyun, J.-N.; Kim, J.-A.; Park, J.-C.; Kim, M.-Y.; Kim, J.-G.; Lee, S.-J.; Chun, S.-C.; Chung, I.-M. Relationship between phenolic compounds, anthocyanins content and antioxidant activity in colored barley germplasm. J. Agric. Food Chem. 2007, 55, 4802–4809. [Google Scholar] [CrossRef]
  90. Harlan, H.V. Some Distinctions in Our Cultivated Barleys with Reference to Their Use in Plant Breeding; US Department of Agriculture: Washington, DC, USA, 1914.
  91. Yao, X.; Wu, K.; Yao, Y.; Bai, Y.; Ye, J.; Chi, D. Construction of a high-density genetic map: Genotyping by sequencing (GBS) to map purple seed coat color (Psc) in hulless barley. Hereditas 2018, 155, 37. [Google Scholar] [CrossRef] [Green Version]
  92. Larson, R.L.; Bussard, J.B. Microsomal flavonoid 3′-monooxygenase from maize seedlings. Plant Physiol. 1986, 80, 483–486. [Google Scholar] [CrossRef] [PubMed] [Green Version]
  93. Yan, X.; Li, J.; Fu, F.; Jin, M.; Chen, L.; Liu, L. Co-location of seed oil content, seed hull content and seed coat color QTL in three different environments in Brassica napus L. Euphytica 2009, 170, 355–364. [Google Scholar] [CrossRef]
  94. Abdel-Aal, E.-S.M.; Young, J.C.; Rabalski, I. Anthocyanin composition in black, blue, pink, purple, and red cereal grains. J. Agric. Food Chem. 2006, 54, 4696–4704. [Google Scholar] [CrossRef] [PubMed]
Figure 1. Map of barley accessions stored at the National Center of Plant Gene Resources that have landrace status and were covered by DArTseq-based SNP analysis, highlighted in blue.
Agronomy 11 02330 g001
Figure 2. Grain color variation within hulled and hulless spring barley landraces: (a) PL 41634; (b) PL 502171; (c) PL 41867; (d) PL 42122.
Agronomy 11 02330 g002
Figure 3. Frequency of analyzed loci and mean PIC and Ho values along chromosomes were assessed by a sliding window approach with 500 kb windows at 250 positions along the full length of barley chromosomes based on the genome assembly: IBSC_v2 [51] all chromosomes have been normalized to a standard length; (ag) chromosome 1H—7H, respectively.
Agronomy 11 02330 g003
Figure 4. Diversity coefficients (a) unbiased coefficient of variation (uHe), unbiased observed heterogeneity (uHo), and Fixation Index (F) for 116 spring barley landraces based on DArTseq data calculated for groups of landrace in accordance with their origin; (b) diversity coefficients for 116 spring barley landraces based on DArTseq data, calculated for groups according to the location of the tested loci on barley chromosomes; (c) heterogeneity on individual chromosomes according to the country of accessions origin; (d) number of unique SNPs on barley chromosomes according to accession country of origin.
Agronomy 11 02330 g004
Figure 5. Results of Principal Coordinate Analysis (PCoA) for 116 spring barley landraces with an indication of the country of origin. The accession numbers according to Table S1. RotaTable 3D figures with an indication of the country of origin, grain type, and ear type can be found in the Supplementary Materials (Figures S3–S5).
Agronomy 11 02330 g005
Figure 6. (a) Results of 100,000 iterations of the STRUCTURE program [53] for 116 spring barley landraces based on DArTseq data at K = 2, where K is the number of ad hoc groups formed; each vertical bar represents one accession, which is labeled with a sequence number (Table S1). The length of the colored bar indicates the estimated proportion of that sample’s membership in each group. (b) Results of 100,000 iterations of the STRUCTURE program [53] for 116 spring barley landraces based on DArTseq data at K = 3, where K is the number of ad hoc groups formed; each vertical bar represents one accession, which is labeled with a sequence number (Table S1). The length of the colored bar indicates the estimated proportion of that sample’s membership in each group; (c) the results of ad hoc measure ∆K [54] generated by CLUMPAK software [58].
Agronomy 11 02330 g006
Figure 7. Results of Principal Coordinate Analysis (PCoA) for 116 spring barley landraces with indication of disease resistance. The accession numbers according to Table S1. The RotaTable 3D figure can be found in the Supplementary Materials (Figure S6).
Agronomy 11 02330 g007
Figure 8. Genetic variation on the 7H chromosome for 116 spring barley landraces; (a) level of heterogeneity and unique SNPs assessed by a sliding window approach with 500 kb windows at 250 positions along the entire chromosome; (b) results of Principal Coordinate Analysis (PCoA) with indication the grain type.
Agronomy 11 02330 g008
Figure 9. Generalized Procrustes Analysis (GPA) of 116 spring barley cultivars landraces based on ISSR and DArTseq data.
Agronomy 11 02330 g009
Table 1. Descriptive statistics of average agro-morphological characters based on EGISET database [47]. The accession number is in parentheses.
TraitUnit% of Evaluated AccessionsMeanMin.Max.Variation (Cv)
Phenologicaldays to headingdays95%69.752.0 (PL 42389)93.0 (2 access.)7%
grain filling durationdays85%35.422.0 (PL 505304)44.0 (PL 40554)13%
days to maturitydays85%105.581.7 (PL 42768)117.0 (PL 41532)10%
Metricalplant lengthcm96%81.352.0 (PL 502172)112.0 (PL 36315)13%
ear lengthcm76%8.64.6 (PL 502171)11.8 (PL 501971)16%
number of grains per earno.64%16.87.7 (PL 40553)43.6 (PL 502170)36%
thousand seed weightg95%47.730.5 (PL 36315)58.8 (PL 502169)11%
Bonitationslodging resistancescale 185%7.72.0 (PL 41267)9.0 (42 access.)19%
powdery mildew resistancescale 188%6.91.0 (3 access.)9.0 (21 access.)28%
net blotch resistancescale 191%8.55.0 (PL 501968.)9.0 (71 access.)10%
stem rust resistancescale 161%8.87.0 (5 access.)9.0 (65 access.)6%
scald resistancescale 167%8.76.0 (PL 505304)9.0 (63 access.)8%
1 scale (1—very low, …, 9—very good).
Publisher’s Note: MDPI stays neutral with regard to jurisdictional claims in published maps and institutional affiliations.

