Article

Exploring the Phenotypic Stability of Soybean Seed Compositions Using Multi-Trait Stability Index Approach

1
The National Engineering Laboratory for Crop Molecular Breeding, MARA Key Laboratory of Soybean Biology (Beijing), Institute of Crop Sciences, Chinese Academy of Agricultural Sciences, 12 Zhongguancun South Street, Beijing 100081, China
2
Crop Science Department, Faculty of Agriculture, Damanhour University, Damanhour 22516, Egypt
3
Plant Production Department, Faculty of Agriculture Saba Basha, Alexandria University, Alexandria 21531, Egypt
*
Authors to whom correspondence should be addressed.
These authors contributed equally to this work.
Agronomy 2021, 11(11), 2200; https://doi.org/10.3390/agronomy11112200
Submission received: 30 September 2021 / Revised: 28 October 2021 / Accepted: 29 October 2021 / Published: 30 October 2021
(This article belongs to the Special Issue Old Germplasm for New Needs: Managing Crop Genetic Resources)

Abstract

:
In order to ensure an ongoing and long-term breeding progress of soybean, stable sources of major quality traits across multi-environments need to be identified. Here, a panel of 135 soybean genotypes was tested in three different Chinese environments, including Beijing, Anhui, and Hainan during the 2017 and 2018 growing seasons to identify stable genotypes for cultivation under varying environmental conditions. The weighted average of absolute scores biplot (WAASB) for the best linear unbiased predictions of the genotype-environment interaction and multi-trait stability index (MTSI) were utilized to determine the stability of the soybeans for seven seed composition traits viz; protein content, oil content, and five fatty acids (palmitic, stearic, oleic, linoleic, and linolenic acids). Based on the WAASB index, the following genotypes were identified as stable genotypes for some specific traits; ZDD12828 and ZDD12832 for protein content, WDD01583 and WDD03025 for oil content, ZDD23040 for palmitic acid, WDD00033 for stearic acid, ZDD23822 for oleic acid, ZDD11183 for linoleic acid, and ZDD08489 for linolenic acid. Furthermore, based on MTSI at a selection intensity of 10%, 14 soybean genotypes were selected for their average performance and stability. Overall, the MTSI was shown to be a powerful and simple tool for identifying superior genotypes in terms of both performance and stability, hence, identifying stable soybean genotypes for future breeding programs of quality traits.

1. Introduction

Soybean is presently acknowledged as one of the leading crops due to its viable source of vegetable protein and oil, making it an additional source of healthy food [1]. Soybean is recognized as the food legume with the greatest protein content (40%) and is second only to peanut regarding oil content (20%). When compared to other vegetable proteins, soy protein has an outstanding amino acid balance [2] and is deemed complete because it contains sufficient levels of amino acids necessary by the body for tissue growth and repair [2]. Moreover, soybean provides 28% of the world’s oilseed production for edible oil [3]. Soybean oil is composed of 12% palmitic (16:0), 4% stearic (18:0), 23% oleic (18:1), 53% linoleic (18:2), and 8% linolenic (18:3) acids [4].
Climate change may make it more difficult to cultivate crops in the same way and regions as in the past. The impacts of climate change must be weighed against other changing elements that affect agricultural productivity, such as changes in farming techniques and technology [5,6]. Protein and oil contents in soybeans are two of the most important seed quality factors that soybean breeders, growers, and marketers take into account. It is thus important to investigate the stability of upcoming soybean varieties in terms of these quality parameters under such unprecedented rates of climate change impacts [5,7]. Soybean seed characteristics such as protein and oil are influenced by environmental and genetic variables, as well as their interactions [8]. Importantly, when selecting cultivars for breeding programs, genotype-environment interaction (GEI) is influential and it must be evaluated and taken into account [9]. As a result, to maintain positive trends and rebalance dietary sources of soybean in the future, intensive research is needed to develop such improved and highly stable soybean varieties which would appeal to matching the dietary standards requirement around the globe [10,11].
The impact of GEI on genotypes can be described by particular trait stability. Typically, phenotypic stability of distinct traits, either yield or quality traits, is the ability of a genotype to perform consistently in various environments [12]. It is worth noting that determining the stability pattern of genotypes is a prerequisite for understanding their response to different environments, identification of stable and widely adapted genotypes, and breeding new cultivars that could adapt to the different environments [12,13]. Thus, plant breeders’ always aim to select varieties with high performance across different environments. The differences observed in the stability of genotypes are usually a result of GEI [14]. However, the selection of highly stable varieties can be difficult when a breeder has to consider individual GEI of multiple traits under multiple environments. Notably, the GEI of quality characters of soybean has been studied previously by several investigators [12,15,16,17,18,19,20]. In the selection process, besides choosing the best statistical model to predict genetic values, plant breeders usually handle multiple traits simultaneously [21,22,23]. However, the simultaneous selection of soybean genotypes with high performance based on multiple traits can be a difficult task. So, the question now is how can we breed superior genotypes quickly enough to meet the expanding world population’s food demands?
To address such a question, in the advanced stages of the breeding process, multi-environment trial data are frequently used to make brilliant selections [24,25,26,27]. Recently, some improvements in this area include the multi-trait stability index (MTSI) which allows for selection based on both mean performance and stability [27,28,29]. Multi-environment trials analysis is often conducted with only one single trait [30,31,32]. However, when several traits are taken into account, the accuracy of genotype recommendations improves. In this regard, a rapid and new technique for analyzing multi-environment trials has been recently developed that integrates the simultaneous selection for the stability of multi traits into a single and easily interpretable index [23,27,28,29].
The theoretical basis of MTSI [27] depends on mean performance and stability selected simultaneously across multi environments trials. Lower MTSI scores suggest the stability of genotypes based on many variables. This strategy was used in a set of 22 oats (Avena sativa L.) genotypes [27] based on the weighted average of absolute scores biplot (WAASB) from the singular value decomposition of the matrix of best linear unbiased predictions index [29,33]. Thus, in the simultaneous selection of genotypes based on their mean performances and stabilities of several traits, the MTSI will be beneficial since it offers a strong and easy-to-use selection method that considers the correlation structure of the features. Moreover, the MTSI has been successfully used in selecting high-performing and stable soybean genotypes under two different conditions (drought and salinity), revealing the efficiency of implementing the method [28]. Furthermore, the MTSI has been used in the identification of stable and superior water-tolerant cassava genotypes [29]. From this literature, it is evident that the MTSI is a valuable tool to plant breeders for the selection of superior genotypes based on multi-traits and multi-environment data. Thus, the main objective of this study is to identify soybean genotype(s) with superior performance based on multiple seed composition traits and high phenotypic stability across multi-environment in China.

2. Materials and Methods

2.1. Plant Materials and Field Experiments

In the present study, 135 soybean accessions from three different countries (87 accessions from China, 43 accessions from the USA, and 5 accessions from Russia) were used. Information about accession number, origin, maturity groups, and other phenotypic characteristics are presented in Table S1. The plant material utilized in this research was provided by the soybean genetic resource research group of the Institute of Crop Sciences, Chines Academy of Agricultural Sciences (CAAS).
Field experiments were conducted at Changping, Beijing (40°13′ N, 116°12′ E), and Sanya, Hainan (18°24′ N, 109°5′ E) in 2017 and 2018, and Hefei, Anhui (33°61′ N 117°0′ E) in 2017. The accessions were planted on 12 June 2017 and 14 June 2018 in Changping; 14 November 2017 and 16 November 2018 in Sanya; and 5 June 2017 in Hefei. The experiment was laid out in a randomized incomplete block design with three replications in each location. The mean monthly temperature, rainfall, and sunshine of the five environments are presented in Table S2. Soybean seeds were sown in a 3-m single row plot at a spacing of 0.1 m within rows and 0.5 m between rows. After emergence, the plants were thinned and only uniform healthy plants were left. Plots were manually harvested when the plants reached physiological maturity. The harvest date of all accessions varied due to the differences in maturity group and location. The growing duration of soybean cultivars was 102–120 days at Changping, 101–119 days in Hefei, and 94–96 days at Sanya.

2.2. Determination of Soybean Seed Protein, Oil, and Fatty Acid Compositions

To evaluate the soybean seed protein, oil, and fatty acid contents, harvested soybean seeds of each cultivar were bulked and around 500 g of seeds were used. Near-infrared spectroscopy was used to determine the protein and oil contents [34]. For each sample, absorption of about 50 g of soybean seeds were determined using the transform near-infrared absorption spectroscopy (Bruker Fourier, Germany). The spectrum value of each sample is the average of triplicate measurements with absorption range between 4000 and 8000 cm−1. The spectra were used to estimate protein and oil contents by the Quant 2 method of Bruker’s OPUS 4.2 software. The soybean seeds fatty acid contents were quantified by the derivatization into their methyl esters and determined using gas chromatography (GC) [35]. The procedure for the extraction and determination of fatty acids has been previously reported [36]. The area normalization method was used to quantify the percentages of fatty acids using a GC 2010 workstation [35].

2.3. Data Analysis

2.3.1. Analysis of Variance

Individual analysis of variance (ANOVA) for each environment was conducted, followed by an analysis of joint variance according to the statistical model described in Equation (1):
Yijk = µ + B/Ejk + Gi + Ej + GEij + εijk
where Yijk represents the ith genotype in the jth environment and the kth block; µ is the overall mean; B/Ejk corresponds to the block within the jth environment and in the kth block; Gi is the effect of the ith genotype; Ej is the effect of the jth environment; GEij is the effect of the interaction of the ith genotype with the jth environment; and εijk is the effect of experimental error.

2.3.2. Mean Performance and Stability Indices Based on Multiple Traits

The genotypic stability of each genotype was quantified by the WAASB from the singular value decomposition of the matrix of best linear unbiased predictions for the GEI effects generated by a linear mixed-effect model [27], estimated as indicated in Equation (2):
WAASB i = k = 1   p | IPCA ik   EP k | k = 1   p EP k  
where WAASBi is the weighted average of absolute scores of the ith genotype; IPCAik is the score of the ith genotype in the kth interaction principal component axis (IPCA); and EPk is the amount of the variance explained by the kth IPCA. The genotype with the lowest WAASB value is considered the most stable, showing the least deviation from the average performance across environments [27].
To estimate the multi-trait stability index (MTSI) [27], Equation (3) below was used as follows:
MTSI i = [ j = 1 f ( F ij F j ) 2 ] 0.5
where MTSI is the multi-trait stability index for the ith genotype, Fij is the jth score of the ith genotype, and Fj is the jth score of ideotype. The genotype with the lowest MTSI is, therefore, closer to the ideotype and hence has a high mean performance and stability for all variables studied. The stability analyses of the multi-environment trial data using MTSI and WAASB indexes were conducted using the metan package [37] of the R 4.0.3 software [38].

3. Results

3.1. Mean Performance of 135 Soybean Accesions for Seed Composition Traits across Five Environments

The performance of the 135 soybean genotypes for seven seed composition traits for individual environment is shown in Table S3. The results showed highly significant differences (p < 0.001) among the five environments for the seed composition traits. The highest protein content (46.2%) was observed at Hainan in 2018, whereas the lowest protein content (40.3%) was recorded in Anhui in 2017. In contrast to protein content, the lowest oil content (18.3%) was observed at Hainan in 2018, while the highest oil content (20.3%) was recorded in Hainan in 2017. For fatty acid compositions, the highest contents of palmitic acid (13.5%), stearic acid (5.2%), oleic acid (22.9%), linoleic acid (57%), and linolenic acid (9.72%) were observed at Hainan in 2018, Beijing in 2018, Beijing in 2018, Beijing in 2017, and Hainan in 2018, respectively. The lowest values of palmitic acid (12.4%), stearic acid (4.1%), oleic acid (21.2%), linoleic acid (54.6%) and linolenic acid (7.7%) were recorded at Beijing in 2018, Hainan in 2017, Anhui in 2017, Beijing in 2017, and Anhui in 2017, respectively. The heritability values for the evaluated traits ranged from the lowest (h2 = 0.859) for stearic acid at Hainan in 2017 to the highest for protein content and oleic acid (h2 = 0.999) at Hainan in 2017 (Table S3).
For the mean performance of the genotypes across environments, genotypes ZDD12828 and ZDD11436 had the highest (52%) and lowest (35.7%) protein content, respectively. For oil content, WDD01583 and ZDD12828 recorded the highest and lowest content of 22% and 14.4%, respectively. For fatty acid composition, genotypes with highest value of palmitic, stearic, oleic, linoleic, and linolenic were ZDD09581 (15.2%), ZDD23915 (4.9%), ZDD10100 (28.6%), ZDD11183 (60.2%), and ZDD08489 (10.8%), respectively. In contrast, the lowest levels of palmitic, stearic, oleic, linoleic, and linolenic acids were recorded by WDD00033 (10.6%), WDD01632 (3%), ZDD09581 (13.5%), ZDD11235 (46.9), and ZDD23822 (5.9%), respectively.

3.2. Combined Analysis of Variance

The combined analysis of variance (Table 1) for seed protein and oil components showed that the genotype, environment, and GEI effects were highly significant (p < 0.001). The results also indicated that all the fatty acid compositions were significantly affected (p < 0.05) by genotype, environment, and GEI, except for palmitic and stearic acids which were not significantly influenced by the environment (Table 1).

3.3. AMMI Analysis of Variance for Studied Traits

The AMMI analysis showed highly significant effects (p < 0.001) of genotype and GEI for the seed composition traits (Table 2). In addition, the environment showed highly significant effects (p < 0.001) on protein, oil, oleic and linoleic acids, and a significant effect (p < 0.05) on linoleic acid, while palmitic and stearic acids were not significantly affected. The results further showed that the AMMI model explained the GEI and decomposed it into four interaction principal component axes (IPCAs), accounting for 100% of the total variation for all traits (Table 2). The four IPCAs fitted in the current study were all found to be significant (p < 0.001) for all the seed composition traits.
The partitioning of total phenotypic variance due to factors of genotype, environment, and GEI was also estimated. Collectively, the highest contribution to total phenotypic variation (as a relative contribution to the total sum of squares) was captured by genotypes in all measured seed compositions traits except for stearic acid. The genotype effect explained 42.1, 53.1, 36.9, 18.8, 34.6, 39.0, and 33.3% of the total phenotypic variance for protein, oil, palmitic acid, stearic acid, oleic acid, linoleic acid, and linolenic acid, respectively. The lowest environmental effect was captured by oleic acid (2.3%), while stearic acid was highly affected by the environment (16.9%).

3.4. Mean Performance and Stability of Selected Genotypes

The mean vs. WAASB shows the joint interpretation of the mean performance and stability of genotypes for the seed composition traits (Figure 1 and Figure 2). The results showed that genotypes ZDD12828 and ZDD12832 were highly stable (low WAASB index) with high protein contents of 51.9 and 50.6%, respectively, over the grand mean of all genotypes (Figure 1a). As for oil content, WDD01583 (22.9%), WDD03025 (22.7%), and WDD00573 (22.5%) with WAASB index of 0.132, 0.108, and 0.121, respectively were the most stable (Figure 1b).
For the stability of fatty acid composition (Figure 2a–e), ZDD23040 and ZDD12500 were the most stable genotypes with average palmitic acid contents of 14.2 and 14.1% and WAASB values of 0.119 and 0.108, respectively (Figure 2a). The most stable genotypes with high average stearic acid content were WDD00033 and ZDD24734 with 5.6 and 5.5% and WAASB index values of 0.163 and 0.188, respectively (Figure 2b). Highest levels of oleic acid were recorded by ZDD23822 (28.3%) and ZDD19107 (26.5%) with WAASB values of 0.412 and 0.308, respectively (Figure 2c). The most stable genotypes for linoleic acid were ZDD11183 (61%) and WDD01613 (60.1%) with WAASB values of 0.182 and 0.202, respectively (Figure 2d). For linolenic acid, higher levels than the grand mean coupled with high stability were recorded by ZDD08489 (11.5%), ZDD12463 (11.3%), and ZDD09581 (11.1%) with WAASB values of 0.199, 0.144, and 0.103, respectively (Figure 2e).

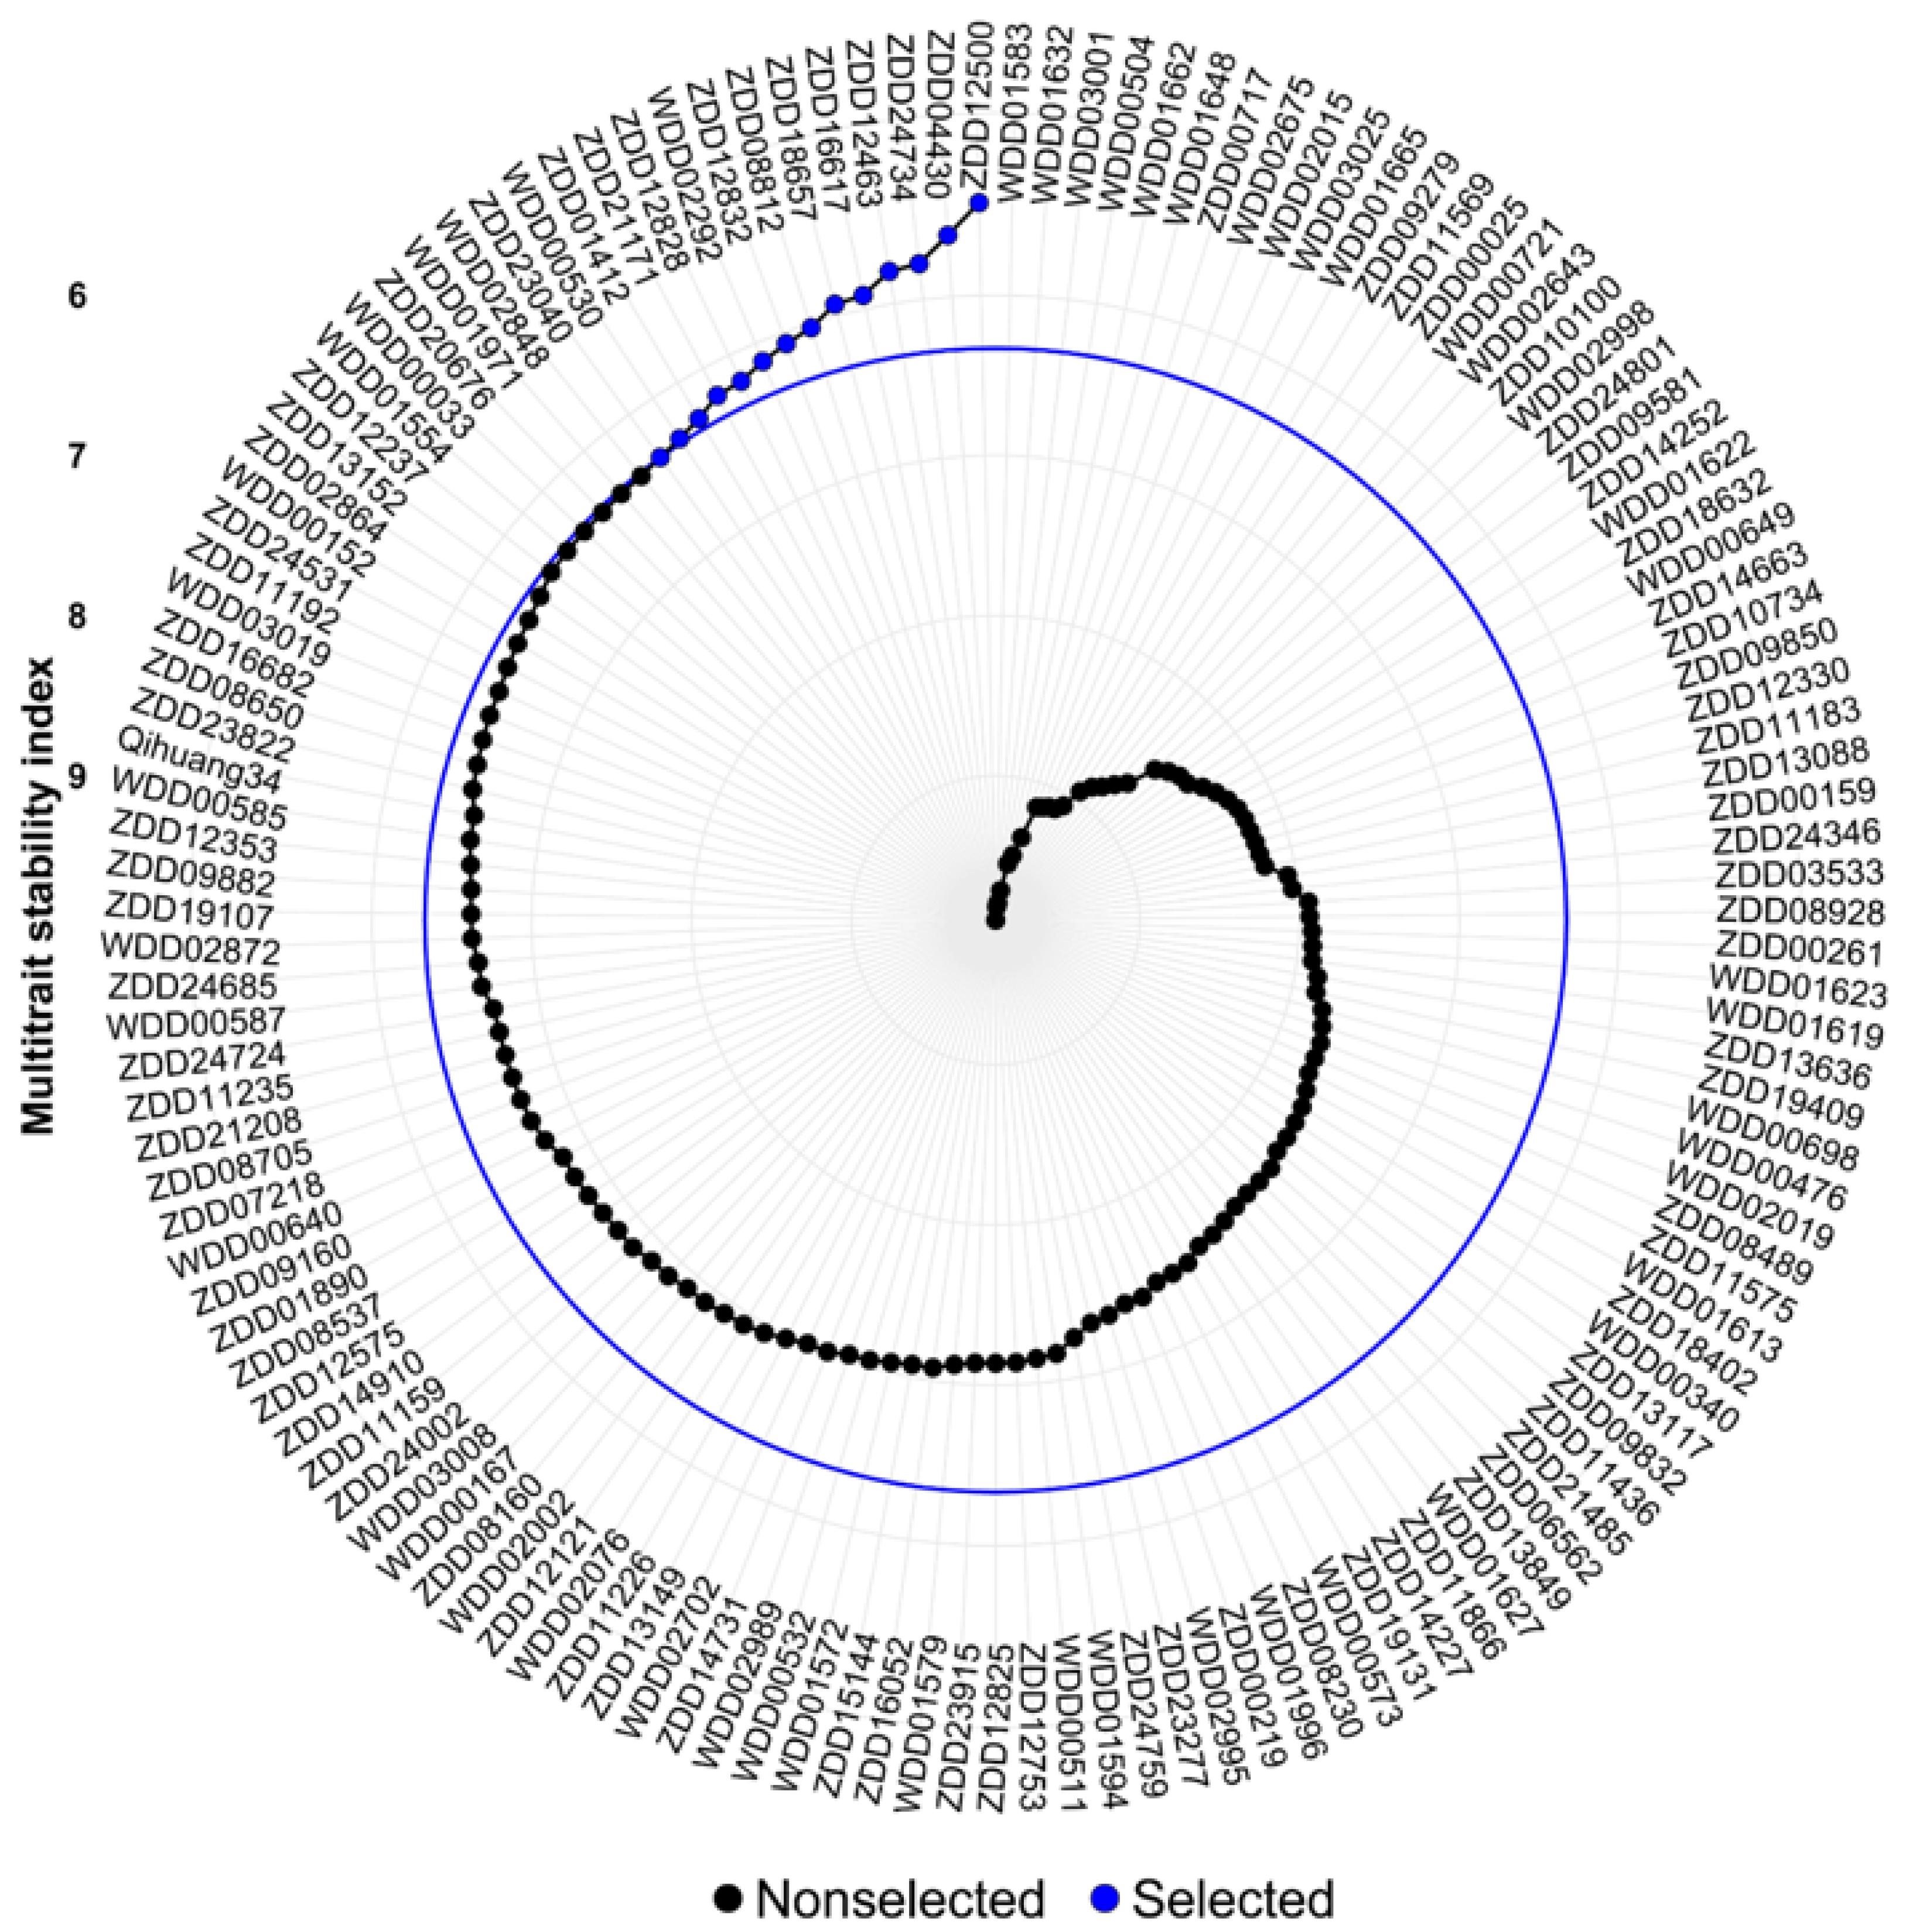
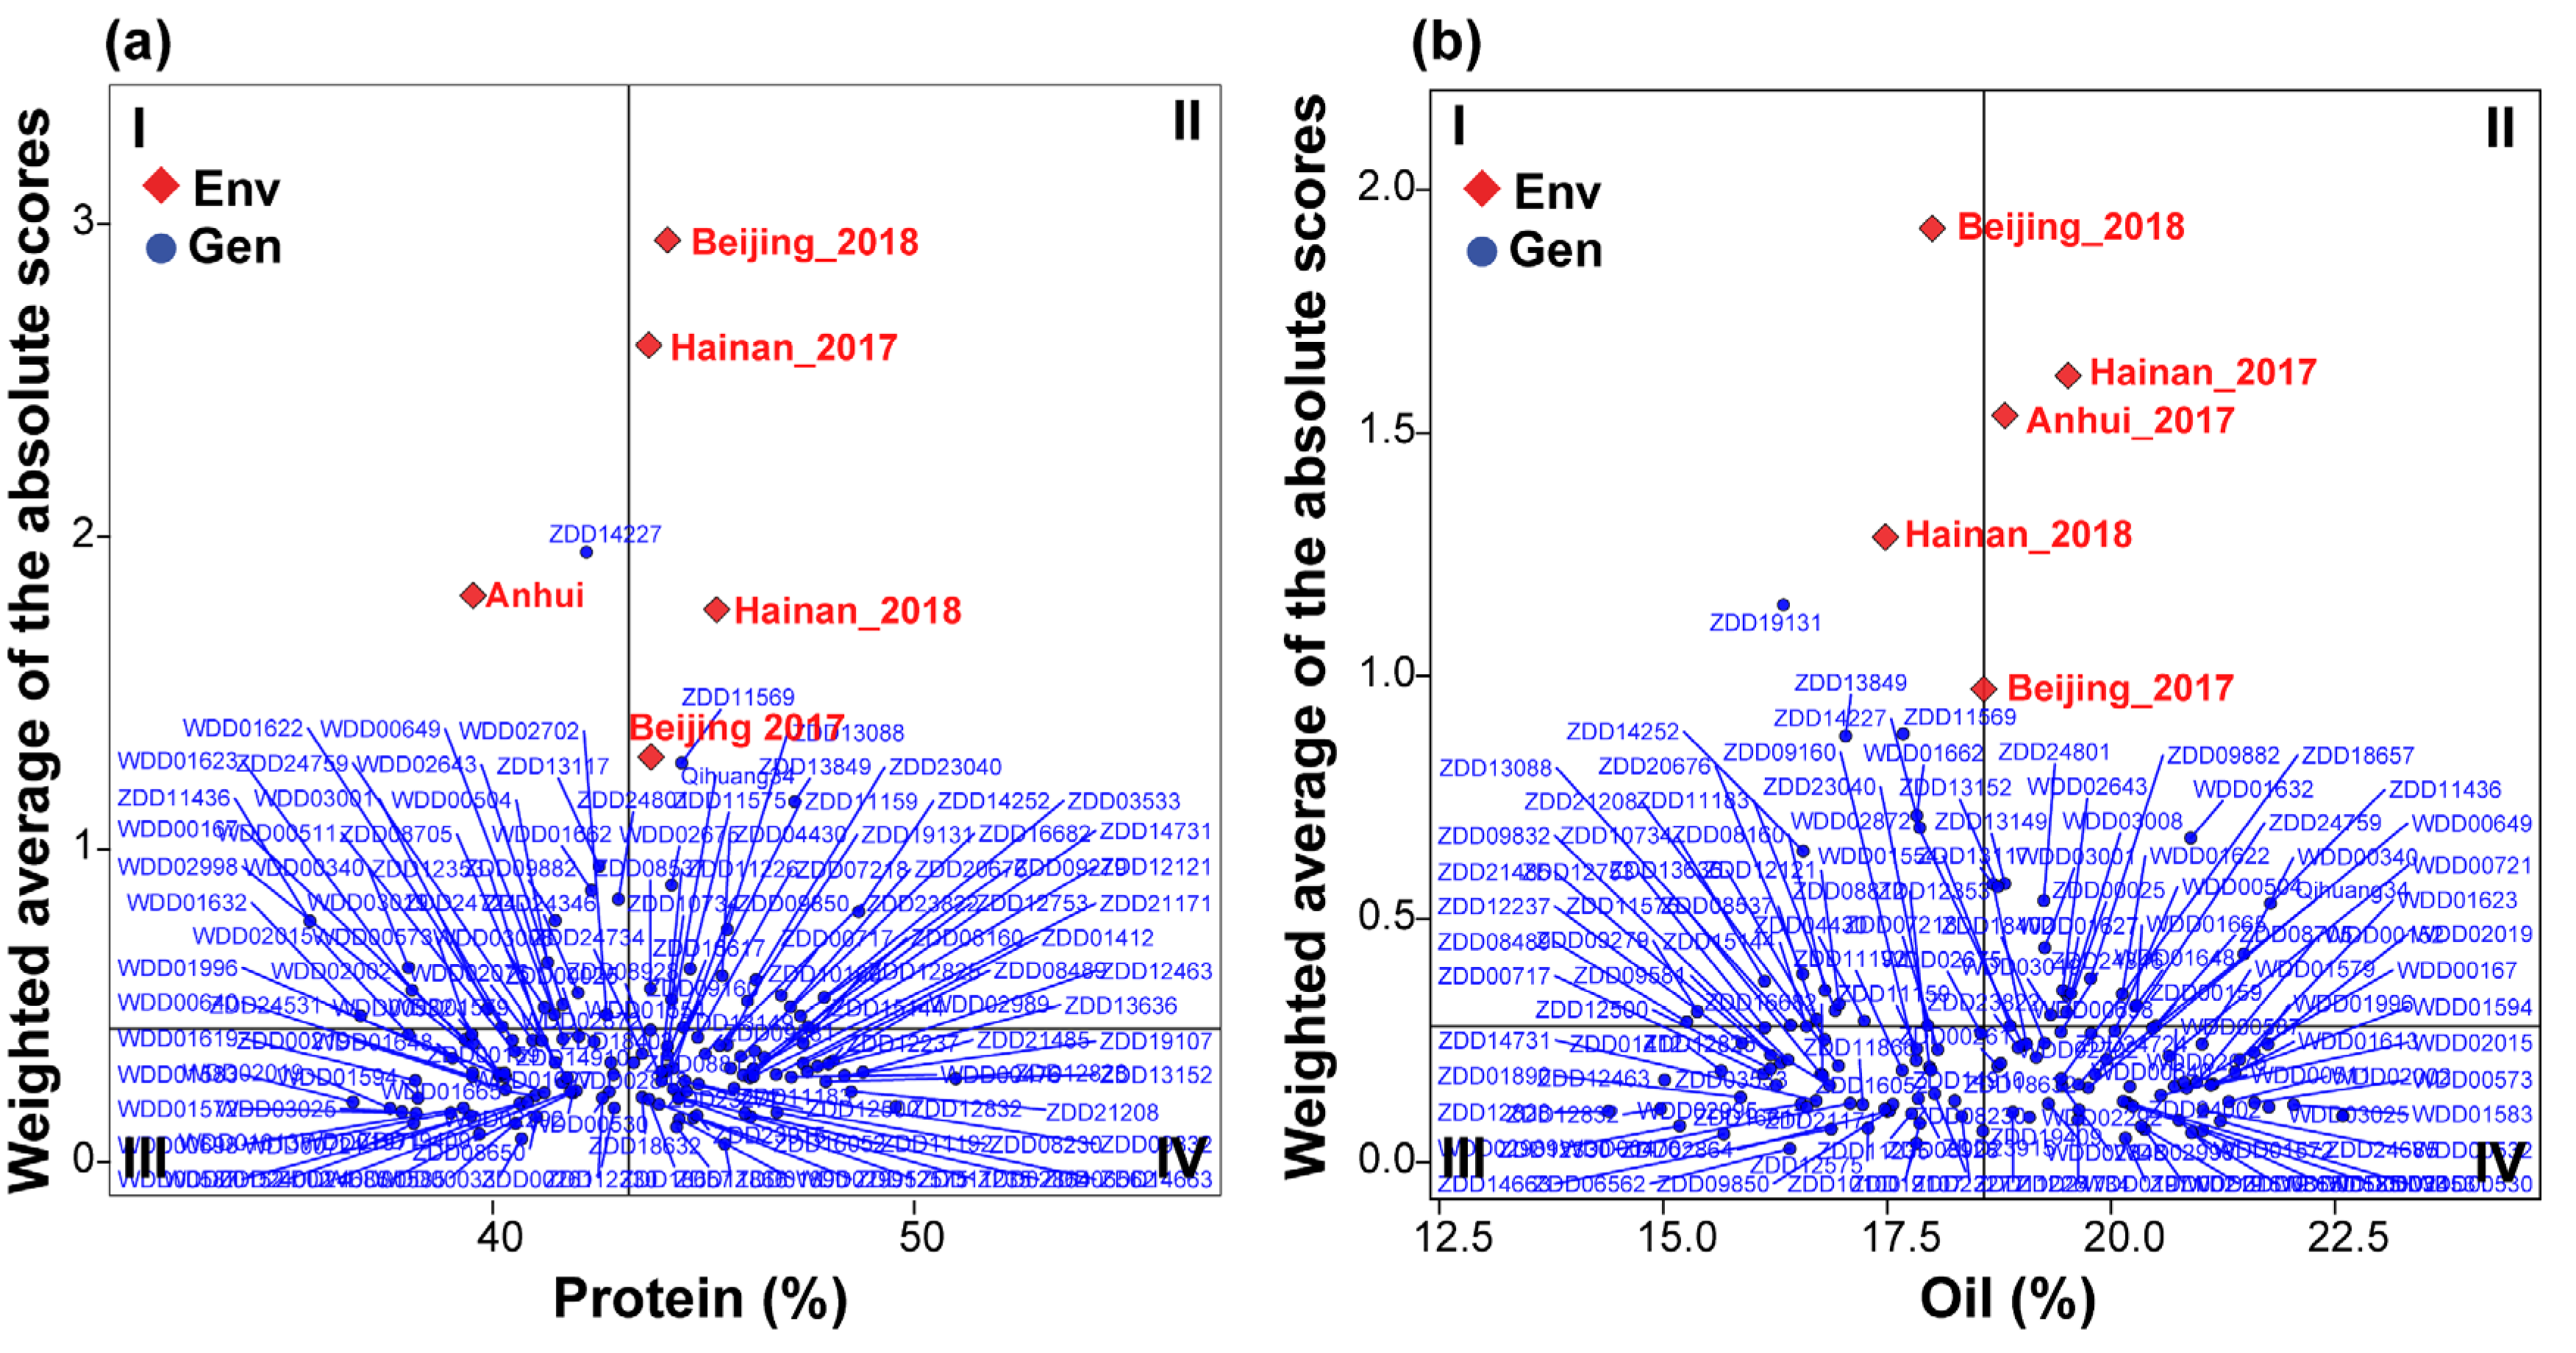
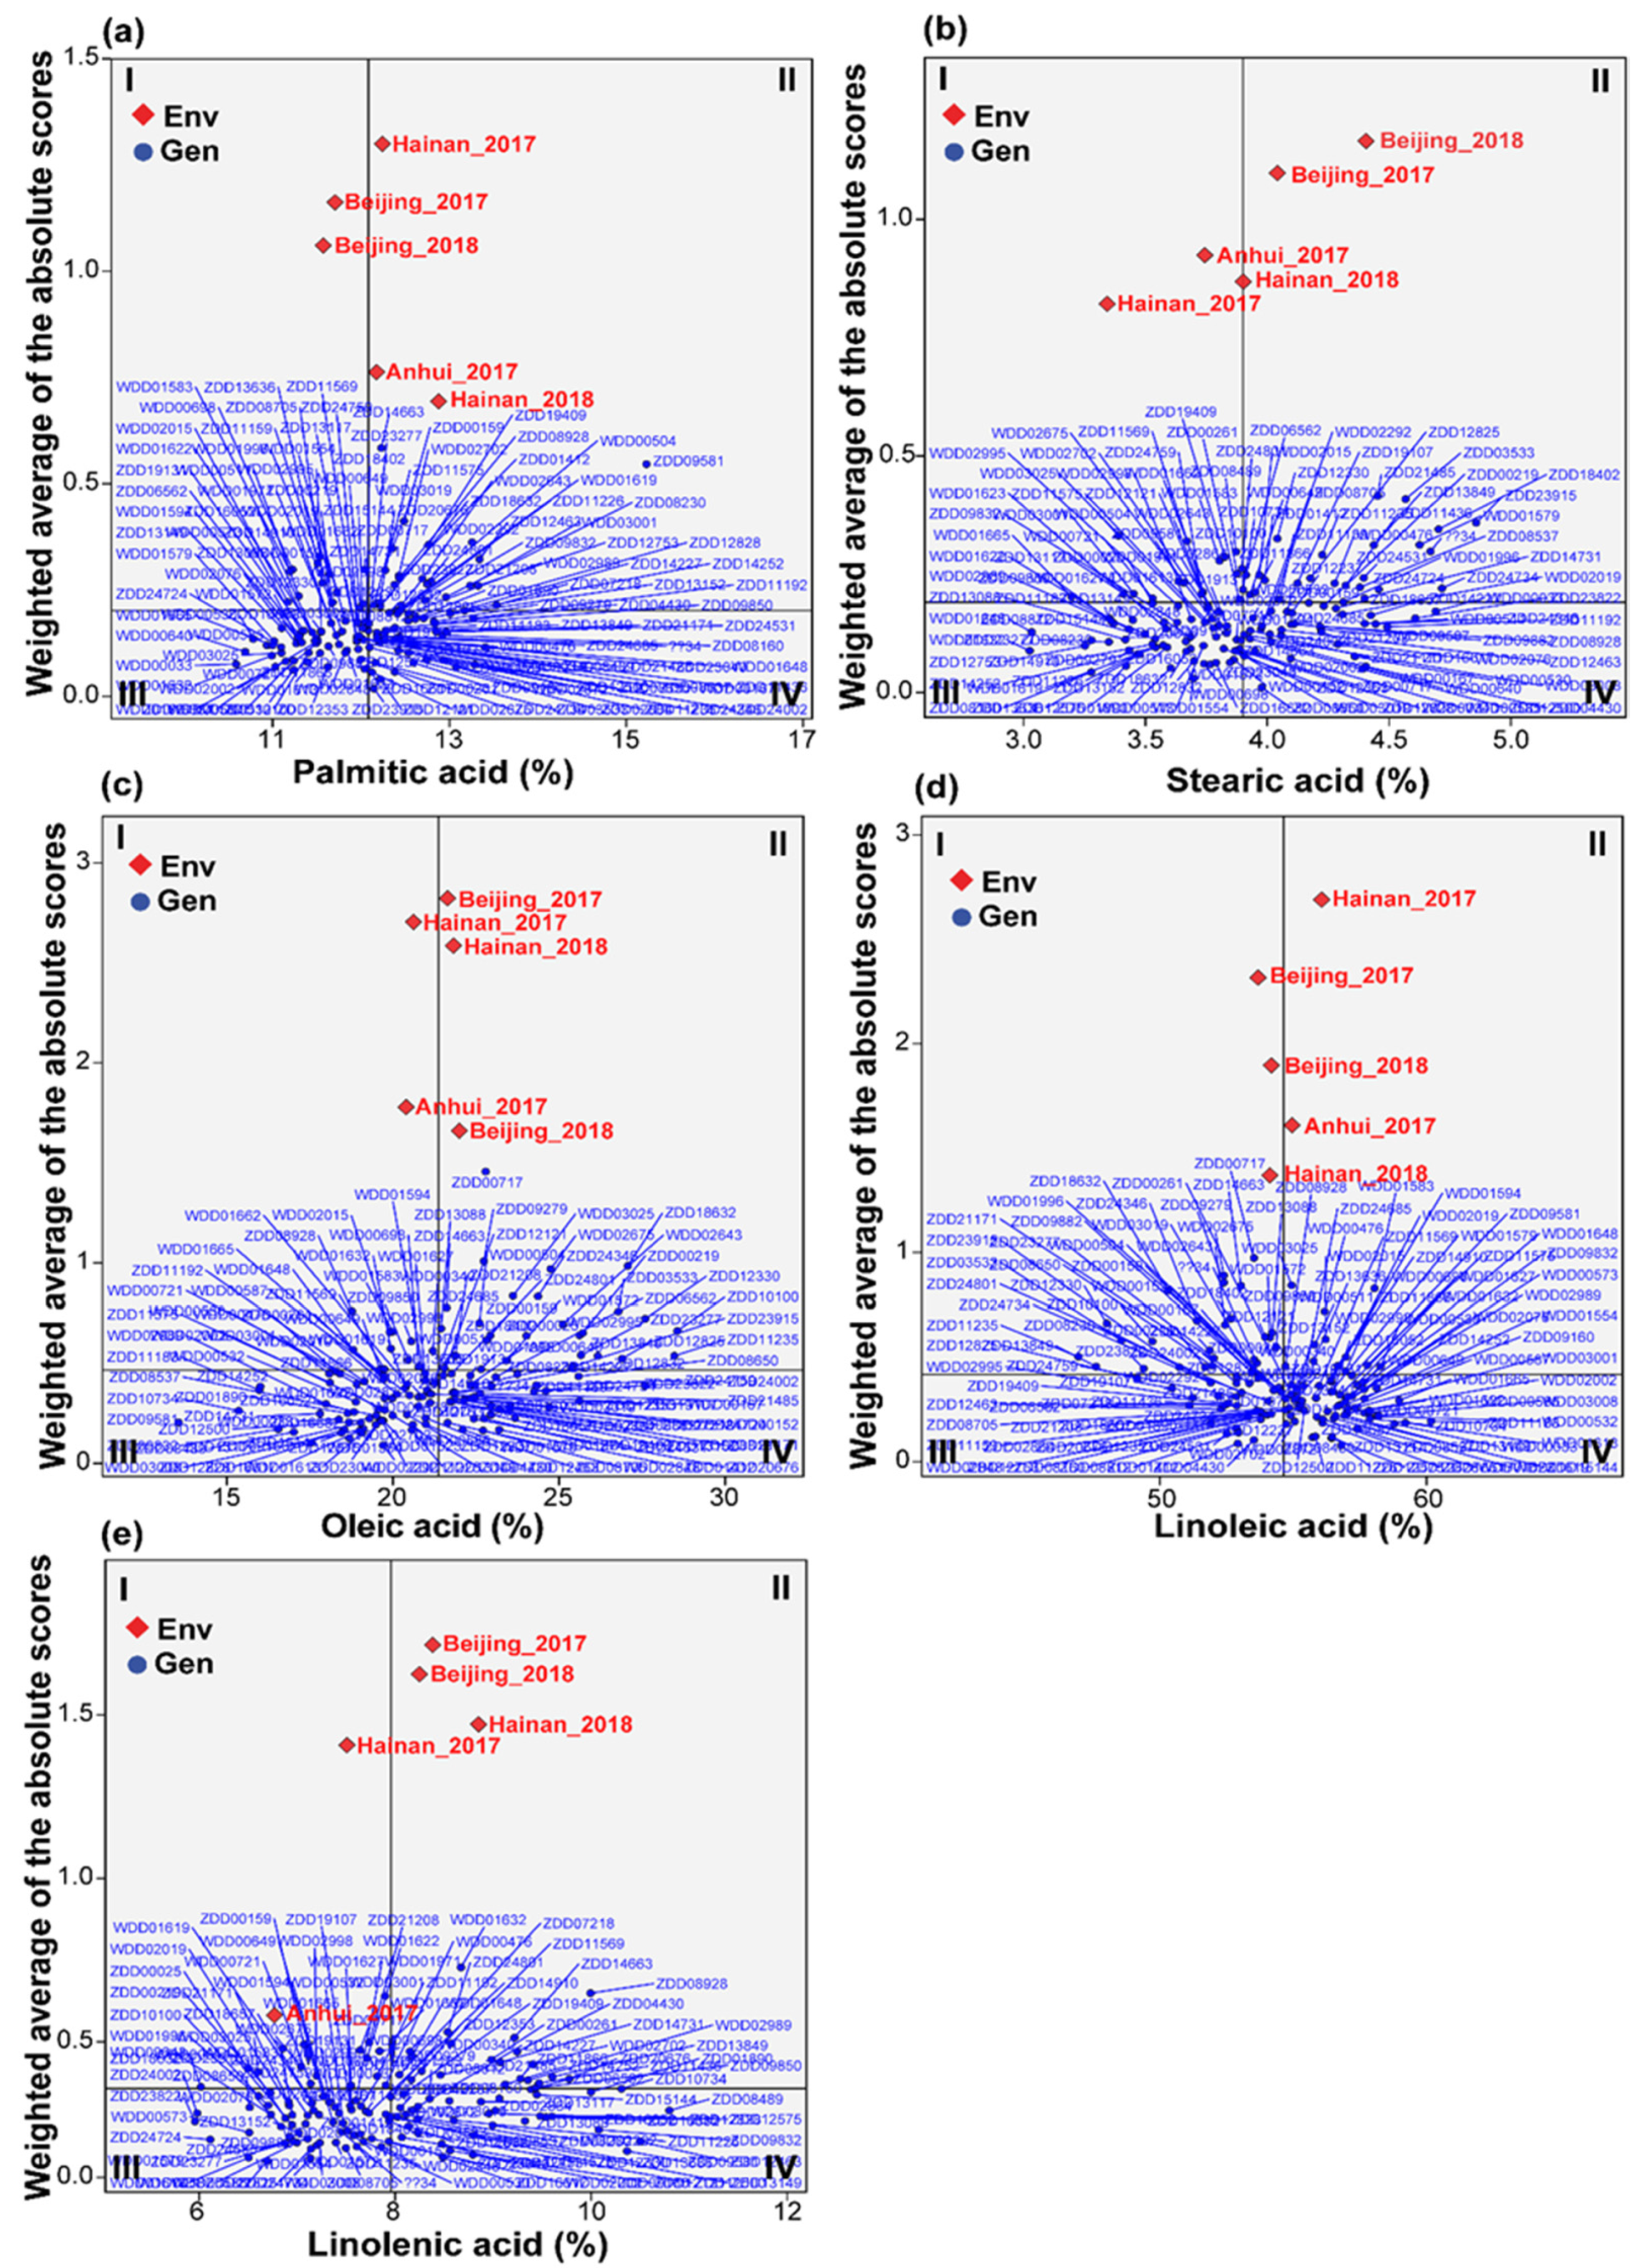
3.5. Multi-Trait Stability Index and Genotype Selection

The ranking of the 135 soybean genotypes based on MTSI values is presented in Table S4. The seven seed composition traits, i.e., protein, oil, palmitic acid, stearic acid, oleic acid, linoleic and linolenic acid were used to estimate the MTSI (Figure 3). Overall, the mean of MTSI values across all genotypes was 7.4, where the lowest value was recorded by ZDD12500 (5.42), while the highest value of MTSI (9.9), was recorded by WDD01583 indicating the most and least stable genotypes, respectively. According to the lowest MTSI values at a selection intensity of 10%, 14 soybean genotypes were identified (Figure 3). The selected genotypes with lowest MTSI values were ZDD12500 (5.42), ZDD04430 (5.62), ZDD24734 (5.78), ZDD12463 (5.8), ZDD16617 (5.92), ZDD18657 (5.93), ZDD08812 (6.03), ZDD12832 (6.07), WDD02292 (6.12), ZDD12828 (6.18), ZDD21171 (6.19), ZDD01412 (6.26), WDD00530 (6.31), and ZDD23040 (6.33). These genotypes represent the best soybean materials in terms of high stability and overall performance among the tested panel of 135 soybeans.
The mean of the selected genotypes (Xs) was higher than the original average (Xo) which included all the 135 soybean genotypes for all the measured traits except for oil, oleic, and linoleic components (Table 3). The selection differential (SD) was positive for all traits, except for oil, oleic acid, and linoleic acid compositions. The heritability ranged from 0.66 for stearic acid to 0.92 for oil content (Table 3). Moreover, the selection gain (SG) was positive for all studied traits except for oil, oleic acid, and linoleic acid compositions. The highest positive SG was 3.41% for protein content, whereas palmitic acid had the lowest SG value of 0.98%, while the negative SG ranged from −4.45% for oil content to −0.18% for linoleic acid content.

4. Discussion

Due to the narrow genetic base revealed by most soybean germplasm analyses [39,40], it became a necessity that breeders, researchers, and producers make such genetic diversity information available to secure genetic advance and improvement of such elite soybean germplasms in the future. Soybean’s genetic diversity may be successfully and extensively conserved by developing germplasm collections on both local and global scales as vital genetic resources [10]. This endeavor could provide a panel of soybean accessions characterized with not only promising high-seed yield but also high-quality characteristics.
To identify genotypes with wider adaptability and test their stability in terms of yield and quality traits, multi-environmental trials are among major foci for soybean breeding programs and are thus critical for such selection [28,41,42,43,44,45,46,47]. The current study showed varied responses of a set of diverse soybean genotypes for seed composition traits under different environments in China, demonstrating the need for determining the magnitude of genotype by environment interactions. The three Chinese agroecological regions where the soybean genotypes were evaluated represent three distinct latitudes with varying climatic variables such as temperature, rainfall, and sunshine duration [36,48]. These ecoregions further demonstrate major growing sites for Chinese soybean germplasm [49]. The current study was conducted using a diverse panel of 135 soybean genotypes to explore their overall stability coupled with high concentrations of seed protein, oil, and five essential fatty acids including palmitic, stearic, oleic, linoleic, and linolenic acids. Several studies have studied the stability of soybean seed compositions across several environments [28,41,42,43,44,45,46,47]. Notably, a great change in the protein, oil, and fatty acids compositions across different environments was also reported in other studies [50,51,52,53] showing a discrepant response among studied soybean genotypes in protein, oil, saturated and unsaturated fatty acids components for environmental factors including latitudes, temperature, and sunshine duration.
Furthermore, different approaches have been exploited to assess the performance of soybean genotypes across several environments such as AMMI [42,43,45,54], GGE biplot [24,47,55,56,57], WAASB index [28,58], and MTSI [28]. In this study, highly statistically significant effects were shown by AMMI analysis on G, E, and GEI for all studied traits except for palmitic and stearic acids. The presence of significant GEI revealed a differential performance among the soybean genotypes across the various testing environment. The AMMI analysis has been widely used to select promising genotypes in terms of stability and superiority across multiple environments [59,60,61,62,63]. The high proportion of genotype effect to total phenotypic variance shown in this study for all measured seed compositions traits, except for stearic acid, was also reported in previous studies [64,65]. This indicates that the phenotypic variance of such traits was highly controlled by genotypic variation more than environmental variation and also provides an opportunity for selection gain [65]. Most of the variation for the majority of the seed composition traits was accounted for by the genotype effect followed by genotype × environment interaction, while the environment effect contributed least, which will lead to higher heritability for such traits [42]. This was evident from the high heritability values observed in this study. In contrast, the higher percentage of GEI effect of seed stearic acid over each of genotype and environment effects indicates lower heritability. These findings are in accordance with the previous studies where environmental variance was dominant [12,44,55,58], showing the importance of the GEI effect on some soybean seed composition traits.
Although, genotype effect dominantly characterized the performance of the soybean accessions in this study, however, the higher significant GEI effect could influence the selection efficiency and, consequently, limits the development of adapted genotypes [66]. In this context, searching for ideal and powerful tools such as WAASB and MTSI to identify the most stable and highly performing soybean genotypes became necessary. The WAASB utilized in this study explains the stability based on the WAASB index which considers the entire GEI variance in identifying the stable genotypes [27]. The WAASB which shows the joint interpretation of mean performance and stability in a bi-dimensional plot comprising of four quadrants was recently suggested to provide an easy and robust tool for selecting stable genotypes with high performance [27]. Genotypes within quadrants I and II are assumed to be unstable, while genotypes within quadrants III and IV are highly stable, revealing lesser variation across all environments. This implies that to select for high and stable genotypes, quadrant IV should be considered, whereas quadrant III is preferable to select genotypes with high stability and low content of specific seed composition. Furthermore, genotypes with WAASB values close to zero are identified as the most stable [67]. Based on the WAASB index used in the current study, two genotypes, ZDD12828 and ZDD12832, showed high stability and high seed protein content. Using the same approach, genotypes WDD01583, WDD03025, and WDD00573 were identified as stable accessions with high seed oil content. Similarly, genotypes with desired and stable fatty acids profile were also identified. The superiority of the quantitative measure of the WAASB index was also reported as an important statistical tool for identifying high performing and broadly adapted genotypes in previous studies on oat [27,67], strawberry [23], and cassava [29]. The WAASB shows potential in quantifying the stability in compounded GEI structures because it uses all the estimated IPCA in the computation of WAASB. Thus, WAASB could be successfully applied in the identification of promising genotypes with highly preferable seed compositions and broad adaptability.
More interestingly, the MTSI has been recently used to help in selecting elite genotypes based on the stability and mean performance of multiple traits [27]. MTSI is assumed based on the genotype–ideotype distance (Euclidian) through the scores obtained in factor analysis [27]. With respect to the criteria of MTSI, the genotypes with lower values of MTSI indicate higher stability based on multiple traits measured. In the current study, setting the selection intensity to 10% has resulted in the identification of 14 soybean genotypes, ZDD12500, ZDD04430, ZDD24734, ZDD12463, ZDD16617, ZDD18657, ZDD08812, ZDD12832, WDD02292, ZDD12832, ZDD21171, ZDD01412, WDD00530, and ZDD23040, that were classified as stable or fairly stable for all the traits. Such selection was fairly justified and precisely evaluated under contrasting environment. In term of feasibility of such index, the selection of these genotypes would greatly help in improving the overall mean performance as indicated by the high percentage of selection differentials. In a recent study on soybean, stable soybean genotypes were identified under drought and salinity conditions based on the criterion of MTSI [28]. The MTSI was further utilized to choose the ideal treatment based on twenty-three traits of strawberry [23]. From the current study, based on multiple traits, the MTSI index can provide a unique, robust, and powerful tool to develop better treatment and/or genotypes helping both breeders and agronomists as also reported previously [23,27,28].

5. Conclusions

Several recent issues have constrained the preservation of soybean genotypes with stable seed quality parameters. Therefore, the stability index of genotype performance has the potential to provide reliable estimates of stability in future studies. The WAASB used in this study identified stable genotypes with a high value of seed composition traits, indicating their potential as a source of desirable protein, oil, and fatty acid compositions. Moreover, the MTSI, which is a novel multivariate approach, was used in the current study to discover stable genotypes with numerous characteristics that are appropriate for wider adaptations. The WAASB and MTSI were proven to be efficient tools in evaluating stability and will maximize the use of resources, thereby contributing to the global sustainability of soybean breeding programs.

Supplementary Materials

The following are available online at www.mdpi.com/article/10.3390/agronomy11112200/s1, Table S1: Information of the 135 soybean accessions used in this study. Table S2: The monthly average of temperature (°C), precipitation (mm), and sunshine (h) for the experimental sites of Hainan, and Beijing in 2017 and 2018, and Anhui in 2017. Table S3: The performance of 135 soybean genotypes for seven seed components for individual environments. Table S4: The ranking of 135 soybean genotypes based on MTSI values.

Author Contributions

Conceptualization, A.M.A. and J.S.; formal analysis, A.M.A.; funding acquisition, B.L. and J.S.; investigation, J.Q.; methodology, A.M.A., M.A., S.Z., A.S.S., J.L., Y.F., Y.L., Y.T., H.H. and S.F.L.; project administration, B.L. and J.S.; resources, S.Z., M.A. and A.S.S.; supervision, J.S.; visualization, B.L.; writing—original draft, A.M.A.; writing—review and editing, A.M.A., B.L. and J.S. All authors have read and agreed to the published version of the manuscript.

Funding

This study was supported by the National Natural Science Foundation of China (No. 31671716 and 32001574), Ministry of Science and Technology of China (2016YFD0100201) and the Chinese Academy of Agricultural Sciences (CAAS) Innovation Project (2060206-2).

Institutional Review Board Statement

Not applicable.

Informed Consent Statement

Not applicable.

Data Availability Statement

Not applicable.

Acknowledgments

We would like to thank Lijuan Qiu from Institute of Crop Sciences, CAAS, for providing us all of soybean accessions and her helpful suggestions regarding the manuscript. We also would like to thank Xiaobo Wang from Anhui Agricultural University for helping in growing soybean accessions in Anhui province of China.

Conflicts of Interest

The authors declare no competing financial interest in regard to this manuscript.

References

  1. Wilcox, J.R.; Shibles, R.M. Interrelationships among seed quality attributes in soybean. Crop Sci. 2001, 41, 11–14. [Google Scholar] [CrossRef]
  2. Wolf, W.J.; Cowan, J. Soybeans as a Food Source; CRC Press: Boca Raton, FL, USA, 1975; ISBN 0878191127. [Google Scholar]
  3. Kim, H.-J.; Ha, B.-K.; Ha, K.-S.; Chae, J.-H.; Park, J.-H.; Kim, M.-S.; Asekova, S.; Shannon, J.G.; Son, C.-K.; Lee, J.-D. Comparison of a high oleic acid soybean line to cultivated cultivars for seed yield, protein and oil concentrations. Euphytica 2015, 201, 285–292. [Google Scholar] [CrossRef]
  4. Boerma, H.R.; Specht, J.E.; Wilson, R.F. Seed Composition. Soybeans Improv. Prod. Uses 2004, 621–677. [Google Scholar] [CrossRef]
  5. Raza, A.; Razzaq, A.; Mehmood, S.S.; Zou, X.; Zhang, X.; Lv, Y.; Xu, J. Impact of climate change on crops adaptation and strategies to tackle its outcome: A review. Plants 2019, 8, 34. [Google Scholar] [CrossRef] [Green Version]
  6. Adaawen, S. Understanding climate change and drought perceptions, impact and responses in the rural ravannah, West Africa. Atmosphere 2021, 12, 594. [Google Scholar] [CrossRef]
  7. Chaudhary, K.R.; Wu, J. Stability analysis for yield and seed quality of soybean [Glycine max (l.) Merril] across different environments in Eastern South Dakota. Conf. Appl. Stat. Agric. 2012. [Google Scholar] [CrossRef] [Green Version]
  8. Ray, C.L.; Shipe, E.R.; Bridges, W.C. Planting date influence on soybean agronomic traits and seed composition in modified fatty acid breeding lines. Crop Sci. 2008, 48, 181–188. [Google Scholar] [CrossRef]
  9. Prado, E.E.D.; Hiromoto, D.M.; Godinho, V.D.P.C.; Utumi, M.M.; Ramalho, A.R. Adaptabilidade e estabilidade de cultivares de soja em cinco épocas de plantio no cerrado de Rondônia. Pesqui. Agropecuária Bras. 2001, 36, 625–635. [Google Scholar] [CrossRef] [Green Version]
  10. Sudarić, A.; Matoša Kočar, M.; Duvnjak, T.; Zdunić, Z.; Markulj Kulundžić, A. Improving Seed Quality of Soybean Suitable for Growing in Europe. In Soybean for Human Consumption and Animal Feed; IntechOpen: London, UK, 2020; pp. 416–680. [Google Scholar]
  11. Voss-Fels, K.P.; Stahl, A.; Hickey, L.T. Q&A: Modern crop breeding for future food security. BMC Biol. 2019, 17, 1–7. [Google Scholar]
  12. Gurmu, F.; Mohammed, H.; Alemaw, G. Genotype x environment interactions and stability of soybean for grain yield and nutrition quality. Afr. Crop Sci. J. 2009, 17. [Google Scholar] [CrossRef]
  13. Tolorunse, K.D.; Gana, A.S.; Bala, A.; Sangodele, E.A. Yield stability studies of soybean (Glycine max (L.) Merrill) under rhizobia inoculation in the savanna region of Nigeria. Plant Breed. 2018, 137, 262–270. [Google Scholar] [CrossRef]
  14. Becker, H.C.; Leon, J. Stability analysis in plant breeding. Plant Breed. 1988, 101, 1–23. [Google Scholar] [CrossRef]
  15. Sharma, P.K.; Gupta, P.K.; Govila, O.P. AMMI analysis of a pearl millet yield trial. Indian J. Genet. Plant Breed. 1998, 58, 183–192. [Google Scholar]
  16. Chandrakar, P.K.; Shrivastava, R.; Agrawal, S.K.; Rao, S.S. Stability analysis of soybean (Glycine max L. merrill) varieties in rice zone of Madhya Pradesh. J. Oilseeds Res. 1998, 15, 247–249. [Google Scholar]
  17. Poysa, V.; Woodrow, L. Stability of soybean seed composition and its effect on soymilk and tofu yield and quality. Food Res. Int. 2002, 35, 337–345. [Google Scholar] [CrossRef]
  18. Ramana, M.V.; Satyanarayana, A. Stability of yield and its components in soybean (Glycine max L. Merrill). J. Oilseeds Res. 2005, 22, 18–21. [Google Scholar]
  19. Arslanoglu, F.; Aytac, S.; Oner, E.K. Effect of genotype and environment interaction on oil and protein content of soybean (Glycine max (L.) Merrill) seed. Afr. J. Biotechnol. 2011, 10, 18409–18417. [Google Scholar] [CrossRef]
  20. Balešević-Tubić, S.; Đorđević, V.; Miladinović, J.; Đukić, V.; Tatić, M. Stability of soybean seed composition. Genetika 2011, 43, 217–227. [Google Scholar] [CrossRef]
  21. Akhter, M.; Sneller, C.H. Yield and yield components of early maturing soybean genotypes in the mid-south. Crop Sci. 1996, 36, 877–882. [Google Scholar] [CrossRef]
  22. Malek, M.A.; Rafii, M.Y.; Afroz, S.S.; Nath, U.K.; Mondal, M. Morphological characterization and assessment of genetic variability, character association, and divergence in soybean mutants. Sci. World J. 2014, 2014, 968796. [Google Scholar] [CrossRef] [Green Version]
  23. Olivoto, T.; Diel, M.I.; Schmidt, D.; Lúcio, A.D. Multivariate analysis of strawberry experiments: Where are we now and where can we go? bioRxiv 2021, 2012–2020. [Google Scholar] [CrossRef]
  24. Dalló, S.C.; Zdziarski, A.D.; Woyann, L.G.; Milioli, A.S.; Zanella, R.; Conte, J.; Benin, G. Across year and year-by-year GGE biplot analysis to evaluate soybean performance and stability in multi-environment trials. Euphytica 2019, 215, 1–12. [Google Scholar] [CrossRef]
  25. Jarquin, D.; Howard, R.; Crossa, J.; Beyene, Y.; Gowda, M.; Martini, J.W.R.; Covarrubias Pazaran, G.; Burgueño, J.; Pacheco, A.; Grondona, M. Genomic prediction enhanced sparse testing for multi-environment trials. G3 Genes Genomes Genet. 2020, 10, 2725–2739. [Google Scholar]
  26. Woyann, L.G.; Meira, D.; Matei, G.; Zdziarski, A.D.; Dallacorte, L.V.; Madella, L.A.; Benin, G. Selection indexes based on linear-bilinear models applied to soybean breeding. Agron. J. 2020, 112, 175–182. [Google Scholar] [CrossRef]
  27. Olivoto, T.; Lúcio, A.D.C.; da Silva, J.A.G.; Sari, B.G.; Diel, M.I. Mean performance and stability in multi-environment trials II: Selection based on multiple traits. Agron. J. 2019, 111, 2961–2969. [Google Scholar] [CrossRef]
  28. Zuffo, A.M.; Steiner, F.; Aguilera, J.G.; Teodoro, P.E.; Teodoro, L.P.R.; Busch, A. Multi-trait stability index: A tool for simultaneous selection of soya bean genotypes in drought and saline stress. J. Agron. Crop Sci. 2020, 206, 815–822. [Google Scholar] [CrossRef]
  29. Koundinya, A.V.V.; Ajeesh, B.R.; Hegde, V.; Sheela, M.N.; Mohan, C.; Asha, K.I. Genetic parameters, stability and selection of cassava genotypes between rainy and water stress conditions using AMMI, WAAS, BLUP and MTSI. Sci. Hortic. 2021, 281, 109949. [Google Scholar]
  30. Bornhofen, E.; Todeschini, M.H.; Stoco, M.G.; Madureira, A.; Marchioro, V.S.; Storck, L.; Benin, G. Wheat yield improvements in Brazil: Roles of genetics and environment. Crop Sci. 2018, 58, 1082–1093. [Google Scholar] [CrossRef]
  31. Mohammadi, R.; Armion, M.; Zadhasan, E.; Ahmadi, M.M.; Amri, A. The use of AMMI model for interpreting genotype× environment interaction in durum wheat. Exp. Agric. 2018, 54, 670–683. [Google Scholar] [CrossRef]
  32. Nowosad, K.; Liersch, A.; Popławska, W.; Bocianowski, J. Genotype by environment interaction for seed yield in rapeseed (Brassica napus L.) using additive main effects and multiplicative interaction model. Euphytica 2016, 208, 187–194. [Google Scholar] [CrossRef]
  33. Olivoto, T. Stability Analysis in R Using the WAASB Index. 2019. Available online: https://doi.org/10.13140/RG.2.2.32425.75369/1 (accessed on 21 May 2021).
  34. Hymowitz, T.; Dudley, J.W.; Collins, F.I.; Brown, C.M. Estimations of protein and oil concentration in corn, soybean, and oat seed by near-infrared light reflectance. Crop Sci. 1974, 14, 713–715. [Google Scholar] [CrossRef]
  35. Fan, S.; Li, B.; Yu, F.; Han, F.; Yan, S.; Wang, L.; Sun, J. Analysis of additive and epistatic quantitative trait loci underlying fatty acid concentrations in soybean seeds across multiple environments. Euphytica 2015, 206, 689–700. [Google Scholar] [CrossRef] [Green Version]
  36. Abdelghany, A.M.; Zhang, S.; Azam, M.; Shaibu, A.S.; Feng, Y.; Li, Y.; Tian, Y.; Hong, H.; Li, B.; Sun, J. Profiling of seed fatty acid composition in 1025 Chinese soybean accessions from diverse ecoregions. Crop J. 2020, 8, 635–644. [Google Scholar] [CrossRef]
  37. Olivoto, T.; Lúcio, A.D. metan: An R package for multi—Environment trial analysis. Methods Ecol. Evol. 2020, 11, 783–789. [Google Scholar] [CrossRef]
  38. R Core Team. R: A Language and Environment for Statistical Computing; Version 4.0.3; R Foundation for Statistical Computing: Vienna, Austria, 2020. [Google Scholar]
  39. Zhang, G.; Xu, S.; Mao, W.; Hu, Q.; Gong, Y. Determination of the genetic diversity of vegetable soybean [Glycine max (L.) Merr.] using EST-SSR markers. J. Zhejiang Univ. Sci. B 2013, 14, 279–288. [Google Scholar] [CrossRef] [Green Version]
  40. Perić, V.; Nikolić, A.; Babić, V.; Sudarić, A.; Srebrić, M.; Đorđević, V.; Mladenović-Drinić, S. Genetic relatedness of soybean genotypes based on agromorphological traits and RAPD markers. Genetika-Belgrade 2014, 46, 839–854. [Google Scholar] [CrossRef]
  41. Adie, M.M.; Krisnawati, A. Soybean yield stability in eight locations and its potential for seed oil source in Indonesia. Energy Procedia 2015, 65, 223–229. [Google Scholar] [CrossRef] [Green Version]
  42. Sudarić, A.; Šimić, D.; Vratarić, M. Characterization of genotype by environment interactions in soybean breeding programmes of southeast Europe. Plant Breed. 2006, 125, 191–194. [Google Scholar] [CrossRef]
  43. Bhartiya, A.; Aditya, J.P.; Singh, K.; Purwar, J.P.; Agarwal, A. AMMI & GGE biplot analysis of multi environment yield trial of soybean in North Western Himalayan state Uttarakhand of India. Legum. Res. Int. J. 2017, 40, 306–312. [Google Scholar]
  44. Bhartiya, A.; Aditya, J.P.; Kumari, V.; Kishore, N.; Purwar, J.P.; Agrawal, A.; Kant, L. GGE biplot & ammi analysis of yield stability in multi-environment trial of soybean [Glycine max (L.) Merrill] genotypes under rainfed condition of north western Himalayan hills. Indian J. Genet. Plant Breed. 2017, 27, 227–238. [Google Scholar]
  45. Mwiinga, B.; Sibiya, J.; Kondwakwenda, A.; Musvosvi, C.; Chigeza, G. Genotype x environment interaction analysis of soybean (Glycine max (L.) Merrill) grain yield across production environments in Southern Africa. F. Crop. Res. 2020, 256, 107922. [Google Scholar] [CrossRef]
  46. Amira, J.O.; Ojo, D.K.; Ariyo, O.J.; Oduwaye, O.A.; Ayo-Vaughan, M.A. Relative discriminating powers of GGE and AMMI models in the selection of tropical soybean genotypes. Afr. Crop Sci. J. 2013, 21, 67–73. [Google Scholar]
  47. Asfaw, A.; Alemayehu, F.; Gurum, F.; Atnaf, M. AMMI and SREG GGE biplot analysis for matching varieties onto soybean production environments in Ethiopia. Sci. Res. Essays 2009, 4, 1322–1330. [Google Scholar]
  48. Azam, M.; Zhang, S.; Abdelghany, A.M.; Shaibu, A.S.; Feng, Y.; Li, Y.; Tian, Y.; Hong, H.; Li, B.; Sun, J. Seed isoflavone profiling of 1168 soybean accessions from major growing ecoregions in China. Food Res. Int. 2020, 130. [Google Scholar] [CrossRef]
  49. Sedivy, E.J.; Wu, F.; Hanzawa, Y. Soybean domestication: The origin, genetic architecture and molecular bases. New Phytol. 2017, 214, 539–553. [Google Scholar] [CrossRef] [Green Version]
  50. Primomo, V.S.; Falk, D.E.; Ablett, G.R.; Tanner, J.W.; Rajcan, I. Genotype x environment interactions, stability, and agronomic performance of soybean with altered fatty acid profiles. Crop Sci. 2002, 42, 37–44. [Google Scholar] [CrossRef]
  51. Assefa, Y.; Bajjalieh, N.; Archontoulis, S.; Casteel, S.; Davidson, D.; Kovács, P.; Naeve, S.; Ciampitti, I.A. Spatial characterization of soybean yield and quality (amino acids, oil, and protein) for United States. Sci. Rep. 2018, 8, 14653. [Google Scholar] [CrossRef] [Green Version]
  52. Yaklich, R.W.; Vinyard, B.; Camp, M.; Douglass, S. Analysis of seed protein and oil from soybean northern and southern region uniform tests. Crop Sci. 2002, 42, 1504–1515. [Google Scholar] [CrossRef]
  53. Wu, T.; Yang, X.; Sun, S.; Wang, C.; Wang, Y.; Jia, H.; Man, W.; Fu, L.; Song, W.; Wu, C. Temporal–spatial characterization of seed proteins and oil in widely grown soybean cultivars across a century of breeding in China. Crop Sci. 2017, 57, 748–759. [Google Scholar] [CrossRef]
  54. Liu, Z.; Fan, X.; Huang, W.; Yang, J.; Zheng, Y.; Wang, S.; Qiu, L. Stability analysis of seven agronomic traits for soybean [(Glycine max (L.) Merr.] Tokachi nagaha and its derived cultivars using the AMMI model. Plant Prod. Sci. 2017, 20, 499–506. [Google Scholar] [CrossRef] [Green Version]
  55. Nataraj, V.; Pandey, N.; Ramteke, R.; Verghese, P.; Reddy, R.; Onkarappa, T.; Mehtre, S.P.; Gupta, S.; Satpute, G.K.; Mohan, Y. GGE biplot analysis of vegetable type soybean genotypes under multi-environmental conditions in India. J. Environ. Biol. 2021, 42, 247–253. [Google Scholar] [CrossRef]
  56. Sousa, L.B.; Hamawaki, O.T.; Nogueira, A.P.O.; Batista, R.O.; Oliveira, V.M.; Hamawaki, R.L. Evaluation of soybean lines and environmental stratification using the AMMI, GGE biplot, and factor analysis methods. Genet. Mol. Res. 2015, 14, 12660–16674. [Google Scholar] [CrossRef] [PubMed]
  57. Cheelo, P.; Lungu, D.; Mwala, M. GGE biplot analysis for identification of ideal soybean [Glycine max L. Merrill] test and production locations in Zambia. J. Exp. Agric. Int. 2017, 1–15. [Google Scholar] [CrossRef]
  58. Nataraj, V.; Bhartiya, A.; Singh, C.P.; Devi, H.N.; Deshmukh, M.P.; Verghese, P.; Singh, K.; Mehtre, S.P.; Kumari, V.; Maranna, S.; et al. WAASB based stability analysis and simultaneous selection for grain yield and early maturity in soybean. Agron. J. 2021, 113, 3089–3099. [Google Scholar] [CrossRef]
  59. Hagos, H.G.; Abay, F. AMMI and GGE biplot analysis of bread wheat genotypes in the northern part of Ethiopia. J. Plant Breed. Genet. 2013, 1, 12–18. [Google Scholar]
  60. Mahmodi, N.; Yaghotipoor, A.; Farshadfar, E. AMMI stability value and simultaneous estimation of yield and yield stability in bread wheat (Triticum aestivum L.). Aust. J. Crop Sci. 2011, 5, 1837–1844. [Google Scholar]
  61. Yan, W.; Kang, M.S.; Ma, B.; Woods, S.; Cornelius, P.L. GGE biplot vs. AMMI analysis of genotype-by-environment data. Crop Sci. 2007, 47, 643–653. [Google Scholar] [CrossRef]
  62. Sneller, C.H.; Dombek, D. Comparing soybean cultivar ranking and selection for yield with AMMI and full-data performance estimates. Crop Sci. 1995, 35, 1536–1541. [Google Scholar] [CrossRef]
  63. Ndhlela, T.; Herselman, L.; Magorokosho, C.; Setimela, P.; Mutimaamba, C.; Labuschagne, M. Genotype× environment interaction of maize grain yield using AMMI biplots. Crop Sci. 2014, 54, 1992–1999. [Google Scholar] [CrossRef]
  64. Shilpashree, N.; Devi, S.N.; Manjunathagowda, D.C.; Muddappa, A.; Abdelmohsen, S.A.M.; Tamam, N.; Elansary, H.O.; El-Abedin, T.K.Z.; Abdelbacki, A.M.M.; Janhavi, V. Morphological characterization, variability and diversity among vegetable soybean (Glycine max L.) genotypes. Plants 2021, 10, 671. [Google Scholar] [CrossRef] [PubMed]
  65. Whaley, R.; Eskandari, M. Genotypic main effect and genotype-by-environment interaction effect on seed protein concentration and yield in food-grade soybeans (Glycine max (L.) Merrill). Euphytica 2019, 215, 33. [Google Scholar] [CrossRef]
  66. Rao, P.S.; Reddy, P.S.; Rathore, A.; Reddy, B.V.S.; Panwar, S. Application GGE biplot and AMMI model to evaluate sweet sorghum (Sorghum bicolor) hybrids for genotype× environment interaction and seasonal adaptation. Indian J. Agric. Sci. 2011, 81, 438–444. [Google Scholar]
  67. Olivoto, T.; Lúcio, A.D.C.; da Silva, J.A.G.; Marchioro, V.S.; de Souza, V.Q.; Jost, E. Mean performance and stability in multi-environment trials I: Combining features of AMMI and BLUP techniques. Agron. J. 2019, 111, 2949–2960. [Google Scholar] [CrossRef]
Figure 1. Biplot showing the performance vs. stability of 135 soybean genotypes for protein content (a) and oil content (b). The x-axis shows the arithmetic mean for each genotype × environment interaction. The y-axis shows the weighted average of absolute scores from the singular value decomposition of the matrix of best linear unbiased predictions for the genotype × environment interaction effects.
Agronomy 11 02200 g001
Figure 2. Biplots showing the performance vs. stability of 135 soybean genotypes for palmitic acid (a), stearic acid (b), oleic acid (c), linoleic acid (d), and linolenic acid (e). The x-axis shows the arithmetic mean for each genotype × environment interaction. The y-axis shows the weighted average of absolute scores from the singular value decomposition of the matrix of best linear unbiased predictions for the genotype × environment interaction effects.
Agronomy 11 02200 g002
Figure 3. Genotype ranking and selected genotypes for the multi-trait stability index (MTSI) of 135 soybean genotypes based on seven seed composition traits. The selected genotypes are shown in blue color and the blue circle represents the cut-point according to the selection differential of 10%.
Agronomy 11 02200 g003
Table 1. Combined analysis of variance for seven seed compositions of 135 genotypes across the five environments.
SourceDfMean Squares
Protein ContentOil ContentPalmitic AcidStearic AcidOleic AcidLinoleic AcidLinolenic Acid
ENV41970 **288.0074.9 ns66 ns255 **404 **256 **
REP(ENV)1049.4 **49.1044.7 **32.6 **47 **70.4 **60.4 **
GEN134152 **54.407.78 **2.16 **113 **98.8 **16.2 **
GEN × ENV53618.3 **4.501 **0.74 **25.1 **17 **2.78 **
Residuals13400.050.090.090.090.080.080.09
ENV: environment; REP: replicate; GEN: genotypes; **: significant at p < 0.01 level of probability; ns: not significant.
Table 2. Additive main effect and multiplicative interaction (AMMI) analysis of variance for seven seed components for 135 soybean genotypes evaluated in five environments.
SourceDfMean Squares
ProteinOilPalmitic AcidStearic
Acid
Oleic AcidLinoleic AcidLinolenic Acid
ENV41970 ***282 **72.2 ns64.9 ns253 **415 **248 *
REP(ENV)1049.4 ***45.9 ***47.6 ***31.6 ***47 ***68.8 ***61.7 ***
GEN134152 ***53.2 ***7.57 ***2.16 ***112 ***97.8 ***16.5 ***
GEN × ENV53618.3 ***4.36 ***0.886 ***0.63 ***25.1 ***16.9 ***2.62 ***
IPCA1†13733.6 ***7.93 ***1.53 ***1.16 ***43.8 ***27.9 ***5.03 ***
IPCA213518.8 ***4.07 ***0.825 ***0.594 ***22 ***15.6 ***2.7 ***
IPCA313311.6 ***3.09 ***0.705 ***0.461 ***19.8 ***12.2 ***1.54 ***
IPCA41318.39 ***2.2 ***0.457 ***0.283 ***14.1 ***11.4 ***1.13 ***
Residuals13400.003210.0010.005760.00220.002380.00001480.0092
Total256018.95.231.070.60316.913.12.59
ENV: environment; REP: replicate; GEN: genotypes; IPCA, interaction principal component axis. *, **, *** significant at p < 0.05, p < 0.01, and p < 0.001 level of probability, respectively; ns: not significant.
Table 3. Estimates of selection differential, selection gain, and heritability based on MTSI for seven seed compositions evaluated for 135 soybean genotypes across five environments.
TraitFactorXoXsSDSD (%)SGSG (%)h2
ProteinFA 144.1461.934.371.693.840.88
OilFA 119.418.4−0.941−4.86−0.86−4.450.92
Palmitic acidFA 112.9130.1451.130.130.980.87
Linolenic acidFA 18.769.010.2462.810.202.330.83
Stearic acidFA 24.694.850.1563.330.102.190.66
Oleic acidFA 222.221.8−0.386−1.74−0.30−1.350.78
Linoleic acidFA 355.455.3−0.12−0.216−0.099−0.180.83
Xo: Overall mean of genotypes; Xs: Mean of the selected genotypes; SD: Selection differential; SG: Selection gain or impact; h2, heritability.
Publisher’s Note: MDPI stays neutral with regard to jurisdictional claims in published maps and institutional affiliations.

