Article

Identification of Soybean Yield QTL in Irrigated and Rain-Fed Environments

1
Department of Crop and Soil Sciences, College of Agriculture & Environmental Sciences, University of Georgia, Athens, GA 30602, USA
2
Department of Horticulture, College of Agriculture and Life Sciences, Chungnam National University, Daejeon 34134, Korea
3
Department of Smart Agriculture Systems, College of Agriculture and Life Sciences, Chungnam National University, Daejeon 34134, Korea
4
Department of Crop Science, College of Agriculture and Life Sciences, Chungnam National University, Daejeon 34134, Korea
5
Soybean Nitrogen Fixation Unit, USDA-ARS, Raleigh, NC 27607, USA
6
Department of Crop and Soil Sciences, College of Agriculture and Life Sciences, North Carolina State University, Raleigh, NC 27695, USA
7
Division of Plant Science, College of Agriculture, Food & Natural Resources, University of Missouri, Fisher Delta Research Center, Portageville, MO 63873, USA
8
Georgia Seed Development, Athens, GA 30605, USA
*
Author to whom correspondence should be addressed.
These authors contributed equally to this work.
Agronomy 2021, 11(11), 2207; https://doi.org/10.3390/agronomy11112207
Submission received: 11 September 2021 / Revised: 24 October 2021 / Accepted: 27 October 2021 / Published: 30 October 2021
(This article belongs to the Special Issue Molecular Marker Assisted Crop Breeding)

Abstract

:
Drought is the primary abiotic stress that limits yield of soybean (Glycine max (L.) Merr.). The study aimed to identify yield-related quantitative trait loci (QTLs) in soybeans using a population of 160 F4-derived lines from ‘Hutcheson’ × PI 471938 crosses, which were cultivated under rain-fed and irrigated conditions. Seed yield was determined based on a total of nine irrigated and five rain-fed environments over two years. Twenty and twenty-seven SSR markers associated with yield (p ≤ 0.05) were identified in the irrigated and rain-fed environments, respectively. Four markers accounted for 22% of the yield variation in the irrigated environments (IR-YLD) and five markers explained 34% of the yield variation in the rain-fed environments (RF-YLD). Two independent IR-YLD and RF-YLD QTLs on chromosome (Chr) 13 (LG-F) were mapped to the Satt395-Sat_074 interval (4.2 cM) and near Sat_375 (3.0 cM), which explained 8% (LOD = 2.6) and 17% (LOD = 5.5) of the yield variation, respectively. The lines homozygous for the Hutcheson allele at the IR-YLD QTL linked to Sat_074 averaged 100 kg ha−1 higher yield than the lines homozygous for the PI 471938 allele. At two independent RF-YLD QTLs on Chr 13 and Chr 17, the lines homozygous for the PI 471938 alleles were 74 to 101 kg ha−1 higher in yield than the lines homozygous for the Hutcheson alleles. Three of the five significant SSR markers associated with RF-YLD were located in a genomic region known for canopy-wilting QTLs, in which the favorable alleles were inherited from PI 471938. The identification of yield-QTLs under the respective rain-fed and irrigated environments provides knowledge regarding differential responses of yield under different irrigation conditions, which will be helpful in developing high-yielding soybean cultivars.

1. Introduction

Yield improvement is one of the major goals of many domesticated crop breeding programs. Yield is a complex trait controlled by many physiological processes, such as plant height (r = 0.59) and maturity (r = 0.48), and various genetic or environmental factors [1,2,3]. A yield-related trait is characterized by having relatively low heritability, given that yield is influenced to a greater extent by environmental factors, which renders many breeding efforts challenging [4,5]. Among the environmental factors that affect soybean crops, drought is the primary abiotic stress that limits yield. Additionally, yield is a complex quantitative trait that is influenced by other abiotic and biotic factors including wilting, salinity, soil fertility, and soybean aphid and nematodes [6,7,8,9]. Abiotic stresses such as drought and salinity create osmotic stress, reactive oxygen species (ROS), and oxidative damage, decrease photosynthetic activities, create nutrient imbalance, and damage proteins and DNA in plant cells, thus affecting the growth and productivity of crops [10,11,12,13,14,15]. Therefore, selected lines or cultivars with high yield performance in irrigated environments can be further improved by the introgression of genes associated with high yield under conditions of drought stress [4].
The genetic component of soybean yield has been investigated using molecular markers, and the results have assisted in the optimization breeding efforts [16,17]. Molecular markers can be used to identify the locations of quantitative trait loci (QTLs) associated with traits of interest and to introgress superior yield-related alleles into elite cultivars [18]. Selection for markers linked to high-yield QTLs should allow desirable individuals to be identified in early generations, when replication and testing in multiple environments is impossible [19]. Other issues in breeding programs for yield improvement include the co-segregation of undesirable alleles closely linked to favorable alleles. Therefore, yield improvement is limited due to linkage drag as well as pleiotropic effects in which two or more traits are controlled by a single locus. Therefore, it is necessary to dissect the genomic regions of yield-related QTLs to render breeding efforts more effective.
Several studies have been conducted to identify yield-related QTLs in soybeans. In a study based on a ‘Noir’ and ‘Minsoy’ population, the restriction fragment length polymorphism (RFLP) marker R79 on the U11 linkage group (LG) was associated with seed yield (R2 = 13%) [3]. In other research, no major yield QTL was reported in the recombinant inbred lines (RILs) developed from crosses between three cultivars adapted to northern environments (i.e., ‘Minsoy’, ‘Archer’, and ‘Noir 1’). Yield-related QTLs were identified on four chromosomes, 6, 17, 13, and 7 (LG-C2, D2, F, and M), with the highest variation (R2 = 19%) attributable to a QTL near Satt150 on Chr 7 (LG-M) [20]. Unfortunately, another study demonstrated that these high-yield alleles were not easily introduced to different genotypes adapted to the southern United States due to possible epistasis and poor adaptability to different environments [21]. In an ‘Essex’ × ‘Forrest’ RIL population, yield QTLs were identified on three chromosomes, 4, 9, and 20 (LG-C1, K, and I), with the highest variation (R2 = 10%) conditioned by a QTL near Satt337 on Chr 7 (LG-M) [5]. These previous reports indicated that soybean yield QTLs are not located in the same genomic region but are widely distributed across the genome.
Traditional breeding programs have focused on releasing high-yield cultivars by crossing elite parental lines and have decreased genetic diversity among modern soybean populations [22]. Transgressive segregation in yield was reported when crossing parents with intraspecific and interspecific genetic diversity [23,24]. To the best of our knowledge, soybean yield QTLs have never been investigated across different water availability regimes. Plant introductions are potential sources for high-yield alleles under drought conditions. The plant introduction PI 471938, maturity group V, was initially collected in Nepal and was shown to have tolerance to drought (https://npgsweb.ars-grin.gov/gringlobal/accessiondetail?id=1366874, last accessed 17 July 2021). We expected that this material could increase genetic diversity and provide latent-yield alleles to the current elite soybean germplasm. The objectives of this study were to identify soybean yield QTLs in both irrigated and rain-fed environments and to compare any common QTLs from the different water regime environments.

2. Materials and Methods

2.1. Phenotypic Evaluation

A total of 138 lines out of 160 F4-derived lines from a Glycine max (L.) Merr. ‘Hutcheson’ × G. max PI 471938 population were selected for a phenotypic evaluation of drought tolerance. The evaluation of seed yield under different irrigation regimes was conducted during 2000 and 2001 in Athens, GA; Marion, AR; Portageville, MO; Windblow, NC; and West Memphis, AR. The experiment was conducted in a total of 14 locations consisting of nine environments in 2000 (six irrigated and three rain-fed) and five environments in 2001 (three irrigated and two rain-fed). Four replicates of all locations were included in 2000, while two and three replicates for the irrigated and for the rain-fed environment were included in 2001.
The irrigated plots were watered at 50 mm ha−1 w k−1 as needed via a lateral-move irrigation system to allow optimum plant growth. Irrigation was begun at flower initiation and terminated about 10 day before plant maturity, while rain-fed plots received natural rainfall. Changes in rainfall collected in Athens, GA in years 2000 and 2001 are shown along with other weather data such as evapotranspiration, vapor pressure deficit, and air temperature in Supplementary Figure S1, Tables S1 and S2. In 2001 and 2002, a visual rating of canopy wilting was scored for the three replicates in the rain-fed environment under stressful conditions in Windblow, NC. A visual rating using a 1 to 5 scale was implemented with symptoms scored between 0 (no wilting symptoms), 3 (half of the leaves with wilting), and 5 (severely wilted or dead). The averaged visual ratings were used for the following linkage analysis.
Seed yield (kg ha−1) was averaged over the two years. Since the two years had unequal numbers of environments and replicates, we gave each year an equal weight in the calculation of the overall mean. For example, for the rain-fed environments, seed yield in 2000 (SY2000) was calculated as the average of four replicates (Equation (1)), while the average of 2001 (SY2001) was calculated as the average of three replicates (Equation (2)):
SY2000 = rep1[(location1 + location2 + location3)/3] + rep2[(location1 + location2 + location3)/3] + rep3[(location1 + location2 + location3)/3] + rep4[(location1 + location2 + location3)/4]
SY2001 = rep1[(location1 + location2)/2] + rep2[(location1 + location2)/2] + rep3[(location1 + location2)/2]
The two-year average seed yield was also calculated (Equation (3)):
Two-year average = [{(SY2000 × 3) + (SY2001 × 2)}/5]
The parents were included in each test to adjust for field effects. The field experiment was planted in three or four replicates (two replicates for irrigated plots in 2001) in a randomized complete block design with four blocks of 40 lines each, and the data were collected from two center rows in four-row plots with 5 m long rows and 0.76 m row spacing, or from two rows after end-trimming to 3.66 m in two-row plots with 6.1 m long rows and 0.76 m spacing, which allowed a border effect on the seed yield to be minimized. Depending on the field size and use, the plot configuration was varied by location, and yield testing was thus conducted in multiple years and locations.

2.2. SSR Marker Data Collection

DNA from each of the 160 F4-derived lines and the two parents was extracted from the first trifoliate leaves of the plants grown in a greenhouse. The modified CTAB (hexadecyltrimethylammonium acid) procedure [25] was used to extract DNA. A total of 150 polymorphic simple sequence repeat (SSR) markers spanning the whole soybean genome were used to identify yield-related QTLs. The PCR reactions were prepared based on the protocol by Diwan and Cregan [26] with slight modifications. The primers were labeled with the fluorescent dyes 6-FAM, NED, or HEX. The reactions were performed in a dual 384-well or a 96-well GeneAmp PCR System 9700 (PE-ABI, Foster City, CA, USA). A PCR sample for each lane of the gel was prepared with a loading mixture (2.0 μL of deionized formamide, 2.0 μL of loading buffer, and 0.3 μL of Genescan Rox-500) and 1–2 μL of the PCR products. Once the loading sample was denatured at 95 °C for 5 min, the sample was separated (~1.0 μL per lane with microsyringes) on a 4.8% (w/v) polyacrylamide gel with 12 cm plates and 1X TAE (Tris-Acetate EDTA) running buffer at 750 V for approximately 2 h in an ABI PRISM 377 DNA Sequencer (PE-ABI, Foster City, CA, USA). The marker fragments were analyzed with GeneScan v. 2.1 and scored with Genotyper v. 2.5 software (PE-ABI, Foster City, CA, USA).

2.3. Linkage Map and Statistical Analysis

DNA marker data were collected from 160 F4-derived lines and used to develop a linkage map, constructed with the marker data using Gmendel [27]. All phenotypic data were analyzed with an analysis of variance (ANOVA) using the PROC GLM in SAS [28]. Significant associations of the markers with seed yield under different water regimes were tested with a single-factor ANOVA (SF-ANOVA) using PROC GLM in SAS (p ≤ 0.05). A forward-selection multiple regression model was used to identify the independent markers linked to QTLs within and across linkage groups. To evaluate epistatic interactions, two-factor ANOVA was tested with significant markers at p < 0.05. Map Manager QTX was used to confirm the results from the SF-ANOVA, linkage maps, interactions among markers, and the most probable QTL positions [29]. The analysis tools initially followed the default values with the Kosambi mapping function [30]. A 1000-permutation test in 1 cM steps was conducted to establish the significance thresholds for the likelihood ratio statistic (LRS), which was converted to LOD by multiplying by 0.217 of the QTLs generated by the interval mapping, as described by Churchill and Doerge [31].

3. Results

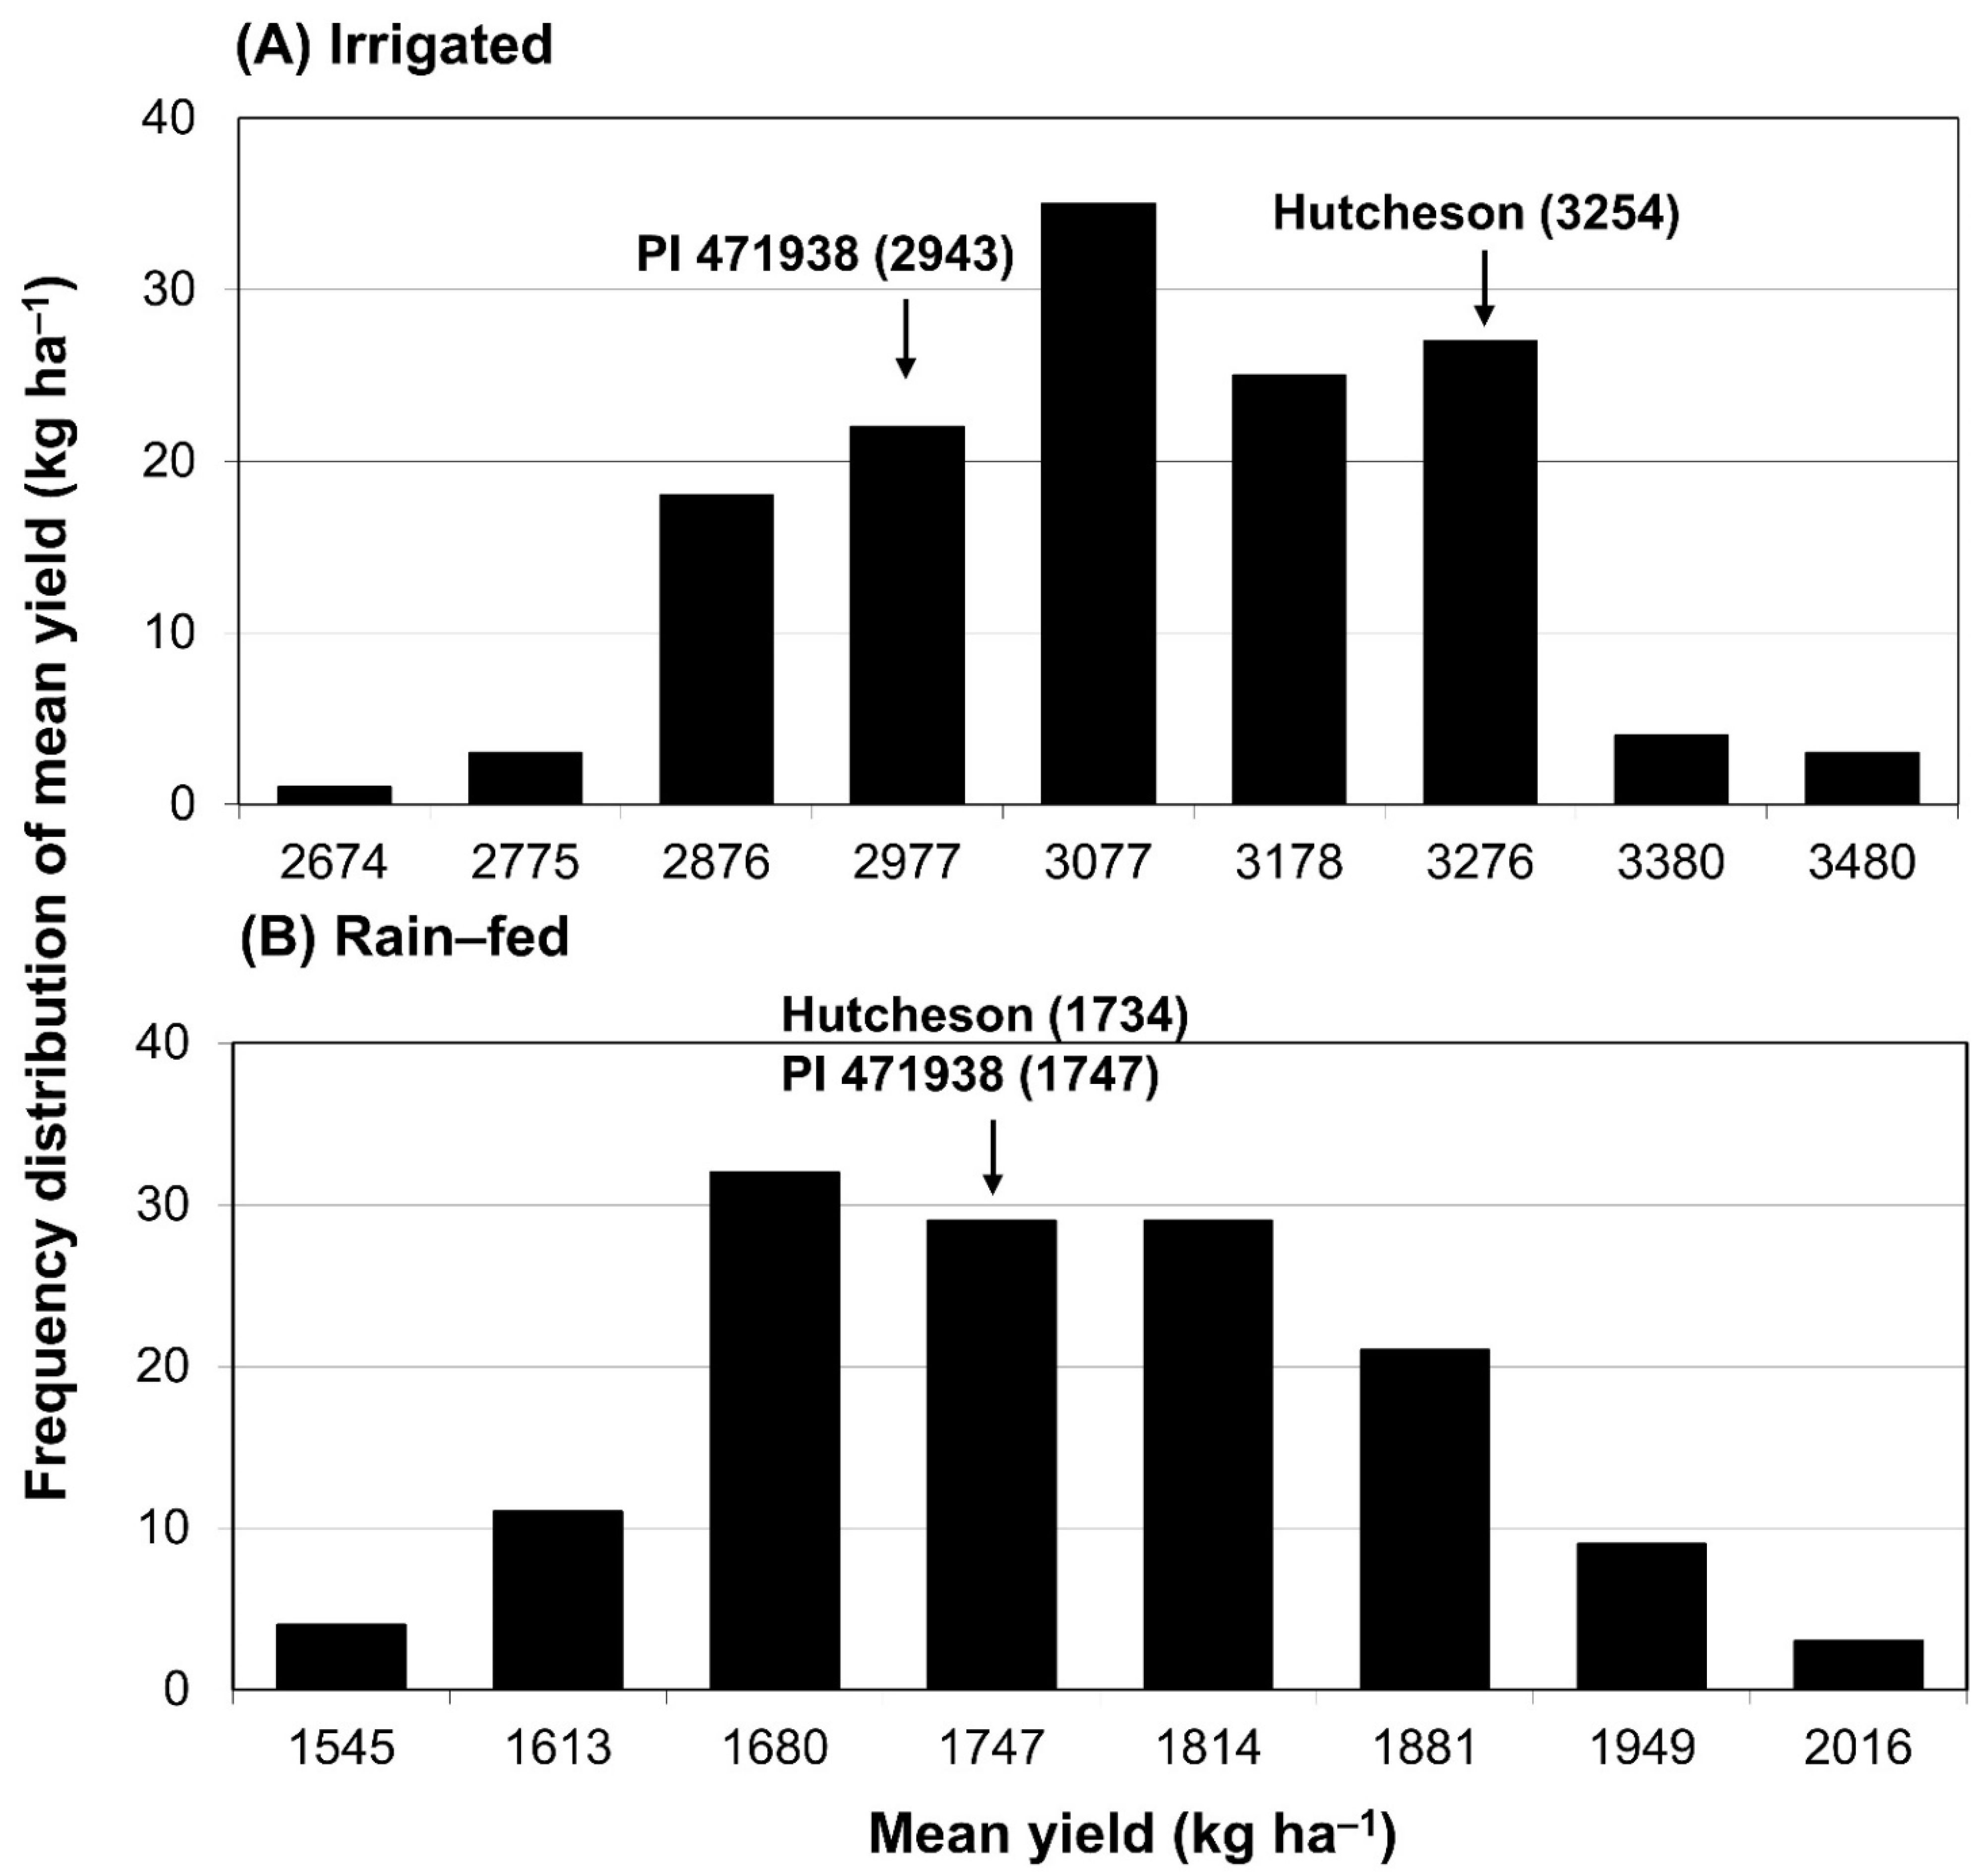
3.1. Frequency Distribution of Seed Yield under Irrigated and Rain-Fed Conditions

The frequencies of seed yield among lines were normally distributed in the population in both the irrigated and rain-fed environments (Figure 1). The ranges of seed yield among the 160 F4-derived lines were 2674–3480 kg ha−1 in the irrigated environments and 1545–2016 kg ha−1 in the rain-fed environments, with means of 3079 ± 158 kg ha−1 and 1766 ± 108 kg ha−1, respectively. Compared to seed yield in rain-fed soil, the higher yield in irrigated plots appeared to be due to insufficient water supply when the weather data in Athens, GA were considered (Supplementary Tables S1 and S2). Significant transgressive segregation for seed yield occurred in both the irrigated and rain-fed environments.

3.2. Genetic Map

A total of 405 SSR markers were tested for polymorphism between Hutcheson and PI 471938, and 150 polymorphic SSR markers (37%) were mapped to 19 chromosomes with an average genetic distance of 7.8 cM.

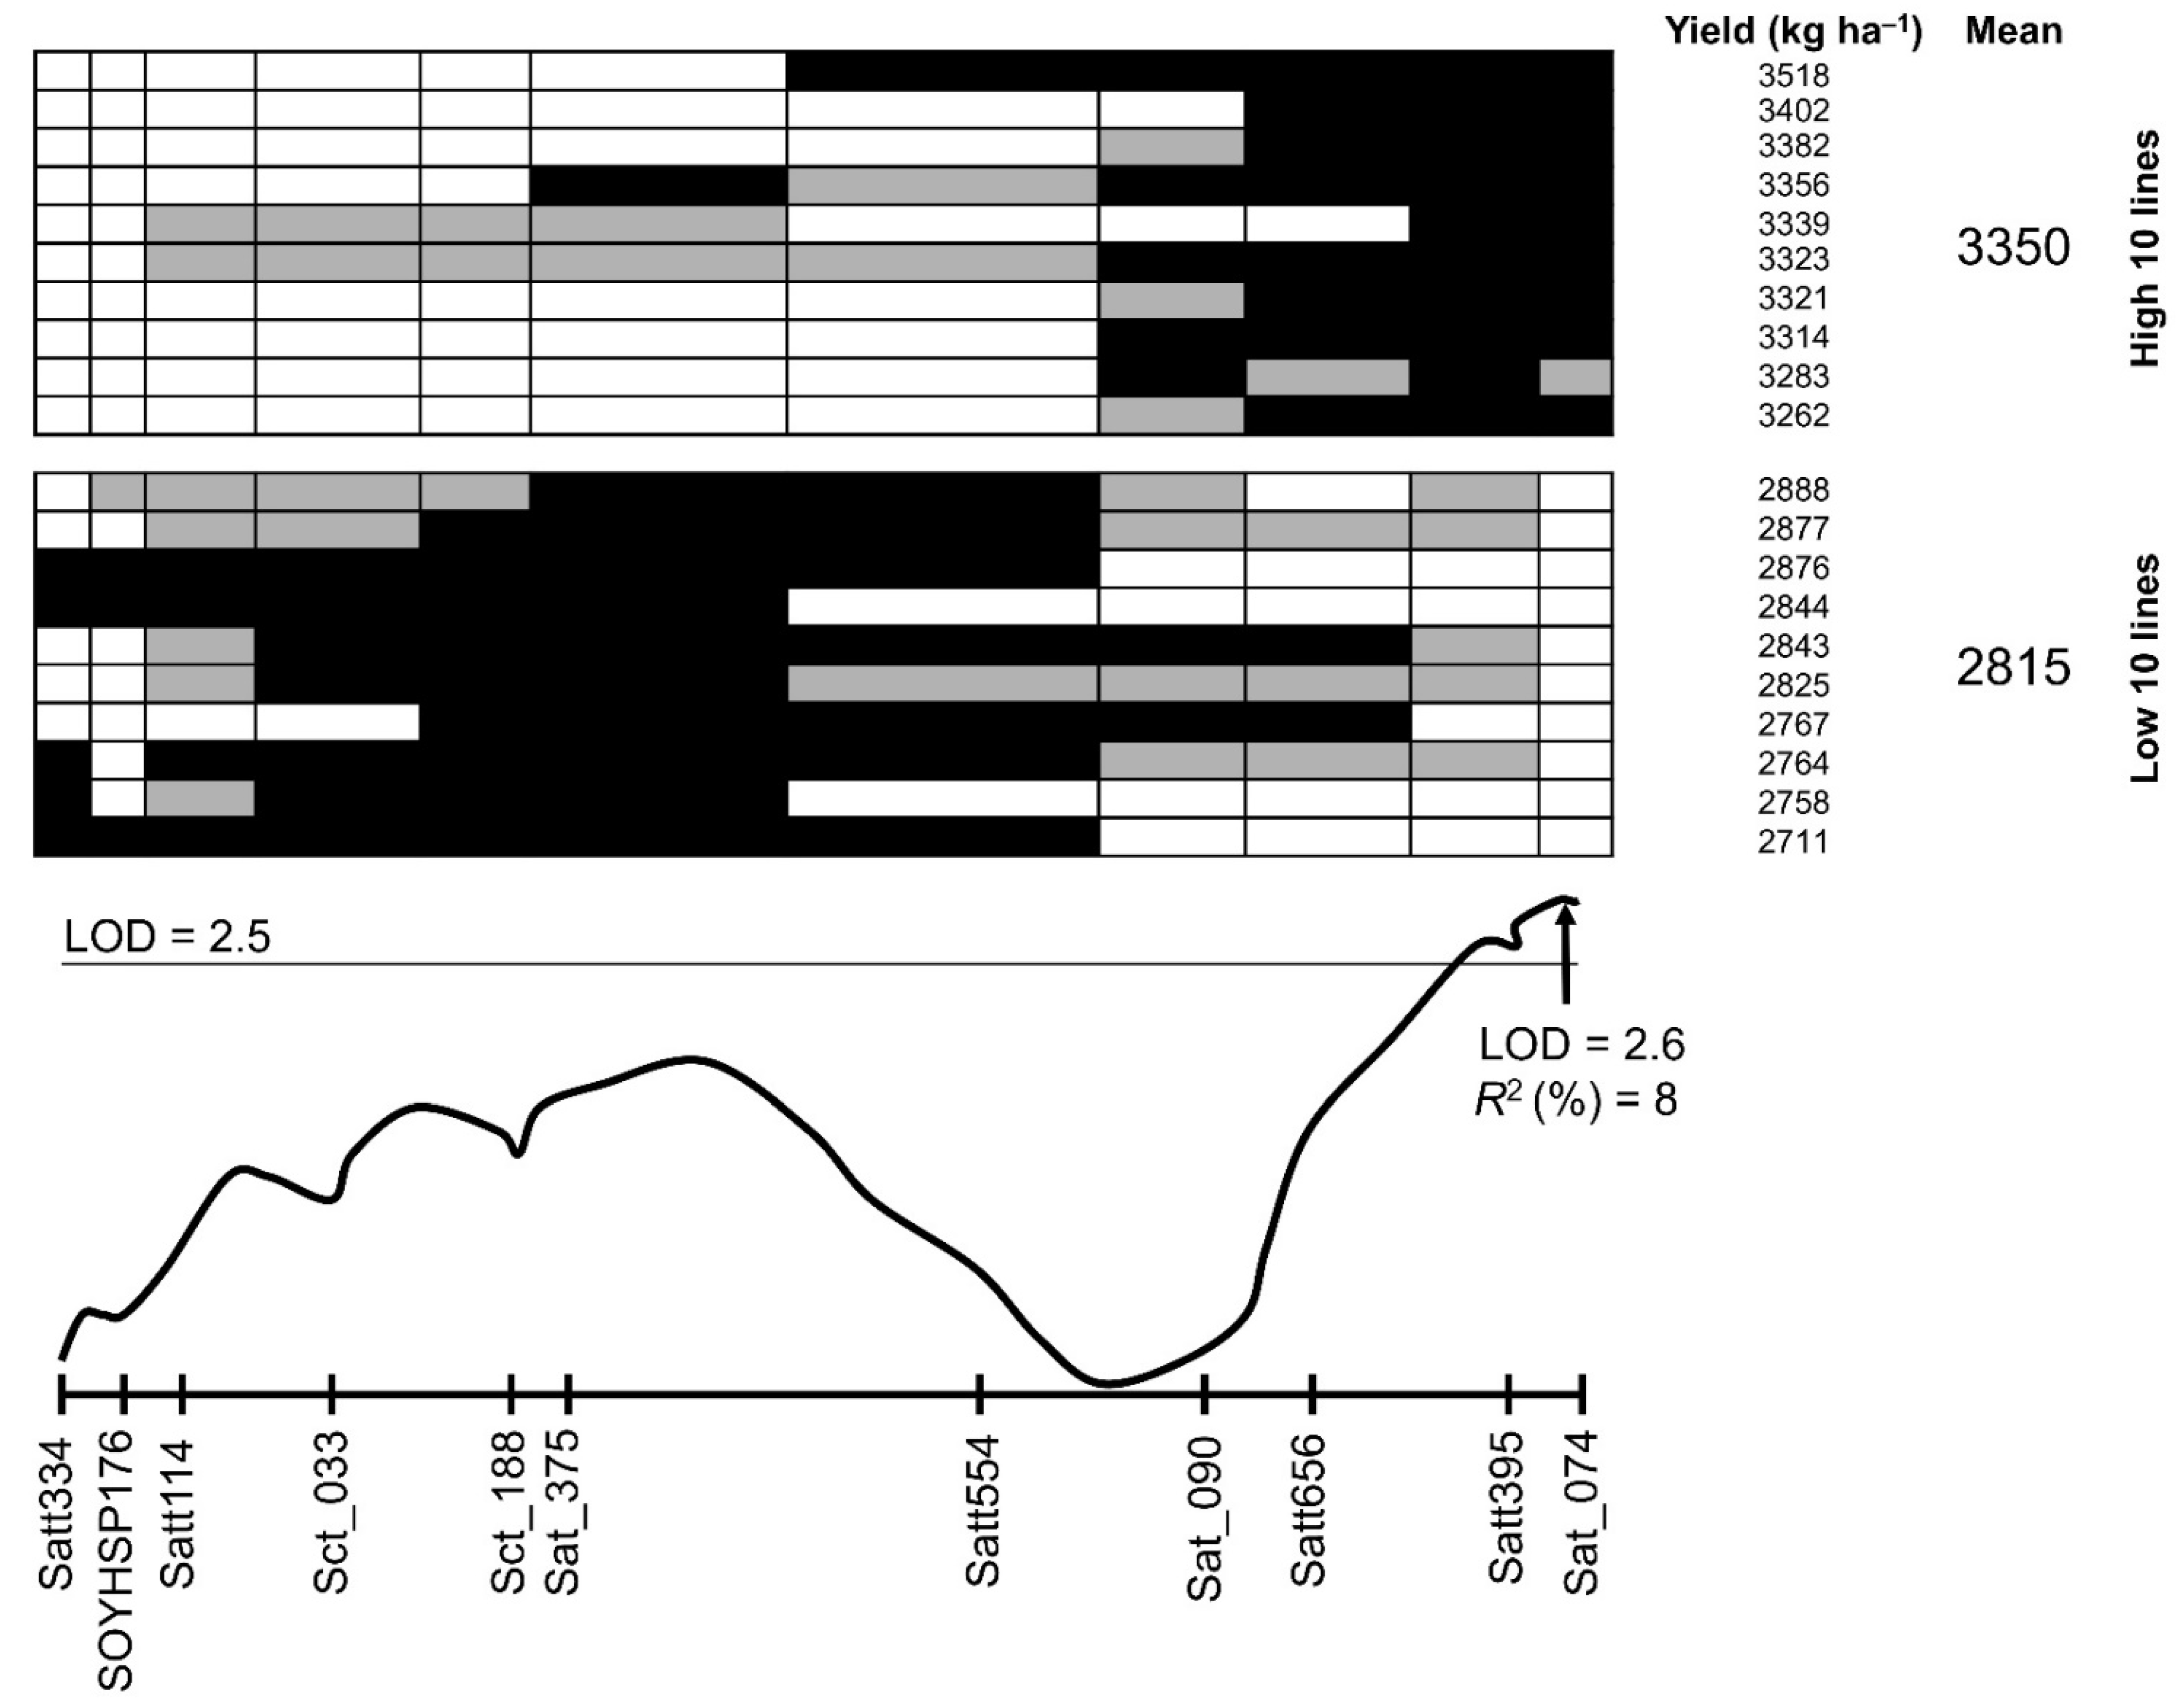
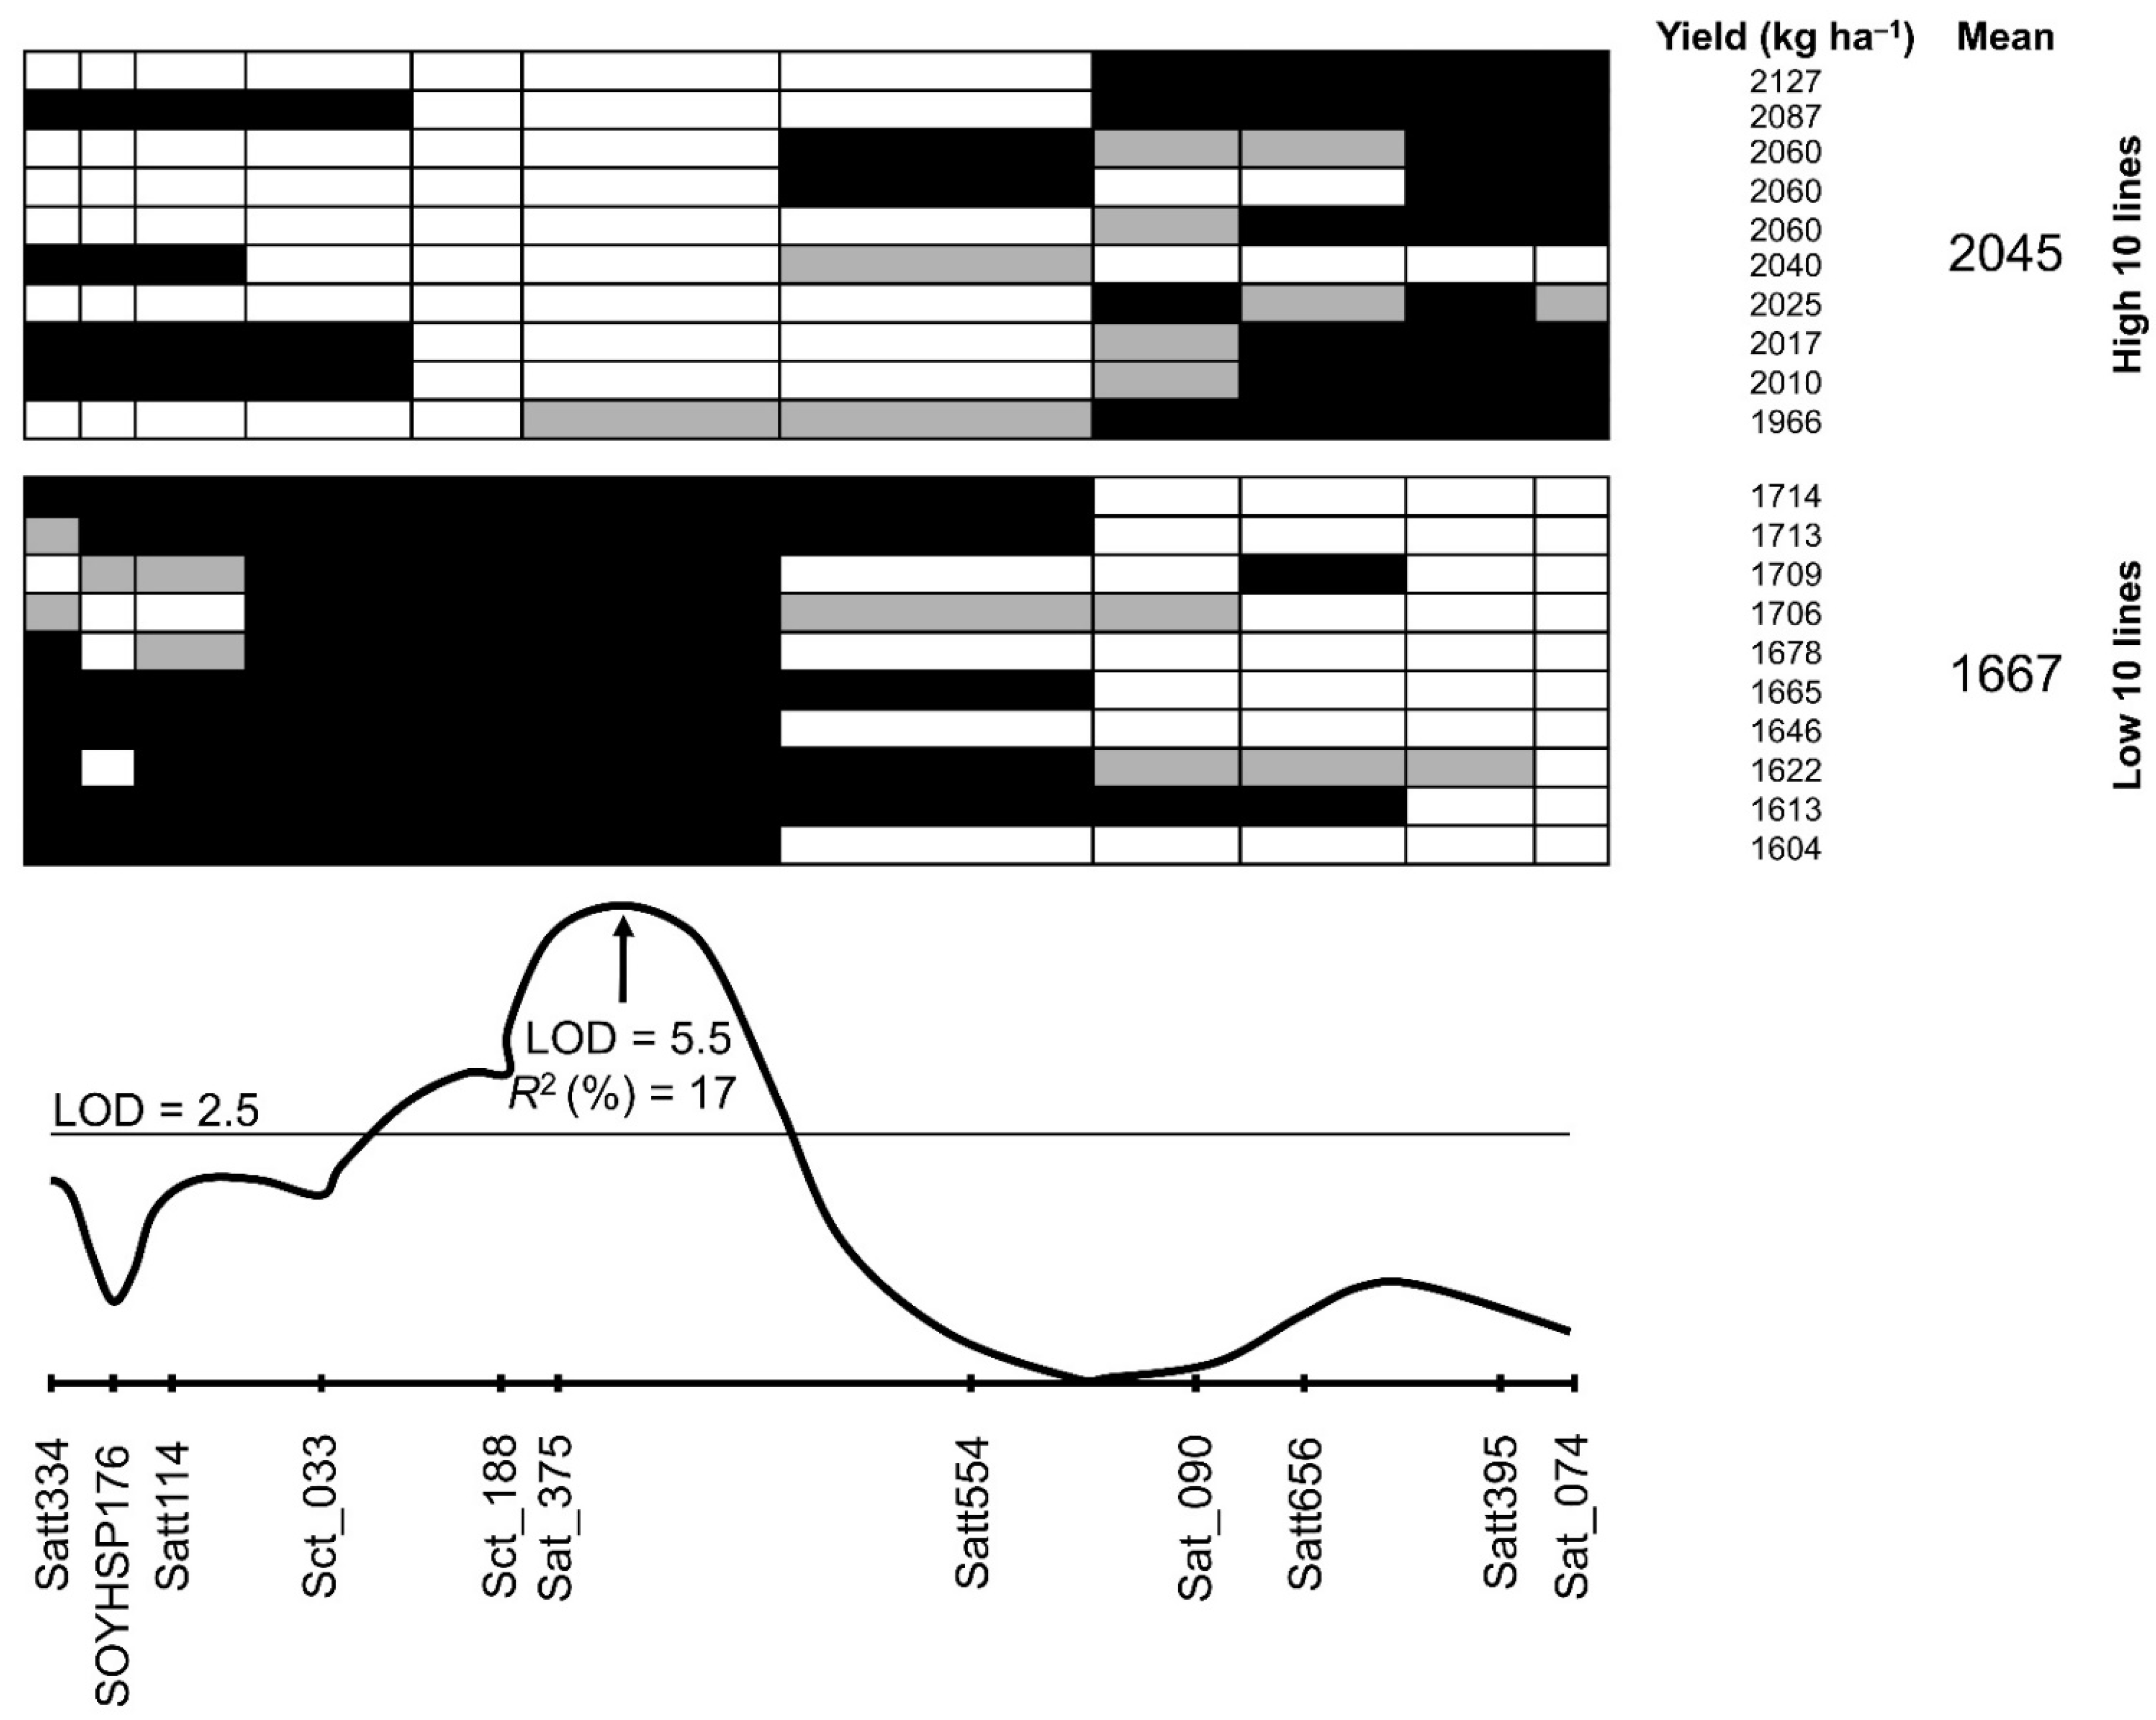
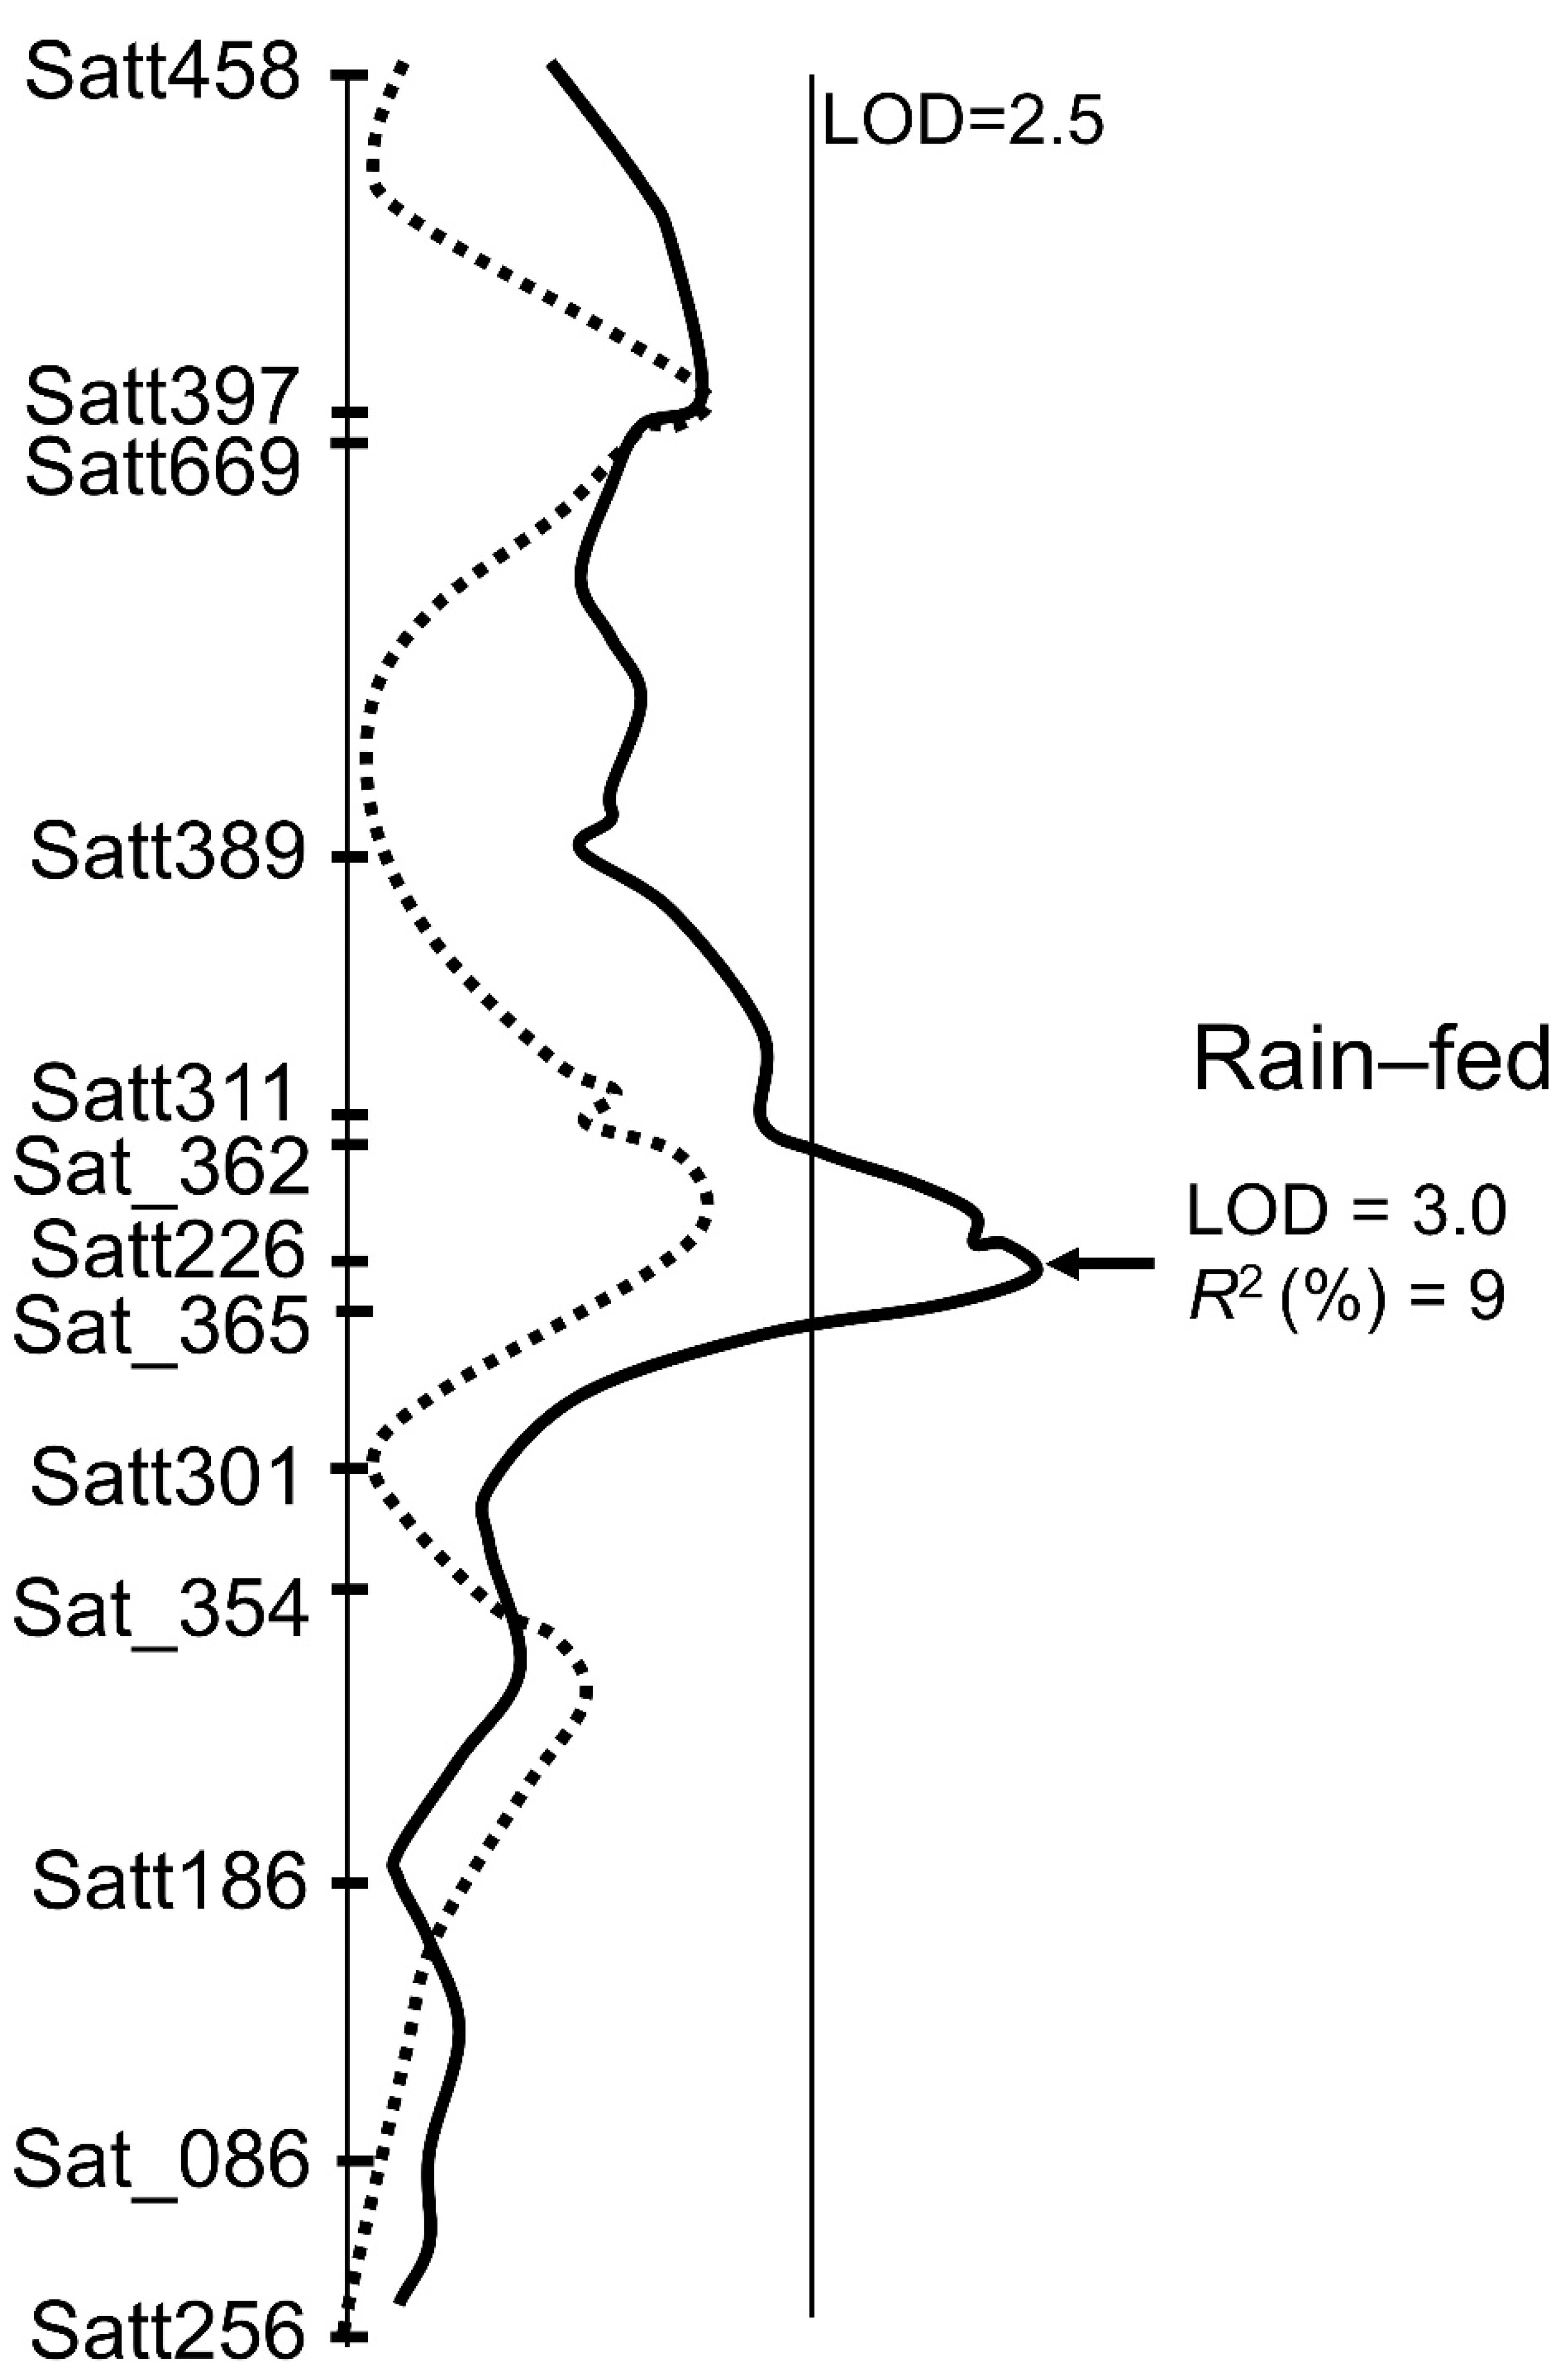
3.3. QTL Analysis for Yield and Wilting

Twenty SSR markers on nine chromosomes were significantly associated with soybean yield in the irrigated environments (R2 = 4–8%; LOD 1.3–2.4). Twenty-seven markers were associated with yield in the rain-fed environments (R2 = 4–17%; LOD 1.3–5.1). Eight chromosomes (i.e., 1, 9, 11, 12, 13, 16, 17, and 18) had SSR markers associated with yield in either the irrigated or rain-fed environments. The independent putative markers that had additive effects on each chromosome are presented in Table 1 and Table 2. Five QTLs were identified in each of the irrigated and rain-fed environments. Two genomic regions (Satt226 on Chr 17 and Sat_375 on Chr 13) were associated with seed yield in both the irrigated and rain-fed environments. An allele with a major effect was inherited from PI 471938 (Figure 2, Figure 3 and Figure 4).
In the irrigated environments, the most significant QTL (IR-YLD QTL; LOD score = 2.6), was located near Sat_074 on Chr 13, and explained 8% of the variation in seed yield (Table 1 and Figure 2). An allele for increased seed yield was inherited from Hutcheson. The lines homozygous for the Hutcheson allele averaged 100 kg ha−1 higher yield than lines homozygous for the PI 471938 allele. The QTL that contributed most to seed yield in the rain-fed environments (RF-YLD QTL) was located about 3.0 cM from Sat_375 on Chr 13 (Table 2 and Figure 3). The LOD score of this QTL was 5.5, and it accounted for 17% of the variation in seed yield in RF environments. The positive allele was inherited from the PI 416938 parent. The lines homozygous for the PI 471938 alleles had 101 kg ha−1 higher yield than that of the lines homozygous for the Hutcheson alleles. The additive, enhanced yield effect of the PI 471938 alleles was evident at most loci, except for Sat_074 on Chr 13 and Satt296 on Chr 2 from the irrigated and rain-fed environments, respectively (Table 1 and Table 2).
Multiple regression analysis within each linkage group identified four IR-YLD QTLs on Chr 13 and 18 from the irrigated environments (Table 3). Additionally, five RF-YLD QTLs were identified on five chromosomes (1, 9, 13, 16, and 17) in the rain-fed environments (Table 3). Markers from the multiple regression analysis across the linkage groups accounted for 22% and 34% of the yield variation in the irrigated and rain-fed environments, respectively. All favorable alleles for high seed yield in the rain-fed environments were inherited from PI 471938.
Based on a single-factor ANOVA, five putative SSR markers were significantly associated with the visual rating of canopy wilting (p ≤ 0.05; Table 4). The contribution of the markers to wilting ranged from 4 to 9% of the variation in canopy wilting. Most of the positive alleles for low wilting were inherited from PI 471938 at the markers on Chrs 1, 4, 13, and 17, while one marker on Chr 9 (Sat_087) possessed a positive allele from Hutcheson. Three SSR markers (Satt507, Sat_365, and Sat_375 on Chrs 1, 17, and 13, respectively) were mapped to the same QTL for high yield under the rain-fed conditions, and the source of the favorable alleles was also PI 471938.

4. Discussion

One way to increase the amount of genetic diversity and variation in traits such as seed yield is to introduce genes into existing elite lines from either exotic germplasms or wild relatives [24,32,33]. Rather than using parents from relatively closely related gene pools, crosses between an elite line and an exotic line can increase the possibility of recombined genes of interest [21,23]. With such approaches, many breeding programs have improved tolerance to abiotic stresses such as drought. Based on the results of the SF-ANOVA from among the 10 putative IR-YLD and RF-YLD QTLs, 6 QTLs had positive alleles that were inherited from PI 471938, while 2 QTLs linked to the respective Sat_074 on Chr 13 and Satt296 on Chr 2 had Hutcheson alleles (Table 1 and Table 2). These results hold promise for increasing both genetic variation and yield among soybean lines. Eventually, the PI 471938 alleles at the yield-related QTLs were introgressed into some cultivars with drought tolerance, such as N98-7182, -7261, -7265, -7265, 7275, -7288, 7289 (https://soybase.org/uniformtrial/index.php?page=lines&filter=PI+471938, last accessed 22 July 2020). Moreover, the results of this study demonstrated that the favorable alleles at RF-YLD QTLs can be used to improve soybean yield even under drought stress conditions, while many superior alleles at yield-related QTLs were environment-specific. In addition, the Hutcheson allele at Satt296 on Chr 2 and the PI 471938 alleles on the other RF-YLD QTLs identified in this study can be used to maintain the high soybean yield of current cultivars across multiple drought regimes [34].
Using the mapping population, a high-quality genetic map was developed to show that the order of the DNA markers was in close agreement with that of the soybean reference genetic map proposed by Cregan et al. [35]. A comparison of the genomic regions of the soybean yield-related QTLs in this study with those of previous reports showed that the yield-related QTLs from the current study are co-located in genomic regions that were previously identified in different populations. We found that Sat_074, which accounted for 8% of the yield variation in the irrigated environments, and Sat_375, which accounted for 16% of the yield variation in the rain-fed environments, had alleles from either Hutcheson or PI 471938, respectively, and contributed most to seed yield. Yield-related QTLs have been found to be closely linked to Satt144 and Sat_074 with variation of 13% and 2.4% in the Noir 1 × Archer and Minsoy × Noir 1 populations, respectively [20,36]. The SSR marker Satt144 was located between Sat_375 and Satt554 (23.9 cM), although it was monomorphic in our study (Figure 2 and Figure 3). However, these markers were grouped near the bottom of Chr 13 on the soybean genetic linkage map of Cregan et al. [35].
Another yield-related QTL was reported on Chr 17 in northern elite cultivars, and was flanked by Satt002 [20]. In our Hutcheson × PI 471938 population, the SSR marker Satt397 near Satt002 was statistically associated with seed yield under both irrigated and rain-fed conditions (Figure 4). The different genomic locations of QTLs known to be associated with seed yield could be due to the different genetic backgrounds of the populations (i.e., northern vs. southern germplasm). Parents with high parentage coefficients in a population might have the same allele or alleles with similar phenotypic effects at a given QTL. Additionally, different sets of DNA markers used in different studies can lead to the identification of different markers flanking yield-related QTLs. For example, Satt002 did not exhibit polymorphism between Hutcheson and PI 471938 parents, and many markers around Satt277 on Chr 6 in the Noir 1 × Archer population were monomorphic in the Hutcheson × PI 471938 population. The Chr 18 and Chr 9 regions where IR-YLD and RF-YLD QTLs were identified are known to have seed weight-related QTLs, which probably affected seed yield [20,36].
In this study, interactions between Satt395 on Chr 13 and Satt546 on Chr 2 in the irrigated environment as well as between Satt298 on Chr 11 and Sat_365 on Chr 17 and between Sat_375 on Chr 13 and Sat_362 on Chr 17 in the rain-fed environment were detected (Table 5). Under irrigated conditions, individuals showed higher yield when they were homozygous for Hutcheson alleles at Satt395 (mean of 3138 kg ha−1) or homozygous for PI 471938 alleles at Satt546 (mean of 3097 kg ha−1) compared with the progeny homozygous for PI 471938 (mean of 3044 kg ha−1) or Hutcheson alleles (mean of 3057 kg ha−1), respectively. However, the highest yield (3158 kg ha−1), was in the individuals homozygous for Hutcheson and PI 471938 alleles at the Satt395 and Satt546 loci, respectively (Table 5). In the rain-fed environment, the additive effect of the PI 471938 alleles was commonly demonstrated for the marker loci exhibiting an interaction, but the highest average yield was found in the individuals homozygous for PI 471938 alleles at Satt298 and Sat_365 or Sat_375 and Sat_362. In addition, the highest yield was found in individuals with homozygous alleles at both loci (Table 5). A previous study reported that the interactions between yield QTLs in soybeans were environment- or allele-specific [37]. In the northern germplasm Noir 1 × Archer population, only a Noir allele from an exotic parent on B172_2 was significantly associated with seed yield when it interacted with an allele from an elite Archer parent on a yield-related QTL Chr 6 linked to Satt277. The seed-yield-related QTL Satt507, which was on Chr 1 under rain-fed conditions, interacted with Satt561 on Chr 19 in the Minsoy × Archer population, and yield was increased by 63% by the presence of the Archer allele associated with Satt507 on Chr 1 [37].
The top 10 yielding lines grown under irrigated conditions commonly had Hutcheson alleles between Satt395 and Sat_074 on Chr 13. The 10 lowest yielding lines were commonly homozygous for PI 471938 alleles at Sat_074 and homozygous for Hutcheson alleles at Sat_375, shown in a secondary peak at the IR-YLD QTL position (Figure 2). These results indicate that a breeding strategy aimed to increase seed yield needs to introgress homozygous Hutcheson alleles at Sat_074 and homozygous PI 471938 alleles at the Sat_375 locus on Chr 13. The mean difference in seed yield of the 10 lines in each group was 535 kg ha−1, which was possibly due to allelic differences at those loci. A similar contrast in allelic composition was also found around the important RF-YLD QTLs near Sat_375 between the top- and low-yielding lines under rain-fed conditions. All high-yielding lines under rain-fed conditions were homozygous for PI 471938 alleles at Sct_188 and Sat_375, while all low-yielding lines under drought conditions were homozygous for Hutcheson alleles at those loci (Figure 3). These comparative results of high- and low-yielding individuals indirectly confirm the existence of yield-related alleles flanked by those QTLs. Therefore, the high-yielding lines identified in the irrigated environments can be crossed with the high-yielding lines identified from the rain-fed environments to develop lines or cultivars with favorable alleles at the IR-YLD and RF-YLD QTLs. Based on these results, the recombination of the superior alleles at these QTLs may enhance breeding efforts to produce more drought-tolerant soybean cultivars in the near future. Like the reduction in seed size and weight, seed composition was affected by drought stress [38], which requires further study for those cultivars with positive alleles ensuring higher yield under drought conditions to investigate any modification of nutritional value.

5. Conclusions

The identification of yield-related QTLs under different water regimes indicated that only two SSR markers, Satt226 on Chr 17 and Sat_375 on Chr 13, were commonly detected, indicating that the mechanisms of drought tolerance may be controlled by a gene cluster or by multiple specific genes for a particular drought avoidance or tolerance strategy. Clearly, the different QTLs identified under different water conditions reflected that the effects of the yield-related alleles were environment-specific. As expected, there were different QTLs under different drought conditions. Thus, the efficient development of soybean cultivars with improved yield under drought stress is possible when high-yielding QTLs are identified under drought-imposed conditions.
The SF-ANOVA of canopy wilting during drought stress revealed that three out of five significant SSR markers associated with low wilting were located in the same genomic regions as those markers linked to the RF-YLD QTLs. This implies that high yield under drought stress is probably controlled by the same genes as drought tolerance, such as those that reduce water loss, maintain water uptake, or control osmotic adjustments. Additionally, the favorable alleles of the three QTLs for low wilting were inherited from PI 471938, the parent providing alleles for the RF-YLD QTL. This indicated that high-yield-related alleles in the rain-fed environments were associated with as those alleles for drought tolerance.
High-throughput DNA marker strategies are becoming increasingly useful for MAS in breeding programs. The information we obtained can be used to improve soybean yields using MAS or for map-based cloning approaches if the location of the QTLs can be mapped with high resolution. An alternative approach would be to use a large number of expressed sequence tags for the selection of candidate genes. Based on the marker data we collected, we can produce near-isogenic lines, which would enable to confirm the location of high-yield QTLs as well as the degree to which the QTLs may affect soybean yield.

Supplementary Materials

The following are available online at https://www.mdpi.com/article/10.3390/agronomy11112207/s1, Supplementary Figure S1. Changes in total rain (mm), evapotranspiration (mm), average vapor pressure deficit (kPa), and average air temperature in Athens, Georgia, USA in years 2000 (A) and 2001 (B), Table S1. Changes in weather data collected in Athens, Georgia in year 2000, Table S2. Changes in weather data collected in Athens, Georgia in year 2001.

Author Contributions

Conceptualization and funding, T.E.C.J., G.S. and H.R.B.; investigation and marker analysis, G.-J.L.; data curation and QTL mapping, G.-J.L. and S.L.; writing and revision—original draft, G.-J.L. and S.L.; writing—review and editing, T.E.C.J., G.S. and H.R.B. All authors have read and agreed to the published version of the manuscript.

Funding

This work was supported by the United Soybean Board, the Georgia Agricultural Commodity Commission for Soybeans, and the North Carolina Soybean Producers Association. Implementation of QTL analysis and map construction was partly supported by Golden Seed Project [grant number 213006-05-4-SBW30] of the Ministry of Agriculture, Food and Rural Affairs (MAFRA) of Korea. This work was also supported in part by Agriculture Science & Technology Research and Development Program (grant number. PJ01574402), Rural Development Administration, South Korea.

Conflicts of Interest

The authors declare no conflict of interest.

References

  1. Chapman, A.; Pantalone, V.R.; Ustun, A.; Allen, F.L.; Landau-Ellis, D.; Trigiano, R.N.; Gresshoff, P.M. Quantitative trait loci for agronomic and seed quality traits in an F2 and F4:6 soybean population. Euphytica 2003, 129, 387–393. [Google Scholar] [CrossRef]
  2. Fang, L.; Wang, Q.; Hu, Y.; Jia, Y.; Chen, J.; Liu, B.; Zhang, Z.; Guan, X.; Chen, S.; Zhou, B.; et al. Genomic analyses in cotton identify signatures of selection and loci associated with fiber quality and yield traits. Nat. Genet. 2017, 49, 1089–1098. [Google Scholar] [CrossRef]
  3. Mansur, L.M.; Orf, J.H.; Chase, K.; Jarvik, T.; Cregan, P.B.; Lark, K.G. Genetic mapping of agronomic traits using recombinant inbred lines of soybean. Crop Sci. 1996, 36, 1327–1336. [Google Scholar] [CrossRef]
  4. Hu, D.; Zhang, H.; Du, Q.; Hu, Z.; Yang, Z.; Li, X.; Wang, J.; Huang, F.; Yu, D.; Wang, H.; et al. Genetic dissection of yield-related traits via genome-wide association analysis across multiple environments in wild soybean (Glycine soja Sieb. and Zucc.). Planta 2020, 251, 39. [Google Scholar] [CrossRef]
  5. Yuan, J.; Njiti, V.N.; Meksem, K.; Iqbal, M.J.; Triwitayakorn, K.; Kassem, M.A.; Davis, G.T.; Schmidt, M.E.; Lightfoot, D.A. Quantitative trait loci in two soybean recombinant inbred line populations segregating for yield and disease resistance. Crop Sci. 2002, 42, 271–277. [Google Scholar] [CrossRef] [Green Version]
  6. Basal, O.; Szabó, A. The combined effect of drought stress and nitrogen fertilization on soybean. Agronomy 2020, 10, 384. [Google Scholar] [CrossRef] [Green Version]
  7. Hong, S.C.; Macguidwin, A.; Gratton, C. Soybean aphid and soybean cyst nematode interactions in the field and effects on soybean yield. J. Econ. Entomol. 2011, 104, 1568–1574. [Google Scholar] [CrossRef] [PubMed]
  8. Kunert, K.; Vorster, B.J. In search for drought-tolerant soybean: Is the slow-wilting phenotype more than just a curiosity? J. Exp. Bot. 2020, 71, 457–460. [Google Scholar] [CrossRef] [PubMed] [Green Version]
  9. Lee, G.J.; Boerma, H.R.; Villagarcia, M.R.; Zhou, X.; Carter, T.E.; Li, Z.; Gibbs, M.O. A major QTL conditioning salt tolerance in S-100 soybean and descendent cultivars. Theor. Appl. Genet. 2004, 109, 1610–1619. [Google Scholar] [CrossRef]
  10. Sarker, U.; Oba, S. Catalase, superoxide dismutase and ascorbate-glutathione cycle enzymes confer drought tolerance of Amaranthus tricolor. Sci. Rep. 2018, 8, 16496. [Google Scholar] [CrossRef] [PubMed] [Green Version]
  11. Sarker, U.; Oba, S. Drought stress enhances nutritional and bioactive compounds, phenolic acids and antioxidant capacity of Amaranthus leafy vegetable. BMC Plant Biol. 2018, 18, 258. [Google Scholar] [CrossRef] [PubMed] [Green Version]
  12. Sarker, U.; Oba, S. Response of nutrients, minerals, antioxidant leaf pigments, vitamins, polyphenol, flavonoid and antioxidant activity in selected vegetable amaranth under four soil water content. Food Chem. 2018, 252, 72–83. [Google Scholar] [CrossRef] [PubMed]
  13. Sarker, U.; Oba, S. Drought stress effects on growth, ROS markers, compatible solutes, phenolics, flavonoids, and antioxidant activity in Amaranthus tricolor. Appl. Biochem. Biotechnol. 2018, 186, 999–1016. [Google Scholar] [CrossRef] [PubMed]
  14. Sarker, U.; Oba, S. Salinity stress enhances color parameters, bioactive leaf pigments, vitamins, polyphenols, flavonoids and antioxidant activity in selected Amaranthus leafy vegetables. J. Sci. Food Agric. 2019, 99, 2275–2284. [Google Scholar] [CrossRef]
  15. Sarker, U.; Oba, S. The response of salinity stress-induced A. tricolor to growth, anatomy, physiology, non-enzymatic and enzymatic antioxidants. Front. Plant Sci. 2020, 11, 559876. [Google Scholar] [CrossRef]
  16. Stuber, C.W.; Polacco, M.; Lynn Senior, M. Synergy of empirical breeding, marker-assisted selection, and genomics to increase crop yield potential. Crop Sci. 1999, 39, 1571–1583. [Google Scholar] [CrossRef] [Green Version]
  17. Xavier, A.; Rainey, K.M. Quantitative genomic dissection of soybean yield components. G3 Genes Genom. Genet. 2020, 10, 665–675. [Google Scholar] [CrossRef] [Green Version]
  18. Mazur, B.J.; Tingey, S.V. Genetic mapping and introgression of genes of agronomic importance. Curr. Opin. Biotechnol. 1995, 6, 175–182. [Google Scholar] [CrossRef]
  19. Ribaut, J.M.; Jiang, C.; Gonzalez-De-Leon, D.; Edmeades, G.O.; Hoisington, D.A. Identification of quantitative trait loci under drought conditions in tropical maize. 2. Yield components and marker-assisted selection strategies. Theor. Appl. Genet. 1997, 94, 887–896. [Google Scholar] [CrossRef] [Green Version]
  20. Orf, J.H.; Chase, K.; Jarvik, T.; Mansur, L.M.; Cregan, P.B.; Adler, F.R.; Lark, K.G. Genetics of soybean agronomic traits: I. Comparison of three related recombinant inbred populations. Crop Sci. 1999, 39, 1642–1651. [Google Scholar] [CrossRef] [Green Version]
  21. Reyna, N.; Sneller, C.H. Evaluation of marker-assisted introgression of yield QTL alleles into adapted soybean. Crop Sci. 2001, 41, 1317–1321. [Google Scholar] [CrossRef]
  22. Gizlice, Z.; Carter, T.E., Jr.; Gerig, T.M.; Burton, J.W. Genetic diversity patterns in North American public soybean cultivars based on coefficient of parentage. Crop Sci. 1996, 36, 614–620. [Google Scholar] [CrossRef]
  23. Devicente, M.C.; Tanksley, S.D. QTL analysis of transgressive segregation in an interspecific tomato cross. Genetics 1993, 134, 585–596. [Google Scholar] [CrossRef]
  24. Kisha, T.J.; Diers, B.W.; Hoyt, J.M.; Sneller, C.H. Genetic diversity among soybean plant introductions and North American germplasm. Crop Sci. 1998, 38, 1669–1680. [Google Scholar] [CrossRef]
  25. Keim, P.; Olson, T.C.; Shoemaker, R.C. A rapid protocol for isolating soybean DNA. Soybean Genet. Newsl. 1988, 15, 150–152. [Google Scholar]
  26. Diwan, N.; Cregan, P.B. Automated sizing of fluorescent-labeled simple sequence repeat (SSR) markers to assay genetic variation in soybean. Theor. Appl. Genet. 1997, 95, 723–733. [Google Scholar] [CrossRef]
  27. Holloway, J.L.; Knapp, S.J. Gmendel 3.0 Users Guide; Department of Crop and Soil Science, Oregon State University: Corvallis, OR, USA, 1993. [Google Scholar]
  28. Sas Institute. The SAS System for Windows, Version 8; SAS Inst. Inc.: Cary, NC, USA, 2001. [Google Scholar]
  29. Manly, K.F.; Cudmore, R.H., Jr.; Meer, J.M. Map Manager QTX, cross-platform software for genetic mapping. Mamm. Genome 2001, 12, 930–932. [Google Scholar] [CrossRef]
  30. Kosambi, D.D. The estimation of map distances from recombination values. Ann. Eugen. 1943, 12, 172–175. [Google Scholar] [CrossRef]
  31. Churchill, G.A.; Doerge, R.W. Empirical threshold values for quantitative trait mapping. Genetics 1994, 138, 963–971. [Google Scholar] [CrossRef] [PubMed]
  32. Eshed, Y.; Zamir, D. An introgression line population of Lycopersicon pennellii in the cultivated tomato enables the identification and fine mapping of yield-associated QTL. Genetics 1995, 141, 1147–1162. [Google Scholar] [CrossRef]
  33. Tanksley, S.D.; Mccouch, S.R. Seed banks and molecular maps: Unlocking genetic potential from the wild. Science 1997, 277, 1063. [Google Scholar] [CrossRef] [PubMed] [Green Version]
  34. Holmberg, N.; Bülow, L. Improving stress tolerance in plants by gene transfer. Trends Plant Sci. 1998, 3, 61–66. [Google Scholar] [CrossRef]
  35. Cregan, P.B.; Jarvik, T.; Bush, A.L.; Shoemaker, R.C.; Lark, K.G.; Kahler, A.L.; Kaya, N.; Vantoai, T.T.; Lohnes, D.G.; Chung, J.; et al. An integrated genetic linkage map of the soybean genome. Crop Sci. 1999, 39, 1464–1490. [Google Scholar] [CrossRef] [Green Version]
  36. Specht, J.E.; Chase, K.; Macrander, M.; Graef, G.L.; Chung, J.; Markwell, J.P.; Germann, M.; Orf, J.H.; Lark, K.G. Soybean response to water: A QTL analysis of drought tolerance. Crop Sci. 2001, 41, 493–509. [Google Scholar] [CrossRef]
  37. Orf, J.H.; Chase, K.; Adler, F.R.; Mansur, L.M.; Lark, K.G. Genetics of soybean agronomic traits: II. Interactions between yield quantitative trait loci in soybean. Crop Sci. 1999, 39, 1652–1657. [Google Scholar] [CrossRef]
  38. Sehgal, A.; Sita, K.; Siddique, K.H.M.; Kumar, R.; Bhogireddy, S.; Varshney, R.K.; Hanumantharao, B.; Nair, R.M.; Prasad, P.V.V.; Nayyar, H. Drought or/and heat-stress effects on seed filling in food crops: Impacts on functional biochemistry, seed yields, and nutritional quality. Front. Plant Sci. 2018, 9, 1705. [Google Scholar] [CrossRef] [Green Version]
Figure 1. Distribution of seed yield among lines from the nine irrigated (A) and five rain-fed (B) environments in the Hutcheson × PI 471938 population.
Agronomy 11 02207 g001
Figure 2. Graphical comparison of the allelic compositions of ten high- and low-yield individuals at the yield QTLs on Chr 13 (LG F) in the irrigated environments (IR-YLD QTL) and the maximum likelihood plot indicating the regions of the IR-YLD QTLs. The white, gray, and black segments indicate the homozygous PI 471938 alleles, the heterozygous alleles, and the homozygous Hutcheson alleles, respectively.
Agronomy 11 02207 g002
Figure 3. Graphical comparison of the allelic compositions of ten high- and low-yield individuals at the yield QTLs on Chr 13 in the rain-fed environments (RF-YLD QTL) and the maximum likelihood plot indicating the regions of RF-YLD QTLs. The white, gray, and black segments indicate the homozygous PI 471938 alleles, the heterozygous alleles, and the homozygous Hutcheson alleles, respectively.
Agronomy 11 02207 g003
Figure 4. Maximum likelihood plot for Chr 17 (LG D2) indicating the genomic position of the IR-YLD and RF-YLD QTLs. The dotted and solid lines indicate the plots from the irrigated and rain-fed environments, respectively.
Agronomy 11 02207 g004
Table 1. Single-factor analysis of variance representing the putative markers significantly associated with seed yield from the irrigated environments (p ≤ 0.05).
Chr(LG)Marker 1p-ValueR2 (%)Additive Effect 2Allelic Means (kg ha−1) 3
Hut/HutHut/PIPI/PI
17(D2)Satt2260.025350.59303730973104
13(F)Sat_3750.026150.59304430713124
13(F)Sat_0740.00298−0.72312430773024
18(G)Satt2170.018960.57304430983124
9(K)Satt5180.047940.57304430983118
1 Independent markers with a distance > 50 cM from the neighboring markers significantly associated with seed yield in the irrigated environments. 2 Allelic effect of substituting PI 471938. 3 Hut/Hut, homozygous allele from Hutcheson; Hut/PI, heterozygous allele from Hutcheson and PI 471938; PI/PI, homozygous allele from PI 471938.
Table 2. Single-factor analysis of variance representing the putative markers significantly associated with seed yield from the rain-fed environments (p ≤ 0.05).
Chr(LG)Marker 1p-ValueR2 (%)Additive Effect 2Allelic Means (kg ha−1) 3
Hut/HutHut/PIPI/PI
1(D1a)Satt5070.039050.43180118071854
2(D1b)Satt2960.01436−0.40186818071814
17(D2)Satt2260.003080.54179418281868
13 (F)Sat_3750.0000160.69178718071888
9 (K)Satt1370.013260.41180118141861
1 Independent markers with a distance > 50 cM from the neighboring markers significantly associated with seed yield in the rain-fed environments. 2 Allelic effect of substituting PI 471938. 3 Hut/Hut, homozygous allele from Hutcheson; Hut/PI, heterozygous allele from Hutcheson and PI 471938; PI/PI, homozygous allele from PI 471938.
Table 3. Multiple regression analysis within and among linkage groups for DNA markers associated with seed yield in the irrigated and rain-fed environments.
EnvironmentMarkerChr (LG)SF AnalysisR2 (%) from Multiple Regression 1Positive Allele
R2 (%)p ValueWithin ChrAmong Chrs
IrrigatedSat_37513 (F)50.026143PI 471938
Sat_07413 (F)80.002998Hutcheson
Satt21718 (G)60.018975PI 471938
Sat_09418 (G)70.011056Hutcheson
Rain-fedSatt5071 (D1a)50.039056PI 471938
Satt22617 (D2)80.003083PI 471938
Sat_37513 (F)160.00001415PI 471938
Satt24416 (J)60.013046PI 471938
Satt1379 (K)60.013274PI 471938
1 Only significant markers (p ≤ 0.05) from the SF analysis were included in the multiple regression analysis to detect the markers with the greatest contributions. The multiple regression analysis among Chrs included the markers based on the SF analysis (from Chrs having only one significant marker) plus the markers retained through the multiple regression analysis within Chrs (having ≥2 significant markers).
Table 4. Single-factor analysis of variance representing the independent markers significantly associated with canopy wilting during drought stress (p ≤ 0.05).
Chr (LG)Marker 1p-ValueR2 (%)Allelic Means 2
Hut/HutHut/PIPI/PI
visual rating (0 = no stress, 5 = dead)
4 (C1)Satt1940.021162.42.32.3
1 (D1a)Satt5070.027452.42.32.2
17 (D2)Sat_3650.034652.42.22.3
13 (F)Sat_3750.045942.42.32.2
9 (K)Sat_0870.001992.22.32.4
1 Independent markers with a distance > 50 cM from the neighboring markers significantly associated with the canopy wilting rate in the stress environment. 2 Hut/Hut, homozygous allele from Hutcheson; Hut/PI, heterozygous allele from Hutcheson and PI 471938; PI/PI, homozygous allele from PI 471938.
Table 5. Mean yield of four genotypic groups from the interacting marker pairs in the irrigated (Satt546 and Satt395) and rain-fed environments (Sat_365 and Satt298, Sat_362 and Sat_375). Bold values represent the highest yield of the genotypic class for the interacting markers.
Satt546 (Chr 2)Satt395 (Chr 13)Mean
Hut/Hut 1PI/PI 1
kg ha−1
Hut/Hut311829633057
PI/PI315830643097
Mean31383044
Sat_365 (Chr 17)Satt298 (Chr 11)Mean
Hut/HutPI/PI
Hut/Hut174718011794
PI/PI184118681861
Mean17941848
Sat_365 (Chr 17)Sat_375 (Chr 13)Mean
Hut/HutPI/PI
Hut/Hut176018751794
PI/PI177419011854
Mean17941888
1 Hut/Hut, homozygous allele from Hutcheson; PI 471938; PI/PI, homozygous allele from PI 471938.
Publisher’s Note: MDPI stays neutral with regard to jurisdictional claims in published maps and institutional affiliations.

