Article

Genome-Wide Association Study (GWAS) of Mesocotyl Length for Direct Seeding in Rice

1
Department of Plant Bioscience, College of Natural Resources and Life Science, Pusan National University, Miryang 50463, Korea
2
Life and Industry Convergence Research Institute, Pusan National University, Miryang 50463, Korea
3
Department of Crop Science, Konkuk University, Seoul 05029, Korea
*
Authors to whom correspondence should be addressed.
These authors contributed equally to this work.
Agronomy 2021, 11(12), 2527; https://doi.org/10.3390/agronomy11122527
Submission received: 25 October 2021 / Revised: 29 November 2021 / Accepted: 7 December 2021 / Published: 13 December 2021
(This article belongs to the Special Issue Molecular Marker Assisted Crop Breeding)

Abstract

:
Direct seeding is considered an efficient cultivation technology that reduces water use and labor costs. Mesocotyl length is one of the significant traits in cultivation; long mesocotyl is beneficial for the rate and uniformity of seedling emergence. In this study, we used a core collection of 137 rice accessions to identify quantitative trait loci (QTL) for mesocotyl elongation. A genome-wide association study (GWAS), combined with a principal component analysis (PCA) and a kinship matrix analysis, was conducted for the genotype analysis of 2 million, high-quality single nucleotide polymorphisms (SNPs). Through this GWAS analysis, 11 lead SNPs were confirmed to be associated with mesocotyl length, and a linkage disequilibrium (LD) decay analysis identified the 230 kb exploratory range for the detection of QTLs and candidate genes. Based on the gene expression database and haplotype analysis, five candidate genes (Os01g0269800, Os01g0731100, Os08g0136700, Os08g0137800, and Os08g0137900) were detected to be significantly associated with phenotypic variation. Five candidate gene expressions are reported to be associated with various plant hormone responses. Interestingly, two biotic stress response genes and two copper-containing redox proteins were detected as the candidate genes. The results of this study provide associated SNPs in candidate genes for mesocotyl length and strategies for developing direct seeding in breeding programs.

1. Introduction

Rice (Oryza sativa L.) is one of the most important staple food crops grown worldwide. Rice cultivation based on transplanted seedlings sown on puddled soil is a process that requires a uniform and precise seeding rate. One of the other methods, direct seeding, involves sowing seeds directly on puddled or submerged soil [1]. The difference between the two rice cultivation methods is that the latter is a water efficient and labor-saving approach; direct seeding can reduce the cost of production by 50% [2,3]. Unlike transplant seedling, in direct seeding the seeds are exposed on the surface of a field without the seedling process that depends on difference traits.
Faster and uniform germination has been reported to affect plant growth and development; rice that is suitable for direct seeding should also be applied with high germination ability, seedling vigor, fast root growth, early tillering ability, and lodging resistance [1,4,5].
One of the traits, mesocotyl elongation, significantly affects the trait of rice seedling establishment [6].
The mesocotyl is an embryonic structure between the coleoptilar node and the basal part of the seedling, and it elongates to push the shoot tip above the soil surface during germination [7]. Previous studies have indicated that mesocotyl elongation is regulated by genetic factors and environmental signals, such as light, temperature, auxin, abscisic acid (ABA), and jasmonate (JA) [8,9,10,11,12,13].
Light is one of the significant factors affecting mesocotyl elongation that is immediately inhibited by light exposure and significantly promoted in the darkness. Temperature is also another factor regulating mesocotyl elongation, with optimum temperature playing a promoting role; conversely, either high or low temperature was reported to be injurious to mesocotyl elongation [9,12]. The transport of auxin from the coleoptile to the mesocotyl inhibited mesocotyl elongation, and ABA promoted an increase in the cell division activity of meristem but was inhibited by endogenous JA in rice. Therefore, mesocotyl elongation has great significance in rice direct-seeding production [8,10,11,13].
Generally, the indica variety, as compared with the japonica variety, shows a distinct mesocotyl elongation and a clearer variant [7]. In addition, the upland rice develops more longer mesocotyl as compared with paddy rice; moreover, the mesocotyl length of rice varieties in east Asia have longer length compared with rice varieties in west Asia [14,15,16].
The mesocotyl elongation trait is known to be controlled by quantitative trait loci (QTLs) and affected by many genetic and environmental factors [7]. Previously, several QTL studies have reported genetic information; their elongation shows significant variation across genotypes. Mesocotyl elongation is greater in indica rice than in japonica rice, whereas the coleoptile is longer in japonica cultivars than in indica cultivars under submerged conditions [7,17,18]. Among japonica cultivars, upland rice generally produces shorter coleoptiles and longer mesocotyls than lowland rice [14]. Quantitative trait loci (QTLs) associated with mesocotyl elongation in rice have been reported using various segregating populations. Five QTLs (qML1, qML2, qML3, qML6, and qML11) were reported for mesocotyl elongation on Chromosomes 1, 2, 3, 6, and 11 by using a recombinant inbred line (RIL) population derived from a cross between two japonica varieties [19]. Three QTLs (qMEL-1, qMEL-3, and qMEL-6) were detected on Chromosomes 1, 3, and 6 in a backcross inbred line (BIL) from a cross between Nipponbare and Kasalath [6].
Genome-wide association study (GWAS) based on linkage disequilibrium (LD) and single sequence repeat (SSR) markers or single nucleotide polymorphism (SNP) markers have been widely used to identify loci significantly associated with many traits in model plant species, including rice. Through a GWAS associated with mesocotyl elongation in rice, Wu et al. (2015) reported 13 loci on Chromosomes 1, 3, 4, 5, 6, and 9 for mesocotyl elongation based on a subset of 144,994 SNPs, a mini core collection of Chinese rice germplasm (170 accessions) and a set of variety collected (100 accessions) [20].
One important requirement of direct seeding cultivation is a yield above a certain amount, which is influenced by early establishment, efficiency of photosynthesis, planting density, nitrogen and sunshine concerning the number of panicle per area, disease or insect pests, meiosis, and temperature of the ripening stage [1,4].
Among the requirements of direct seeding cultivation, establishment rate is the most important factor for a secure yield. Establishment rate varies according to soil depth, mesocotyl elongation, low temperature germination ability, and competition against weeds. The establishment status of a crop can be evaluated based on the number of established plants or weight per seedling and can also be expressed as the ratio of survival seedlings to the number of sown seeds and total production per unit area. A study on direct seeding aptitude was carried out to evaluate the rice crop establishment using Vietnamese germplasm [21]. In order to provide genetic information on mesocotyl elongation for rice breeders and geneticists, here, we conducted a GWAS to suggest candidate genes associated with the mesocotyl elongation trait.

2. Materials and Methods

2.1. Plant Materials and Genomic Data

A core set of 137 rice accessions from the National Agrobiodiversity Center of the Rural Development Administration (RDA, Korea) was used to detect variations in mesocotyl elongation (Table S1). The 137 rice accessions were suggested by Kim et. al. (2007) as the Korean Rice Core Selection, which had been collected from 28 countries, selected from 25,604 rice accessions, and could be divided into 6 subgroups: tropical japonica (19 accessions), temperate japonica (62), indica (43), aus (8), aromatic (3), and admixture (2) [22,23]. The genomic data of the 137 rice accessions were obtained from an average coverage of approximately 8× on an Illumina HiSeq 2500 Sequencing Systems Platform (Illumina Inc., San Diego, USA). Raw reads were aligned against the rice reference genome (IRGSP 1.0) for genotype calling. To generate the genotype dataset, the following parameters were used for GWAS: missing value <1% and a minor allele frequency (MAF) >5% and a heterozygosis ratio <5%, as implemented using Plink software [24]. Finally, approximately 2 million high quality SNPs were obtained from 6.5 million raw data SNPs for the further GWAS [24,25,26].

2.2. Evaluation of Mesocotyl Length

To measure the variation of mesocotyl length in each accession, two biological replications were conducted. In each replication, 20 good quality seeds were disinfected in 70% ethanol and 1% hypochlorite for 5 min and 10 min, respectively. The seeds of each variety were put in 0.3% micro agar (Duchefa Bio, Haarlem, Netherlands) at a depth of 1 cm contained in Incu tissue (SPL, Pocheon, Korea). After sowing, the Incu tissues were wrapped in aluminum foil for dark germination and were kept in a plant growth chamber at alternating temperatures of 30 °C and 25 °C (14 h/10 h). At thirty days after sowing, six randomly selected seedlings from each hole were carefully excavated and washed for measuring mesocotyl elongation length using rulers, and the average of mesocotyl lengths from six seedlings were used in the GWAS analysis [27,28].

2.3. Population and Genotype Analysis

The population structure and cross-validation (CV) analysis of the 137 accessions were analyzed using ADMIXTURE version 1.3.0 [29], with subgroups assigned according to the delta K value. For each result, visualizations were performed in the Structure Plot V2.0 web application (http://omicsspeaks.com/strplot2/, accessed on 1 September 2021), and the R calculation of principal component analysis (PCA) based on the compressed mixed linear model (MLM) were conducted using the R package of Genomic Association and Prediction Integrated Tool (GAPIT) [30,31]. A PCA plot visualization was also performed in R software. Neighbor-joining trees (NJ-Tree) were analyzed using MEGA X [32], with the Newick format file output used for modified visualization in the Interactive Tree of Life (iTOL) website (https://itol.embl.de/, accessed on 1 September 2021) [33]. A linkage disequilibrium (LD) decay analysis to identify candidate regions was performed using PopLDdecay version 3.27 [34].

2.4. GWAS Analysis

A GWAS analysis was performed for analyzing associations between genotype and phenotype using the GAPIT package (version 3.0) in R [31,35]. In addition, the mixed linear model (MLM) was adopted and a principal component analysis (PCA) and kinship were also used to validate population stratification with the GAPIT. To screen significant SNPs, the genotype was filtered by software PLINK [24]. Noneffective SNPs were removed, and a total of 97,469 effective and independent SNPs remained. A genome-wide threshold was calculated using the formula: “−log10 (1/number of effective SNPs)”. Finally, markers with an adjusted –log10 (p-value) ≥ 9 were regarded to be the significant ones for identification of association loci and SNP markers located at locus peaks [36].

2.5. Haplotype Analysis

For the haplotype analysis, SNP markers, except missing and heterozygote SNPs, were used to perform the analysis. The average score and variety count were determined from phenotype data for each variety, and haplotypes were identified that were significantly associated with the phenotype. The linkage disequilibrium (LD) analysis was constructed using HaploView 4.2 [37]. The haplotype variation analysis was performed using PopART software [38]. The online tool Gene Structure Display Server 2.0 [39] was used for visualization of gene structure and SNP position.

3. Results

3.1. Phenotypic Variation of Mesocotyl Elongation

The following six rice subspecies encompassing 137 rice accessions were used for assessment of mesocotyl length: Tropical japonica, temperate japonica, indica, aus, aromatic, and admixture. A wide range of mesocotyl lengths in different rice accessions was observed in the dark germination experiments. Two biological replications were conducted. In the first replication, the mesocotyl lengths ranged from 0 to 44.2 mm with an average of 4.2 mm. In the second replication, the mesocotyl lengths ranged from 0 to 43.4 mm, with an average of 4.9 mm (Figure 1a). The results of these two replications showed a high positive correlation of 0.90 *** (Figure 1a). The aus group had substantially longer mesocotyl length than other groups, and the admixture and aromatic groups had slightly longer mesocotyl lengths than the tropical japonica, temperate japonica, and indica groups (Figure 1b,c).

3.2. Population Structure and LD Decay Analysis

The cross-validation (CV) analysis was conducted using ADMIXTURE version 1.3.0, which indicated K = 6 for the optimal population grouping and had the lowest error ratio compared with other K values (Figure 2a). The PCA analysis showed that the top two PCs each explained each 61.86% and 25.12%, which could explain most of the variation to select for visualization. Significant clusters belonging to the tropical japonica, temperate japonica, indica, and aus subspecies were observed in the PCA analysis (Figure 2b). The NJ-Tree analysis also represented similar results; most accessions clearly distinguished genetic distance and only accessions of admixture and aroma exhibited dispersion among diverse clusters (Figure S1). The population structure plot of 137 accessions was generated using Structure Plot V2.0, which was also divided into six groups that distinguished their subspecies. Temperate japonica was divided into Clusters 1 and 5, indica was divided into Clusters 3 and 4, admixture was divided into Clusters 2 and 3, and aromatic was divided into Cluster 2 and 6. Tropical japonica was dominant in Cluster 2, and aus was dominant in Cluster 6 (Figure 2c and Table S1). The estimate of genome-wide LD decay along physical distances was calculated using r2 of allele pairs between two loci for the 137 rice accessions. The maximal r2 value was 0.52, the threshold value was determined to be 0.26 half of the maximal r2 value, and the LD decay distance was about 230 kb for a genomic candidate region (Figure S2).

3.3. GWAS for Mesocotyl Length

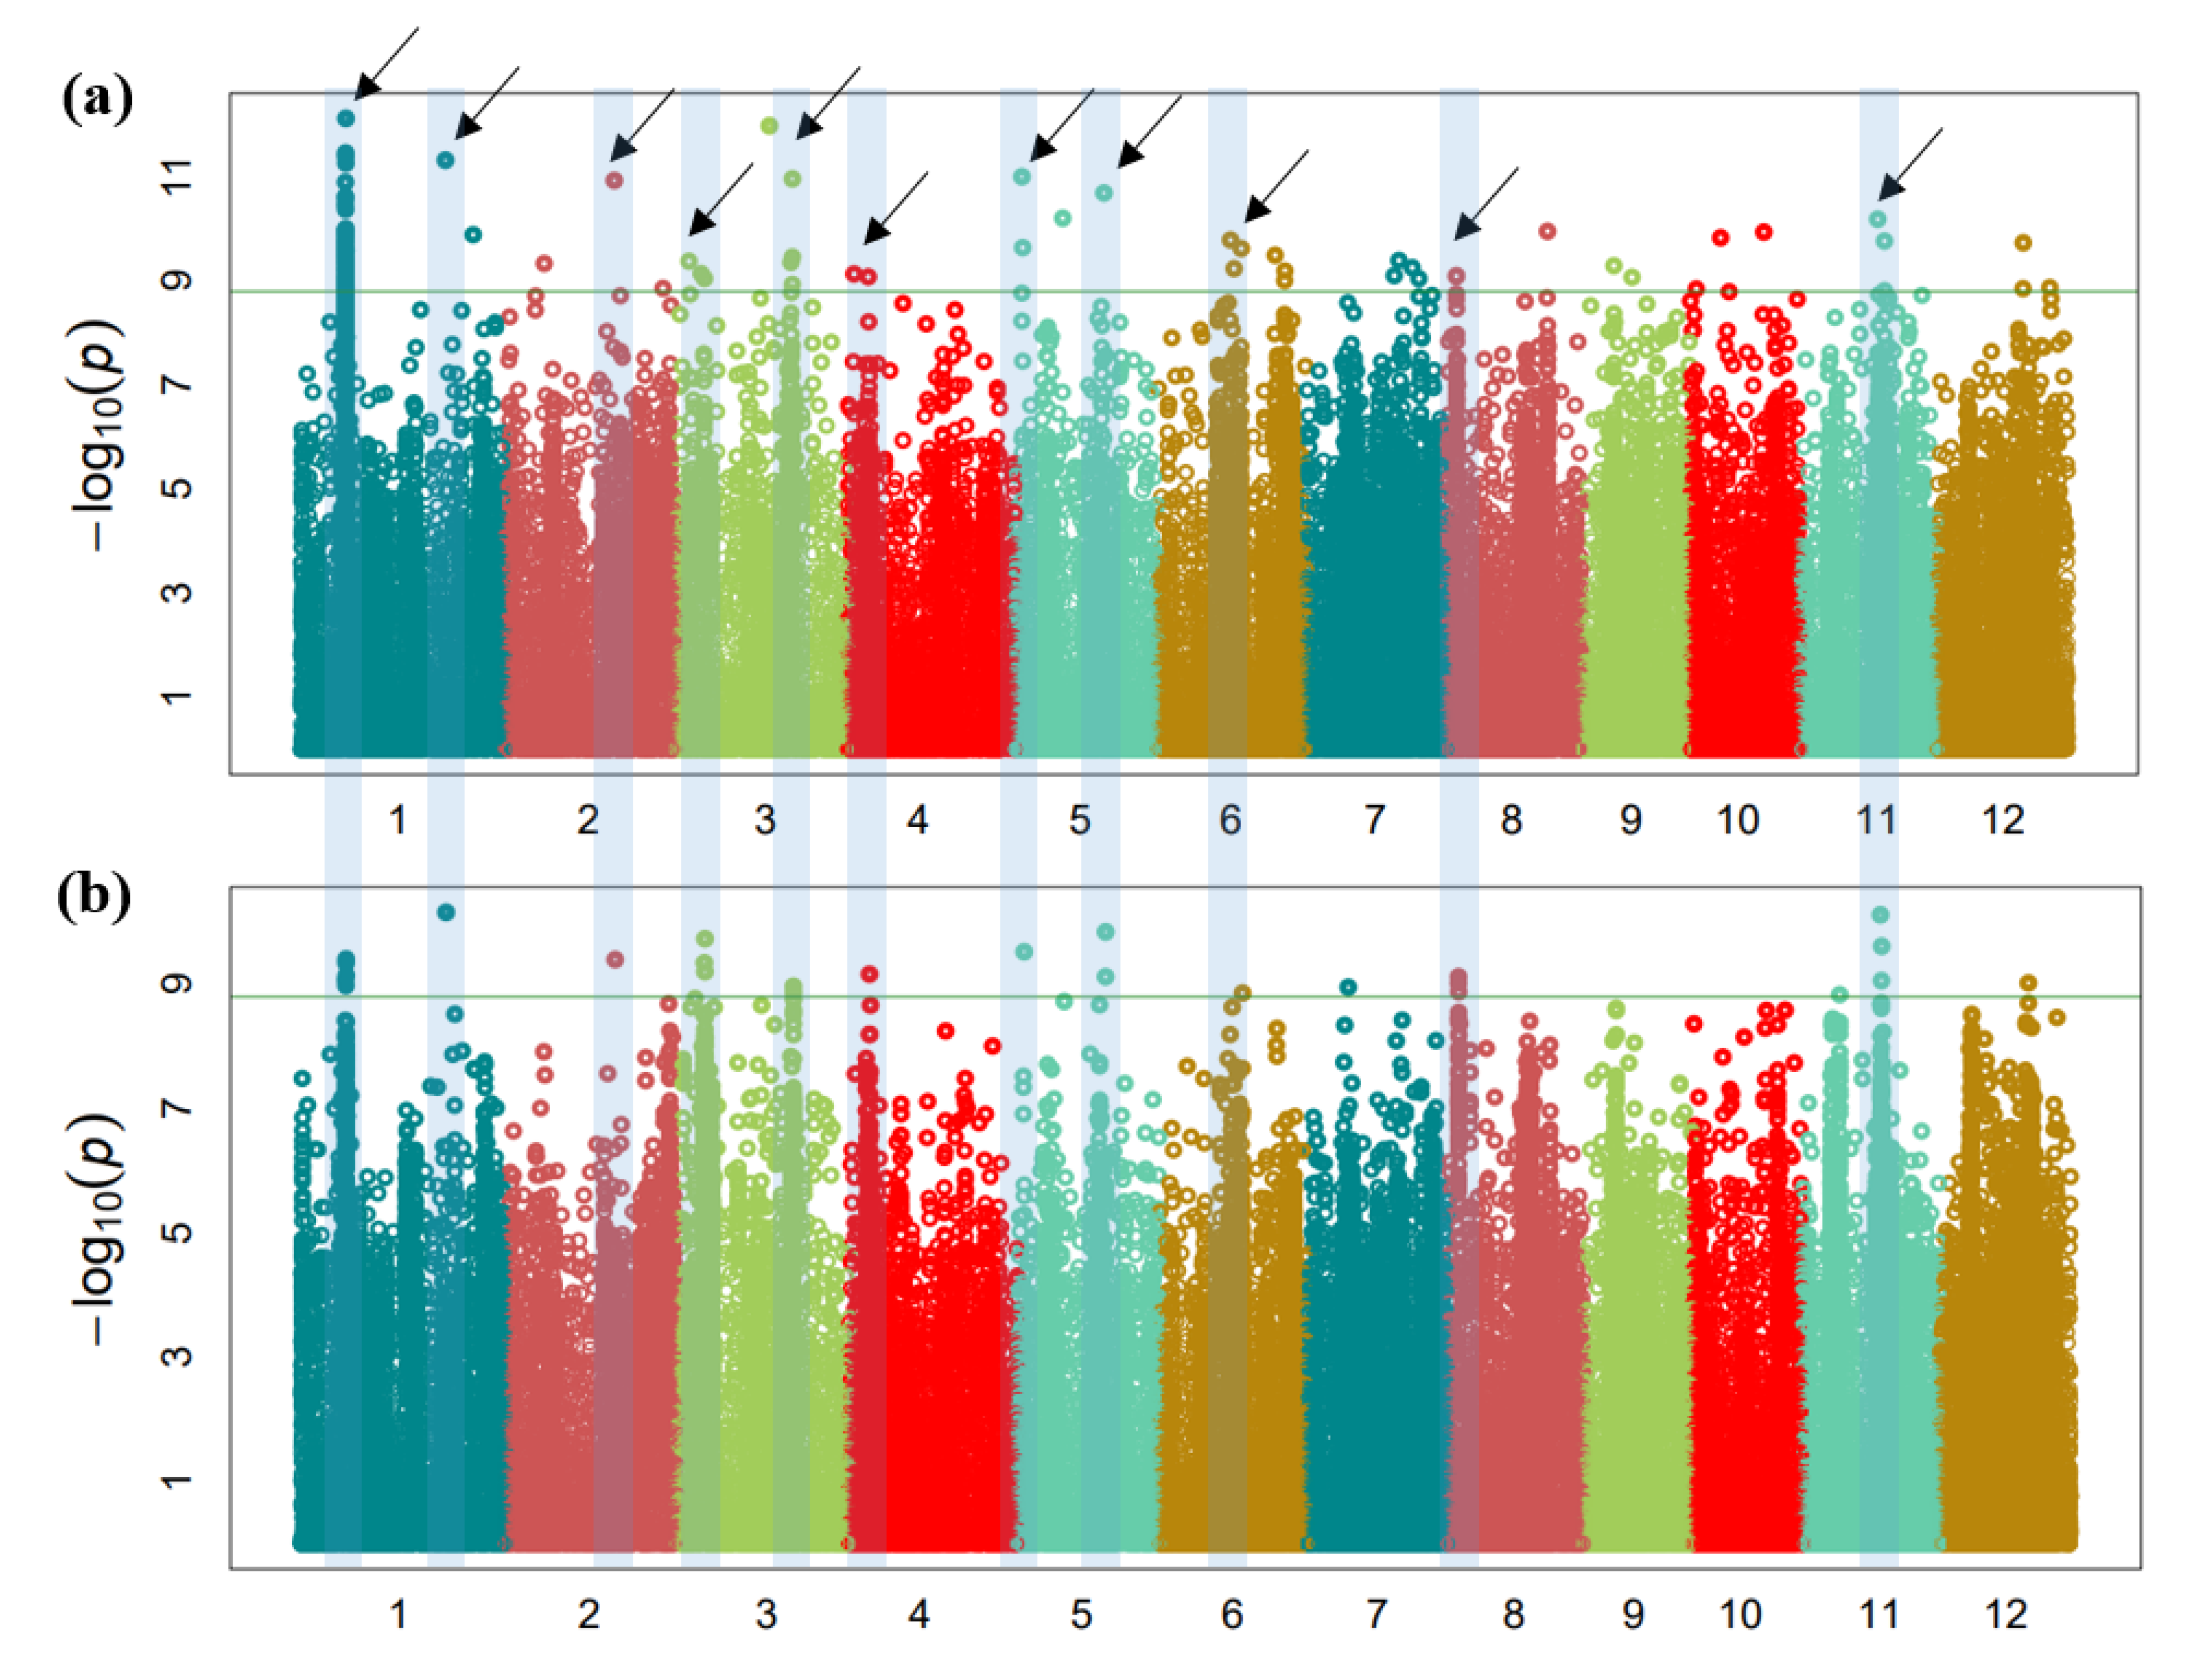
The GWAS analyses for mesocotyl lengths with two replications were conducted separately using the GAPIT package in R. Manhattan plots for the SNPs significantly associated with mesocotyl lengths of two replications are shown in Figure 3. The threshold was set as -log(p) ≥ 9 at a significant level of 0.01 after Bonferroni multiple test correction for significantly associated SNPs. In the first replication, 23 lead SNPs were detected. In the second replication, 14 lead SNPs were detected (Figure 3).
Considering the size of the LD block, the lead SNPs located inside the 460 kbp were regarded as being overlapped. Among the 37 lead SNPs, we focused on the lead SNPs which were overlapped in both replicated experiments. Finally, 11 overlapped lead SNPs were detected as QTLs for mesocotyl length as compared with previously reported QTLs based on Gramene (http://archive.gramene.org, accessed on 3 September 2021) (Table 1). Three QTLs (qML3-2, qML6, and qML11) were overlapped with previously reported QTLs for mesocotyl length. Three QTLs (qML1-1, qML1-2, and qML2) were overlapped with previously reported QTLs for drought tolerance. Four QTLs (qML3-1, qML4, qML5-1, and qML5-2) were overlapped with previously reported QTLs for germination-related traits. One QTL (qML8) was overlapped with previously reported QTLs for submergence tolerance. For the 11 overlapped loci, all the annotated genes within the 460 kbp region encompassing the lead SNPs were extracted. A total of 340 genes are located in those regions based on the Rice Annotation Project Database (RAP-DB) (IRGSP 1.0). Since the target trait of mesocotyl length was highly associated with various plant hormones such as abscisic acid (ABA), brassinosteroid (BR), strigolactones (SLs), cytokinin (CTK), ethylene (ETH), jasmonic acid (JA), gibberellin (GA), and indole-3-acetic acid (IAA) [40], we searched the gene expression pattern of 340 genes in response to plant hormone treatment through the rice gene expression database of RiceXPro (https://ricexpro.dna.affrc.go.jp/, accessed on 3 September 2021) and the Transcriptome Encyclopedia of Rice (TENOR, (http://tenor.dna.affrc.go.jp/, accessed on 3 September 2021). Among the tested 340 genes, the expression of 33 genes in response to plant hormones were detected. Next, we conducted the haplotype analysis with those genes and detected statistically significant phenotype differences among the haplotypes in 33 candidate genes. On the basis of the phenotypic differences among haplotypes and the functional annotation of genes, we selected five candidate genes for mesocotyl length.

3.4. Haplotype Analysis

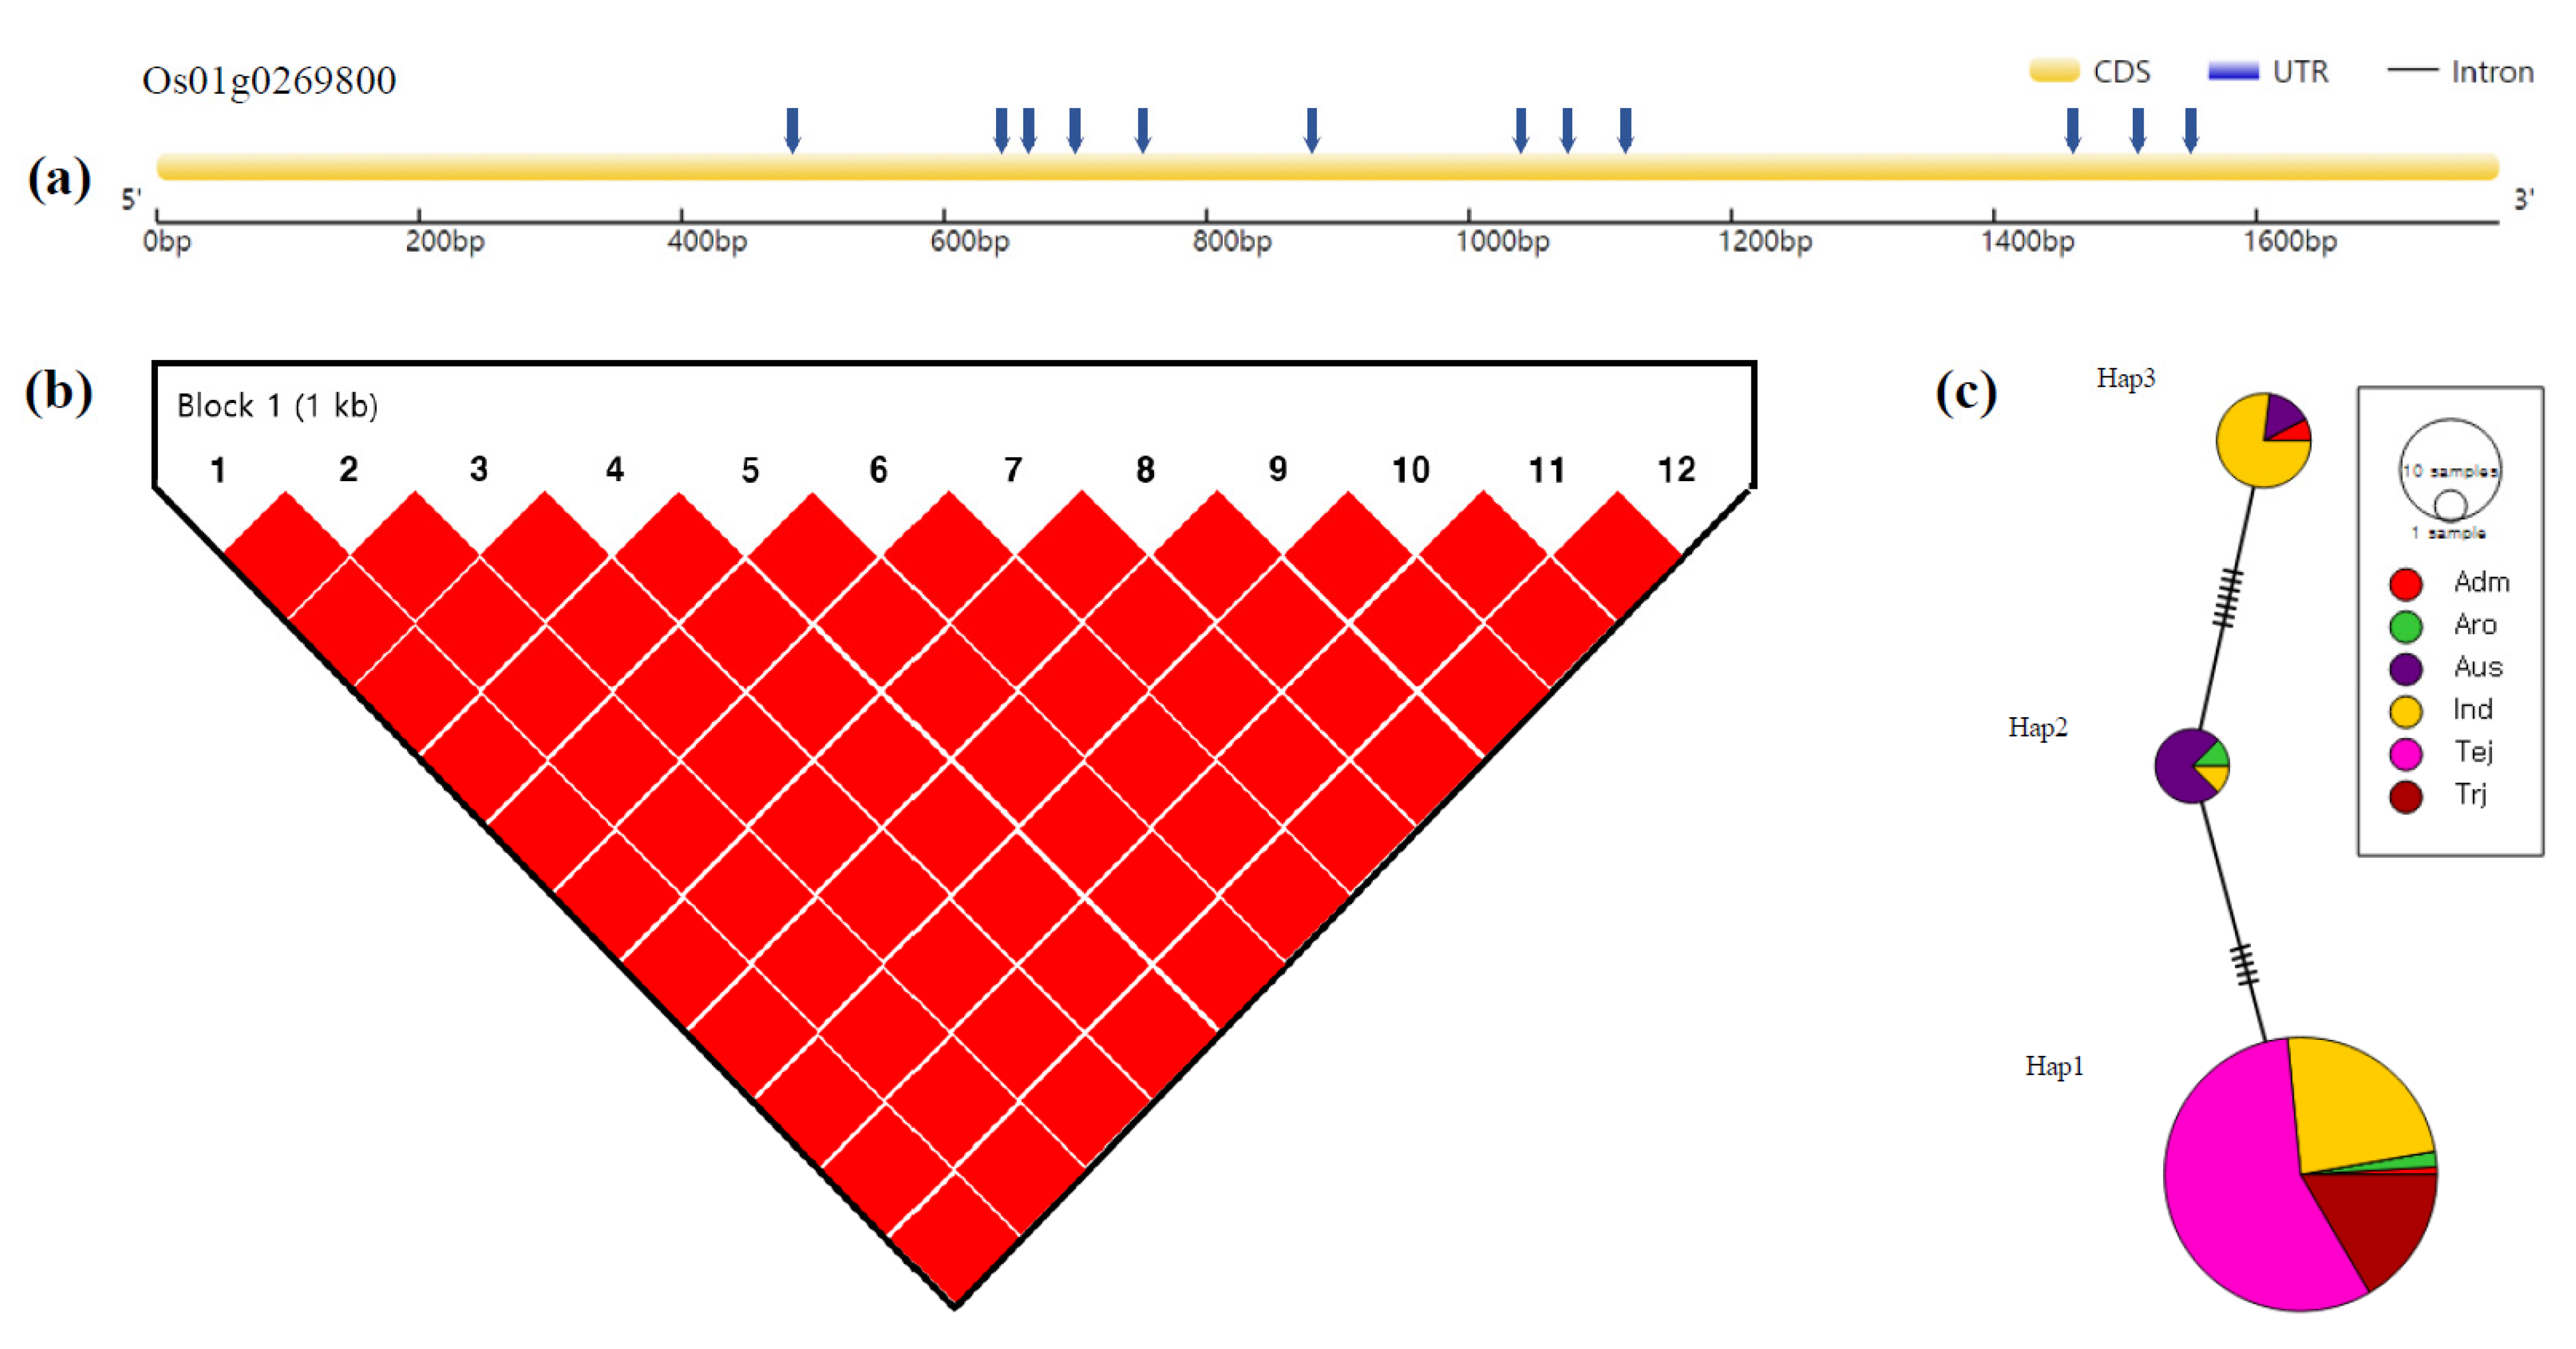
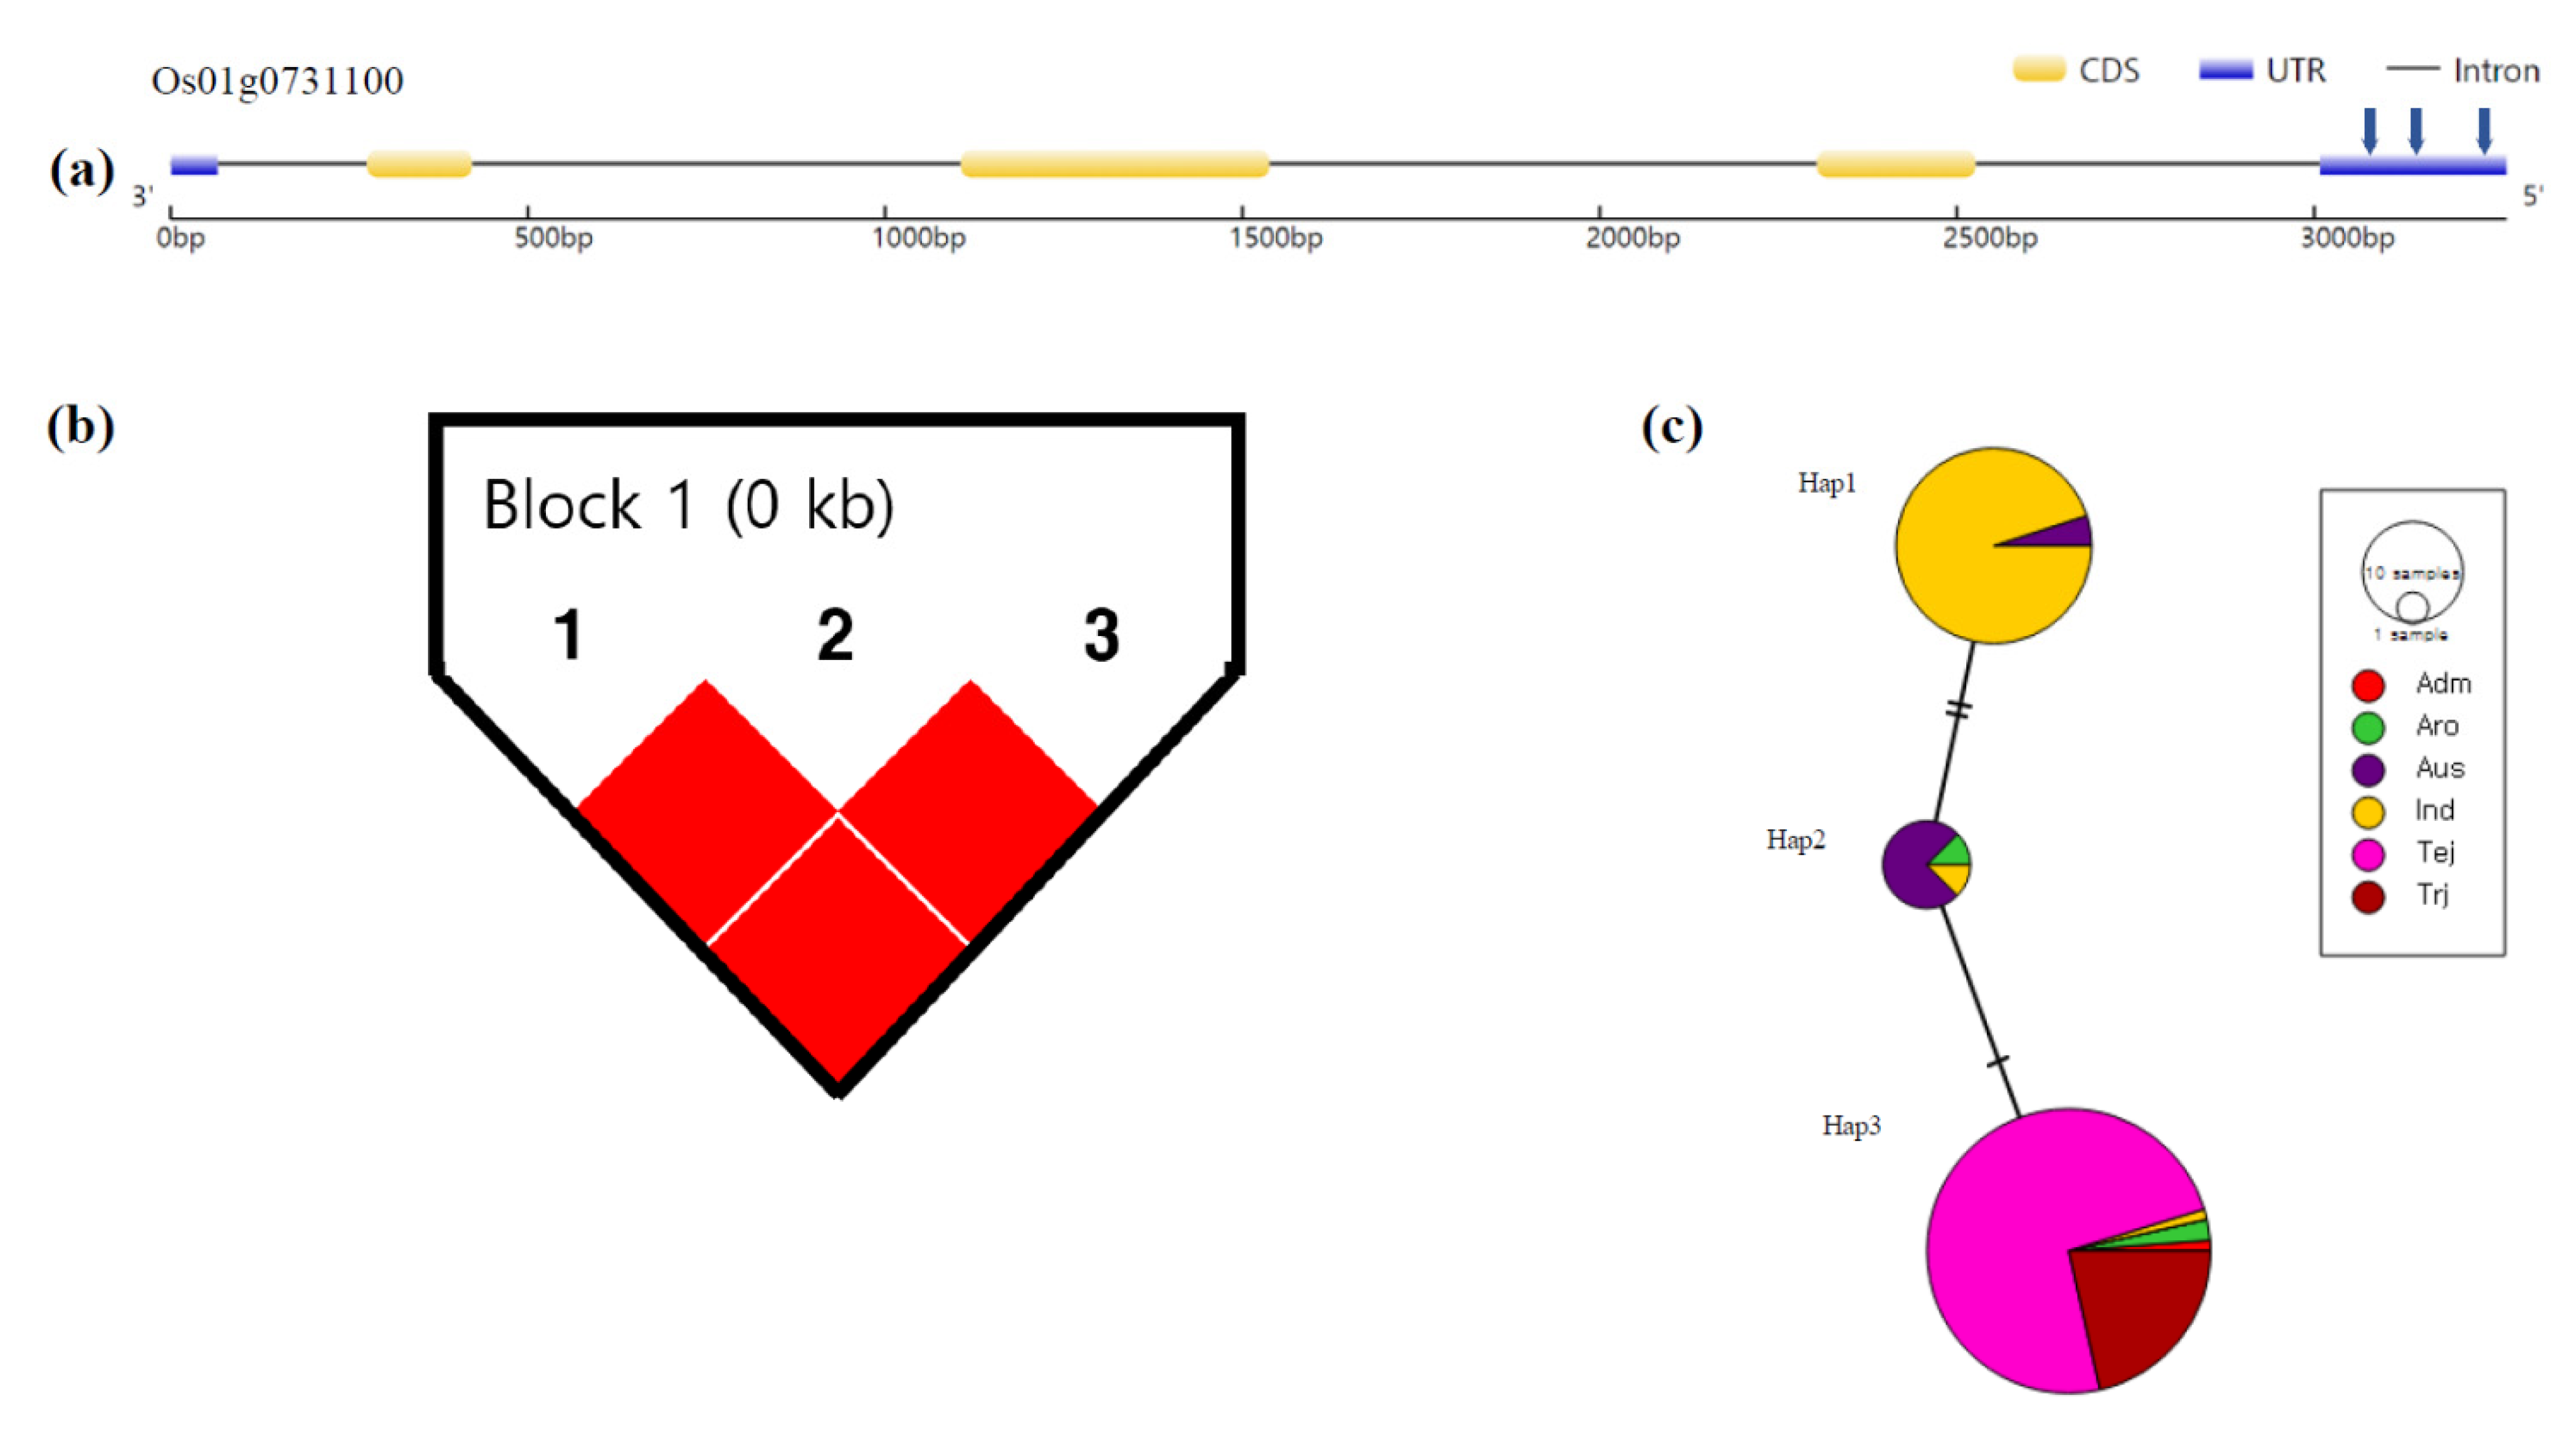
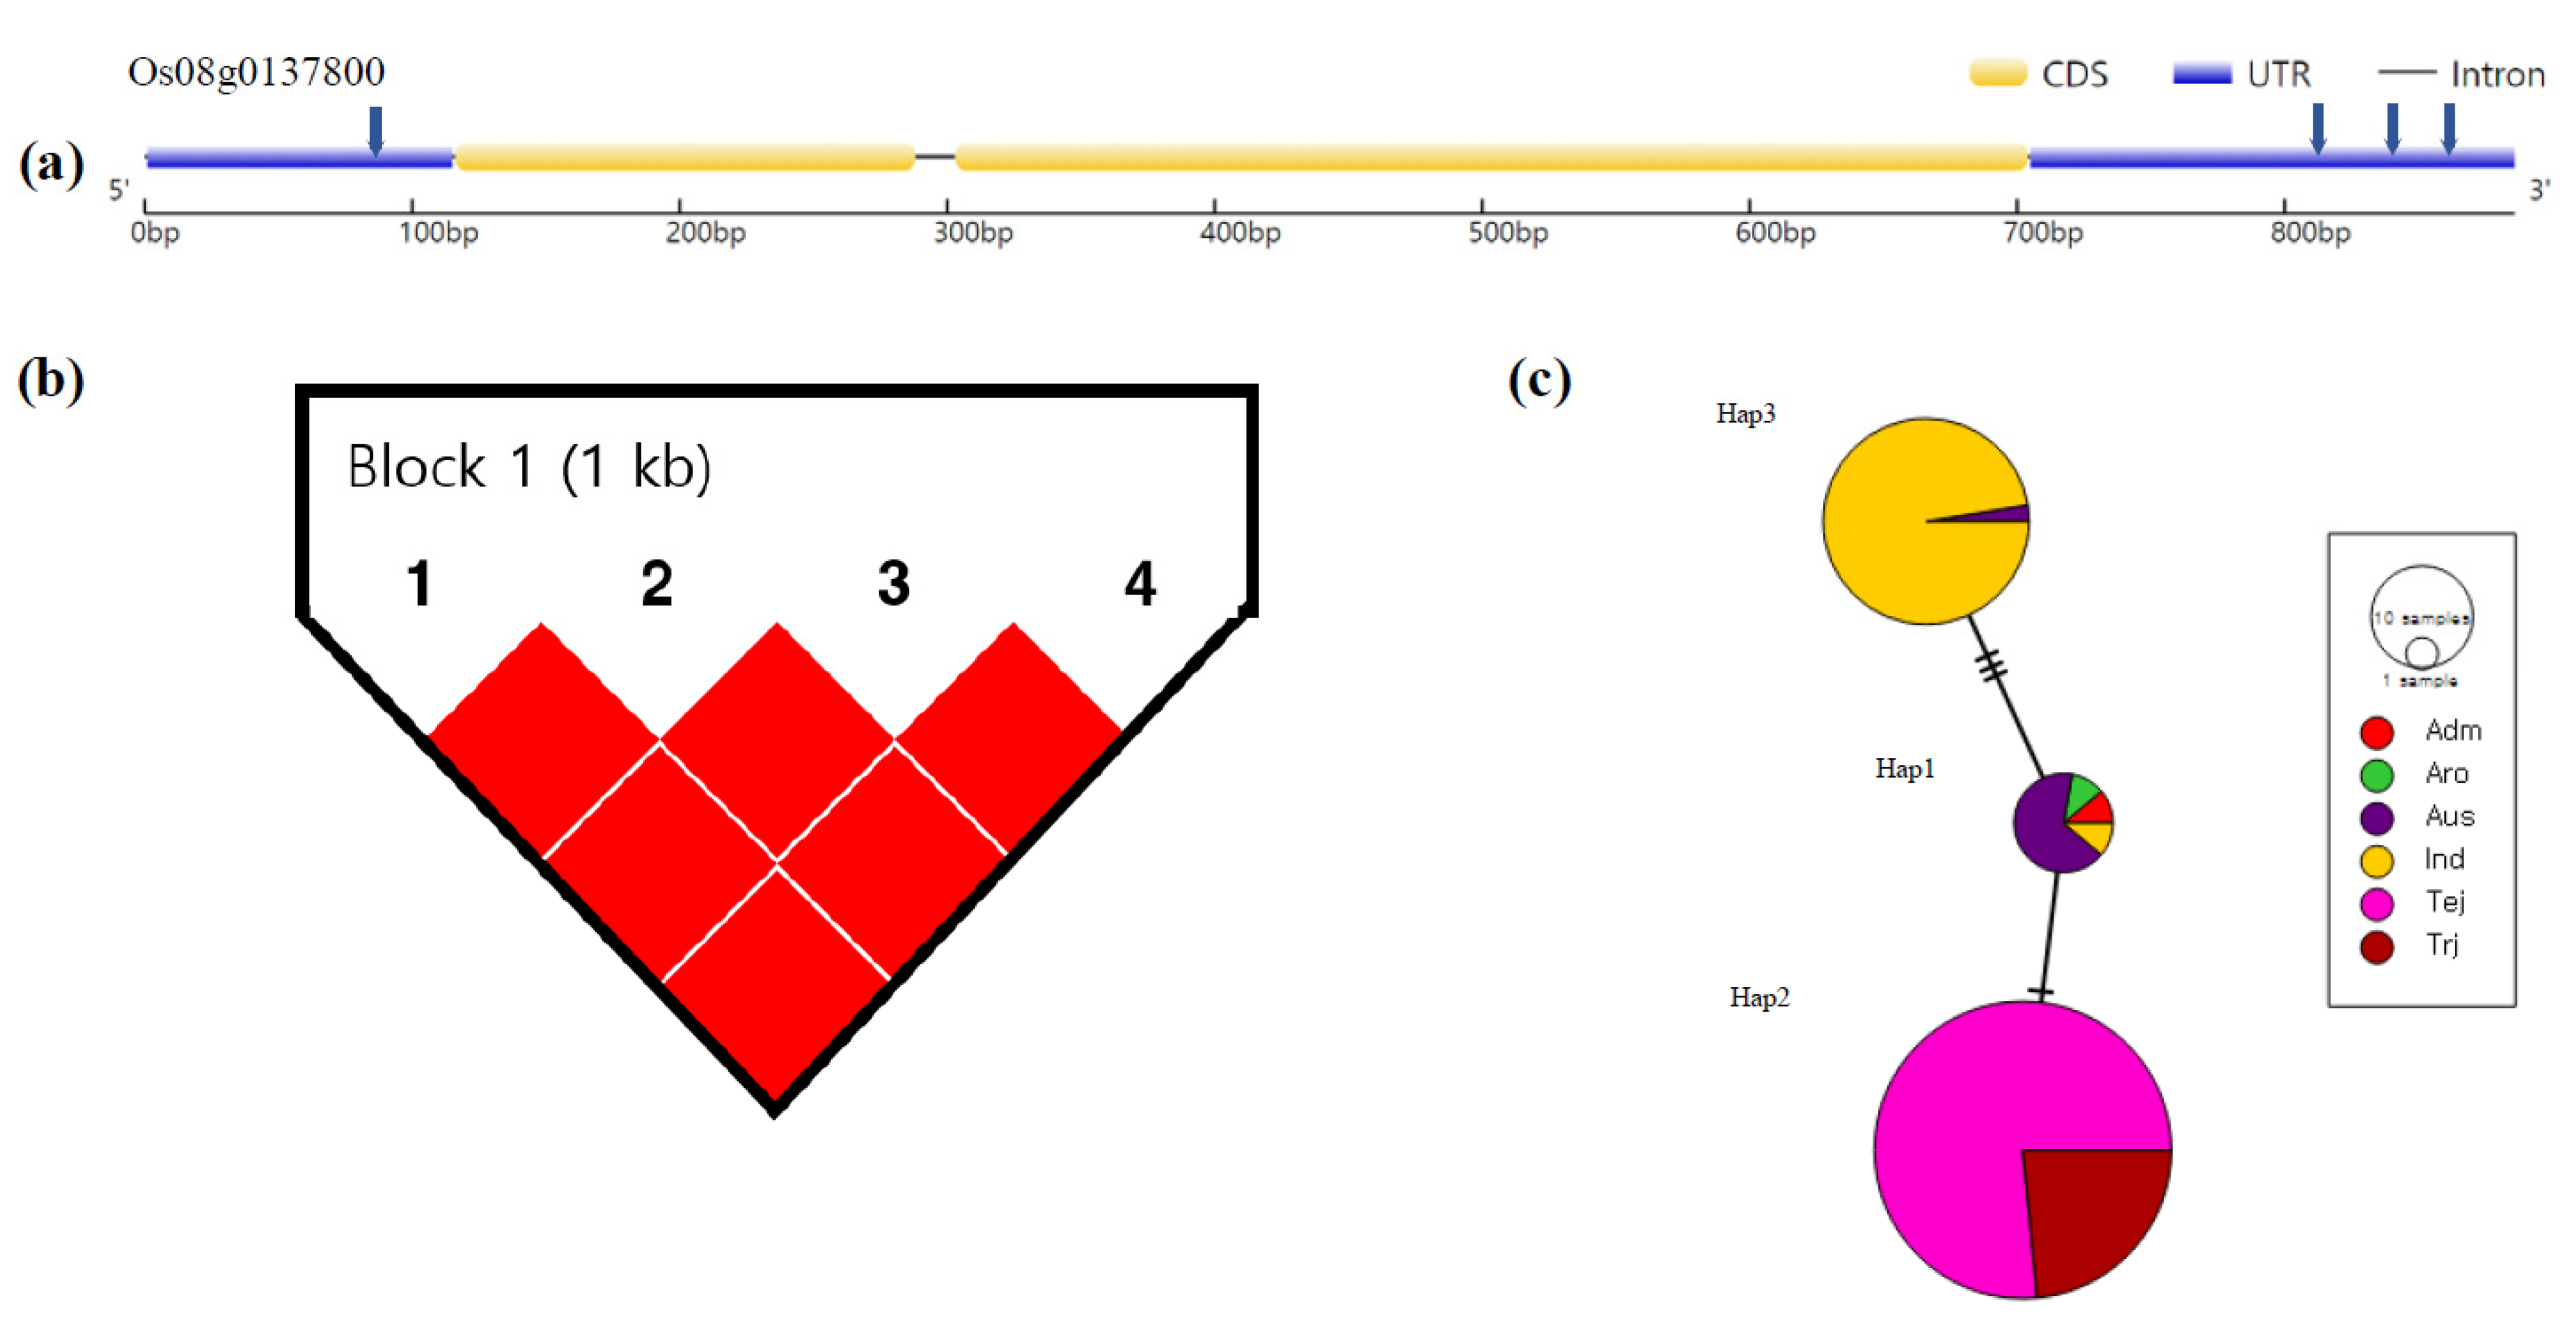
From the results of the haplotype analysis, five candidate genes showed significant differences among the groups of haplotypes (Supplementary Tables S1 and S2). Finally, these five genes were detected as candidate genes for mesocotyl length. One of these candidate genes, Os01g0269800, contained 12 SNPs in the exon region (Figure 4a), and the LD block showed significantly strong LD between each of the SNPs (Figure 4b). The haplotype analysis of the 136 accessions showed that the 12 SNPs divided into three haplotypes, with the maximum phenotypic mesocotyl length variation of 16.66 mm between haplotype 1 and haplotype 2 (Hap 1 and Hap 2) (Table 2). Mesocotyl length was significant with Hap 1 and Hap 3 but was not significant with Hap 2. This was expected, as the major constituents of this haplotype were the aus varieties (Figure 4c). The Os01g0731100 gene contained three SNPs in the 5′ untranslated region (UTR) (Figure 5a). The LD block had similar results with the Os01g0269800 gene, i.e., significantly strong LD between each of the SNPs (Figure 5b). Three SNPs were divided into three haplotypes with maximum phenotypic variations of 18.64 mm for mesocotyl length between Hap 2 and Hap 3 (Table 3). Hap 2 was the superior genotype in aus and a few other varieties (Figure 5c). Hap 2 of the Os01g0731100l gene was the superior genotype in the aus varieties. The Os08g0136700 gene contained three SNPs in the exon region (Figure 6a). Three SNPs were divided into four haplotypes with maximum phenotypic variations of 14.95 mm between Hap 1 and Hap 4 (Table 4). Hap 3 and Hap 4 showed the same significant level which included aus, indica, and a few other varieties (Figure 6b,c). The Os08g0137800 gene contained four SNPs in the 5′ UTR and 3′ UTR (Figure 7a); the LD block showed strong LD between all SNPs in this gene (Figure 7b). Four SNPs were divided into three haplotypes with maximum phenotypic variations of 18.28 mm between Hap 1 and Hap 3 (Table 5). Hap 1 was the superior genotype in aus, aromatic, and a few others (Figure 7c). The Os08g0137900 gene contained four SNPs in the exon and 3′ UTR (Figure 8a). Four SNPs were divided into four haplotypes with phenotypic variations of 10.62 mm, and the LD block showed strong LD between four SNPs (Figure 8b and Table 6). Hap 2 was the superior genotype in aus, temperate japonica, and a few others (Figure 8c).

4. Discussion

Direct seeding is an attractive method for reducing water use and labor costs in rice cultivation, because, generally, rice cultivation is based on transplanting to a puddled field but requires a large amount of water, labor, and energy costs in preparing the field and uprooting and transplanting the seedlings. In Europe, Australia, and the United States, direct seeding cultivation is highly mechanized, and it has also have been widely adopted in Asian, African, and South American countries [2,48].
Recently, GWAS and QTL analyses have identified several QTLs for mesocotyl length. Liu et al. (2020) used 208 rice accessions to identify the SNPs from a GWAS analysis and identified 16 unique loci associated with the mesocotyl length trait. Among 16 loci, five high candidate genes were confirmed from qRT-PCR analysis that showed significant expression differences between short and long mesocotyl length accessions [49]. Zhao et al. (2018) used 621 rice accessions to perform a GWAS analysis; 13 QTLs were detected to be associated with mesocotyl length, and two new major effect genes were named OsML1 and OsML2. Using the GWAS to identify traits can be useful to develop rice varieties for improving tolerance from environmental changes [50].
From our study, we detected five candidate genes for mesocotyl length based on a GWAS analysis, a bioinformatic analysis of gene expression pattern, and a haplotype analysis. The candidate gene, Os01g0269800, is located in the QTL of qML1-1; Os01g0731100 is located on the QTL of qML1-2; Os08g0136700, Os08g0137800, and Os08g0137900 are located on the QTL of qML8. Unexpectedly, the five candidate genes were not located on the QTLs that overlapped with those previously reported as mesocotyl length QTLs (Table 1). This result is possibly due to our approach in which we narrowed down the candidate genes to only those genes specifically expressed due to plant hormones. Thus, in addition to these five QTLs, other genes located on other QTLs also need to be evaluated for their possible role in mesocotyl length in future studies.
One of the candidate genes, Os01g0269800, contains an nucleotide-binding adaptor shared by APAF-1, R proteins, and CED-4 (NB-ARC) domain, which has been previously reported to be associated with plant defense. According to our database, expression of Os01g0269800 increased in root under the ABA treat condition (Figure S3a). The NB-ARC domain has been reported to play a crucial role in plant defense against pathogen attacks. The NB-ARC domain acts as a nucleotide-binding pocket and hydrolyzes adenosine triphosphate (ATP) to induce conformational changes in NB-LRR proteins and plays an important role in controlling protein activity. It has been reported that it controls several brown planthopper (BPH) resistance genes that are also defense-related phenotypes [51,52]. According to the known function of Os01g0269800 in plant defense mechanisms, it is not clearly understood that the association of Os01g0269800 is involved in mesocotyl elongation. The candidate gene of Os01g0731100 has been reported to have a similar pathogen-related protein and the expression increased in shoots under flooding conditions and JA treat conditions (Figure S3b). Similar to Os01g0269800 with the NB-ARC domain, the primary known function of pathogenesis-related (PR) proteins is their involvement in the plant defense system. Since the expression pattern of Os01g0731100 was increased under flooding conditions, it suggests that this gene is possibly involved in plant height elongation based on the typical morphological changes where plant height is increased under flooding or summer conditions [53]. In addition, an increase of PR protein (Os01g0731100) in anaerobic germination conditions has been reported [54]. The expression of Os08g0136700 from our database was increased in root under JA conditions and has been reported to have the DUF26 domain-containing protein (Figure S3c). This gene was confirmed to be concerned with germination in smoke conditions. Fire events create an important opportunity for plant regeneration by providing essential resources such as light, temperature, and nutrients; smoke also gives a chance for regeneration from a mixture of active phytochemicals and their breakdown products [55,56]. In smoke conditions, this gene has been reported to control responsive proteins such as GA and ABA to help germinate seeds [57]. The Os08g0137800 gene encodes the cupredoxin domain, which is a type I copper center involved in the intermolecular electron transfer reaction [58]. The Os08g0137900 gene encodes plantacyanin, which belongs to the phytocyanin family of blue copper proteins [59]. The Os08g0137800 and Os08g0137900 genes, in the family of blue copper proteins, are type-I copper-containing redox proteins whose role in plants is to shuttle electrons from an electron donor to an electron acceptor [60]. The expression of both genes is increased in roots under JA conditions (Figure S3a,e). It has been reported that Copper (Cu) is an essential mineral element for plant growth and development since it has been associated with proteins involved in redox reactions. Plantacyanin is known to be involved in electron transport chains of photosynthesis and control plant biomass and growth, chlorosis in young leaves, as well as reduced photosynthetic activity [61,62,63]. For tissue elongation, one of the plantacyanin genes in rice has been reported to regulate fertility by controlling pollen tube germination and growth [64].
All the SNPs showed a strong LD level in the Os01g0269800, Os01g0731100, Os08g0136700, Os08g0137800, and Os08g0137900 genes, which suggests that these genes contain a conserved function during diverse evolutionary or crossing processes. The haplotype analysis of the five candidate genes showed clear grouping by rice subspecies of indica, temperature japonica, and aus. This result suggested that migration to new environments and climate alterations may have increased the variation between subspecies and enhanced the variation in mesocotyl length phenotypes, but this trait is a consequence of complicated biological processes, and its mechanism remains unclear; further research is needed to address this hypothesis.

5. Conclusions

In this study, the mesocotyl length was surveyed, and a GWAS was conducted for 137 rice accessions, which identified 11 QTLs significantly associated with mesocotyl length in dark germination, and five candidate genes were identified on Chromosomes 1 and 8. A haplotype analysis of the five characterized genes revealed diverse haplotypes associated with mesocotyl length phenotypic variation. The five candidate gene expressions have been reported to be associated with various plant hormone responses. Interestingly, two biotic stress response genes and two copper-containing redox proteins were detected as candidate genes. The association among biotic stress response proteins, copper-containing redox proteins, and mesocotyl elongation is not clearly explained in this study. Previous studies have reported on their roles in submerging responses and pollen tube elongation; therefore, it is highly worthwhile to conduct future studies to evaluate the molecular mechanism of these genes in mesocotyl elongation. In addition to these five candidate genes, other genes located on the 11 QTLs detected in this study will be evaluated in future studies. Here, we provide candidate genes and a list of rice germplasm showing high mesocotyl elongation ability to be useful in further studies and future breeding programs.

Supplementary Materials

The following are available online at https://www.mdpi.com/article/10.3390/agronomy11122527/s1, Figure S1: Principal Component Analysis (PCA) (PC1 and PC2). red, blue, green, orange, purple, and black represent the admixture, aromatic, indica, temperate japonica and tropical japonica rice subspecies, respectively. Adm: admixture, Aro: aromatic, Ind: indica, Tej: temperate japonica, Trj: tropical japonica., Figure S2: Linkage disequilibrium decay analysis., Figure S3: Expression profiles in rice seedling under the various environmental conditions. (a) Expression profile of Os01g0269800; (b) Expression profile of Os01g0731100; (c) Expression profile of Os08g0136700; (d) Expression profile of Os08g0137800; (e) Expression profile of Os08g0137800. RPK: reads per kilobase, Table S1. List of whole panel for this study, Table S2: the results of 33 candidate genes haplotype analysis.

Author Contributions

Conceptualization, S.-W.K. and J.L.; methodology, J.S. and T.-H.H.; resources, J.L.; data collection, S.-G.J., S.-Y.P., and A.-R.L.; validation, S.M.L., F.-Y.C., and A.-R.L.; data analysis, S.-G.J., H.Z., and T.-H.H.; writing—original draft preparation, S.-G.J. and S.-Y.P.; writing—reviewing and editing, J.S. and J.L.; supervision, project administration, and funding acquisition, S.-W.K. and J.L. All authors have read and agreed to the published version of the manuscript.

Funding

This research was funded by the Korea Institute of Planning and Evaluation for Technology in Food, Agriculture, and Forestry (IPET) through the Agri-Food Export Business Model Development Program, funded by the Ministry of Agriculture, Food, and Rural Affairs (MAFRA) (320105-3) and by the Rural Development Administration, Republic of Korea (PJ01579403).

Data Availability Statement

The data supporting reported results can be found here in the main text and the supplementary materials.

Conflicts of Interest

The authors declare no conflict of interest.

References

  1. Kumar, V.; Ladha, J.K. Direct Seeding of Rice: Recent Developments and Future Research Needs. Adv. Agron. 2011, 111, 297–413. [Google Scholar] [CrossRef]
  2. Farooq, M.; Siddique, K.H.M.; Rehman, H.; Aziz, T.; Lee, D.J.; Wahid, A. Rice direct seeding: Experiences, challenges and opportunities. Soil Till. Res. 2011, 111, 87–98. [Google Scholar] [CrossRef]
  3. Liu, H.Y.; Hussain, S.; Zheng, M.M.; Peng, S.B.; Huang, J.L.; Cui, K.H.; Nie, L.X. Dry direct-seeded rice as an alternative to transplanted-flooded rice in Central China. Agron. Sustain. Dev. 2015, 35, 285–294. [Google Scholar] [CrossRef] [Green Version]
  4. Farooq, M.; Barsa, S.M.A.; Wahid, A. Priming of field-sown rice seed enhances germination, seedling establishment, allometry and yield. Plant Growth Regul. 2006, 49, 285–294. [Google Scholar] [CrossRef]
  5. Lv, Y.S.; Shao, G.N.; Jiao, G.A.; Sheng, Z.H.; Xie, L.H.; Hu, S.K.; Tang, S.Q.; Wei, X.J.; Hu, P.S. Targeted mutagenesis of POLYAMINE OXIDASE 5 that negatively regulates mesocotyl elongation enables the generation of direct-seeding rice with improved grain yield. Mol. Plant 2021, 14, 344–351. [Google Scholar] [CrossRef]
  6. Lee, H.S.; Sasaki, K.; Kang, J.W.; Sato, T.; Song, W.Y.; Ahn, S.N. Mesocotyl Elongation is Essential for Seedling Emergence Under Deep-Seeding Condition in Rice. Rice 2017, 10, 32. [Google Scholar] [CrossRef] [PubMed] [Green Version]
  7. Takahashi, N. Adaptive Importance of Mesocotyl and Coleoptile Growth in Rice under Different Moisture Regimes. Aust. J. Plant Physiol. 1978, 5, 511–517. [Google Scholar] [CrossRef]
  8. Cona, A.; Cenci, F.; Cervelli, M.; Federico, R.; Mariottini, P.; Moreno, S.; Angelini, R. Polyamine oxidase, a hydrogen peroxide-producing enzyme, is up-regulated by light and down-regulated by auxin in the outer tissues of the maize mesocotyl. Plant Physiol. 2003, 131, 803–813. [Google Scholar] [CrossRef] [Green Version]
  9. Gray, W.M.; Ostin, A.; Sandberg, G.; Romano, C.P.; Estelle, M. High temperature promotes auxin-mediated hypocotyl elongation in Arabidopsis. Proc. Natl. Acad. Sci. USA 1998, 95, 7197–7202. [Google Scholar] [CrossRef] [Green Version]
  10. Riemann, M.; Muller, A.; Korte, A.; Furuya, M.; Weiler, E.W.; Nick, P. Impaired induction of the jasmonate pathway in the rice mutant hebiba. Plant Physiol. 2003, 133, 1820–1830. [Google Scholar] [CrossRef] [Green Version]
  11. Saab, I.N.; Sharp, R.E.; Pritchard, J. Effect of Inhibition of Abscisic-Acid Accumulation on the Spatial-Distribution of Elongation in the Primary Root and Mesocotyl of Maize at Low Water Potentials. Plant Physiol. 1992, 99, 26–33. [Google Scholar] [CrossRef]
  12. Vanderhoef, L.N.; Quail, P.H.; Briggs, W.R. Red Light-Inhibited Mesocotyl Elongation in Maize Seedlings: II. Kinetic and Spectral Studies. Plant Physiol. 1979, 63, 1062–1067. [Google Scholar] [CrossRef]
  13. Watanabe, H.; Takahashi, K.; Saigusa, M. Morphological and anatomical effects of abscisic acid (ABA) and fluridone (FLU) on the growth of rice mesocotyls. Plant Growth Regul. 2001, 34, 273–275. [Google Scholar] [CrossRef]
  14. Chang, T.-T.; Vergara, B.S. Varietal Diversity and Morpho-Agronomic Characteristics of Upland Rice; International Rice Research Institute: Manila, Philippines, 1975; pp. 72–90. [Google Scholar]
  15. Takahashi, K.; Watanabe, H.; Hoshikawa, K. Varietal Differences and Geographical Distributions in the Growth of Mesocotyl and Internodes of Rice (Oryza-sativa L.) Seedlings. Jpn. J. Crop. Sci 1995, 64, 66–72. [Google Scholar] [CrossRef] [Green Version]
  16. Wu, M.-G.; Zhang, G.-H.; Lin, J.-R.; Cheng, S.-H. Screening for rice germplasms with specially-elongated mesocotyl. Rice Sci. 2005, 12, 226–228. [Google Scholar]
  17. Lee, H.S.; Sasaki, K.; Higashitani, A.; Ahn, S.N.; Sato, T. Mapping and characterization of quantitative trait loci for mesocotyl elongation in rice (Oryza sativa L.). Rice 2012, 5, 13. [Google Scholar] [CrossRef] [PubMed] [Green Version]
  18. Suge, H. Mesocotyl Elongation in Japonica Rice—Effect of High-Temperature Pre-Treatment and Ethylene. Plant Cell Physiol. 1972, 13, 401–405. [Google Scholar]
  19. Huang, C.; Jiang, S.-K.; Ling-Ling, F.; Zheng-Jin, X.; Wen-Fu, C. Analysis of QTLs for mesocotyl length in rice (Oryza sativa L.). Acta Agron. Sin. 2010, 36, 1108–1113. [Google Scholar] [CrossRef]
  20. Wu, J.H.; Feng, F.J.; Lian, X.M.; Teng, X.Y.; Wei, H.B.; Yu, H.H.; Xie, W.B.; Yan, M.; Fan, P.Q.; Li, Y.; et al. Genome-wide Association Study (GWAS) of mesocotyl elongation based on re-sequencing approach in rice. Bmc Plant Biol. 2015, 15, 218. [Google Scholar] [CrossRef] [Green Version]
  21. Yamauchi, M.; Chuong, P.; Chau, N.M. Ecophysiology of Rice-Crop Establishment in Wet Direct Seeding in Vietnam with Emphasis on Anaerobic Seedling Growth; International Rice Research Institute: Manila, Philippines, 1995; pp. 89–95. [Google Scholar]
  22. Kim, K.W.; Chung, H.K.; Cho, G.T.; Ma, K.H.; Chandrabalan, D.; Gwag, J.G.; Kim, T.S.; Cho, E.G.; Park, Y.J. PowerCore: A program applying the advanced M strategy with a heuristic search for establishing core sets. Bioinformatics 2007, 23, 2155–2162. [Google Scholar] [CrossRef] [Green Version]
  23. Zhao, W.G.; Cho, G.T.; Ma, K.H.; Chung, J.W.; Gwag, J.G.; Park, Y.J. Development of an allele-mining set in rice using a heuristic algorithm and SSR genotype data with least redundancy for the post-genomic era. Mol. Breed. 2010, 26, 639–651. [Google Scholar] [CrossRef]
  24. Purcell, S.; Neale, B.; Todd-Brown, K.; Thomas, L.; Ferreira, M.A.R.; Bender, D.; Maller, J.; Sklar, P.; de Bakker, P.I.W.; Daly, M.J.; et al. PLINK: A tool set for whole-genome association and population-based linkage analyses. Am. J. Hum. Genet. 2007, 81, 559–575. [Google Scholar] [CrossRef] [Green Version]
  25. Kawahara, Y.; de la Bastide, M.; Hamilton, J.P.; Kanamori, H.; McCombie, W.R.; Ouyang, S.; Schwartz, D.C.; Tanaka, T.; Wu, J.Z.; Zhou, S.G.; et al. Improvement of the Oryza sativa Nipponbare reference genome using next generation sequence and optical map data. Rice 2013, 6, 4. [Google Scholar] [CrossRef] [PubMed] [Green Version]
  26. Kim, T.S.; He, Q.; Kim, K.W.; Yoon, M.Y.; Ra, W.H.; Li, F.P.; Tong, W.; Yu, J.; Oo, W.H.; Choi, B.; et al. Genome-wide resequencing of KRICE_CORE reveals their potential for future breeding, as well as functional and evolutionary studies in the post-genomic era. BMC Genom. 2016, 17, 408. [Google Scholar] [CrossRef] [Green Version]
  27. Hu, Z.Y.; Yan, H.F.; Yang, J.H.; Yamaguchi, S.; Maekawa, M.; Takamure, I.; Tsutsumi, N.; Kyozuka, J.; Nakazono, M. Strigolactones Negatively Regulate Mesocotyl Elongation in Rice during Germination and Growth in Darkness. Plant Cell Physiol. 2010, 51, 1136–1142. [Google Scholar] [CrossRef] [PubMed] [Green Version]
  28. Park, S.Y.; Jang, S.G.; Lee, J.; Kwon, S.W. Evaluation of Mesocotyl Elongation Ability in Korean Rice Landraces (Oryza sativa L.). Korean J. Breed. Sci. 2019, 51, 351–356. [Google Scholar] [CrossRef] [Green Version]
  29. Alexander, D.H.; Novembre, J.; Lange, K. Fast model-based estimation of ancestry in unrelated individuals. Genome Research. 2009, 19, 1655–1664. [Google Scholar] [CrossRef] [PubMed] [Green Version]
  30. R Development Core Team. R: A Language and Environment for Statistical Computing; R Foundation for Statical Computing: Vienna, Austria, 2010; ISBN 3-900051-07-0. [Google Scholar]
  31. Lipka, A.E.; Tian, F.; Wang, Q.; Peiffer, J.; Li, M.; Bradbury, P.J.; Gore, M.A.; Buckler, E.S.; Zhang, Z. GAPIT: Genome association and prediction integrated tool. Bioinformatics 2012, 28, 2397–2399. [Google Scholar] [CrossRef] [PubMed] [Green Version]
  32. Kumar, S.; Stecher, G.; Li, M.; Knyaz, C.; Tamura, K. MEGA X: Molecular Evolutionary Genetics Analysis across Computing Platforms. Mol. Biol. Evol. 2018, 35, 1547–1549. [Google Scholar] [CrossRef]
  33. Letunic, I.; Bork, P. Interactive Tree Of Life v2: Online annotation and display of phylogenetic trees made easy. Nucleic Acids Res. 2011, 39, W475–W478. [Google Scholar] [CrossRef]
  34. Zhang, C.; Dong, S.S.; Xu, J.Y.; He, W.M.; Yang, T.L. PopLDdecay: A fast and effective tool for linkage disequilibrium decay analysis based on variant call format files. Bioinformatics 2019, 35, 1786–1788. [Google Scholar] [CrossRef] [PubMed]
  35. Liu, X.L.; Huang, M.; Fan, B.; Buckler, E.S.; Zhang, Z.W. Iterative Usage of Fixed and Random Effect Models for Powerful and Efficient Genome-Wide Association Studies. PLoS Genet. 2016, 12. [Google Scholar] [CrossRef]
  36. Yang, W.N.; Guo, Z.L.; Huang, C.L.; Duan, L.F.; Chen, G.X.; Jiang, N.; Fang, W.; Feng, H.; Xie, W.B.; Lian, X.M.; et al. Combining high-throughput phenotyping and genome-wide association studies to reveal natural genetic variation in rice. Nat. Commun. 2014, 5, 5087. [Google Scholar] [CrossRef] [PubMed]
  37. Barrett, J.C.; Fry, B.; Maller, J.; Daly, M.J. Haploview: Analysis and visualization of LD and haplotype maps. Bioinformatics 2005, 21, 263–265. [Google Scholar] [CrossRef] [PubMed] [Green Version]
  38. Leigh, J.W.; Bryant, D. POPART: Full-feature software for haplotype network construction. Methods Ecol. Evol. 2015, 6, 1110–1116. [Google Scholar] [CrossRef]
  39. Hu, B.; Jin, J.P.; Guo, A.Y.; Zhang, H.; Luo, J.C.; Gao, G. GSDS 2.0: An upgraded gene feature visualization server. Bioinformatics 2015, 31, 1296–1297. [Google Scholar] [CrossRef] [Green Version]
  40. Zhan, J.H.; Lu, X.; Liu, H.Y.; Zhao, Q.Z.; Ye, G.Y. Mesocotyl elongation, an essential trait for dry-seeded rice (Oryza sativa L.): A review of physiological and genetic basis. Planta 2020, 251, 27. [Google Scholar] [CrossRef] [Green Version]
  41. Mu, P.; Li, Z.C.; Li, C.P.; Zhang, H.L.; Wu, C.M.; Li, C.; Wang, X.K. QTL mapping of the root traits and their correlation analysis with drought resistance using DH lines from paddy and upland rice cross. Chinese Sci. Bull. 2003, 48, 2718–2724. [Google Scholar] [CrossRef]
  42. Jun, Y.; Qiang, L.; Bing, Y.; Wei-Ya, X.; Li-Jun, L.; Xiong, L.-Z. Identification of quantitative trait loci for ABA sensitivity at seed germination and seedling stages in rice. Acta Genet. Sin. 2006, 33, 532–541. [Google Scholar]
  43. Cui, K.H.; Peng, S.B.; Xing, Y.Z.; Xu, C.G.; Yu, S.B.; Zhang, Q. Molecular dissection of seedling-vigor and associated physiological traits in rice. Theor. Appl. Genet. 2002, 105, 745–753. [Google Scholar] [CrossRef]
  44. Miura, K.; Lin, S.Y.; Yano, M.; Nagamine, T. Mapping quantitative trait loci controlling low temperature germinability in rice (Oryza sativa L.). Breed. Sci. 2001, 51, 293–299. [Google Scholar] [CrossRef] [Green Version]
  45. Jiang, L.; Liu, S.J.; Hou, M.Y.; Tang, J.Y.; Chen, L.M.; Zhai, H.Q.; Wan, J.M. Analysis of QTLs for seed low temperature germinability and anoxia germinability in rice (Oryza sativa L.). Field Crop. Res. 2006, 98, 68–75. [Google Scholar] [CrossRef]
  46. Guangheng, Z.; Dali, Z.; Shikai, H.; Yan, S.; Latie, A.; Longbiao, G.; Qian, Q. QTL analysis of traits concerned submergence tolerance at seedling stage in rice (Oryza sativa L.). Zuo Wu Xue Bao 2006, 32, 1280–1286. [Google Scholar]
  47. Cai, H.W.; Morishima, H. QTL clusters reflect character associations in wild and cultivated rice. Theor. Appl. Genet. 2002, 104, 1217–1228. [Google Scholar] [CrossRef]
  48. Kato, Y.; Katsura, K. Rice Adaptation to Aerobic Soils: Physiological Considerations and Implications for Agronomy. Plant Prod. Sci. 2014, 17, 1–12. [Google Scholar] [CrossRef]
  49. Liu, H.Y.; Zhan, J.H.; Li, J.L.; Lu, X.; Liu, J.D.; Wang, Y.M.; Zhao, Q.Z.; Ye, G.Y. Genome-Wide Association Study (GWAS) for Mesocotyl Elongation in Rice (Oryza sativa L.) under Multiple Culture Conditions. Genes 2020, 11, 49. [Google Scholar] [CrossRef] [PubMed] [Green Version]
  50. Zhao, Y.; Zhao, W.P.; Jiang, C.H.; Wang, X.N.; Xiong, H.Y.; Todorovska, E.G.; Yin, Z.G.; Chen, Y.F.; Wang, X.; Xie, J.Y.; et al. Genetic Architecture and Candidate Genes for Deep-Sowing Tolerance in Rice Revealed by Non-syn GWAS. Front. Plant Sci. 2018, 9, 332. [Google Scholar] [CrossRef] [Green Version]
  51. Yu, Z.M.; Dong, L.X.; Jiang, Z.F.; Yi, K.K.; Zhang, J.H.; Zhang, Z.C.; Zhu, Z.X.; Wu, Y.H.; Xu, M.J.; Ni, J. A semi-dominant mutation in a CC-NB-LRR-type protein leads to a short-root phenotype in rice. Rice 2018, 11, 54. [Google Scholar] [CrossRef] [PubMed]
  52. Zhang, Y.X.; Qin, G.; Ma, Q.Q.; Wei, M.Y.; Yang, X.H.; Ma, Z.F.; Liang, H.F.; Liu, C.; Li, Z.J.; Liu, F.; et al. Identification of Major Locus Bph35 Resistance to Brown Planthopper in Rice. Rice Sci. 2020, 27, 237–245. [Google Scholar] [CrossRef]
  53. Colmer, T.D.; Voesenek, L.A.C.J. Flooding tolerance: Suites of plant traits in variable environments. Funct. Plant Biol. 2009, 36, 665–681. [Google Scholar] [CrossRef] [PubMed]
  54. Hsu, S.K.; Tung, C.W. Genetic Mapping of Anaerobic Germination-Associated QTLs Controlling Coleoptile Elongation in Rice. Rice 2015, 8, 38. [Google Scholar] [CrossRef] [Green Version]
  55. Dixon, K.; Merritt, D.; Flematti, G.; Ghisalberti, E. Karrikinolide—A phytoreactive compound derived from smoke with applications in horticulture, ecological restoration and agriculture. Acta Hortic. 2009, 813, 155–170. [Google Scholar] [CrossRef]
  56. Jain, N.; Ascough, G.D.; Van Staden, J. A smoke-derived butenolide alleviates HgCl2 and ZnCl2 inhibition of water uptake during germination and subsequent growth of tomato–Possible involvement of aquaporins. J. Plant Physiol. 2008, 165, 1422–1427. [Google Scholar] [CrossRef] [PubMed]
  57. Jamil, M.; Jahangir, M.; Rehman, S.U. Smoke induced physiological, biochemical and molecular changes in germinating rice seeds. Pak. J. Bot 2020, 52, 865–871. [Google Scholar] [CrossRef]
  58. Dennison, C. Investigating the structure and function of cupredoxins. Coordin. Chem. Rev. 2005, 249, 3025–3054. [Google Scholar] [CrossRef]
  59. Dong, J.; Kim, S.T.; Lord, E.M. Plantacyanin plays a role in reproduction in Arabidopsis. Plant Physiol. 2005, 138, 778–789. [Google Scholar] [CrossRef] [Green Version]
  60. De Rienzo, F.; Gabdoulline, R.R.; Menziani, M.C.; Wade, R.C. Blue copper proteins: A comparative analysis of their molecular interaction properties. Protein Sci. 2000, 9, 1439–1454. [Google Scholar] [CrossRef] [PubMed] [Green Version]
  61. Huang, X.Y.; Deng, F.L.; Yamaji, N.; Pinson, S.R.M.; Fujii-Kashino, M.; Danku, J.; Douglas, A.; Guerinot, M.L.; Salt, D.E.; Ma, J.F. A heavy metal P-type ATPase OsHMA4 prevents copper accumulation in rice grain. Nat. Commun. 2016, 7, 12138. [Google Scholar] [CrossRef] [Green Version]
  62. Navarro, B.B.; Del Frari, B.K.; Dias, P.V.D.; Lemainski, L.E.; Mario, R.B.; Ponte, L.R.; Goergen, A.; Tarouco, C.P.; Neves, V.M.; Dressler, V.L.; et al. The copper economy response is partially conserved in rice (Oryza sativa L.). Plant Physiol. Bioch 2021, 158, 113–124. [Google Scholar] [CrossRef]
  63. Yruela, I. Transition metals in plant photosynthesis. Metallomics 2013, 5, 1090–1109. [Google Scholar] [CrossRef] [Green Version]
  64. Zhang, F.; Zhang, Y.C.; Zhang, J.P.; Yu, Y.; Zhou, Y.F.; Feng, Y.Z.; Yang, Y.W.; Lei, M.Q.; He, H.; Lian, J.P.; et al. Rice UCL8, a plantacyanin gene targeted by miR408, regulates fertility by controlling pollen tube germination and growth. Rice 2018, 11, 60. [Google Scholar] [CrossRef] [PubMed]
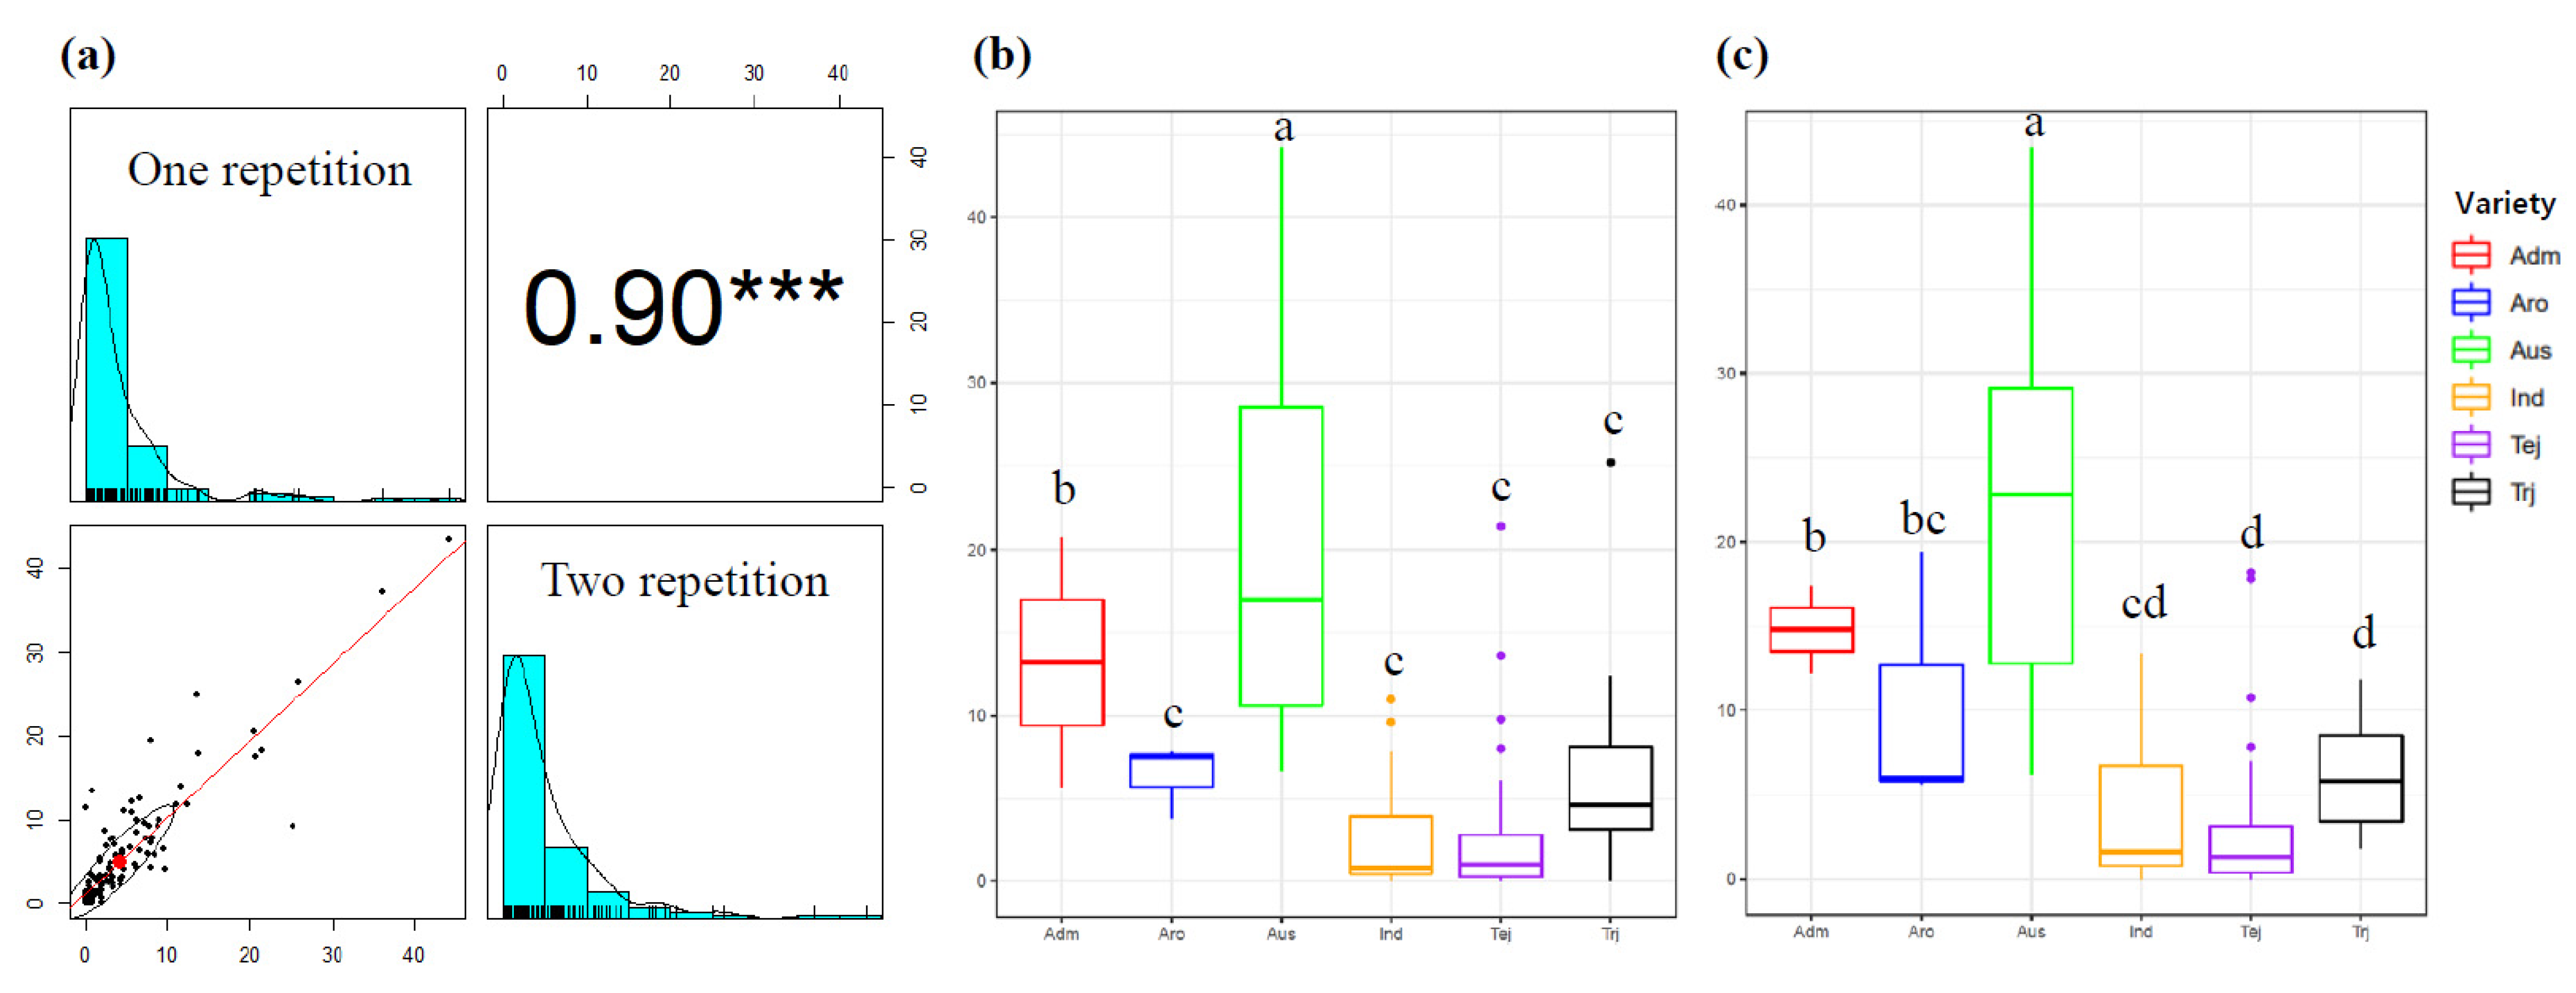
Figure 1. Statistical analysis of mesocotyl length (mm) in 137 rice varieties. (a) Summary of the phenotypic variations of mesocotyl length and correlations between one and two repetitions. Number in box is correlation coefficient (r), *** indicates the significance at p ≤ 0.001; (b, c) box plot of total mesocotyl length each repetitions according to subspecies. Adm: admixture, Aro: aromatic, Ind: indica, Tej: temperate japonica, Trj: tropical japonica. Letters: a, b, c, d represent different significance level at *** p < 0.001 (Duncan’s test).
Agronomy 11 02527 g001
Figure 2. Population structure analysis based on 137 rice accessions. (a) Cross-validation (CV) error of diverse groups (K). The dotted transverse line represents the lowest level; (b) Principal Component Analysis (PCA) (PC1 and PC2). red, blue, green, orange, purple, and black represent the Adm, Aro, Aus, Ind, Tej, and Trj rice subspecies, respectively; (c) Plot for population structure analysis at K = 6.
Agronomy 11 02527 g002
Figure 3. Manhattan plots for mesocotyl length in 137 rice vatieties. (a) GWAS of first repetition for evaluation of mesocotyl elongation length using the GAPIT. (b) GWAS of second repetition for evaluation of mesocotyl elongation length using the GAPIT. X axis indicates physically mapped chromosomes. Y axis indicates significance as calculated by −log10 (p). Blue bar indicates same position SNPs. Black arrows represent 11 overlapped lead SNPs detected in both replications.
Agronomy 11 02527 g003
Figure 4. Haplotype analysis of Os01g0269800. (a) Schematic representation of gene structure and SNPs positions in Os01g0269800. Yellow block represents exon and blue vertical bars represent SNPs. (b) Linkage disequilibrium (LD) analysis of SNPs in Os01g0269800. D’ was used to indicate LD level, with LD blocks defined using the Confidence Intervals function in the analysis software. Red blocks indicate complete LD between each SNP. (c) Haplotype variation analysis. Colors indicate rice subspecies as indicated in the legend. Circle size indicates the number of varieties in each Hap. Traverse lines represent the extent of variation between three haplotypes.
Agronomy 11 02527 g004
Figure 5. Haplotype analysis of Os01g0731100. (a) Schematic representation of gene structure and SNPs positions in Os01g0731100. Yellow, blue blocks and gray line represent exon, untranslated region (UTR) and intron regions, blue vertical bars represent SNPs. (b) Linkage disequilibrium (LD) analysis of SNPs in Os01g0731100. D’ was used to indicate LD level, with LD blocks defined using the Confidence Intervals function in the analysis software. Red blocks indicate complete LD between each SNP. (c) Haplotype variation analysis. Colors indicate rice subspecies as indicated in the legend. Circle size indicates the number of varieties in each Hap. Traverse lines represent the extent of variation between three haplotypes.
Agronomy 11 02527 g005
Figure 6. Haplotype analysis of Os08g0136700. (a) Schematic representation of gene structure and SNPs positions in Os08g0136700. Yellow, blue blocks and gray line represent exon, untranslated region (UTR) and intron regions, blue vertical bars represent SNPs. (b) Linkage disequilibrium (LD) analysis of SNPs in Os08g0136700. D’ was used to indicate LD level, with LD blocks defined using the Confidence Intervals function in the analysis software. Red blocks indicate complete LD between each SNP. (c) Haplotype variation analysis. Colors indicate rice subspecies as indicated in the legend. Circle size indicates the number of varieties in each Hap. Traverse lines represent the extent of variation between four haplotypes.
Agronomy 11 02527 g006
Figure 7. Haplotype analysis of Os08g0137800. (a) Schematic representation of gene structure and SNPs positions in Os08g0137800. Yellow, blue blocks and gray line represent exon, untranslated region (UTR) and intron regions, blue vertical bars represent SNPs. (b) Linkage disequilibrium (LD) analysis of SNPs in Os08g0137800. D’ was used to indicate LD level, with LD blocks defined using the Confidence Intervals function in the analysis software. Red blocks indicate complete LD between each SNP. (c) Haplotype variation analysis. Colors indicate rice subspecies as indicated in the legend. Circle size indicates the number of varieties in each Hap. Traverse lines represent the extent of variation between three haplotypes.
Agronomy 11 02527 g007
Figure 8. Haplotype analysis of Os08g0137900. (a) Schematic representation of gene structure and SNPs positions in Os08g0137900. Yellow and blue blocks represent exon and untranslated region (UTR), blue vertical bars represent SNPs. (b) Linkage disequilibrium (LD) analysis of SNPs in Os08g0137900. D’ was used to indicate LD level, with LD blocks defined using the Confidence Intervals function in the analysis software. Red blocks indicate complete LD between each SNP. (c) Haplotype variation analysis. Colors indicate rice subspecies as indicated in the legend. Circle size indicates the number of varieties in each Hap. Traverse lines represent the extent of variation between four haplotypes.
Agronomy 11 02527 g008
Table 1. Genome-wide association loci with mesocotyl length and previously reported quantitative trait loci (QTLs).
QTLsGenomic
Region (Mbp)
Chromosome−log10(p)−log10(p)Reported QTLReference of Previously
Reported QTL
(First
Replication)
(Second
Replication)
QTL
Accession
Related Trait
qML1-19.49111.389.4rfw1bDrought tolerance[41]
qML1-230.57111.3110.15qLRC-1Drought tolerance[42]
qML222.97210.939.39qLRS-2Drought tolerance[42]
qML3-15.9739.049.73qTAA3-1Germination rate and seedling growth[43]
qML3-224.64310.969.86qMel-3Mesocotyl length[17]
qML44.2549.089.15qLTG-4-1Low temperature germinability[44]
qML5-11.3859.649.52qLTG-5-1Low temperature germinability[45]
qML5-218.55510.699.12qLTG-5Low temperature germinability[44]
qML615.3269.799.03qML6Mesocotyl length[19]
qML82.0789.099.02qLOE-8Submergence tolerance[46]
qML1116.481110.1910.11qml11Mesocotyl length[47]
Table 2. Results of haplotype analysis of Os01g0269800.
IDSNP1SNP2SNP3SNP4SNP5SNP6SNP7SNP8SNP9SNP10SNP11SNP12Number of AccessionsFirst
Repetition
Second
Repetition
RegionExon1Exon1Exon1Exon1Exon1Exon1Exon1Exon1Exon1Exon1Exon1Exon1Average Mesocotyl Length
(mm)
F-valueAverage Mesocotyl Length
(mm)
F-value
Position931669493169639316970931699993170549317151931728193173449317356931774993177509317793
AlleleT/CT/GG/AC/TA/TC/GA/GA/GA/GC/TA/GG/T
Ref.seqTTGCACAAACAG
Hap1TTGCACAAACAG1093.07 b 3.27 b
Hap2TGGCACGGGCGG819.73 a35.09 ***20.85 a47.23 ***
Hap3CGATTGGGGTGT135.36 b 5.97 b
Hap: Haplotype. Letters: a, b represent different significance level at *** p < 0.001 (Duncan’s test).
Table 3. Results of haplotype analysis of Os01g0731100.
IDSNP1SNP2SNP3Number of accessionsFirst RepetitionSecond Repetition
Region5′UTR5′UTR5′UTRAverage Mesocotyl Length
(mm)
F-valueAverage Mesocotyl Length
(mm)
F-value
Position305135623051361630513617
AlleleG/CG/AT/A
Ref.seqGGT
Hap1CAA402.55 b 3.88 b
Hap2CGT820.03 a37.1 ***22.30 a46.76 ***
Hap3GGT843.55 b 3.66 b
Hap: Haplotype. Letters: a, b represent different significance level at *** p < 0.001 (Duncan’s test).
Table 4. Results of haplotype analysis of Os08g0136700.
IDSNP1SNP2SNP3Number of AccessionsFirst RepetitionSecond Repetition
RegionExon1Exon1Exon1Average Mesocotyl Length
(mm)
F-valueAverage Mesocotyl Length
(mm)
F-value
Position206355220637552063912
AlleleG/AT/CC/T
Ref.seqGTC
Hap1ACC242.15 b 4.04 c
Hap2GTC903.11 b13.66 ***3.36 c15.84 ***
Hap3ACT1811.16 a 11.89 b
Hap4ATT217.10 a 21.2 a
Hap: Haplotype. Letters: a, b, c represent different significance level at *** p < 0.001 (Duncan’s test).
Table 5. Results of haplotype analysis of Os08g0137800.
IDSNP1SNP2SNP3SNP4Number of AccessionsFirst RepetitionSecond Repetition
Region5′UTR3′UTR3′UTR3′UTRAverage Mesocotyl Length
(mm)
F-valueAverage Mesocotyl Length
(mm)
F-value
Position2129695213046521305322130566
AlleleG/AT/CA/GG/T
Ref.seqGTAG
Hap1GCAG920.67 a 21.78 a
Hap2GTAG833.31 b52.43 ***3.51 b53.26 ***
Hap3ACGT392.39 b 3.95 b
Hap: Haplotype. Letters: a, b represent different significance level at *** p < 0.001 (Duncan’s test).
Table 6. Results of haplotype analysis of Os08g0137900.
IDSNP1SNP2SNP3SNP4Number of AccessionsFirst RepetitionSecond Repetition
RegionExon1Exon13′UTR3′UTRAverage Mesocotyl Length
(mm)
F-valueAverage Mesocotyl Length
(mm)
F-value
Position2134167213417121344022134431
AlleleT/CG/AG/TT/C
Ref.seqTGGT
Hap1CAGC316.2 b 3.95 b
Hap2CGGC1310.29 a9.96 ***11.32 a9.46 ***
Hap3TGGT643.82 bc 4.08 b
Hap4TGTT181.68 c 1.7 b
Hap: Haplotype. Letters: a, b represent different significance level at *** p < 0.001 (Duncan’s test).
Publisher’s Note: MDPI stays neutral with regard to jurisdictional claims in published maps and institutional affiliations.