Article

Response of Crops to Conservation Tillage and Nitrogen Fertilization under Different Agroecological Conditions

1
Faculty of Agrobiotechnical Sciences Osijek, Josip Juraj Strossmayer University of Osijek, Vladimira Preloga 1, 31000 Osijek, Croatia
2
Faculty of Agriculture and Biotechnology, University of Technology and Life Sciences in Bydgoszcz, Ks. Kordeckiego 20, 85-225 Bydgoszcz, Poland
*
Author to whom correspondence should be addressed.
Agronomy 2021, 11(11), 2156; https://doi.org/10.3390/agronomy11112156
Submission received: 31 August 2021 / Revised: 3 October 2021 / Accepted: 25 October 2021 / Published: 27 October 2021

Abstract

:
Effects of soil tillage (CTconventional, SS-subsoiling, CH-chiselling, DH-disk-harrowing and NT-no-till) and nitrogen rate (reduced N1, optimal N2 and luxury N3) on yield and yield components of maize and winter wheat in two different agricultural subregions of Croatia (Magadenovac and Cacinci site), were studied in the years 2013–2014 as part of a long-term experiment. Maize yield and yield components were influenced by site properties, tillage and nitrogen treatments. The highest yields and yield components were recorded at the Magadenovac site with N2 and N3. The lowest values of the yield and yield components of maize were recorded on NT and were significantly lower than CT, SS, CH and DH, among which no significant differences were recorded. Winter wheat yield and yield components were affected by site properties and nitrogen rates while soil tillage treatments only had an influence on grain and straw yield and plant height. Winter wheat achieved maximum yield and yield components on a N3 and N2 and at the Magadenovac site. Winter wheat grain yield decreased in the following order: SS > DH > CH > NT > CT. The obtained results indicate the importance of optimal nitrogen fertilization and the possibility of the implementation of conservation tillage for maize and winter wheat production in different agroecological conditions.

1. Introduction

Winter wheat (Triticum aestivum L.) and maize (Zea mays L.) are crops that provide around 68% of the total cereal production within the European Union [1]. Grain yield is a complex trait that is highly influenced by many genetic and environmental factors [2] such as climatic conditions, soil properties, water ability [3,4] quantity and availability of plant nutrients, etc.
The global climate change is affecting all segments of human lives including food production. Climate change makes it difficult to predict weather conditions for accurate and successful agricultural production [5,6]. Given the different water and temperature needs of individual crops, each crop has its own set of environmental conditions under which growth is most efficient [7]. Crop production is particularly sensitive to prevailing weather and climatic conditions at key times of the growing season [1]. Different agricultural subregions of Croatia are characterized by different climate types, edaphic and orographic properties [8]. The structure, stability, and outcomes of plant cultivation, and consequently the design of economic policy, directly depend on the natural habitat conditions (agrobiotopes) in the agrosphere. Soil and climate characteristics determine the “ecological framework” of plant cultivation through suitability or limitations, which can be temporary or permanent. In agroecological science, unfavorable soil properties are considered as temporary limitations, and unfavorable climate is considered to be permanent one [8].
In the prevailing semi-arid and arid conditions that occur as a result of changing climatic conditions, the application of conservation tillage adapted to the type and properties of soil and agroecological conditions in the production area can significantly contribute to water conservation, prevent soil degradation, and achieve high and stable yields [9,10,11,12]. Conservation tillage is one of the fundamental postulates of conservation agriculture, which is according to the FAO [13], an approach to managing agroecosystems for improved and sustained productivity, increased profits and food security, while preserving and enhancing the resource base and the environment. Conservation tillage, which includes minimal soil disturbance and covering the surface by crop residues (at least 30% of the soil surface), have been implemented in many countries around the world [14]. Many studies have established that conservation tillage improves the soil properties and crop yields [15,16]. Conservation tillage practices have been shown to reduce soil organic matter decomposition [17] and promote sustainable crop production systems [18]. Conservation tillage presents a sustainable management option, but despite this, soil productivity may be reduced. Because of this, conservation tillage should be combined with other management practices (i.e., cover crop, crop rotation) to increase soil organic matter, carbon sequestration [19], and nitrogen storage [20].
Crop response to applied nitrogen fertilizer depends on soil type and fertility, soil and crop management practices, time, doses, and method of nitrogen application. Nitrogen is a key element in crop productivity, which plays a role in accelerating yield, and its deficiency will constitute in low yield and productivity of cereal crops [21]. Excessive nitrogen rate will result in excessive vegetative mass of crops [22,23] and increased plant height [24], which will delay grain ripening and prolong vegetation [25], increase the sensitivity of crops to diseases and pests, decline in photosynthetic capacity [26], and reduce the quality of yield [27]. On the other hand, an insufficient amount of N during intense vegetative growth will result in a smaller assimilation surface, and reduced synthesis of chloroplast pigments which will affect the photosynthesis process [28,29] and ultimately result in reduced yield. Rationalizing fertilizer application is an important issue for sustainable agriculture because it can reduce the negative effects of agronomy practices on the surrounding environment [30].
The main objective of this study was to compare the yield and yield components of maize and winter wheat under different soil tillage treatments and applied nitrogen dosage in the two agroecological regions to determine the most suitable tillage system and nitrogen rate depending on site properties defined by the climatic conditions and soil types.

2. Materials and Methods

2.1. Site Description, Experimental Design and Treatments

This research was conducted in the years 2013–2014 on two experimental fields in two different agricultural subregions of Croatia [8]: the Central Pannonian agricultural subregion—Cacinci site (Long. 17.86336 E, Lat. 45.61316 N, altitude 111 m) and the East Pannonian agricultural-cultural subregion—Magadenovac site (Long. 18.17254 E, Lat. 45.67046 N, altitude 92 m), as a part of a long-term field experiment. According to WRB [31], both experimental fields had a different type of soil: Stagnosol at the Cacinci site, and Gleysol at the Magadenovac site (Table 1).
Before setting up the experiment, soil samples were collected with a soil probe from depths of 0–30 cm (for basic soil chemical analysis) and from the soil profile (to determine soil texture). Average soil samples were air-dried, homogenized, milled and passed through a 2 -mm sieve.
Soil pH was measured electrometrically in a 1:5 (w/v) soil: water (distilled) extract (pH-H2O) and 1 mol dm−3 KCl (pH-KCl). Plant available P and K were analyzed using the ammonium lactate acid extractant [32]. Hydrolytic soil acidity (Hy) was determined by titration where alkaline hydrolytic salts (Ca-acetate) were used to exchange H+ and Al3+ ions from the soil adsorption complex. Soil organic matter content was measured using a modified Walkley-Black method [33]. Soil texture was determined by the pipette-method with wet sieving and sedimentation after dispersion with sodium pyrophosphate [34] according to USDA-NRCS [35]. The average annual precipitation and temperature for both experimental sites (30-yr average) are characterized by a wide aberration from 320 to 1240 mm and 9.4–12.9 °C (Table 2).
The Central Pannonian agricultural subregion extends to the area of western Slavonia, Podravina, Bilogora, and central Posavina. The average rainfall ranges from 781 to 798 mm. The average annual air temperature is 10.5 °C. The growing season with average daily temperatures of 5 °C or more lasts about 255 days. The climate of the Eastern Pannonian agricultural subregion has characteristics of a typical continental climate with hot summers and very cold winters. The average annual rainfall ranges from 688 to 729 mm, the maximum is in June and the minimum in the off-season. The duration of vegetation with an average daily temperature of 5 °C or more ranges from 255 to 265 days, with a sum of temperatures from 3700 to 3900 °C [8].
The data presented in this paper include part of a multi-year study of the impact of conservation tillage and nitrogen fertilization on crop productivity. The presented data were collected from the part of the second rotation of usual crop rotation in this region, in the years 2013–2014. Previous crop rotation included crops in the following sequence: 2009-maize, 2010-winter wheat, 2011-oilseed rape, 2012-soybean. Maize (Zea mays L.) was sown in the spring of 2013 (after soybean) and winter wheat (Triticum aestivum L.) in the autumn of 2013 (after maize). Maize (hybrid PR36V52, FAO 450, plant density recommendation 65,000 plant ha−1) was sown in spring of 2013 (after soybean) and winter wheat (cultivar Lucija—Agricultural Institute Osijek, seeding rate of 650 seeds per m2) in autumn of the same year (after maize).
The experiment was set up on two agroecologically different areas with five tillage treatments (CT-conventional tillage, SS-subsoiling, CH-chiselling, DH-disk-harrowing and NT-no-till) and three nitrogen levels (N1- 30% lower dosage related to the fertilization recommendation; N2- according to the fertilization recommendation) and N3- 30% higher dosage related to the fertilization recommendation). The experiment was set up as a split-plot with four repetitions. The size of the basic experimental plot for the main treatment was 600 m2 for each individual tillage treatment and 195 m2 for each individual fertilization as a sub-treatment.
Soil tillage included one conventional tillage and four different conservation tillage treatments:
  • CT—ploughing up to 30 cm depth, followed by disk-harrowing (1 pass), pre-sowing surface preparation with rotary harrow + wedge ring roller (2 passes);
  • SS—subsoiling up to 35–40 cm depth, pre-sowing surface preparation with rotary harrow + wedge ring roller (1 pass);
  • CH—chiseling up to 25 cm depth, pre-sowing surface preparation with rotary harrow + wedge ring roller (1 pass); DH—disk-harrowing up to 10–15 cm depth (2 passes); and
  • NT—no till (without any soil tillage preparation).
Application of mineral fertilizers (P2O5 and K2O) was uniform for all soil tillage treatments and with the same distribution dynamics at both experimental sites: for maize (140 kg P2O5 ha−1, 150 kg K2O ha−1) and winter wheat (100 kg P2O5 ha−1, 110 kg K2O ha−1). Fertilization nitrogen dosage was variated as follows (i) on Cacinci site for maize: N1-N2-N3/140-200-260 kg N ha−1; for winter wheat: N1-N2-N3/80-115-150 kg N ha−1; (ii) on Magadenovac site for maize: N1-N2-N3/147-210-273 kg N ha−1; for winter wheat: N1-N2-N3/95-135-175 kg N ha−1.
All other details (e.g., tillage, sowing and harvest dates, crop protection) on the crop growing practices in this experiment can be found in a previously published paper [11].

2.2. Plant Material Sampling and Analysis

Five separated samples of maize each consisting of 20 plants were collected in line and diagonally on each tillage and fertilization treatment. Maize plant material was dried in the oven at 65 °C to constant weight to obtain dry matter weight and scaled to hectare. Grain yield was calculated from the same samples after hand harvesting and grain separation from the rest of the plant material (cob + stalk + leaves). Calculation of grain yield (t ha−1) was carried out with grain yield at 14% moisture. Dried mass of stalk, leaves, and cobs represent straw yields (t ha−1). Plant height (cm) was measured from ground level to the base of the tassel, after the milk stage. From each treatment, 20 ears were selected, air dried and maize ear weight was determined by weighing and then averaged. From the same ears, grains were manually shelled and weighed on a technical scale to two decimal places after which the average grain weight per cob (g) and the mass of the stalk was air dried and weighed, and the average expressed in grams was calculated. Grain weight was determined by weighing 1000 grains randomly taken from the grain lot of each treatment. Hectoliter mass (kg hl−1) was determined by a Dickey John GAC 2100 apparatus.
Winter wheat plant material samples were collected using a 50 cm × 50 cm frame randomly and diagonally in five repetitions on each tillage and fertilization treatment. Winter wheat plant material was dried in the oven at 65 °C to constant weight to obtain dry matter weight and scaled to hectare. Grain yield was calculated from the same samples after hand harvesting and grain separation from the rest of the plant material. Calculation of grain yield (t ha−1) was conducted with grain yield moisture at 12% for winter wheat. Mass of dried stalks and leaves was measured from average of 20 plants and represents straw yield (t ha−1). Plant height was measured (cm) from an average of 20 plants. Number of fertile/sterile spikelets per spike and number of grains per spike were counted in 20 spikes and their means were calculated. Thousand-grain weight (g) was calculated from two grain subsamples of 2 kg each, collected from the harvested grain mass in harvest; four times 500 kernels were counted and weighed. Hectoliter mass (kg hl−1) was calculated from the same two grain subsamples, two readings of the hectoliter mass and grain moisture were acquired by a Dickey John GAC 2100 apparatus.

2.3. Data Analysis

All collected data were statistically processed by the statistical package TIBCO Software Inc. [36]. The influence of different soil tillage treatments and different sub-levels of nitrogen fertilization on yield and yield components of maize and winter wheat in different agroecological sitew, were tested by factorial ANOVA design (factors: site properties, soil tillage treatments and nitrogen level). The means were compared by LSD tests upon significant results of the F-test at p < 0.05 for the observed factors. Assumption of homogeneity of variance for all parameters was conducted by the Levene’s test; the normality of the distribution of results was examined by the Kolmogorov-Smirnov test. The assumption of independence was secured by the design of the study (randomized complete block design). The Pearson’s linear correlation coefficients according to Mukaka [37] and the value of the correlation coefficient ranking by the Roemer-Orphal scale (±0.00–0.30: negligible correlation, ±0.30–0.50: low, ±0.50–0.70: moderate, ±0.70–0.90: high, ±0.90–1.00: very high) according to Hinkle et al. [38] were used to assess the relationships between yield and yield components for maize and for winter wheat.

3. Results

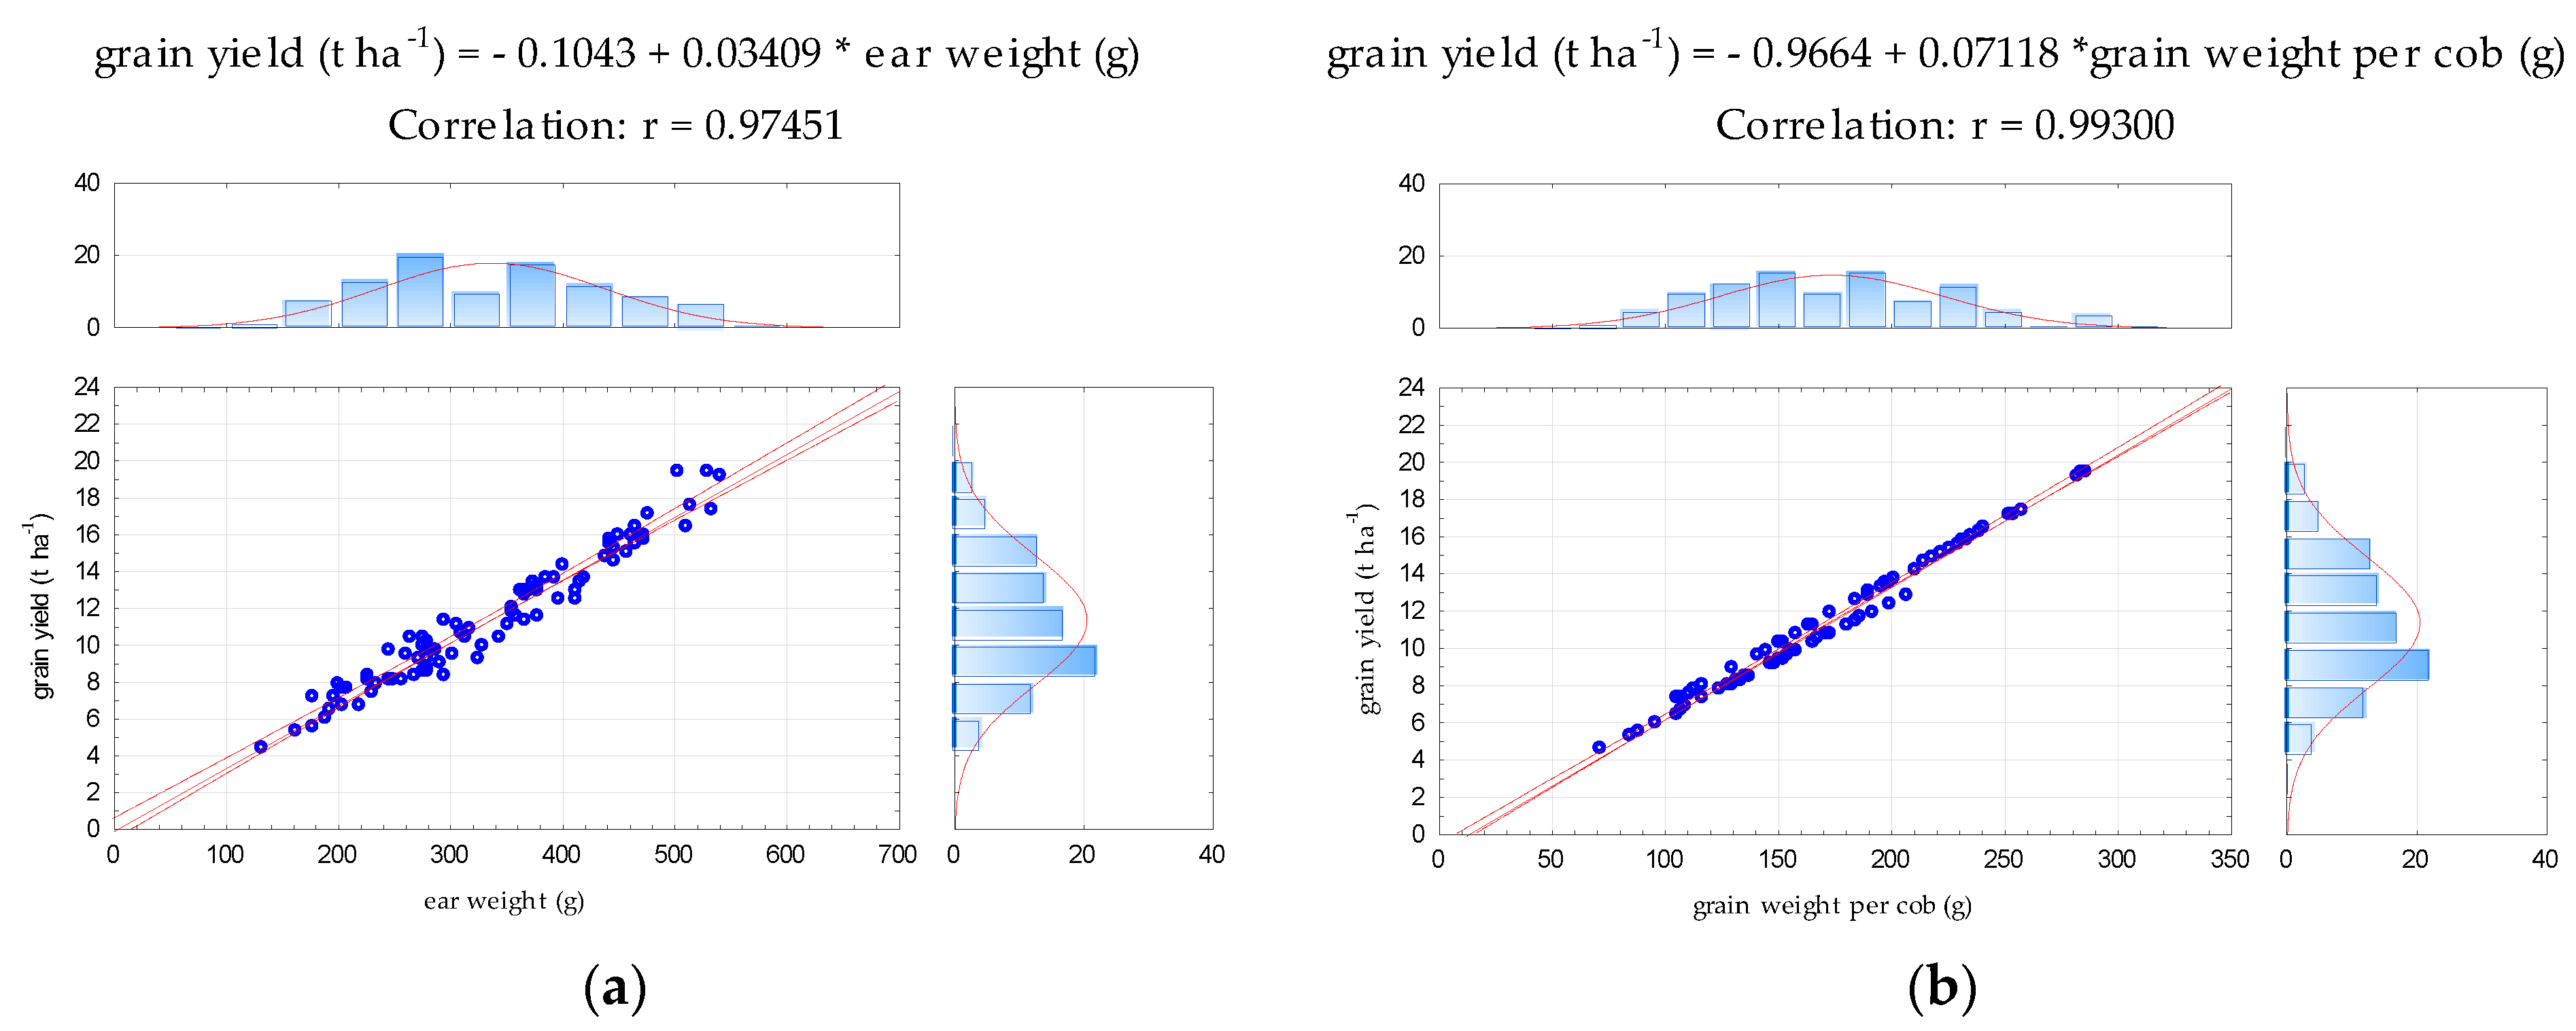
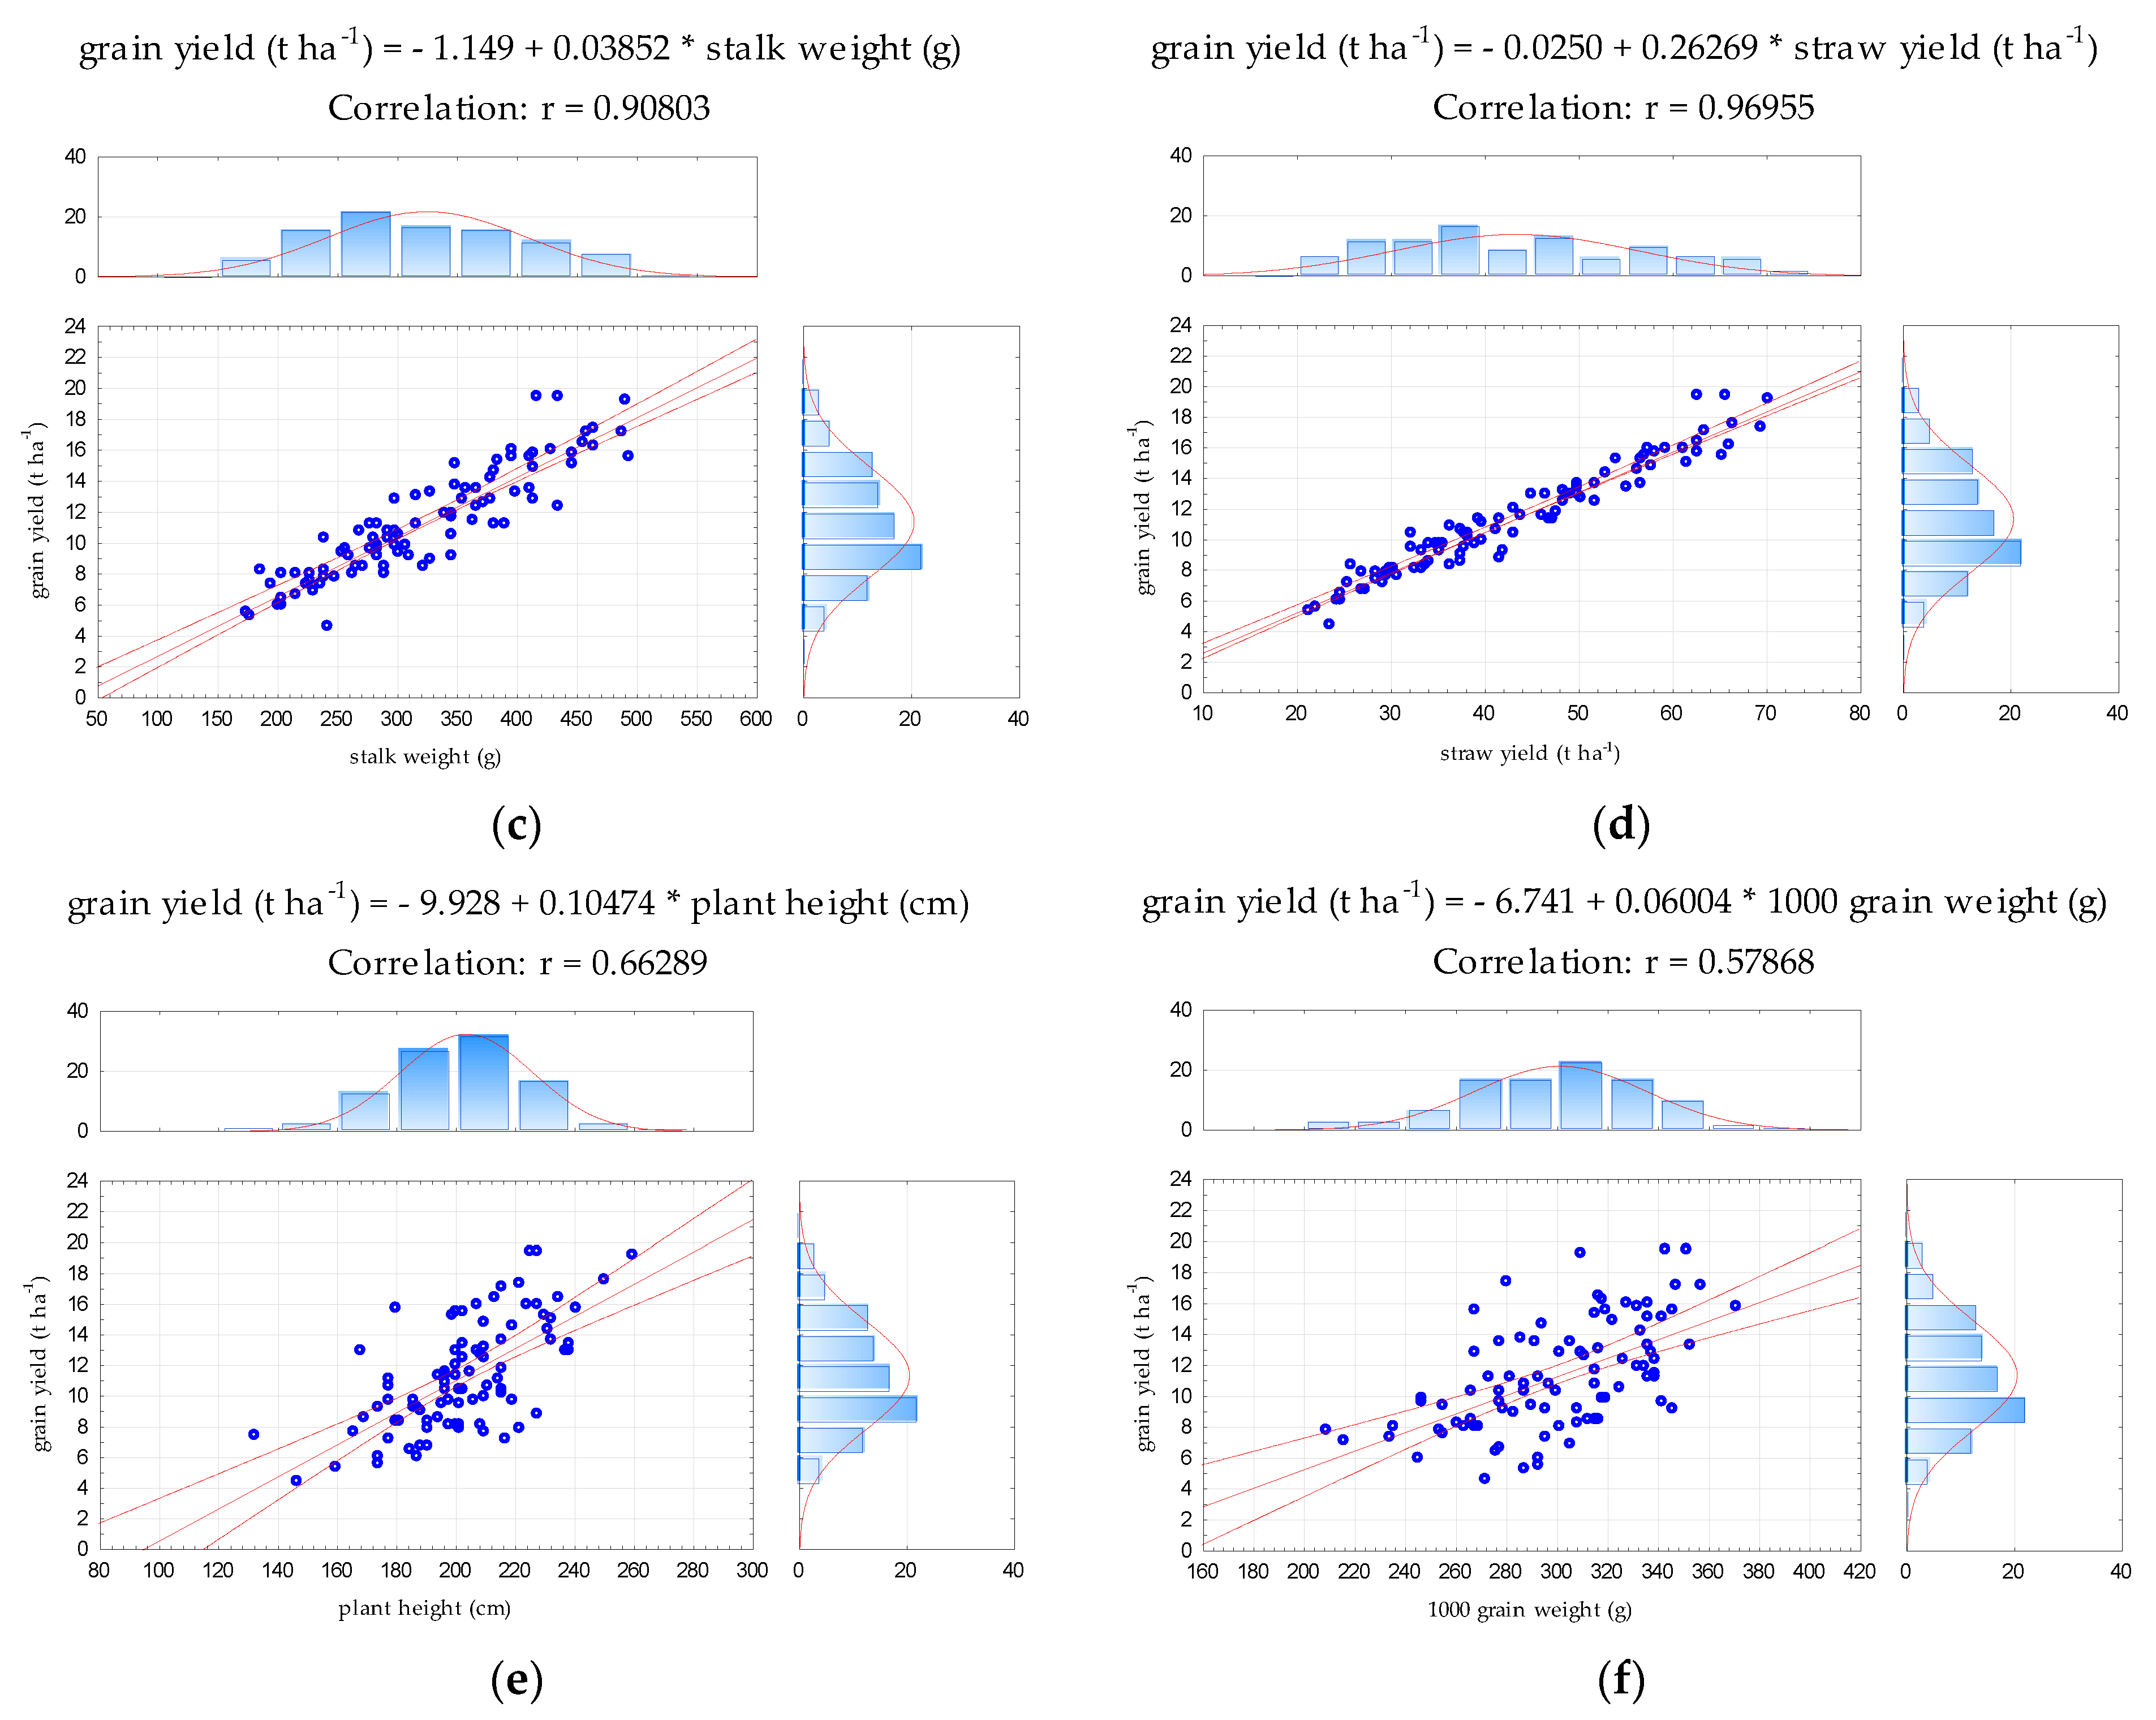
3.1. Maize Yield and Yield Components

Influence of site properties, tillage treatments and nitrogen doses on grain and straw yield and yield components of maize (plant height, ear weight, grain weight per cob, stalk weight, 1000 grain weight, hectoliter mass) are shown in Table 3. Interactions between factors were not statistically significant (p value was higher than 0.05).
The height of maize plants was significantly influenced by the site characteristics (Table 3). Tillage and fertilization treatment did not significantly affect plant height, as maize had a higher height in S2 by 12.43% compared to S1.
The weight of maize ear was significantly influenced by site properties, tillage, and fertilization treatment (Table 3). The ear weight in S2 was 36.01% higher than on S1. At all tillage treatments, there was a significantly higher ear weight compared to NT (in CT the ear weight was 42.51% higher, in SS—by 35.11% higher; in CH—by 32.32% and in DH—by 28.17% higher than NT). No statistically significant differences were observed between CT, SS, CH, and DH. Maize on thee N1 fertilization treatment had a statistically significantly lower ear weight compared to N2 (18.32%) and N3 treatment (13.59%), while differences between N2 and N3 treatment in ear weight were not statistically justified.
The grain weight per cob was significantly influenced by site properties, tillage treatment, and fertilization treatment (Table 3). The grain weight per cob was 34.81% higher in S2 than in S1, by 35.19%, 30.77%, 24.13% and 24.63% higher in CT, SS, CH, and DH, respectively, compared to NT, and 22.46% and 147.13% higher in N2 and N3 fertilization treatment compare to N1 fertilization treatment. No significant differences in grain weight per cob was detected between CT, SS, CH, and DH tillage treatment nor between the N2 and N3 fertilization treatments.
Stalk weight was significantly affected by the site properties, tillage and fertilization treatment (Table 3). Maize in S2 had a higher stalk weight (by 28.25%) compared to S1. The highest stalk weight was measured ain the CT treatment, and the lowest at NT treatment. Statistically significant differences in stalk weight were found between CT, DH and NT treatment (stalk weight on CT was 33.65% higher than on NT; 14.00% higher than on DH; stalk weight on DH was 17.24% higher than NT); between SS and NT (by 22.12% stalk weight was higher on SS); CH and NT (maize on CH was higher by 21.85%); and between DH and NT (by 17.24% higher value on DH). Differences in stalk weight among CT, SS, and CH were not statistically significantly. Nitrogen levels significantly affected stalk mass and the lowest mass was measured in maize on N1 fertilization treatment, while the highest mass was measured on N2 treatment. Stalk weight on N2 and N3 treatments were 15.97% and 10.43% higher than N1 treatment, while the differences in the stalk weight between N2 and N3 treatment were not statistically significant.
The weight of 1000 grains were significantly affected only by tillage treatment (Table 3). Maize in CT had a significantly higher 1000 grain weight when compared to SS (by 6.36%), DH (by 12.20%), and NT (by 17.47%). The weight of 1000 grains on CH were 11.35% higher compared to NT and 6.36% higher compared to DH. In SS, the weight of 1000 grains was 10.45% higher than in NT. Other differences were not statistically significant.
Hectoliter mass was significantly affected only by the site properties (Table 3). Maize in S1 had a higher hectoliter mass compared to S2. The impact of tillage and fertilization treatments were not statistically significant.
Grain yield was significantly affected by site properties, tillage and fertilization treatments. Statistically significant differences in yield height between localities were found (maize in S2 had a higher grain yield than S1 by 47.10%), among the soil tillage treatments (yield in NT was by 26.55% lower than yield in CT, 24.36% lower than yield in SS, 20.19% lower than CH; and 20.47% lower than DH) and among fertilization treatments (yield in N1 was by 18.40% and 14.77% lower than N2 and N3, respectively). Differences between grain yield in CT, SS, DH, and CH were not significant nor were differences between N2 and N3.
The straw yield was under significant influence of site properties, tillage treatment, and fertilization (Table 3). Statistically significant differences in straw yield between localities were found (maize in S2 had a higher straw yield than S1 by 44.21%). Straw yield in NT was significantly lower compared to CT (by 27.80%), SS (by 24.35%), CH (by 22%), and DH (by 19.25%), among which no significant differences were detected. Maize in N1 had a significantly lower straw yield compared to other fertilization treatments, among which there were no significant differences.
The results of the study indicate a significant correlation between the examined parameters (Table 4) as follows: very high correlation (Figure 1) was detected between grain yield and ear weight (Figure 1a), grain weight per cob (Figure 1b), stalk weight (Figure 1c), and straw yield (Figure 1d); moderate correlation was observed between grain yield and plant height (Figure 1e) and grain yield and 1000 grain weight (Figure 1f).

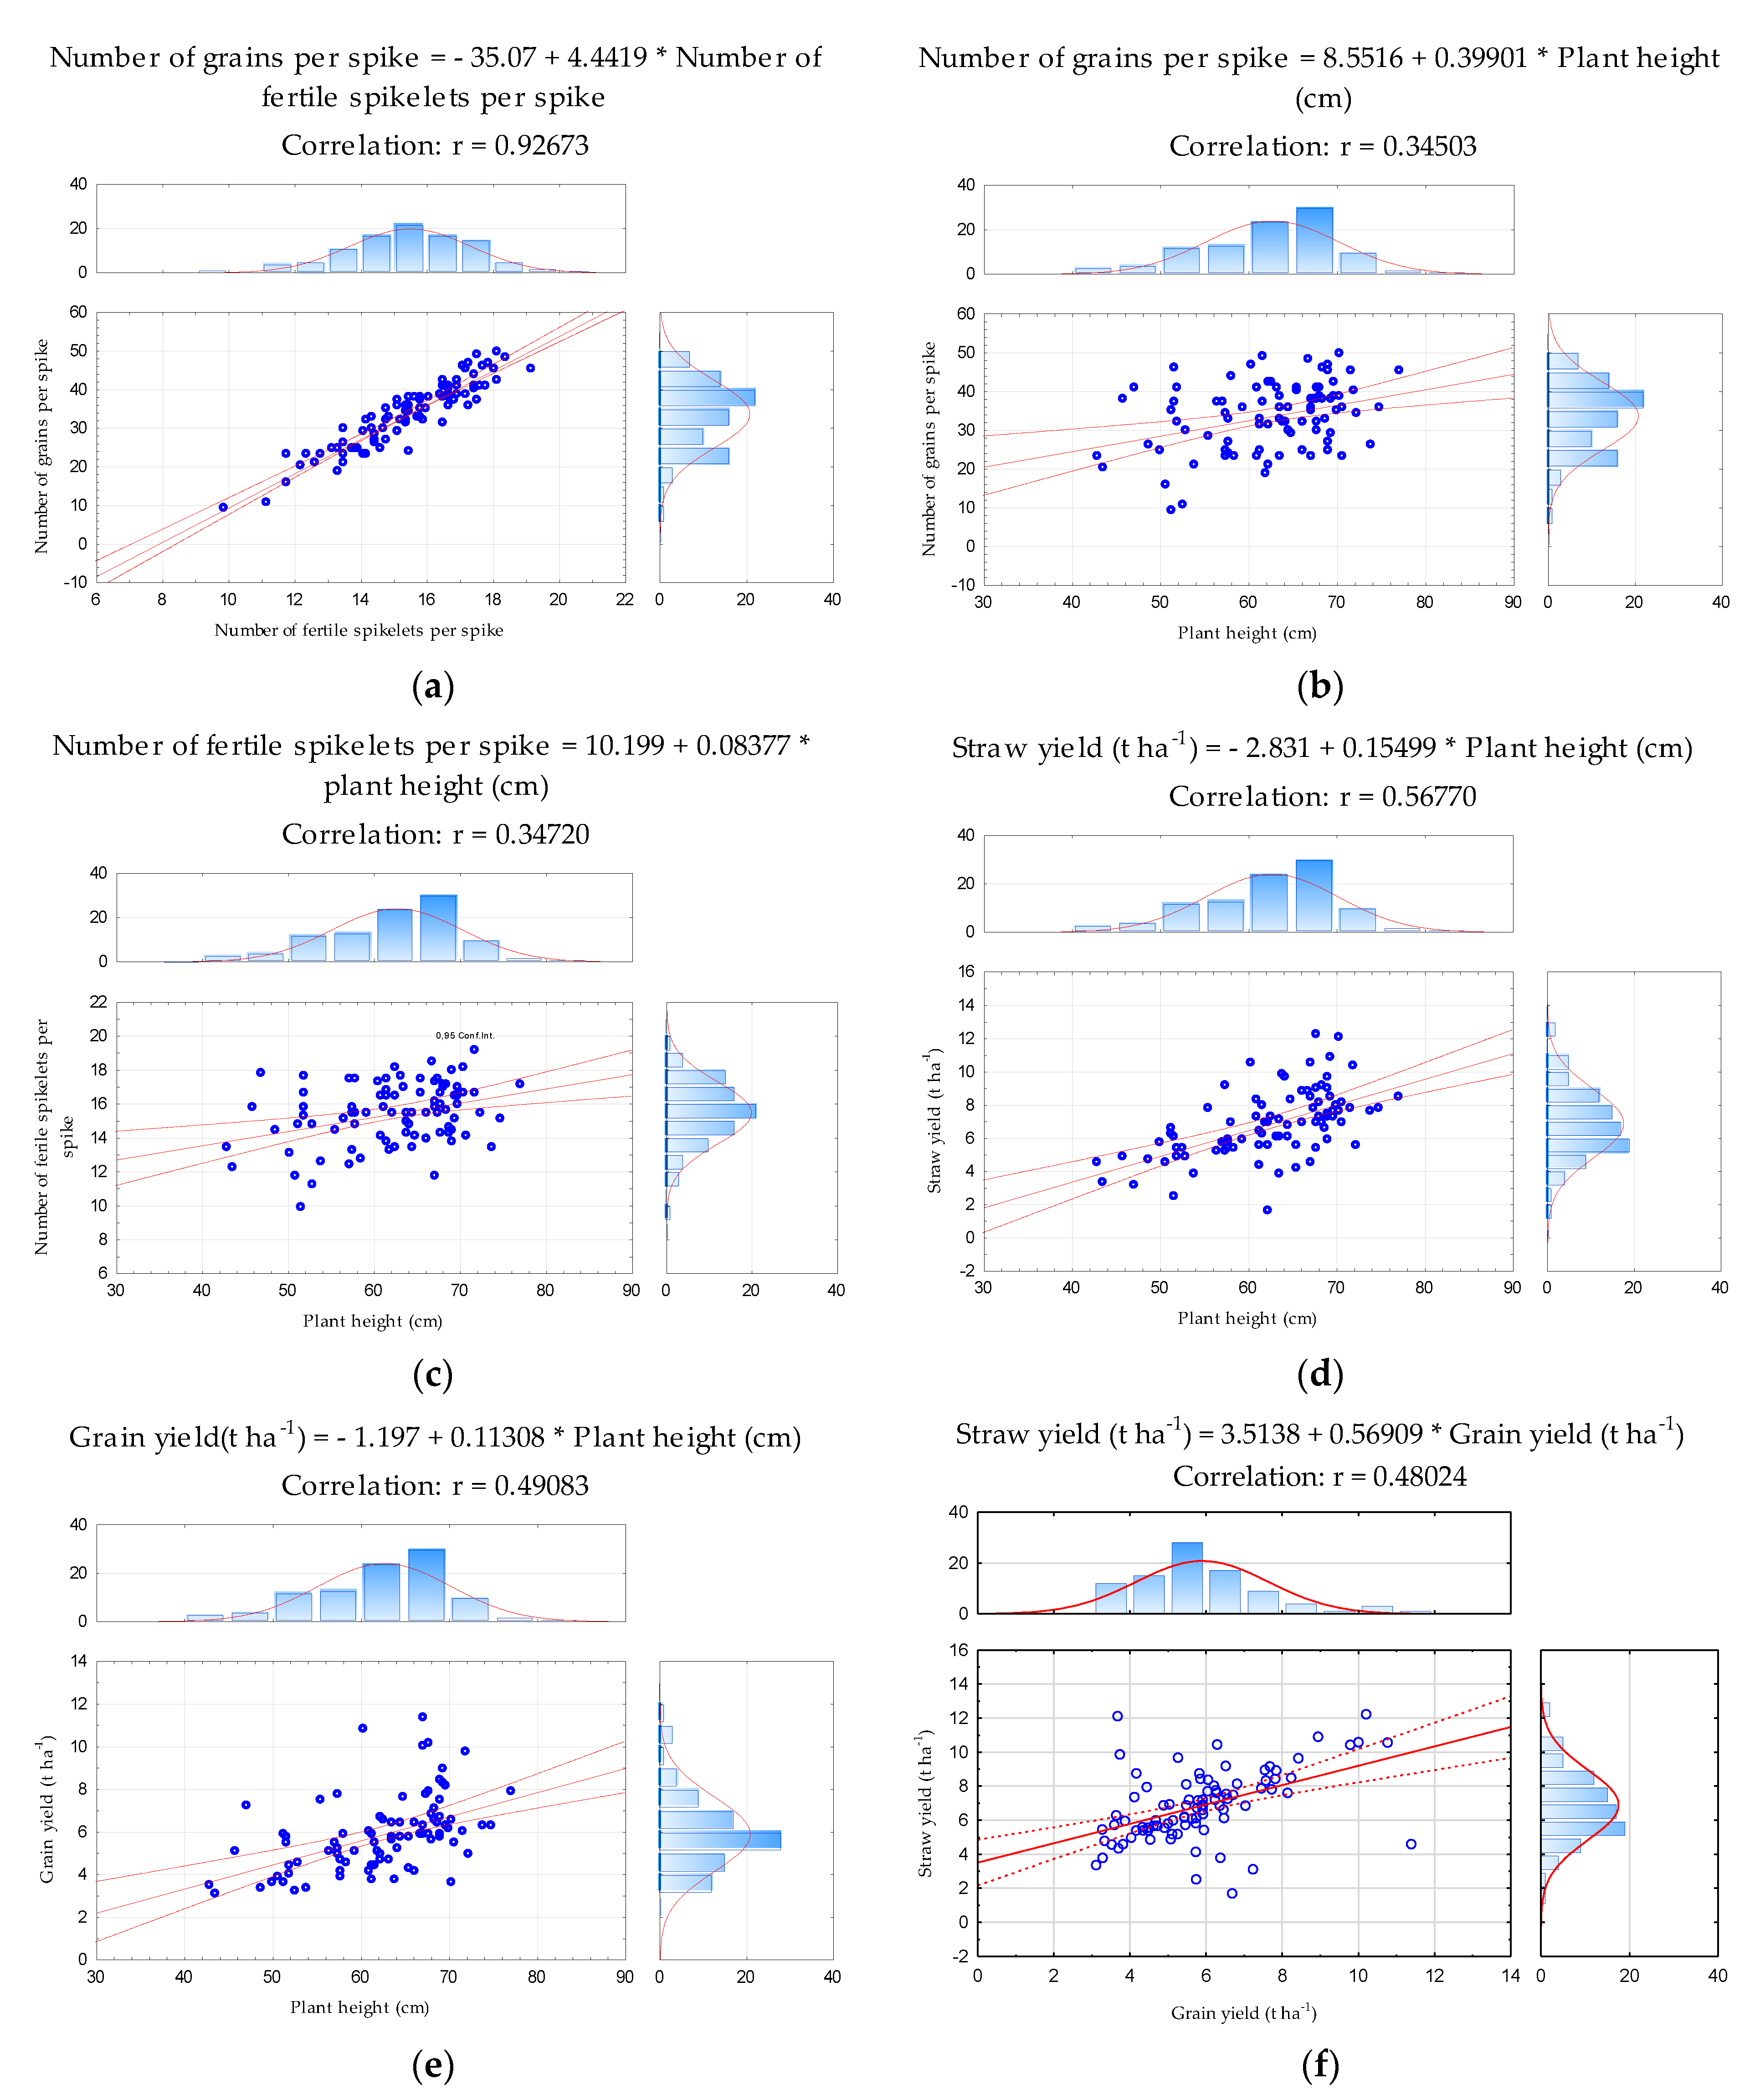
3.2. Winter Wheat Yield and Yield Components

Effects of site properties, tillage treatments and nitrogen doses on yield (grain and straw yield) and yield components of winter wheat (plant height, number of fertile spikelets per spike, number of sterile spikelets per spike, number of grains per spike, 1000 grain weight, hectoliter mass) are shown in Table 5. Interactions between factors were not statistically significant (p value was higher than 0.05).
The height of winter wheat plants was significantly influenced by nitrogen doses, soil tillage treatments and site properties. The plants on the N2 fertilization treatment were highest, and the lowest on N1. Differences between plant heights in N1, N2, and N3 were statistically significant (Table 5). The height of the plants in the N2 treatment was 21.60% higher than the N1 treatment and 2.96% higher than the N3 treatment. The N3 winter wheat was 18.10% higher than wheat on the N1. Among all tillage treatments SS had the maximum plant height compared to other tillage treatments. In CT, CH, and DH, the plant height was statistically significantly lower in relation to SS (by 3.38%, 6.37%, and 3.77%, respectively) and significantly higher in relation to NT (by 13.34%, 9.83%, and 12.88%, respectively). The difference in plant height between SS and NT was the largest (17.30% higher in SS than NT). Comparing the plant height averages at the different sites showed that wheat achieved a significantly higher plant height at S2 compared to S1.
The number of fertile spikelets per spike was significantly influenced by the site properties and fertilization treatment. The tillage treatments did not significantly effect the number of fertile spikelets per spike. The number of fertile spikelets per spike on N1 was significantly lower compared to N2 (by 7%) and N3 (by 6.78%), while a comparison of the number of spikelets per spike indicated the non-significant difference between N2 and N3 treatments (Table 5).
The number of sterile spikelets per spike was significantly influenced by the site properties and fertilization treatment while the influence of tillage treatments was non-significant (Table 5). In contrast to the number of fertile spikelets, a larger number of sterile spikelets had wheat on S2 than S1 (by 73.11%). The number of sterile spikelets per spike in N1 was significantly higher compared to N2 (by 35.14%) and N3 (by 34.62%), while the number of sterile spikelets per spike in N2 and N3 was almost identical.
The number of grains per spike was significantly influenced by site properties and fertilization treatment (Table 5). Maximum number of grains per spike was detected on S1 and in N2 fertilization treatment W. wheat on S1 and on N1 treatment obtained the minimum number of grains per spike (Table 5). The difference in NGPS between the fertilization treatments were statistically significant only in relation to the N1 treatment, while the difference between number of grains per spike in N2 and N3 was not statistically significant.
The weight of 1000 grains was statistically significantly affected by fertilization treatment and the site properties while the impact of tillage was insignificant (Table 5). The maximum grain weight was recorded in S2 and in N1 fertilization treatment and the minimum grain weight was recorded in S1 and N2 The weight of 1000 grains in N1 was higher by 6.94% than in N2 treatment and by 6.29% than in N3 treatment. Difference in 1000 grain weight between N2 and N3 was non-significant.
The hectoliter weight was significantly influenced by site properties (Table 5). The maximum hectoliter weight was recorded in S2. Differences in hectoliter weight between tillage treatment and nitrogen doses were not statistically significant.
The variation in grain yield was significantly affected by site properties, nitrogen doses and tillage treatment. Higher grain yields were achieved in S2 compared to S1 (by 25.34%). The maximum grain yield was recorded on N3 which was 43.53% higher than the lowest grain yield achieved in N1. Difference between grain yield in N3 and N2 was non-significant, while difference between N2 and N1 was statistically significant (Table 5). Comparison of grain yield average by tillage treatments indicated that the SS treatment exhibited the highest grain yield compared to the other four tillage treatments. Significant differences in the grain yield according to tillage treatments were found as follows: grain yield in SS was higher by 26.94% than in CT, by 17.78% higher than on CH and by 19.04% higher than on NT. The difference in grain yield between SS and DH was non-significant. Grain yield in DH was significantly higher than in CT (by 15.56%), while differences in yield between other tillage treatments were not significant.
The straw yield was significantly influenced by nitrogen doses, tillage treatments, and site properties (Table 5). The significant difference was measured between sites, and between all fertilization treatments, the highest straw yield was recorded in N3, which was higher by 39.22% than N1 and 9.09% than N2. Straw yield in N2 was higher by 27.45% than in N1. Among the tillage treatments, there were also significant differences recorded: straw yield on SS was 49. 30% higher than in CH, 36.20% higher than in DH, 33.23% higher than in NT and 16.51% higher than in CT. Straw yield in CT was 28.15 % higher than in CH, 16.91% higher than in DH and 14.35% higher than in NT. The differences in straw yield between CH, DH, and NT were not statistically significant.
Mutual correlations between the examined parameters are shown in Table 6. Very high positively correlation was detected between number of grains per spike and number of fertile spikelets per spike (Figure 2a) and high negative correlation between sterile spikelets per spike and number of grains per spike. Low positive correlation was detected between plant height and (i) number of grains per spike (Figure 2b), (ii) number of fertile spikelets per spike (Figure 2c) and (iii) grain yield (Figure 2e), while correlation with straw yield was moderate (Figure 2d). A low positive correlation was observed between 1000 grain weight and number of sterile spikelets per spike; and between grain and straw yield (Figure 2f). The correlation between 1000 grain weight and hectoliter mass was moderate.

4. Discussion

4.1. Maize Yield and Yield Components

Grain yield and grain quality in maize are a result of the interaction of genetic, environmental, and agronomic management factors [39]. Grain yield in maize is the result of different component traits. It is indirectly calculated by the number of kernels formed in each ear, test weight, and number of ears per plant [40]. Plant height, ear weight, grain weight per cob, stalk weight, grain and straw yield were significantly higher at Magadenovac, while hectoliter mass was higher at the Cacinci site. Plant growth was modified by the environmental factors that surround the plant. Maize growing is extremely sensitive to environmental conditions, especially to abiotic factors such as rainfall, available soil moisture, air and soil temperature, soil type, etc. [39,40,41,42]. During the whole maize growing period and especially during the most critical growing period (April–August) in both experimental sites, air temperature was most often higher than at the multi-year average. In the period from April to August, the total precipitation in Cacinci site was 7.77% lower than the multi-year average in the same period and 3.11% lower than the multi-year average at the Magadenovac site. A higher amount of precipitation was measured at the Cacinci site (by 12.24%) compared to the Magadenovac site. During the entire vegetation, there was a constant change in extremely humid and dry periods. The stages of maize susceptible to water deficiency are the vegetative, silking, and grain filling stages, where yield loss may be as high as 25%, 50%, and 21%, respectively [43]. Although significant aberrations were recorded in the amount of precipitation and temperature regime (especially in tasseling-silking phenological stages), there was no change in the water regime of the plant, which ultimately resulted in a satisfactory grain yield. Although the amount of precipitation in Cacinci was higher, and the temperature was almost 0.2 degrees lower than in Magadenovac, lower yields in Cacinci are probably the result of poor water infiltration due to the typical impermeable layer in Stagnosol. In Stagnosol, in conditions of the precipitation, oxygen deficiency occurs due to stagnation of precipitation water [44].
Nitrogen is a key element to create yield, and maize, as a plant that produces a large plant mass in a short time, also has high nitrogen needs that cannot be met by the natural reserves in the soil. The application of nitrogen fertilizers is one of the main agricultural practices that is able to stabilize or even increase maize yield [45]. Although the maize productivity can be maintained under reduced nitrogen doses, high N fertilization rates have been used in most high yielding intensive agricultural maize production systems [46]. It is generally known that nitrogen deficiency causes many biochemical and physiological disorders that lead to a decrease in the rate of cell division and disturbances in the process of photosynthesis. In contrast, excessive nitrogen fertilization is a major problem for agriculture production and the environment [47]. Excessive application of nitrogen fertilizer has negative effects on crops [48] and causes significant losses by nitrate leaching and groundwater contamination [49,50,51], release of greenhouse gases, soil acidification, or biodiversity reduction [52]. The obtained results were expected because the insufficient nutrition of crops with nitrogen results in reduced leaf area, reduced chlorophyll concentration, and thus lower intensity of photosynthesis, which results in reduced yield [53]. Additional effects of nitrogen deficiency are reduced resistance to disease, reduced resistance to stress caused by drought, and significantly lower yields [54]. This condition can be avoided by appropriate nitrogen fertilization, intervention top-dressing, and the balanced addition of other nutrients [54]. The differences in the investigated parameters between optimal and excessive nitrogen fertilization were not significant, which is probably a consequence of nitrogen leaching into deeper soil layers due to an increase in rainfall in the vegetation period. Similar results were obtained by Majid et al. [55] in their study where nitrogen application at 345 kg ha−1 produced the highest maize yield and yield traits, but in most cases, it was statistically similar with 230 kg N ha−1. Thousand grain weight is a yield component of cereal crops and a contributing factor upon which crop yield potential is dependent. Although 1000 grain weight is a parameter that is frequently measured to evaluate grain yield response to nitrogen fertilization management [56,57], in this research different doses of nitrogen did not significantly affect this parameter. The results obtained are consistent with Anwar et al. [58], whose research in to the effect of nitrogen rates and application time on the growth and yield of maize reported no significant differences in 1000 grain weight at 120, 160 and 200 kg N ha−1. Plant height was also not affected by the amount of nitrogen applied. Similar results were also found by Anwar et al. [58], who did not find significant differences in plant height in fertilization that exceeded 160 kg N ha−1. Hectoliter mass is most commonly used to assess maize grain quality. Hectoliter mass is a highly inherited property, so it is an indicator of potential differences between hybrids in chemical composition and energy content of the grain. In general, hectoliter mass is a quality parameter that responds to nitrogen fertilization, although no significant differences in fertilization treatments were observed in this study, which is in contrast to research conducted by Barrios Sanchez et al. [59].
Crop productivity significantly depends on the applied tillage because it is noted that in soils prone to compaction, lower yields occur most often as a result of interactions between soil penetration resistance, soil oxygen concentration, soil moisture, root growth and plant access to water and nutrients [60]. Ear weight, grain weight per cob, stalk weight, 1000 grain weight, straw and grain yield were under the significant influence of soil tillage treatment. The lowest values of the examined parameters were recorded in NT and were significantly lower than all other tillage treatments, which corresponds to Ramadhan [61]. The lowest grain mass per ear, stalk weight, grain and straw yield for NT could be due to a compacted soil layer causing reduced uptake of essential nutrients due to poor infiltration and limited root system penetration. These results are in agreement with those of Khan et al. [62], Khurshid et al. [63], and Yusuf [64], who concluded that tillage practices significantly affect crop yield and growth. Differences in ear weight, grain weight per cob, straw and grain yield between CT, SS, CH, and DH were not significant. Wang et al. [65] studied the impact of conventional and conservation tillage on some physical soil properties, yield, and maize yield components during 2016–2017. Significantly higher yields and yield components were recorded in conservation treatment (SS) at a depth of 35 cm. Mafongoya et al. [66] showed that grain yields in NT treatment were significantly lower than at the CT treatment which is consistent with our results. The response in the yield components that originated from the soil physical property amelioration by implementing adequate soil tillage probably reflected in maize yield, which increased under CT, SS, DH, and CH treatments. Tillage treatment did not significantly affect variations in plant height and hectoliter mass, which is in contrast to the research of Ramadhan [61] and Anjum et al. [67], who reported that taller plants were recorded in deep tillage and lower plant height was found in minimum tillage in maize.
The results of the research indicate a significant correlation between the examined parameters. A very high correlation between grain yield and ear weight and grain mass per cob is in line with the results of the research by Marković et al. [68]. A moderate correlation between grain yield and plant height is consistent with Jattot et al. [69].
Khazaei et al. [70] reported highly significant and positive correlation between grain yield with ear number, 1000 grain weight and grain number per ear.

4.2. Winter Wheat Yield and Yield Components

All investigated parameters were significantly influenced by the site properties and the level of applied nitrogen, while the influence of tillage was significant only for plant height and in the formation of grain and straw yield.
Plant height, number of sterile spikelets per spike, 1000 grain weight, hectoliter weight, straw and grain yield were significantly higher at the Magadenovac site, while number of fertile spikelets and grain per spike were higher at Cacinci. These yield components are directly related to wheat productivity [71], which can vary under different environmental factors and different soil management practices [72]. During the winter wheat vegetation, the amount of precipitation and air temperature deviated when compared with the 30-year average. Deviations from the average in the amount of precipitation were most pronounced during April-June in the period most intense and critical for growing winter wheat. During the vegetation air temperatures were higher in comparison with the multi-year average by 0.5 °C (Magadenovac) to 0.9 °C (Cacinci). The obtained results indicate a noticeable influence of climatic conditions on the examined properties, which is in line with research by Jug et al. [72]. All stages of wheat development were significantly affected by higher temperatures. Higher temperatures accelerate the onset of flowering [73,74,75,76], reduce the period of spike development, resulting in a shorter spike and reduced number of spikelets and grains per spike [77], and adversely affect pollen development [78]. According to Talukder et al. [79] the flowering period, which lasts for about 20 days before flowering and 10 days after anthesis, endures a temperature of a maximum of 31 °C without any decline in the number of grains.
Yield and yield components heavily depend on growth conditions, soil fertility, fertilizer application, water ability, and genotype. In addition to climatic conditions specific to the study site, soil properties play an important role in creating yield. Stagnosol (Cacinci) has a specific layer in which stagnant water is in soil and reduction conditions. This may cause a weak infiltration of water with stressful conditions for wheat crops (the gas exchange of roots with the atmosphere is inhibited). Excessive amount of water in the soil leads to additional negative conditions such as the accumulation of carbon dioxide, ethylene, and other compounds in the root zone, most often in combination with a lack of nutrients [80]. Such conditions have a negative effect on plant development which ultimately leads to reduced yields.
Excessive nitrogen fertilization will result in excessive vegetative mass of crops [81], will delay grain ripening and prolong vegetation, increase the sensitivity of crops to diseases and pests, and reduce the quality of the yield [48]. On the other hand, insufficient amount of N during intense vegetative growth will result in a smaller assimilation surface and reduced synthesis of chloroplast pigments, which will affect the photosynthesis process and ultimately result in reduced yield. Nitrogen fertilization significantly affects the grain and straw yield as well as all yield components, except for the hectoliter weight. Nitrogen significantly increased the number of grains per spike, number of fertile spikelets per spike and plant height, which is in line with the results obtained by Dargie et al. [82]. More grains per spike at optimal and luxury nitrogen doses may be due to higher availability of N. The mass of 1000 grains was the highest in reduced nitrogen fertilization, which is most likely a consequence of better grain filling of a significantly smaller number of grains per class, which was recorded in reduced N fertilization. Rahman et al. [83] reported that nitrogen application at the rate of 100 kg ha−1 in three equal splits produced significantly higher 1000 grain weight than the nitrogen rate of 120 kg ha−1. According to the same authors, the results indicate that the kernel size of wheat was more responsive to the method and timing of N application rather than the amount of N fertilization.
The highest grain yield was achieved in luxurious nitrogen fertilization, although the difference in relation to the grain yield achieved in the optimal fertilization was insignificant. Grain yield in reduced fertilization was significantly lower in comparison to luxurious and optimal nitrogen fertilization, which indicates the role and importance of nitrogen as a yielding element for achieving high and stable yields. The results revealed that the straw yield increased linearly with the increase in N rate, and the maximum straw yield recorded was achieved at luxurious nitrogen fertilization. The increase in grain and straw yield at higher doses of nitrogen can be attributed to the increased content of chlorophyll in the leaf, especially larger and wider leaves, which ultimately increased dry matter production [84]. Excessive fertilization is often the result of overestimated production opportunities in conditions where nutrient availability is not a limiting factor in production. The optimal N use for growth and maximizing yields is determined by physiological processes in plants, plant traits, environmental conditions and nutrient management [85]. In the conducted research, there was no negative effect of luxury nitrogen fertilization, which is probably due to the increased amount of precipitation that resulted in nitrogen leaching.
Soil tillage significantly affected grain yield, straw yield, and plant height. The highest grain and straw yield and plants height were recorded on SS treatment and were significantly higher in comparison to the grain and straw yield as well as plant height in the CT, CH, DH, and NT treatments. The assumption is that subsoiling treatment improved water infiltration and soil water capacity, which influenced the increased plant height and consequently increased wheat grain and straw yield. Schnieder et al. [86] analyzed the effects of subsoiling on soil properties and crop yield and found that the mean crop response to deep tillage was significantly positive. Their results suggest that deep tillage increases the availability of subsoil nutrients to plants, which increases crop yield. According to the same authors, on soils with stable soil structure and root-restricting layers, deep tillage can be an effective measure to mitigate drought stress and improve the resilience of crops under climate change conditions. Wang et al. [87] reported that under subsoiling tillage treatments, significantly higher grain yield was obtained in two experimental years, and that subsoiling made winter wheat more resilient to adverse weather.
This research results indicate the interrelationship of the investigated parameters: the number of grains per spike is related to the number of spikelets per spike, fertile and sterile, and plant height. According to Knezevic et al. [88], the number of grains per spike is also related to the number of flowers per spike, pollination efficiency, and seed development in flowers. Plant height was positively correlated with the number of fertile spikelets per spike as well as with straw and grain yield. According to Álvaro et al. [89], the increase in the number of spikelets potentially related to the increase in the f number of grains, which was also confirmed in this study. Philipp et al. [90] found that spikelet number per spike in wheat was not correlated with grain yield, which is in line with the results obtained in this study. Theerefore, sterile spikelet numbers have a significant effect on thousand grain weight and grain number per spike.

5. Conclusions

The results obtained in this research indicate a significant influence of site properties, tillage, and nitrogen treatments on maize and winter yield and selected yield components.
Higher plant height, ear weight, grain weight per cob, stalk weight, straw and grain yield were recorded on maize in agroecological conditions at the Magadenovac site compared to the Cacinci site. Maize achieved uniform yields on all tillage treatments, except for the NT treatment, where grain and straw yields were significantly lower. These results indicate the possibility of applying conservation tillage as well as conventional tillage in maize production. The highest yields, as well as yield components, were measured in the treatment with the optimal amount of nitrogen, which indicates the need to conduct soil analysis in order to make fertilization recommendations, that reduces the production costs and environmental pollution by nitrates.
Winter wheat achieved higher plant height, weight of 1000 grains and grain and straw yield in the agroecological conditions at the Magadenovac site compared to the Cacinci site. The highest winter wheat grain yields on tillage treatments were recorded as follows: SS > DH > CH > NT > CT. Significantly higher wheat grain yields were recorded in SS and DH, indicating that these treatments may be the most appropriate tillage systems for the investigated agroecological conditions. The highest yield, plant height and weight of 1000 grains were measured at a luxurious and optimal amount of nitrogen, while the reduced nitrogen fertilization produced significantly lower values of the investigated parameters. The obtained results indicate the importance of using fertilization recommendations because an insufficient dose of nitrogen reduces the yield, while luxury fertilization does not increase the yield at the cost of raised environmental nitrogen pollution.
The obtained results indicate the importance of optimal nitrogen fertilization and the possibility of implementing of conservation tillage in maize and winter wheat production in different agroecological conditions, thus reducing soil degradation processes, conserving soil and water by reducing their losses, reducing environmental pollution and achieving high and, maybe more important, stable yields.

Author Contributions

Conceptualization, I.J., B.B., B.Đ., V.V., and D.J.; Methodology, I.J., B.B., B.Đ. and D.J.; Software, I.J., B.B., B.Đ., B.S., and D.J.; Validation, I.J., E.W., and D.J.; Formal analysis, I.J. and D.J.; Investigation, I.J., B.B., B.Đ., V.V., B.S., and D.J.; Resources, I.J., E.W., and D.J.; Data curation, I.J., B.B., B.Đ., V.V. and D.J.; writing—original draft preparation, I.J. and D.J.; writing—review and editing, I.J., B.S., and D.J.; Visualization, I.J.; Supervision, I.J., B.S., and D.J.; Project administration, D.J.; Funding acquisition, I.J., E.W., and D.J. All authors have read and agreed to the published version of the manuscript.

Funding

This research was funded by the Croatian Ministry of Agriculture (VIP Project: “Conservation soil tillage as a measure for climate change mitigation”, research grant number 2012-11-55).

Institutional Review Board Statement

Not applicable.

Informed Consent Statement

Not applicable.

Data Availability Statement

Not applicable.

Acknowledgments

We would like to thank the owners of the farms “Zora” in Magadenovac and “Knežević” in Cacinci for their support during this study.

Conflicts of Interest

The authors declare no conflicts of interest.

References

  1. Eurostat. 2020. Available online: https://ec.europa.eu/eurostat/web/products-statistical-books/-/ks-fk-20-001 (accessed on 25 August 2021).
  2. Carpici, E.B.; Celik, N. Determining Possible Relationship between Yield and Yield-related Components in Forage Maize (Zea mays L.) Using Correlation and Path Analyses. Not. Bot. Horti Agrobot. Cluj-Napoca 2010, 38, 280–285. [Google Scholar] [CrossRef]
  3. Abbas, G.; Hussain, A.; Ahmad, A.; Wajid, S.A. Effect of Irrigation Schedules and Nitrogen Rates on Yield and Yield Components of Maize. J. Agri. Soc. Sci. 2005, 1, 335–338. [Google Scholar]
  4. Yilmaz, E.; Akçay, S.; Gürbüz, T.; Dağdelen, N.; Sezgin, F. Effect of Different Water Stress on the Yield and Yield Components of Second Crop Corn in Semiarid Climate. J. Food Agric. Environ. 2010, 8, 415–421. [Google Scholar] [CrossRef]
  5. Ibrahim, K.; Shamsudin, M.N.; Yacob, V.; Radam, A. Economic Impact of Climate Change on Maize Production in Northern Nigeria. Trends Appl. Sci. Res. 2014, 9, 522–533. [Google Scholar] [CrossRef] [Green Version]
  6. Cairns, J.E.; Hellin, J.; Sonder, K.; Arens, J.L.; MacRobert, J.F.; Thierfelder, C.; Prasanna, B.M. Adapting Maize Production to Climate Change in sub-Saharan Africa. Food Sec. 2013, 5, 345–360. [Google Scholar] [CrossRef] [Green Version]
  7. Liliane, T.N.; Mutwenga, S.C. Factors affecting yield of crops. In Agronomy-Climate Change & Food Security; Amanullah, IntechOpen: London, UK, 2020; Volume 9, pp. 1–16. [Google Scholar] [CrossRef]
  8. Bašić, F. The regionalisation of Croatian agriculture in the common agricultural policy of the EU. Civ. Cris. 2014, 1, 143–176. (In Croatian) [Google Scholar]
  9. Bodner, G.; Nakhforoosh, A.; Kaul, H.P. Management of crop water under drought: A review. Agron. Sust. Develop. 2015, 35, 401–442. [Google Scholar] [CrossRef]
  10. Jug, D.; Jug I: Brozović, B.; Vukadinović, V.; Stipešević, B.; Đurđević, B. The role of conservation agriculture in mitigation and adaptation to climate change. Poljoprivreda 2018, 24, 35–44. [Google Scholar] [CrossRef]
  11. Jug, D.; Đurđević, B.; Birkás, M.; Brozović, B.; Lipiec, J.; Vukadinović, V.; Jug, I. Effect of conservation tillage on crop productivity and nitrogen use efficiency. Soil Tillage Res 2019, 194, 1–15. [Google Scholar] [CrossRef]
  12. Rahman, M.; Aravindakshan, S.; Hoque, M.A.; Rahman, M.A.; Gulandaz, A.; Rahman, J.; Islam, T. Conservation tillage (CT) for climate-smart sustainable intensification: Assessing the impact of CT on soil organic carbon accumulation, greenhouse gas emission and water footprint of wheat cultivation in Bangladesh. Environ. Sustain. Indic. 2021, 10, 100–106. [Google Scholar] [CrossRef]
  13. FAO. What Is Conservation Agriculture? 2016. Available online: http://www.fao.org/conservation-agriculture/overview/what-is-conservation-agriculture/en/ (accessed on 25 August 2021).
  14. Sadiq, M.; Li, G.; Rahim, N.; Tahir, M.M. Effect of conservation tillage on yield of spring wheat (Triticum aestivum L.) and soil mineral nitrogen and carbon content. Int. Agrophys. 2021, 35, 83–95. [Google Scholar] [CrossRef]
  15. Omara, P.; Aula, L.; Eickhoff, E.M.; Dhillon, J.S.; Lynch, T.; Wehmeyer, G.B.; Raun, W. Influence of no-tillage on soil organic carbon, total soil nitrogen, and winter wheat (Triticum aestivum L.) grain yield. Int. J. Agron. 2019, 1–9. [Google Scholar] [CrossRef] [Green Version]
  16. Hirzel, J.; Undurraga, P.; León LPanichini, M.; Carrasco, J.; González, J.; Matus, I. Different Residues Affect Wheat Nutritional Composition. J. Soil Sci. Plant. Nutr. 2020, 20, 75–82. [Google Scholar] [CrossRef] [Green Version]
  17. Lal, R. Carbon Management in Agricultural Soils. Mitig. Adapt. Strat. Glob. Chang. 2007, 12, 303–322. [Google Scholar] [CrossRef]
  18. Zhang, S.X.; Li, Q.; Zhang, X.P.; Wei, K.; Chen, L.J.; Liang, W.J. Effects of conservation tillage on soil aggregation and aggregate binding agents in black soil of Northeast China. Soil Tillage Res. 2012, 124, 196–202. [Google Scholar] [CrossRef]
  19. Lu, X.; Lu, X.; Liao, Y. Conservation tillage increases carbon sequestration of winter wheat-summer maize farmland on Loess Plateau in China. PLoS ONE 2018, 13, 1–16. [Google Scholar] [CrossRef]
  20. Garcia-Franco, N.; Hobley, E.; Hübner, R.; Wiesmeier, M. Chapter 23-Climate-Smart Soil Management in Semiarid Regions. In Soil Management and Climate Change; Muñoz, M.A., Zornoza, R., Eds.; Academic Press: Cambridge, MA, USA, 2018; pp. 349–368. [Google Scholar] [CrossRef]
  21. Shah, Z.; Shah, S.H.; Peoples, M.B.; Schwenke, G.D.; Herriedge, D.F. Crop residue and fertilizer N effects on nitrogen fixation and yields of legume-cereal rotations and soil organic fertility. Field Crops Res. 2003, 83, 1–11. [Google Scholar] [CrossRef]
  22. Hawkesford, M.J. Reducing the reliance on nitrogen fertilizer for wheat production. J. Cereal Sci. 2014, 59, 276–283. [Google Scholar] [CrossRef] [PubMed] [Green Version]
  23. Jug, I.; Đurđević, B.; Vukadinović, V.; Jug, D.; Brozović, B. Optimization of nitrogen crop fertilization in sustainable agriculture practices. Glas. Zaštite Bilja 2018, 41, 28–39. (In Croatian) [Google Scholar] [CrossRef] [Green Version]
  24. Xu, F.; Chu, C.; Xu, Z. Effects of different fertilizer formulas on the growth of loquat rootstocks and stem lignification. Sci. Rep. 2020, 10, 1033. [Google Scholar] [CrossRef]
  25. Wang, Y.; Lu, J.; Ren, T.; Hussain, S.; Guo, C.; Wang, S.; Cong, R.; Li, X. Effects of nitrogen and tiller type on grain yield and physiological responses in rice. AoB PLANTS 2017, 9, 1–14. [Google Scholar] [CrossRef] [PubMed]
  26. Zhang, Z.; Zhang, Y.; Shi, Y.; Yu, Z. Optimized split nitrogen fertilizer increase photosynthesis, grain yield, nitrogen use efficiency and water use efficiency under water-saving irrigation. Sci. Rep. 2020, 10, 20310. [Google Scholar] [CrossRef]
  27. Qiao, J.; Yang, L.; Ting-mei, Y.; Xue, F.; Zhao, D. Nitrogen fertilizer reduction in rice production for two consecutive years in the Taihu Lake area. Agric Ecosyst Environ. 2012, 146, 103–112. [Google Scholar] [CrossRef]
  28. Roggatz, U.; McDonald, A.J.S.; Stadenberg, I.; Schurr, U. Effects of nitrogen deprivation on cell division and expansion in leaves of Ricinus communis L. Plant Cell Environ. 1999, 22, 81–89. [Google Scholar] [CrossRef]
  29. Sun, J.; Li, W.; Li, C.; Chang, W.; Zhang, S.; Zeng, Y.; Zeng, C.; Peng, M. Effect of Different Rates of Nitrogen Fertilization on Crop Yield, Soil Properties and Leaf Physiological Attributes in Banana Under Subtropical Regions of China. Front. Plant Sci. 2020, 11, 613760. [Google Scholar] [CrossRef]
  30. Zebarth, B.J.; Drury, C.F.; Tremblay, N.; Cambouris, A.N. Opportunities for improved fertilizer nitrogen management in production of arable crops in eastern Canada: A review. Can. J. Soil Sci. 2009, 89, 113–132. [Google Scholar] [CrossRef]
  31. WRB. World Reference Base for Soil Resources 2014, Update 2015—International Soil Classification System for Naming Soils and Creating Legends for Soil Maps; World Soil Resources Reports No.106; FAO: Rome, Italy, 2015; Available online: www.fao.org/3/i3794en/I3794en.pdf (accessed on 25 August 2021).
  32. Egner, H.; Riehm, H.; Domingo, W.R. Untersuchungen über die chemische Bodenanalyse als Grundlage für die Beurteilung des Nahrstoffzustandes der Boden, II: Chemische Extractionsmetoden zu Phosphorund Kaliumbestimmung. K. Lantbr. Ann. 1960, 26, 199–215. [Google Scholar]
  33. Bahadori, M.; Tofighi, H. Communications in soil science and plant analysis a modified Walkley-Black method based on spectrophotometric procedure a modified Walkley-Black method based on spectrophotometric. Commun. Soil Sci. Plant Anal. 2016, 47, 213–220. [Google Scholar] [CrossRef]
  34. International Organisation for Standardization ISO 11277. Soil Quality—Determination of Particle Size Distribution in Mineral Soil Material—Method by Sieving and Sedimentation; International Organization for Standardization: Geneva, Switzerland, 2009. [Google Scholar]
  35. USDA. Natural Resources Conservation Service, General Description for NCSS Soil Characterization Data. Available online: https://www.nrcs.usda.gov/wps/portal/nrcs/detail/soils/research/?cid=nrcs142p2_053543 (accessed on 22 August 2021).
  36. TIBCO Software Inc. Statistica (Data Analysis Software System) 2018, Version 13. Available online: http://tibco.com (accessed on 22 August 2021).
  37. Mukaka, M.M. Statistics corner: A guide to appropriate use of correlation coefficient in medical research. Malawi Med. J. 2012, 24, 69–71. [Google Scholar] [PubMed]
  38. Hinkle, D.E.; Wiersma, W.; Jurs, S.G. Applied Statistics for the Behavioral Sciences, 5th ed.; Houghton Mifflin: Boston, MA, USA, 2003; p. 682. [Google Scholar]
  39. Butts-Wilmsmeyer, C.J.; Seebauer, J.R.; Singleton, L.; Below, F.E. Weather During Key Growth Stages Explains Grain Quality and Yield of Maize. Agronomy 2019, 9, 16. [Google Scholar] [CrossRef] [Green Version]
  40. Sah, R.P.; Chakraborty, M.; Prasad, K.; Pandit, M.; Tudu, V.K.; Chakravarty, M.K.; Narayan, S.C.; Rana, M.; Moharana, D. Impact of Water Deficit Stress in Maize: Phenology and Yield Components. Sci. Rep. 2020, 10, 2944. [Google Scholar] [CrossRef] [PubMed]
  41. Lobell, D.B.; Bänziger, M.; Magorokosho, C.; Vivek, B. Nonlinear Heat Effects on African Maize as Evidenced by Historical Yield Trials. Nat. Clim. Chang. 2011, 1, 42–45. [Google Scholar] [CrossRef]
  42. Olesen, J.E.; Trnka, M.; Kersebaum, K.C.; Skjelvåg, A.O.; Seguin, B.; Peltonen-Sainio, P.; Rossi, F.; Kozyra, J.; Micale, F. Impacts and Adaptation of European Crop Production Systems to Climate Change. Eur. J. Agron. 2011, 34, 96–112. [Google Scholar] [CrossRef]
  43. Denmead, O.T.; Shaw, R.H. The Effects of Soil Moisture Stress at Different Stages of Growth on the Development and Yield of Corn 1. Agron. J. 1960, 52, 272–274. [Google Scholar] [CrossRef]
  44. Jug, D.; Jug, I.; Vukadinović, V.; Đurđević, B.; Stipešević, B.; Brozović, B. Conservation Soil Tillage as a Measure of Climate Change Mitigation; University of Osijek, Faculty of Agriculture in Osijek: Osijek, Croatia, 2017. (In Croatian) [Google Scholar]
  45. Quilleré, I.; Dargel-Graffin, C.; Lea, P.J.; Hirel, B. Variability for Nitrogen Management in Genetically-Distant Maize (Zea mays L.) Lines: Impact of Post-Silking Nitrogen Limiting Conditions. Agronomy 2018, 8, 309. [Google Scholar] [CrossRef] [Green Version]
  46. Meng, Q.; Cui, Z.; Yang, H.; Zhang, F.; Chen, X. Establishing high-yielding maize systems for sustainable intensification in China. Adv. Agron. 2018, 148, 85–109. [Google Scholar] [CrossRef]
  47. Elhanafi, L.; Houhou, M.; Rais, C.; Mansouri, I.; Elghadraoui, L.; Greche, H. Impact of Excessive Nitrogen Fertilization on the Biochemical Quality, Phenolic Compounds, and Antioxidant Power of Sesamum indicum L Seeds. J. Food Qual. 2019, 2019, 1–6. [Google Scholar] [CrossRef] [Green Version]
  48. Vukadinović, V. Plant Nutrition, 3rd ed.; Faculty of Agriculture in Osijek: Osijek, Croatia, 2011; pp. 174–180. (In Croatian) [Google Scholar]
  49. Erisman, J.W.; Galloway, J.N.; Seitzinger, S.; Bleeker, A.; Dise, N.B.; Petrescu, A.M.R.; Leach, A.M.; de Vries, W. Consequences of Human Modification of the Global Nitrogen Cycle. Phil. Trans. R. Soc. B 2013, 368. [Google Scholar] [CrossRef] [Green Version]
  50. Wang, G.L.; Ye, Y.L.; Chen, X.P.; Cui, Z.L. Determining the Optimal Nitrogen Rate for Summer Maize in China by Integrating Agronomic, Economic, and Environmental Aspects. Biogeosciences 2014, 11, 3031–3041. [Google Scholar] [CrossRef] [Green Version]
  51. Suchy, M.; Wassenaar, L.I.; Graham, G.; Zebarth, B. High-frequency NO3- isotope (delta N-15, delta O-18) patterns in groundwater recharge reveal that short-term changes in land use and precipitation influence nitrate contamination trends. Hydrol. Earth Syst. Sci. 2018, 22, 4267–4279. [Google Scholar] [CrossRef] [Green Version]
  52. Martínez-Dalmau, J.; Berbel, J.; Ordóñez-Fernández, R. Nitrogen Fertilization. A Review of the Risks Associated with the Inefficiency of Its Use and Policy Responses. Sustainability 2021, 13, 5625. [Google Scholar] [CrossRef]
  53. Marschner, H. Mineral Nutrition of Higher Plants, 2nd ed.; Academic Press: London, UK; San Diego, CA, USA, 1995; pp. 250–255. [Google Scholar]
  54. Corazzina, E.; Gething, M.A.; Mazzali, E. Fertilizing for High Yield of Maize. IPI Bulletin 5, 2nd ed.; International Potash Institute: Bern, Switzerland, 1991; p. 15. [Google Scholar]
  55. El Sabagh, A.; Majid, M.; Hasan, M.; Saddam, M.; Barutcular, C.; Ratnasekera, D.; Abdelaal, K.A.; Islam, M. Influence of varying nitrogen levels on growth, yield and nitrogen use efficiency of hybrid maize (Zea mays). J. Exp. Biol. Agric. Sci. 2017, 5, 134–142. [Google Scholar] [CrossRef]
  56. Abbasi, M.K.; Tahir, M.M.; Sadiq, A.; Iqbal, M.; Zafar, M. Yield and Nitrogen Use Efficiency of Rainfed Maize Response to Splitting and Nitrogen Rates in Kashmir, Pakistan. Agron. J. 2012, 104, 448–457. [Google Scholar] [CrossRef]
  57. Nyiraneza, J.; Ziadi, N.; Zebarth, B.J.; Sharifi, M.; Burton, D.L.; Drury, C.F.; Bittman, S.; Grant, C.A. Prediction of Soil Nitrogen Supply in Corn Production Using Soil Chemical and Biological Indices. Soil Sci. Soc. Am. J. 2012, 76, 925–935. [Google Scholar] [CrossRef]
  58. Anwar, S.; Ullah, W.; Islam, M.; Shafi, M.; Iqbal, A.; Alamzeb, M. Effect of nitrogen rates and application times on growth and yield of maize (Zea mays L.). PAB 2017, 6, 908–916. [Google Scholar] [CrossRef]
  59. Barrios-Sánchez, M.G.; Rodríguez-Yzquierdo, G.A.; Alvarez-Escobar, M.G. Efecto de La Fertilización Nitroazufrada Sobre El Rendimiento y Calidad de Tres Genotipos de Maíz Con Diferentes Texturas de Endospermo. Cienc. Y Tecnol. Agropecu. 2019, 20, 565–577. [Google Scholar] [CrossRef]
  60. Colombi, T.; Keller, T. Developing Strategies to Recover Crop Productivity after Soil Compaction—A Plant Eco-Physiological Perspective. Soil Tillage Res. 2019, 191, 156–161. [Google Scholar] [CrossRef]
  61. Ramadhan, M.N. Yield and yield components of maize and soil physical properties as affected by tillage practices and organic mulching. Saudi J. Biol. Sci. 2021, in press. [Google Scholar] [CrossRef]
  62. Khan, F.U.H.; Tahir, A.R.; Yule, I.J. Intrinsic implication of different tillage practices on soil penetration resistance and crop growth. Int. J. Agric. Biol. 2001, 1, 23–26. [Google Scholar]
  63. Khurshid, K.; Iqbal, M.; Arif, M.S.; Nawaz, A. Effect of tillage and mulch on soil physical properties and growth of maize. Int. J. Agric. Biol. 2006, 5, 593–596. [Google Scholar]
  64. Yusuf, D.D. Effect of variation in tillage systems on maize (Zea mays L.) establishment and grain yield in semi-arid tropical climate. J. Agric. Sci. Technol. 2006, 8, 171–179. [Google Scholar]
  65. Wang, S.; Guo, L.; Zhou, P.; Wang, X.; Shen, Y.; Han, H.; Ning, T.; Han, K. Effect of Subsoiling Depth on Soil Physical Properties and Summer Maize (Zea mays L.) Yield. Plant Soil Environ. 2019, 65, 131–137. [Google Scholar] [CrossRef] [Green Version]
  66. Mafongoya, P.; Jiri, O.; Phophi, M. Evaluation of Tillage Practices for Maize (Zea mays) Grown on Different Land-Use Systems in Eastern Zambia. Sustain. Agric. Res. 2015, 5, 10–23. [Google Scholar] [CrossRef]
  67. Anjum, S.A.; Ashraf, E.U.; Tanveer, M.; Qamar, R.; Khan, I. Morphological and Phenological Attributes of Maize Affected by Different Tillage Practices and Varied Sowing Methods. Am. J. Plant Sci. 2014, 5, 1657–1664. [Google Scholar] [CrossRef] [Green Version]
  68. Marković, M.; Josipović, M.; Šoštarić, J.; Jambrović, A.; Brkić, A. Response of Maize (Zea mays L.) Grain Yield and Yield Components to Irrigation and Nitrogen Fertilization. JCEA 2017, 18, 55–72. [Google Scholar] [CrossRef] [Green Version]
  69. Jatto, M.I.; Aisha, M.; Kadams, A.M.; Fakuta, N.M. Correlation among Yield and Yield Components In Maize (Zea mays L.). J. Adv. Res. 2015, 3, 413–416. [Google Scholar]
  70. Khazaei, F.; Alikhani, M.A.; Yari, L.; Khandan, A. Study the correlation, regression and path coefficient analysis in sweet corn (Zea mays var. saccharata) under different levels of plant density and nitrogen rate. ARPN J. Agric. Biol. Sci. 2010, 5, 14–19. [Google Scholar]
  71. Knezevic, D.; Paunovic, A.; Madic, M.; Djukic, N. Genetic Analysis of Nitrogen Accumulation in Four Wheat Cultivars and Their Hibrids. Cereal Res. Comm. 2007, 35, 633–636. [Google Scholar] [CrossRef]
  72. Jug, I.; Jug, D.; Sabo, M.; Stipešević, B.; Stošić, M. Winter wheat yield and yield components as affected by soil tillage systems. Turk. J. Agric. For. 2011, 35, 1–7. [Google Scholar] [CrossRef]
  73. Halliday, K.J.; Salter, M.G.; Thingnaes, E.; Whitelam, G.C. Phytochrome Control of Flowering Is Temperature Sensitive and Correlates with Expression of the Floral Integrator FT: Phytochrome Regulation of FT. Plant J. 2003, 33, 875–885. [Google Scholar] [CrossRef] [PubMed]
  74. Salomé, P.A.; McClung, C.R. The Arabidopsis Thaliana Clock. J. Biol. Rhythm. 2004, 19, 425–435. [Google Scholar] [CrossRef]
  75. Salomé, P.A.; Weigel, D.; McClung, C.R. The Role of the Arabidopsis Morning Loop Components CCA1, LHY, PRR7, and PRR9 in Temperature Compensation. Plant Cell 2010, 22, 3650–3661. [Google Scholar] [CrossRef] [Green Version]
  76. Capovilla, G.; Schmid, M.; Pose, D. Control of Flowering by Ambient Temperature. J. Exp. Bot. 2015, 66, 59–69. [Google Scholar] [CrossRef] [Green Version]
  77. Farooq, M.; Bramley, H.; Palta, J.A.; Siddique, K.H.M. Heat Stress in Wheat during Reproductive and Grain-Filling Phases. Crit. Rev. Plant Sci. 2011, 30, 491–507. [Google Scholar] [CrossRef]
  78. Rieu, I.; Twell, D.; Firon, N. Pollen Development at High Temperature: From Acclimation to Collapse. Plant Physiol. 2017, 173, 1967–1976. [Google Scholar] [CrossRef] [Green Version]
  79. Talukder, A.S.M.H.M.; McDonald, G.K.; Gill, G.S. Effect of Short-Term Heat Stress Prior to Flowering and Early Grain Set on the Grain Yield of Wheat. Field Crops Res. 2014, 160, 54–63. [Google Scholar] [CrossRef]
  80. Arduini, I.; Baldanzi, M.; Pampana, S. Reduced Growth and Nitrogen Uptake During Waterlogging at Tillering Permanently Affect Yield Components in Late Sown Oats. Front. Plant Sci. 2019, 10, 1087. [Google Scholar] [CrossRef] [PubMed] [Green Version]
  81. Bertic, B.; Loncaric, Z.; Vukadinovic, V.; Vukobratovic, Z.; Vukadinovic, V. Winter Wheat Yield Responses to Mineral Fertilization. Cereal Res. Commun. 2007, 35, 245–248. [Google Scholar] [CrossRef]
  82. Dargie, S.; Wogi, L.; Kidanu, S. Nitrogen Use Efficiency, Yield and Yield Traits of Wheat Response to Slow-Releasing N Fertilizer under Balanced Fertilization in Vertisols and Cambisols of Tigray, Ethiopia. Cogent Environ. Sci. 2020, 6, 1778996. [Google Scholar] [CrossRef]
  83. Rahman, M.A.; Sarker, M.; Amin, M.; Jahan, A.; Akhter, M. Yield Response and Nitrogen Use Efficiency of Wheat Under Different Doses And Split Application Of Nitrogen Fertilizer. Bangladesh J. Agric. Res 2011, 36, 231–240. [Google Scholar] [CrossRef] [Green Version]
  84. Usman, K.; Khan, E.A.; Khan, N.; Khan, M.A.; Ghulam, S.; Khan, S.; Baloch, J. Effect of Tillage and Nitrogen on Wheat Production, Economics, and Soil Fertility in Rice-Wheat Cropping System. Am. J. Plant Sci. 2013, 4, 17–25. [Google Scholar] [CrossRef] [Green Version]
  85. Spiertz, J.H.J. Nitrogen, Sustainable Agriculture and Food Security. A Review. Agron. Sustain. Dev. 2010, 30, 43–55. [Google Scholar] [CrossRef] [Green Version]
  86. Schneider, F.; Don, A.; Hennings, I.; Schmittmann, O.; Seidel, S.J. The Effect of Deep Tillage on Crop Yield—What Do We Really Know? Soil Till Res. 2017, 174, 193–204. [Google Scholar] [CrossRef]
  87. Wang, H.; Bai, W.; Han, W.; Song, J.; Lv, G. Effect of Subsoiling on Soil Properties and Winter Wheat Grain Yield. Soil Use Manag. 2019, 35, 643–652. [Google Scholar] [CrossRef]
  88. Knezevic, D.; Zecevic, V.; Stamenkovic, S.; Atanasijevic, S.; Milosevic, B. Variability of number of kernels per spike in wheat cultivars (Triticum aestivum L.). J. Cent. Eur. Agric. 2012, 13, 617–623. [Google Scholar] [CrossRef]
  89. Álvaro, F.; Isidro, J.; Villegas, D.; García del Moral, L.F.; Royo, C. Old and Modern Durum Wheat Varieties from Italy and Spain Differ in Main Spike Components. Field Crop. Res. 2008, 106, 86–93. [Google Scholar] [CrossRef]
  90. Philipp, N.; Weichert, H.; Bohra, U.; Weschke, W.; Schulthess, A.W.; Weber, H. Grain Number and Grain Yield Distribution along the Spike Remain Stable despite Breeding for High Yield in Winter Wheat. PLoS ONE 2018, 13, e0205452. [Google Scholar] [CrossRef] [PubMed] [Green Version]
Figure 1. Correlation between grain yield with some selected yield components of maize: (a) very high correlation between ear weight and grain yield of maize; (b) very high correlation between grain weight per cob and grain yield of maize; (c) very high correlation between stalk weight and grain yield of maize; (d) very high correlation between straw and grain yield of maize; (e) moderate correlation between plant height and grain yield of maize; (f) moderate correlation between 1000 grain weight and grain yield of maize.
Agronomy 11 02156 g001aAgronomy 11 02156 g001b
Figure 2. Correlation between some selected yield components of winter wheat: (a) very hight correlation between number of fertile spikelets per spike and number of grains per spike; (b) low correlation between plant height and number of grains per spike; (c) low correlation between plant height and number of fertile spikelets per spike; (d) low correlation between plant height and straw yield; (e) low correlation between plant height and grain yield; (f) low correlation between grain and straw yield.
Agronomy 11 02156 g002
Table 1. Selected soil properties of the experimental sites.
SdpHH2OpHKClPKHyOMSandSiltClaySt
Stagnosol0–305.094.03621272.542.4915.6555.2529.10SiCL
30–60 18.4753.2328.30SiCL
Gleysol0–305.294.271722274.391.459.9271.7818.30SiL
30–60 10.8066.2123.00SiL
Stagnosol— Cacinci site, Gleysol—Magadenovac site, Sd—soil depth (cm), P—(AL) mg kg−1 soil, K—(AL) mg kg−1 soil, Hy—cmol(+) kg−1, OM—organic matter (%), Sand—(2–0.05 mm) %, Silt—(0.05–0.002 mm) %, Clay—(<0.002 mm) %, St—soil texture, SiCL—silty clay loam, SiL—silty loam.
Table 2. Monthly, annual and 30-yr average precipitation (mm) and air temperature (°C) at both experimental sites (S1—Cacinci site, S2—Magadenovac site).
SiteYearMonth
JanFebMarAprMayJunJulAugSepOctNovDecTaAa
Precipitation (mm)
S1201387101975380832899143421021916
201440654998160647913510811625781017
LTA564154637595697077707465809
S2201362112113461135415739729671782
2014527625691396282831191432468942
LTA503946576886636669616556726
Air temperature (°C)
S120132.22.85.113.116.519.823.322.715.713.67.62.5 12.1
20144.35.59.612.815.420.321.820.316.411.35.81.9 12.1
LTA0.61.86.311.616.319.721.821.116.411.46.01.7 11.2
S220132.02.84.913.317.019.923.322.815.613.37.61.8 12.0
20143.65.29.813.215.720.422.020.416.712.97.51.9 12.0
LTA0.31.86.512.017.020.322.321.816.911.65.91.3 11.5
Ta—Total annual; Aa—Average annual; LTA—long term average (1984–2013).
Table 3. Influence of site properties, tillage treatments and nitrogen doses on the yield and yield components of maize in 2013.
PH
(cm)
EW
(g)
GWPC
(g)
SW
(g)
1000 GW
(g)
HLM
(kg hl−1)
GY
(t ha−1)
SY
(t ha−1)
SS1190.89 b283.68 b146.88 b283.39 b299.0475.61 a9.15 b35.33 b
S2214.62 a385.84 a198.01 a363.44 a302.1474.14 b13.46 a50.95 a
FS38.0754.5555.0947.94ns19.3192.1991.72
TTCT200.50373.81 a189.62 a363.32 a324.56 a75.1112.43 a48.16 a
SS201.06354.40 a183.42 a331.97 ab305.16 bc74.9412.07 a45.12 a
CH206.94347.09 a174.11 a331.23 ab307.67 ab74.3411.44 a44.58 a
DH211.33336.18 a174.80 a318.70 b289.26 cd75.0811.48 a43.06 a
NT193.94262.30 b140.26 b271.84 c276.30 d74.919.13 b34.77 b
FTns7.656.156.608.59ns6.577.61
FTN1196.67296.99 b152.34 b297.26 b294.4774.849.98 b38.92 b
N2208.20363.61 a186.56 a344.72 a309.7475.0512.23 a46.41 a
N3203.40343.68 a178.43 a328.27 a297.5674.7311.71 a44.09 a
FFns8.158.985.79nsns9.137.38
average202.76334.76172.44323.41300.5974.8711.3143.14
Values with different letters in a column differ significantly at p < 0.05; Note: S: Site (S1: Cacinci site, S2: Magadenovac site), TT: tillage treatments (CT: conventional tillage, SS: subsoiling, CH: chiseling, DH: disk-harrowing, NT: no-till), FT: fertilization treatment (N1: reduced nitrogen fertilization, N2: optimal nitrogen fertilization, N3: luxury nitrogen fertilization), FS: F test for site properties, FT: F test for soil tillage treatments, FF: F test for nitrogen treatments, ns: not significant, PH: plant height, EW: ear weight, GWPC: grain weight per cob, SW: stalk weight, 1000 GW: 1000 grain weight, HLM: Hectoliter mass, GY: grain yield, SY: straw yield.
Table 4. The Pearson’s linear correlation coefficients between yield and yield components of maize for all sites, tillage treatments and nitrogen fertilization treatments.
PHEWGWPCSW1000 GWHLMGY
EW 0.620 *
GWPC 0.645 *0.981 *
SW 0.601 *0.949 *0.915 *
1000 GW 0.2050.667 *0.617 *0.671 *
HLM −0.0870.015−0.002−0.0020.322 *
GY 0.663 *0.975 *0.993 *0.908 *0.579 *−0.061
SY 0.643 *0.984 *0.962 *0.974 *0.633 *−0.0530.969 *
Marked correlations with * are significant at p < 0.05; Note: PH: plant height (cm), EW: ear weight (g), GWPC: grain weight per cob (g), SW: stalk weight (g), 1000 GW: 1000 grain weight (g), HLM: hectoliter mass (kg ha−1), GY: grain yield (t ha−1), SY: straw yield (t ha−1).
Table 5. Influence of site properties, tillage treatments and nitrogen doses on yield and yield components of w. wheat in 2014.
PH
(cm)
NFSNSSNGPS1000 GW
(g)
HLM
(kg hl−1)
GY
(t ha−1)
SY
(t ha−1)
SS161.81 b16.17 a2.12 b36.50 a28.81 b65.73 b5.21 b6.44 b
S263.16 a14.69 b3.67 a30.47 b35.32 a68.38 a6.53 a7.26 a
FS4.6017.6837.2212.0471.7021.7741.9810.39
TTCT63.99 b15.083.2331.2732.4367.165.27 c7.33 b
SS66.23 a15.902.6735.4432.5267.446.69 a8.54 a
CH62.01 b15.793.0735.0431.1067.195.68 bc5.72 c
DH63.73 b15.282.7632.6132.4366.866.09 ab6.27 c
NT56.46 c15.112.7733.0631.8566.625.62 bc6.41 c
FT27.42nsnsnsnsns5.6915.15
FTN155.18 c14.75 b3.50 a29.76 b33.45 a67.414.64 b5.61 c
N267.10 a15.86 a2.59 b35.49 a31.28 b67.206.31 a7.15 b
N365.17 b15.69 a2.60 b35.20 a31.47 b66.556.66 a7.80 a
FF137.523.885.624.603.24ns36.8726.31
average62.4815.432.9033.4832.0667.055.876.85
Values with different letters in a column differ significantly at p < 0.05; Note: S: Site (S1: Cacinci site, S2: Magadenovac site), TT: tillage treatments (CT: conventional tillage, SS: subsoiling, CH: chiseling, DH: disk-harrowing, NT: no-till), FT: fertilization treatment (N1: reduced nitrogen fertilization, N2: optimal nitrogen fertilization, N3: luxury nitrogen fertilization), FL: F test for site properties, FT: F test for tillage treatments, FF: F test for nitrogen treatments, ns: not significant, PH: plant height, NFS: number of fertile spikelets per spike, NSS: number of sterile spikelets per spike, NGPS: number of grains per spike, 1000 GW: 1000 Grain weight, HLM: hectoliter mass, GY: grain yield, SY: straw yield.
Table 6. The Pearson’s linear correlation coefficients between yield and yield components of w. wheat for all sites, tillage and nitrogen fertilization treatments.
PH NFSNSSNGPS1000 GW HLM GY
NFS0.347 *
NSS−0.201−0.738 *
NGPS0.345 *0.927 *−0.783 *
1000 GW 0.065−0.2080.465 *−0.230
HLM 0.035−0.0890.291−0.1120.641 *
GY 0.491 *0.227−0.1260.2900.2840.258
SY 0.568 *0.192−0.0760.2230.1100.0650.480 *
Marked correlations with * are significant at p <0.05; Note: PH: plant height (cm), NFS: number of fertile spikelets per spike, NSS: number of sterile spikelets per spike, NGPS: number of grains per spike, 1000 GW: 1000 grain weight (g), HLM: hectoliter mass (kg ha−1), GY: grain yield (t ha−1), SY: straw yield (t ha−1).
Publisher’s Note: MDPI stays neutral with regard to jurisdictional claims in published maps and institutional affiliations.

