Article

Genetic Diversity and Primary Core Collection Construction of Turnip (Brassica rapa L. ssp. rapifera Matzg) Landraces in Tibet Revealed via Morphological and SSR Markers

1
Department of Horticulture, College of Agriculture and Biotechnology, Zhejiang University, Hangzhou 310058, China
2
Hainan Institute of Zhejiang University, Sanya 572025, China
3
College of Plant Science, Tibet Agricultural and Animal Husbandry University, Nyingchi 860000, China
4
Zibo Vegetable Office Shandong Province, Zibo 255000, China
*
Author to whom correspondence should be addressed.
Agronomy 2021, 11(10), 1901; https://doi.org/10.3390/agronomy11101901
Submission received: 30 July 2021 / Revised: 9 September 2021 / Accepted: 18 September 2021 / Published: 22 September 2021
(This article belongs to the Special Issue Analysis of the Genetic Diversity of Crops and Associated Microbiota)

Abstract

:
Turnip, one of the oldest groups of cultivated Brassica rapa species, is a traditional crop as well as a form of animal fodder, a vegetable, and a herbal medicine that is widely cultivated in farming and farming-pastoral regions in Tibet. Different regions of the Qinghai–Tibet Plateau (QTP) are home to a rich diversity of turnip owing to their high altitudes and variable climate types. However, information on the morphology and genetic diversity of Tibetan turnip remains limited. Therefore, the genetic diversity of 171 turnip varieties from China and elsewhere (Japan, Korea, and Europe) was analyzed using 58 morphological characteristics and 31 simple sequence repeat (SSR) markers in this study. The varieties showed that the genetic distance ranged from 0.12 to 1.00, and the genetic similarity coefficient ranged between 0.73 and 0.95. Cluster tree showed two distinct clusters. Both morphotype and geography contributed to the group classification. A combination of morphological traits and molecular markers could refine the precision of accurate identification compared to the separate morphological and molecular data analyses. The sampling ratio of 15% to utmost precisely represent the initial population was compared to ratios of 10% and 20%, and the sampling ratio of 15% is recommended for future works when a primary core collection of turnip resources is constructed. These results could furnish a foundation for germplasm conservation and effective turnip breeding in future studies.

1. Introduction

Turnip (Brassica rapa syn. B. campestris L. ssp. rapifera Matzg), belonging to the Brassica genus, has been an important global crop for centuries, first being cultivated in China in 2500 B.C. It is known by many Chinese names, such as Feng, Manjing, Yuancaitou, Yuangen, Pancai, Buliuke, Jiuyingsong, Yuanluobo, and Zhugecai [1]. As a B. rapa subspecies, this turnip group represents one of the oldest groups of cultivated B. rapa type [2]. In the Tibet Autonomous Region of China, turnip is called “Niuma” and is widely used as a vegetable, fodder, oilseed, traditional Tibetan medicine, and as raw material in butter lamps [3,4]. Additionlly, it is considered an ideal cash crop for cold areas at high altitudes area due to its relatively short growth period and its high resistance to barren conditions, and cold climates.
The Tibet Autonomous Region (TAR), located in southwestern China, comprises the main section of the Qinghai–Tibet Plateau (QTP), which has an average elevation of 4000 m above sea level. The annual temperature ranges from—0.5 °C to 3 °C, a range suitable for turnip growth [5]. Turnips are widely cultivated in agricultural areas and farming-pastoral regions in the TAR, and its vertical altitude distribution could reach 4300 m [6]. The typical environmental characteristics of the QTP, include high elevation, high ultraviolet radiation intensities, complex terrain, and diverse climate conditions, render long-term artificial selection plant genes prone to mutations leading to variations [7]. Meanwhile, status of the underdeveloped transportation infrastructure in the region prevents the Tibetan turnip from coming into contact with external turnip germplasms, preserving primitive germplasm groups. The traditional independent family farm mode and the typical geographic origin result in high diversity among these individual turnip landraces [8]. Beyond this, the QTP occupies an important position as the world’s earliest and largest agricultural and cultivated plant origin center [9]. Many of the locally cultivated and semi-wild species of Brassica have been collected in the southeast part of Tibet [10]. Wang et al. proposed that Tibet’s central and east zones comprise two distribution areas of wild rapeseed and dozens of wild rapeseed populations on the Tibetan Plateau have been found, suggesting that Tibet Plateau is one of the origin centers of Brassica rapeseed globally [11].
Despite being an ancient and well-known plant species, turnip cultivation is decreasing in most countries. The QTP is Asian’s water tower and plays an essential role in global climate regulation [12]. The acceleration of urbanization and changing modern agricultural production methods are both underway in Tibet [13]. Many related factors have led to the decline in turnip landraces in this area, e.g., during the implementation of the Green for Grain Project on QTP, in which the plantation areas of crops is reducing gradually, and forage crops, excluding turnip, are significantly increasing in recent years [14]. Moreover, Tibetans have begun using cultivate turnip of F1 hybrid seeds at scale, which may lead to a significant decrease in, or even a loss of, the special landraces of turnip in Tibet [11]. The assessment of genetic diversity and resource collection is a prerequisite for efficient organization, conservation, and utilization of turnip and other Brassica species improvement, new cultivar deployment, and hybrid seed production [15,16,17]. However, reports about the genetic diversity and collection of turnip resources from Tibet are limited thus far. Therefore, collecting and assessing “Niuma” resources and constructing a Tibetan turnip landrace bank are urgent for the diversity retention of turnip landraces in Tibet.
Genetic diversity analysis is the basis of variety resource evaluation, utilization, and preservation, as well as breeding new varieties [18]. Many studies on the genetic diversity of turnip have been conducted following morphological characteristics or limited molecular markers, revealing that turnip (Brassica rapa) has a high genetic variation [1,19]. However, morphological descriptions vary significantly based on environmental factors, e.g., farming practices, age, and the developmental stages of plants [20]. In recent decades, different types of molecular markers, including restriction fragment length polymorphisms (RFLP), amplified fragment length polymorphisms (AFLP), random amplified polymorphic DNA (RAPD), simple sequence repeats (SSR), and single nucleotide polymorphism (SNP), have been applied to evaluate the genetic diversity of Brassica, particularly turnip-type rapeseed, in different regions by many researchers [2,21,22,23]. Among these markers, the development of SSR technology has been widely used for analyzing genetic diversity in plant species due to its low cost and simple use to reveal the genetic relationships among different varieties [1,17,24,25].
This study aimed to determine the genetic diversity, the relationship, and the genetic structure of turnip varieties from a broad range of geographic regions in the QTP using SSR markers and morphological data. Then, a representative sampling ratio when constructing a primary core collection of turnip was calculated. This will provide a basis for protecting Tibetan turnip landraces and production applications.

2. Materials and Methods

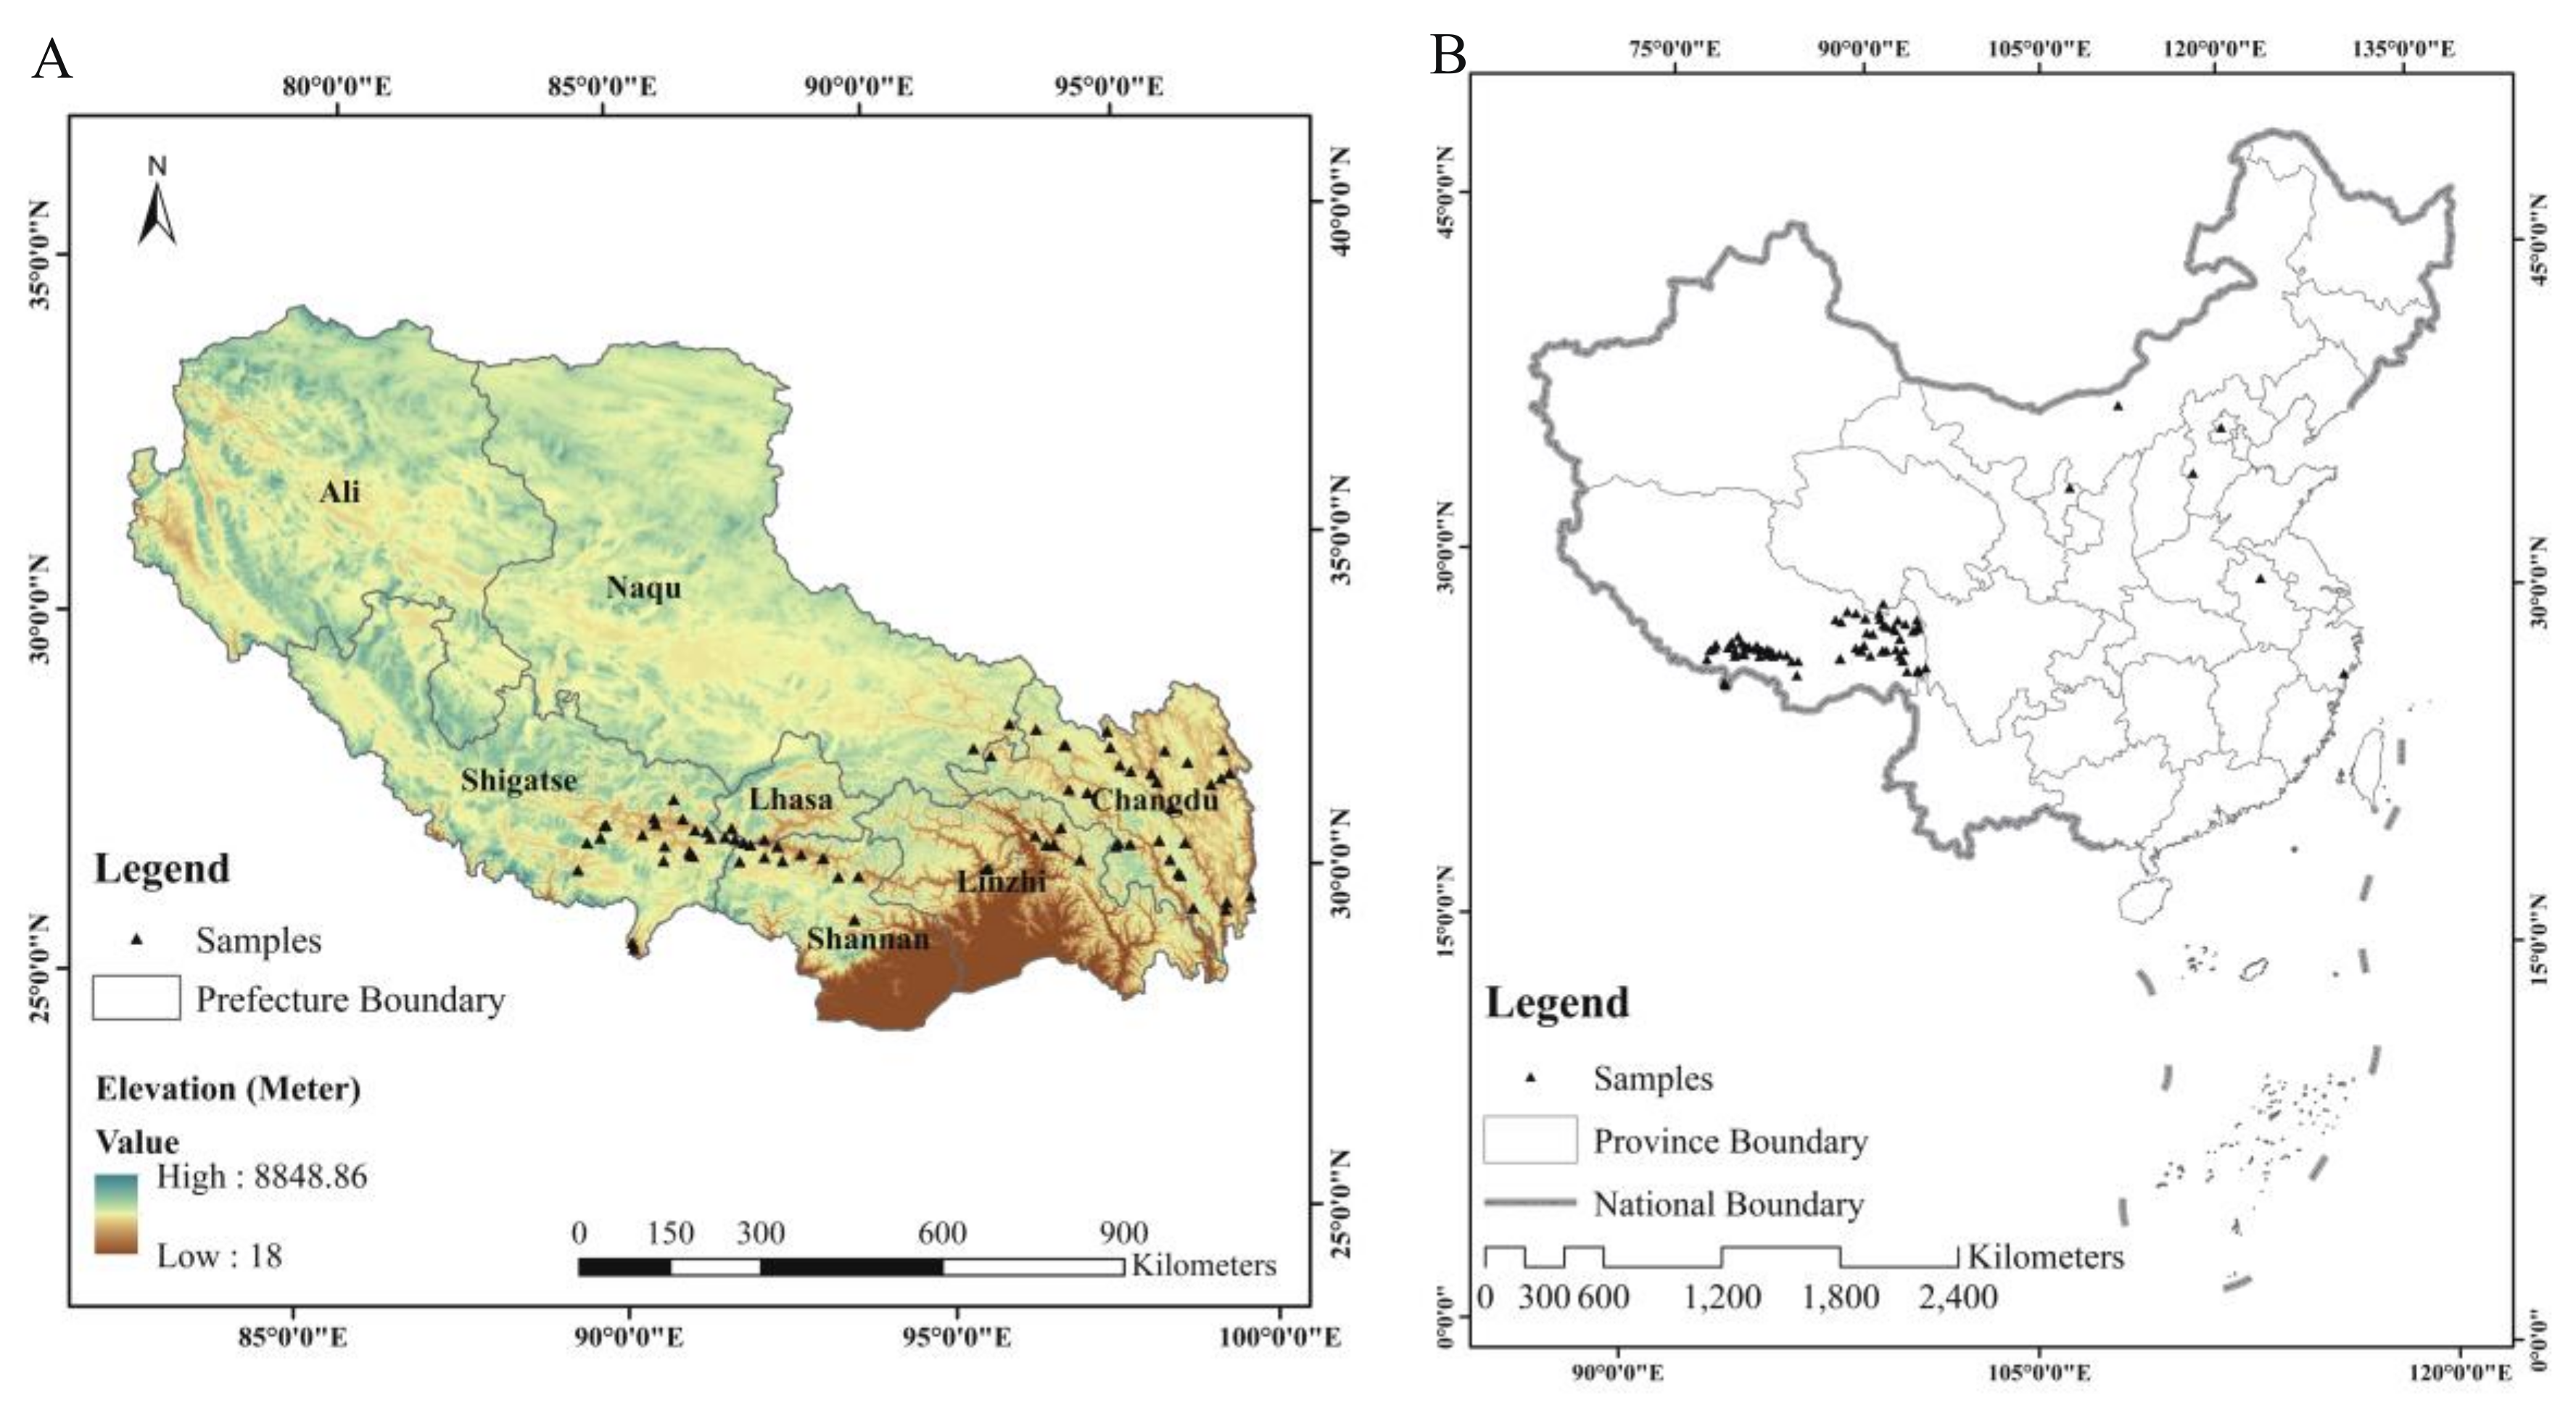
2.1. Plant Materials and Experimental Design

A total of 171 varieties were collected, including 118 turnip landraces from the central and eastern zones (two distribution areas of wild Brassica) of the Tibet Autonomous Region (from 26°50′ N, 78°25′ E to 36°53′ N, 99°06′ E), 23 varieties from different provinces of China, and 30 varieties from Europe, Japan, and Korea (Figure 1). The materials included 169 turnips and two Chinese cabbages (B. campestris L. ssp. pekinensis) and they were numbered 177-01 to 177-171 (Table S1). All varieties were planted in the greenhouse for DNA extraction and morphological investigation. The experiment was carried out from October to August of next year, 2017 to 2019, at the experimental station of Zhejiang University located in Wuxi, Jiangsu Province (from 31°07′ N, 119°33′ E to 32°02′ N, 120°38′ E). Varieties were initially sown in the seeding tray containing nutrient soil (1–2 seeds per hole), and seedlings at the 6–8 true leaves stages were transplanted into a greenhouse. About thirty plants of each variety with uniform growth were selected and arranged in a randomized complete block design with their own labels. Agronomic practices including irrigation, fertilization, and deworming were conducted uniformly as required in all blocks during the culture.

2.2. Investigation and Statistics of Morphological Characteristics

A total of 58 morphological traits including 33 quantitative and 25 qualitative traits related to cotyledon, leaf, tuber, and flower were measured at different stages (Table S2) [26]. Ten plants of each variety with uniform growth were used for the investigation.
The qualitative traits were evaluated visually and converted to standard data as shown in Table S2 following the description of Descriptors and Data Standard for Root and Stem Mustard (B. juncea Coss.) [5,26]. The quantitative traits (length, width, diameter, and weight) were measured with a ruler, a caliper, and an electronic balance. All raw data were recorded in a Microsoft Excel 2016 (Microsoft, Washington, DC, USA) worksheet, and mean values, as well as standard deviations, of the raw quantitative traits data were obtained. The Shannon–Weaver (H’) values of qualitative traits were calculated based on the distribution frequency of each grade. Data on quantitative traits were divided into 10 grades according to the mean (χ) and the standard deviation (σ), e.g., 1 grade Xi < χ − 2σ, 10 grade Xi > χ + 2σ, with a 0.5σ difference between each adjacent grade as described by Wang et al. [27]. The formula for calculating the H’ was as follows: H = P i ln P i , where i is the grade, and Pi indicates the probability of the i grade in each trait.
To make the data effective and sensible and to facilitate comparisons between them, the variables were standardized (Z-score) by SPSS v 19.0 (SPSS, Chicago, IL, USA). This makes the data unitless, expressed only in terms of deviation from an index of centrality (e.g., the mean or the median). Then, principal component analysis was performed for 53 morphological traits in the same software. Finally, a morphological dendrogram was constructed using the clustering method of Euclidean distance metrics with average connections among groups based on the principal component analysis by SPSS v 19.0 (SPSS, Chicago, IL, USA) [5].

2.3. DNA Extraction and SSR Analysis

Young, expanding leaves from at least three plants in each variety were bulked in the seedling stage for DNA extraction. The method of DNA extraction and polymerase chain reaction (PCR) analysis followed the methods of Gao et al. [1,28]. The quality of the DNA template was detected using a UV spectrophotometer and agarose gel electrophoresis.
A set of 31 SSR loci with clearly distinguishable polymorphic bands and stable reproducibility in the pre-experiment were selected to genotype all varieties (Table S3). These markers were developed by Wang (2012) [29] based on the whole genomic sequence of B. rapa (A01–A10, Accessions Codes: DDBJ/GenBank/EMBL_AENI00000000 AENI01000000) [30] and have been used previously in genetic diversity analysis of turnip [5].
PCR reactions were performed in 10-µL volumes containing 5 µL of 2 × T5 Super PCR Mix (PAGE; Beijing TsingKe Biotech Co., Ltd., Beijing, China), 0.4 µL of forward primer (0.4 µM), 0.4 µL of reverse primer (0.4 µM), 1 µL of (~50 ng) genomic DNA template, and 3.2 µL of ddH2O. The PCR amplification procedure consisted of pre-denaturation at 98 °C for 3 min, 30–35 cycles at 98 °C for 10 s, annealing at 56 °C–60 °C for 10 s depending on the annealing temperature of each primer pair, elongation at 72 °C for 10 s, and a final extension at 72 °C for 2 min. Three repetitions were performed throughout the experiment.
PCR products were separated via 12% non-denatured polyacrylamide gel electrophoresis (Native-PAGE) and visualized using the silver staining method as reported by Gao et al. [1,31]. All major DNA band sizes were detected using a 100–1000 bp DNA ladder as the reference. Clearly distinguishable polymorphic single bands ranging from 50 bp–500 bp were scored as present (1) or absent (0) and recorded into an Excel worksheet to form a 0/1 data matrix following the procedures described previously [1,2,5]. Heterozygous genotypes were not used.

2.4. Data Analysis

Genetic statistics including major allele frequency, the number of alleles, genetic diversity, and the polymorphic information content (PIC) of each microsatellite locus were calculated in PowerMarker v 3.25 [32]. Band frequency, Shannon’s Information Index (I), expected heterozygosity (He), and unbiased expected heterozygosity (uHe) were calculated using GenAlex 6.51 [33]. Pairwise genetic similarity coefficients were calculated using the Dice coefficient by the SIMQUAL program of NTSYS2.10e [34]. Afterwards, a dendrogram for SSR markers was developed based on the genetic similarity matrix through the unweighted pair group method with an arithmetic mean (UPGMA) algorithm and generated by the SHAN cluster analysis of the NTSYS-pc. Cophenetic correlation values between the original genetic similarity coefficient matrices and the cophenetic value matrices given by the UPGMA clustering process were calculated to support the clustering by the Mantel test [34]. The correlation of the similarity coefficient matrices between the morphological traits and the SSR markers was also revealed using the same procedure. Moreover, a joint analysis based on combined data of morphological traits and SSR markers was also conducted to verify the precision of clustering compared to the separate morphological and molecular data analyses.
The population genetic structure of 171 turnips was evaluated by a Bayesian clustering algorithm implemented in the software STRUCTURE v.2.3.4 [35]. Parameters were set to their default values as advised by Evanno et al. [36]. Ten independent runs were conducted with a burn-in period of 100,000 iterations followed by 100,000 Markov chain Monte Carlo (MCMC) repetitions for each value of K (range 1–10) [16,36,37]. The optimum number of subpopulations (K) was estimated by plotting the estimated likelihood values and the Ln P (D) and calculating the delta (ΔK) model, which was based on the rate of change in the log probability between successive K values developed by Evanno et al. [36]. Structure Harvester [38] (http://taylor0.biology.ucla.edu/struct_harvest/ accessed on 1 September 2021) was used to compare and visualize the likelihood values across multiple values of K for determining the most probable value of K as well as the Q-matrices data. Repeat sampling analysis for a given K was performed by the CLUMPP1.1.2b [39]. The individual and population Q-matrices were computed as the mean overall individual and population Q-matrices after columns were aligned according to the permutation with the greatest H-value. The varieties with membership probabilities greater than or equal to 0.50 were considered to belong to same individual cluster [37,40]. Principal component analysis (PCA) based on SSR markers was conducted using Past 3.26 software [41] to verify the results obtained with STRUCTURE.

2.5. Construction of Primary Core Collection in Tibetan Turnip

Data of morphological traits and SSR molecular markers combined with geographical origins were considered for the primary core collection. The three steps of construction were as executed. (1) Three primary core collections corresponding to different scales were constructed to identify the optimal core collection ratio (10–20%). Based on the dendrogram of clusters, the preferred sampling strategy combined with stepwise clustering was used to construct core collections. (2) The evaluation of the primary core collection. Four evaluation parameters for morphological traits were selected [42], namely, the mean difference percentage (MD), the variance difference percentage (VD), the coincidence rate of range (CR), and the change rate of the variation coefficient (VR), for testing the diversity and representativeness of the primary core collection using SPSS v19.0 (SPSS, Chicago, IL, USA). The formulas for calculating the parameters were as described by Hu et al. [42]. Additionally, the mean values of major allele frequency, the number of alleles (Na), gene diversity, PIC, the effective number of alleles (Ne), the expected heterozygosity (He), the unbiased expected heterozygosity (uHe), and Shannon’s information index (I) between the initial population and the primary core collection based on SSR molecular data were estimated using PowerMarker v3.25 [32] and GenAlex 6.51 [33]. (3) PCA and correlation analyses based on morphological data were used to assess the primary core collection, which effectively eliminated genetic redundancy.

3. Results

3.1. Analysis of Morphological Characteristics

Certain variation degrees were detected among the tested materials. The range of the coefficient of variation was 0–77%. Variations were extremely low (CV = 0,H’ = 0) for traits in cotyledon color, leaf type, leaf wax powder, tuber shoulder shape, leaf vein freshness, leaf vein gloss, germination ability of lateral bud, and bolting ability. Traits on the leaf including leaf shape, leaf surface, leaf color, and leaf fissure showed a relatively high similarity (Table S4). However, other morphological traits like hypocotyl color, scar on tuber shoulder, skin color of tuber shoot, exterior color of above-ground tuber and lateral tuber distribution, cotyledon length, plant breadth, petiole length, single plant weight, tuber weight, fleshy tuber width and length, sepal length, and morphological characteristics of floral organs showed high variations. Plant height, plant breadth, tuber weight, sepal width, petal length, short filament length, anther length, and style length showed relatively high variations and diversity (Table S5 and Figure S1). Variation in the color of the tuber shoot skin was the largest, whereas variations in some of the morphological indices of the leaves were smallest. These results indicated an abundant diversity among the turnip samples. Tibetan turnips showed a higher diversity than the whole population, which was revealed in the larger value of H′ of morphological traits, especially the quantitative traits. The morphological dendrogram based on the clustering method of average connection clearly showed the genetic relationship among turnip varieties. A total of 171 varieties were divided into two large subgroups. The first cluster (I) comprised six varieties from Japan and Europe and 18 from China (mainly from Tibet). The second cluster (II) comprised the rest of the turnip varieties tested (Figure S2). Additionally, 118 turnip varieties from Tibet were clustered into two large subgroups. Varieties from Changdu and the other nine varieties were clustered in subgroup1(I), and the rest were included in subgroup 2 (II; Figure S3). The Wilcoxon rank-sum test showed that the plant height, plant length, plant width, lamina length, lamina width, and petiole thickness were significantly different (p < 0.05, Table S6). Namely, these six aboveground traits were the primary contributors to population clusters.

3.2. Genetic Variation of SSR Markers

In the present study, 161 alleles were produced by 31 polymorphic SSR loci, ranging from 3 to 9 with an average of 5.19 alleles per locus for the genetic characterization of 171 turnip varieties. The obtained values on alleles were higher compared to values in previous studies, indicating the higher allele richness. The length of the amplified fragments was between 100 and 500 bp. A total of 181 amplified fragments were detected, and 163 of them were polymorphic; the polymorphic rate reached 90.1%.
In the whole population, gene diversity ranged from 0.174 (BrSSR-31687) to 0.854 (BrSSR-00001) across the SSR primer pairs with a mean value of 0.561. The polymorphism information content (PIC) value varied from 0.166 (BrSSR-31687) to 0.837 (BrSSR-00001) with a mean PIC value of 0.588 (>0.5). Shannon’s Information Index (I) was between 0.161 (BrSSR-31687) and 0.567 (BrSSR-00005) with an average of 0.340, and unbiased expected heterozygosity (uHe) ranged between 0.095 (BrSSR-31687) and 0.399 (BrSSR-00005) with an average of 0.218 being higher than the expected (He = 0.217).
Among the landraces from Tibet, gene diversity ranged from 0.081 (BrSSR-23195) to 0.949 (BrSSR-00001) with a mean value of 0.600. The PIC value varied from 0.078 (BrSSR-23195) to 0.947 (BrSSR-00001) with a mean PIC value of 0.568 (>0.5). Shannon’s Information Index (I) was between 0.045 (BrSSR-31687) and 0.580 (BrSSR-00001) with an average of 0.345, and unbiased expected heterozygosity (uHe) ranged between 0.023 (BrSSR-31687) and 0.401 (BrSSR-00001) with an average of 0.220 being higher than the expected (He = 0.218). Marker BrSSR-00001 and BrSSR-00005 provided the largest amount of genetic information and the highest Shannon’s information index (Table 1). These results indicated the high genetic variation of turnip varieties.

3.3. Genetic Similarity Coefficient Analysis and UPGMA Cluster Analysis Based on SSR Markers

Wide genetic variations were observed in all the varieties: the genetic distance and the coefficient of genetic similarity (GS) in 171 varieties ranged from 0.12 to 1.00 and 0.73 to 0.95 (data was not shown). For 118 turnip landraces from Tibet, the genetic distance and the GS ranged from 0.12 to 0.93 and 0.72 to 0.93, respectively, suggesting wide genetic variations in each variety from Tibet.
A phylogenetic tree divided the 171 varieties into two subgroups when GS was from 0.73 to 0.732 (Figure S4). The cophenetic correlation coefficient value between the original similarity matrix and the dendrogram was rSSR = 0.65. The first subgroup comprised 28 varieties, including 11% landraces from Tibet, 36% from other provinces of China, and 36% from Japan; the second subgroup comprised 143 varieties, including 89% landraces from Tibet, 64% varieties from Japan, 64% varieties from different provinces of China and all the European, Korean, and Chinese cabbages. Subgroup II with a GS of 0.742 was further divided into two clusters. Similarly, all 118 landraces from Tibet were divided into two major subgroups at a GS of 0.72 to 0.729 (Figure S5). Thirteen varieties mainly from Changdu (six), Xigaze areas (four), and Shannan (two) belonged to subgroup 2, and 105 varieties from various regions of Tibet belonged to subgroup 1 (Figure S6).

3.4. Relationship between Morphological Traits and SSR Markers

Mantel testing revealed that correlations of the similarity coefficient matrices between the morphological traits and SSR markers were very weak (Figure S7, r = –0.04, p = 0.10), confirming the discordance between morphological traits and SSR markers.
Cophenetic correlation values between the original genetic similarity coefficient matrices and the cophenetic value matrices calculated from morphological traits and SSR markers were rMOR = 0.57 and rSSR = 0.65, respectively, indicating a moderate fit for both data. However, the value was up to 0.82 when a combined data of morphological traits and SSR markers was analyzed, which indicates a higher-quality clustering of the combined data. The UPGMA dendrogram separated 171 turnip varieties into two main clusters, I and II, at the similarity coefficient of 0.51, as shown in the morphological and molecular dendrogram (Figure S8). The Wilcoxon rank-sum test showed significant differences in plant length, plant width, the number of leaves, fleshy tuber width, flower length, flower width, sepal length, petal length, petal width, pistil width, cotyledon color, leaf shape, leaf color, the scar on the tuber shoulder, and the cross-section shape of petiole between the two subgroups based on the SSR dendrogram (p < 0.05). Similarly, significant differences in plant width, the number of leaves, leaf shape, leaf color, the exterior color of the above-ground tuber, and the cross-section shape of petiole were also observed between the two subgroups of Tibet landraces (Table S7).

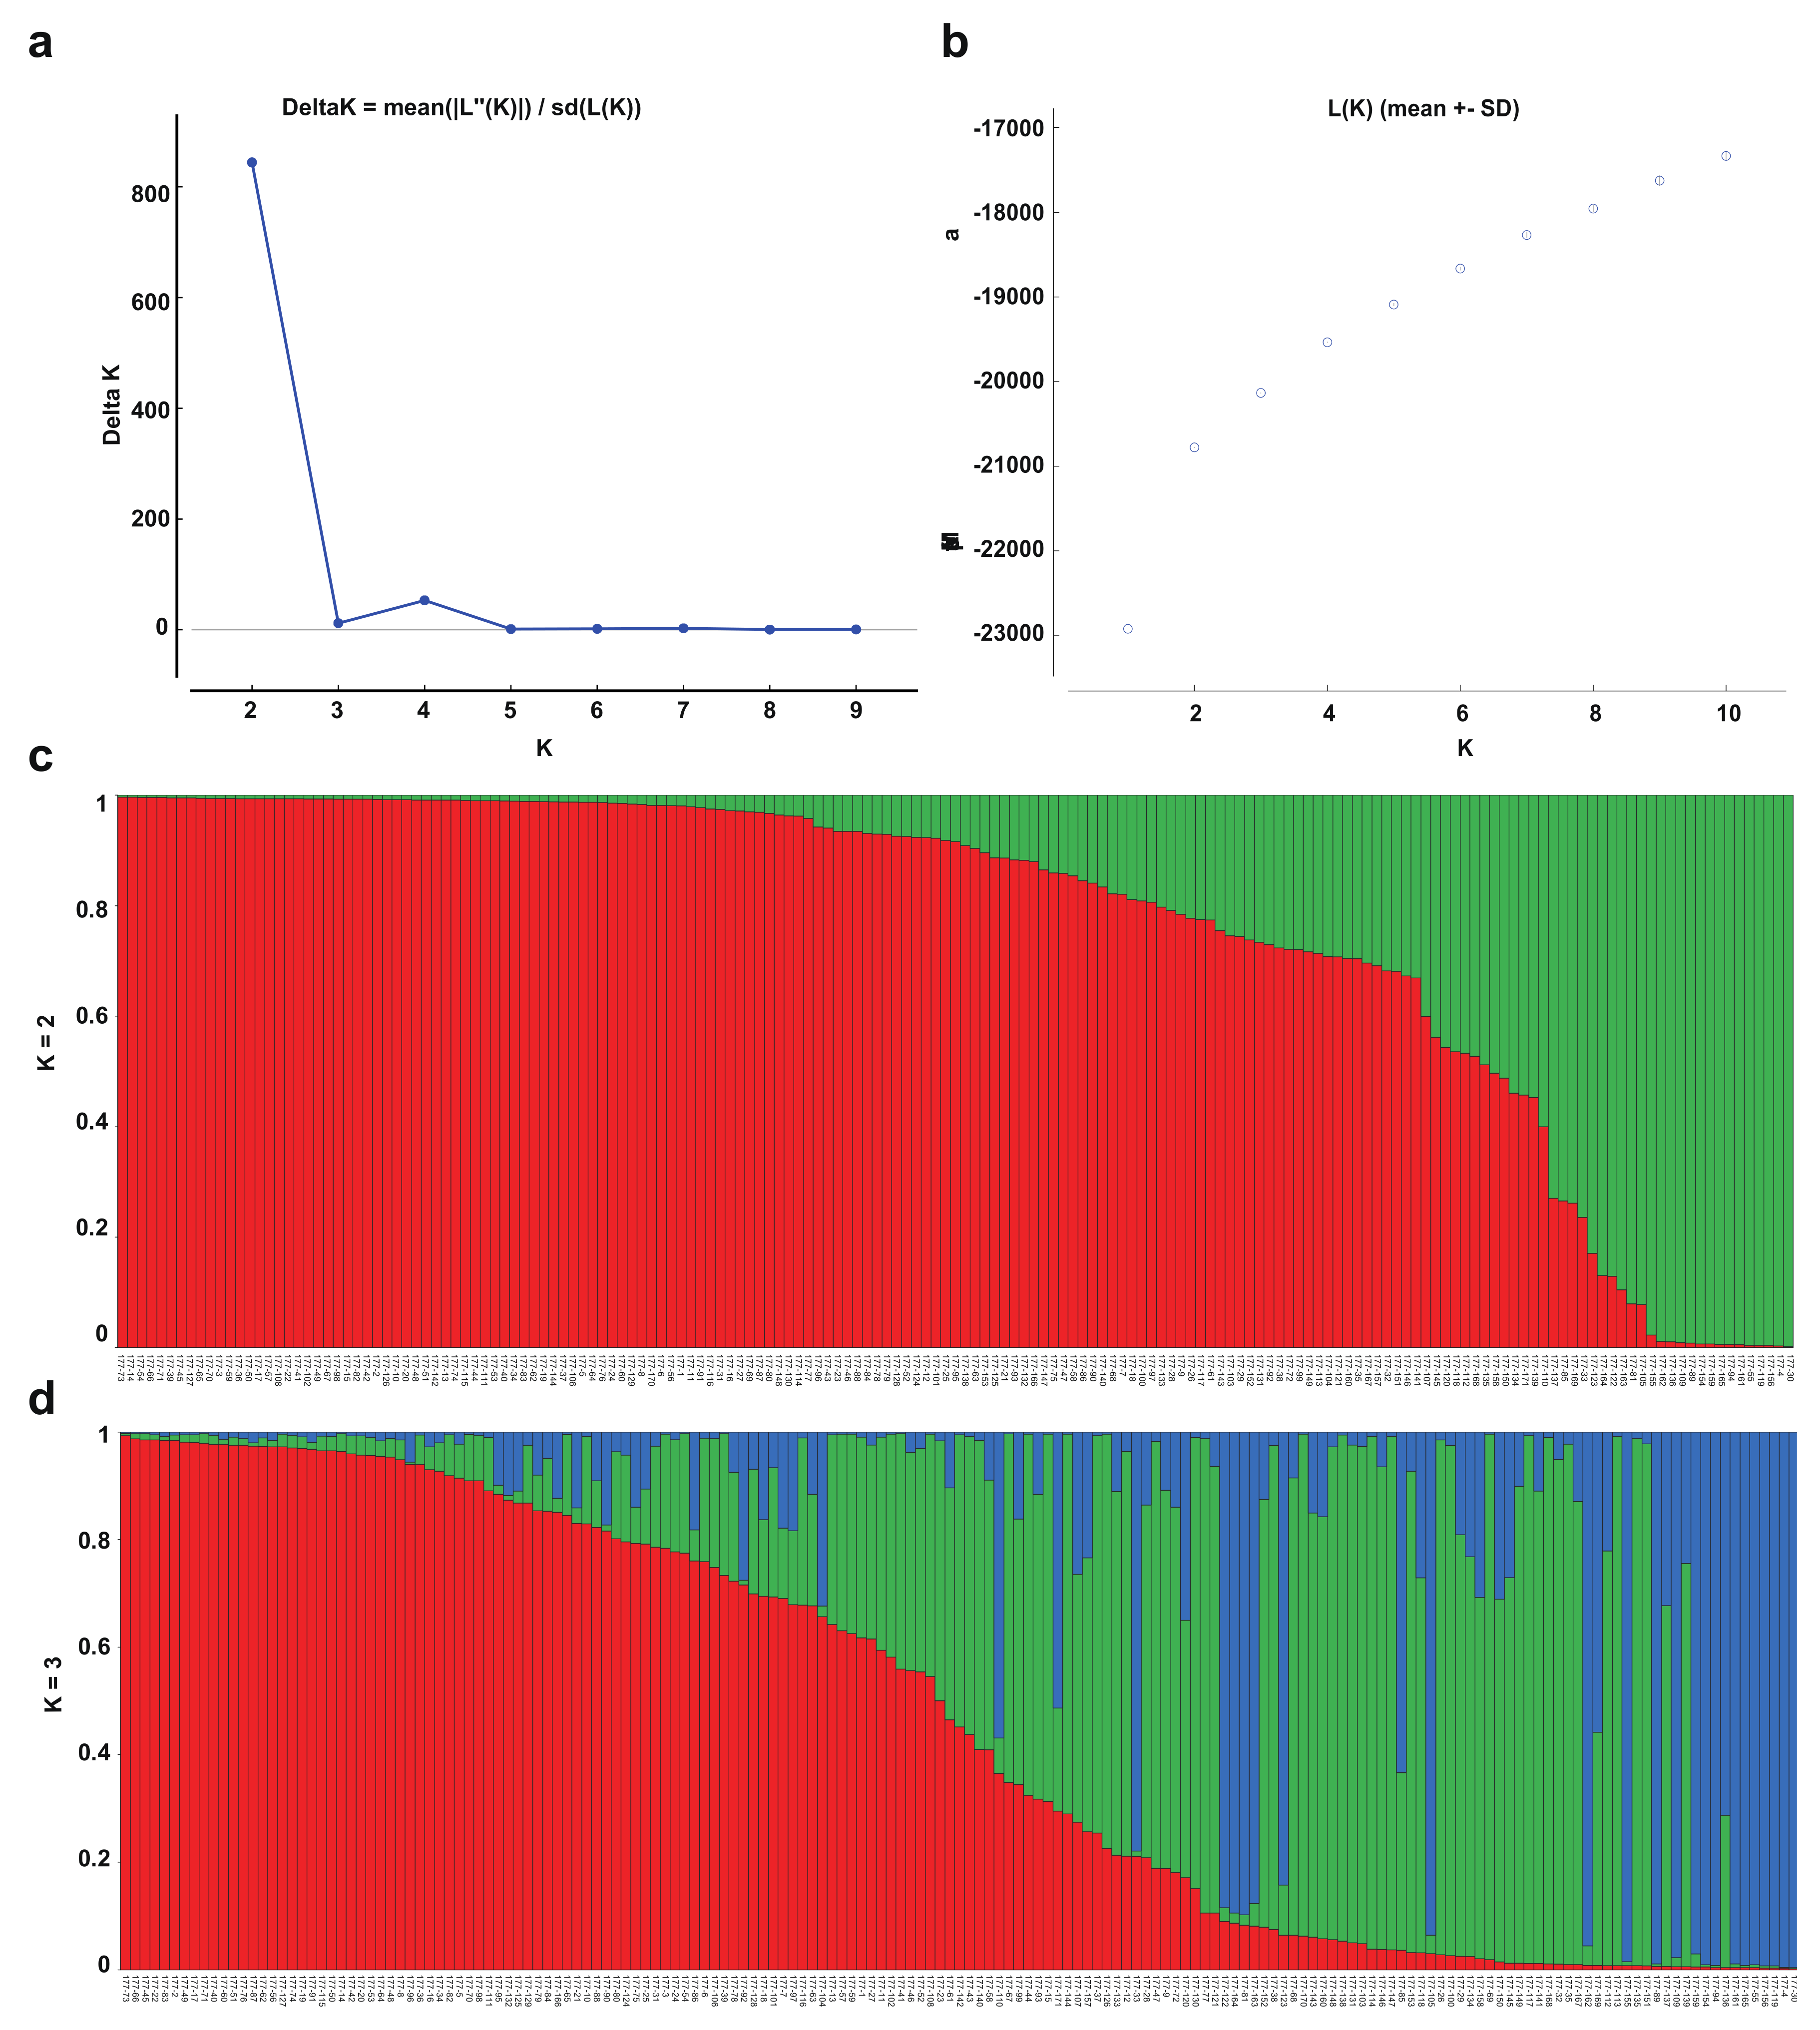
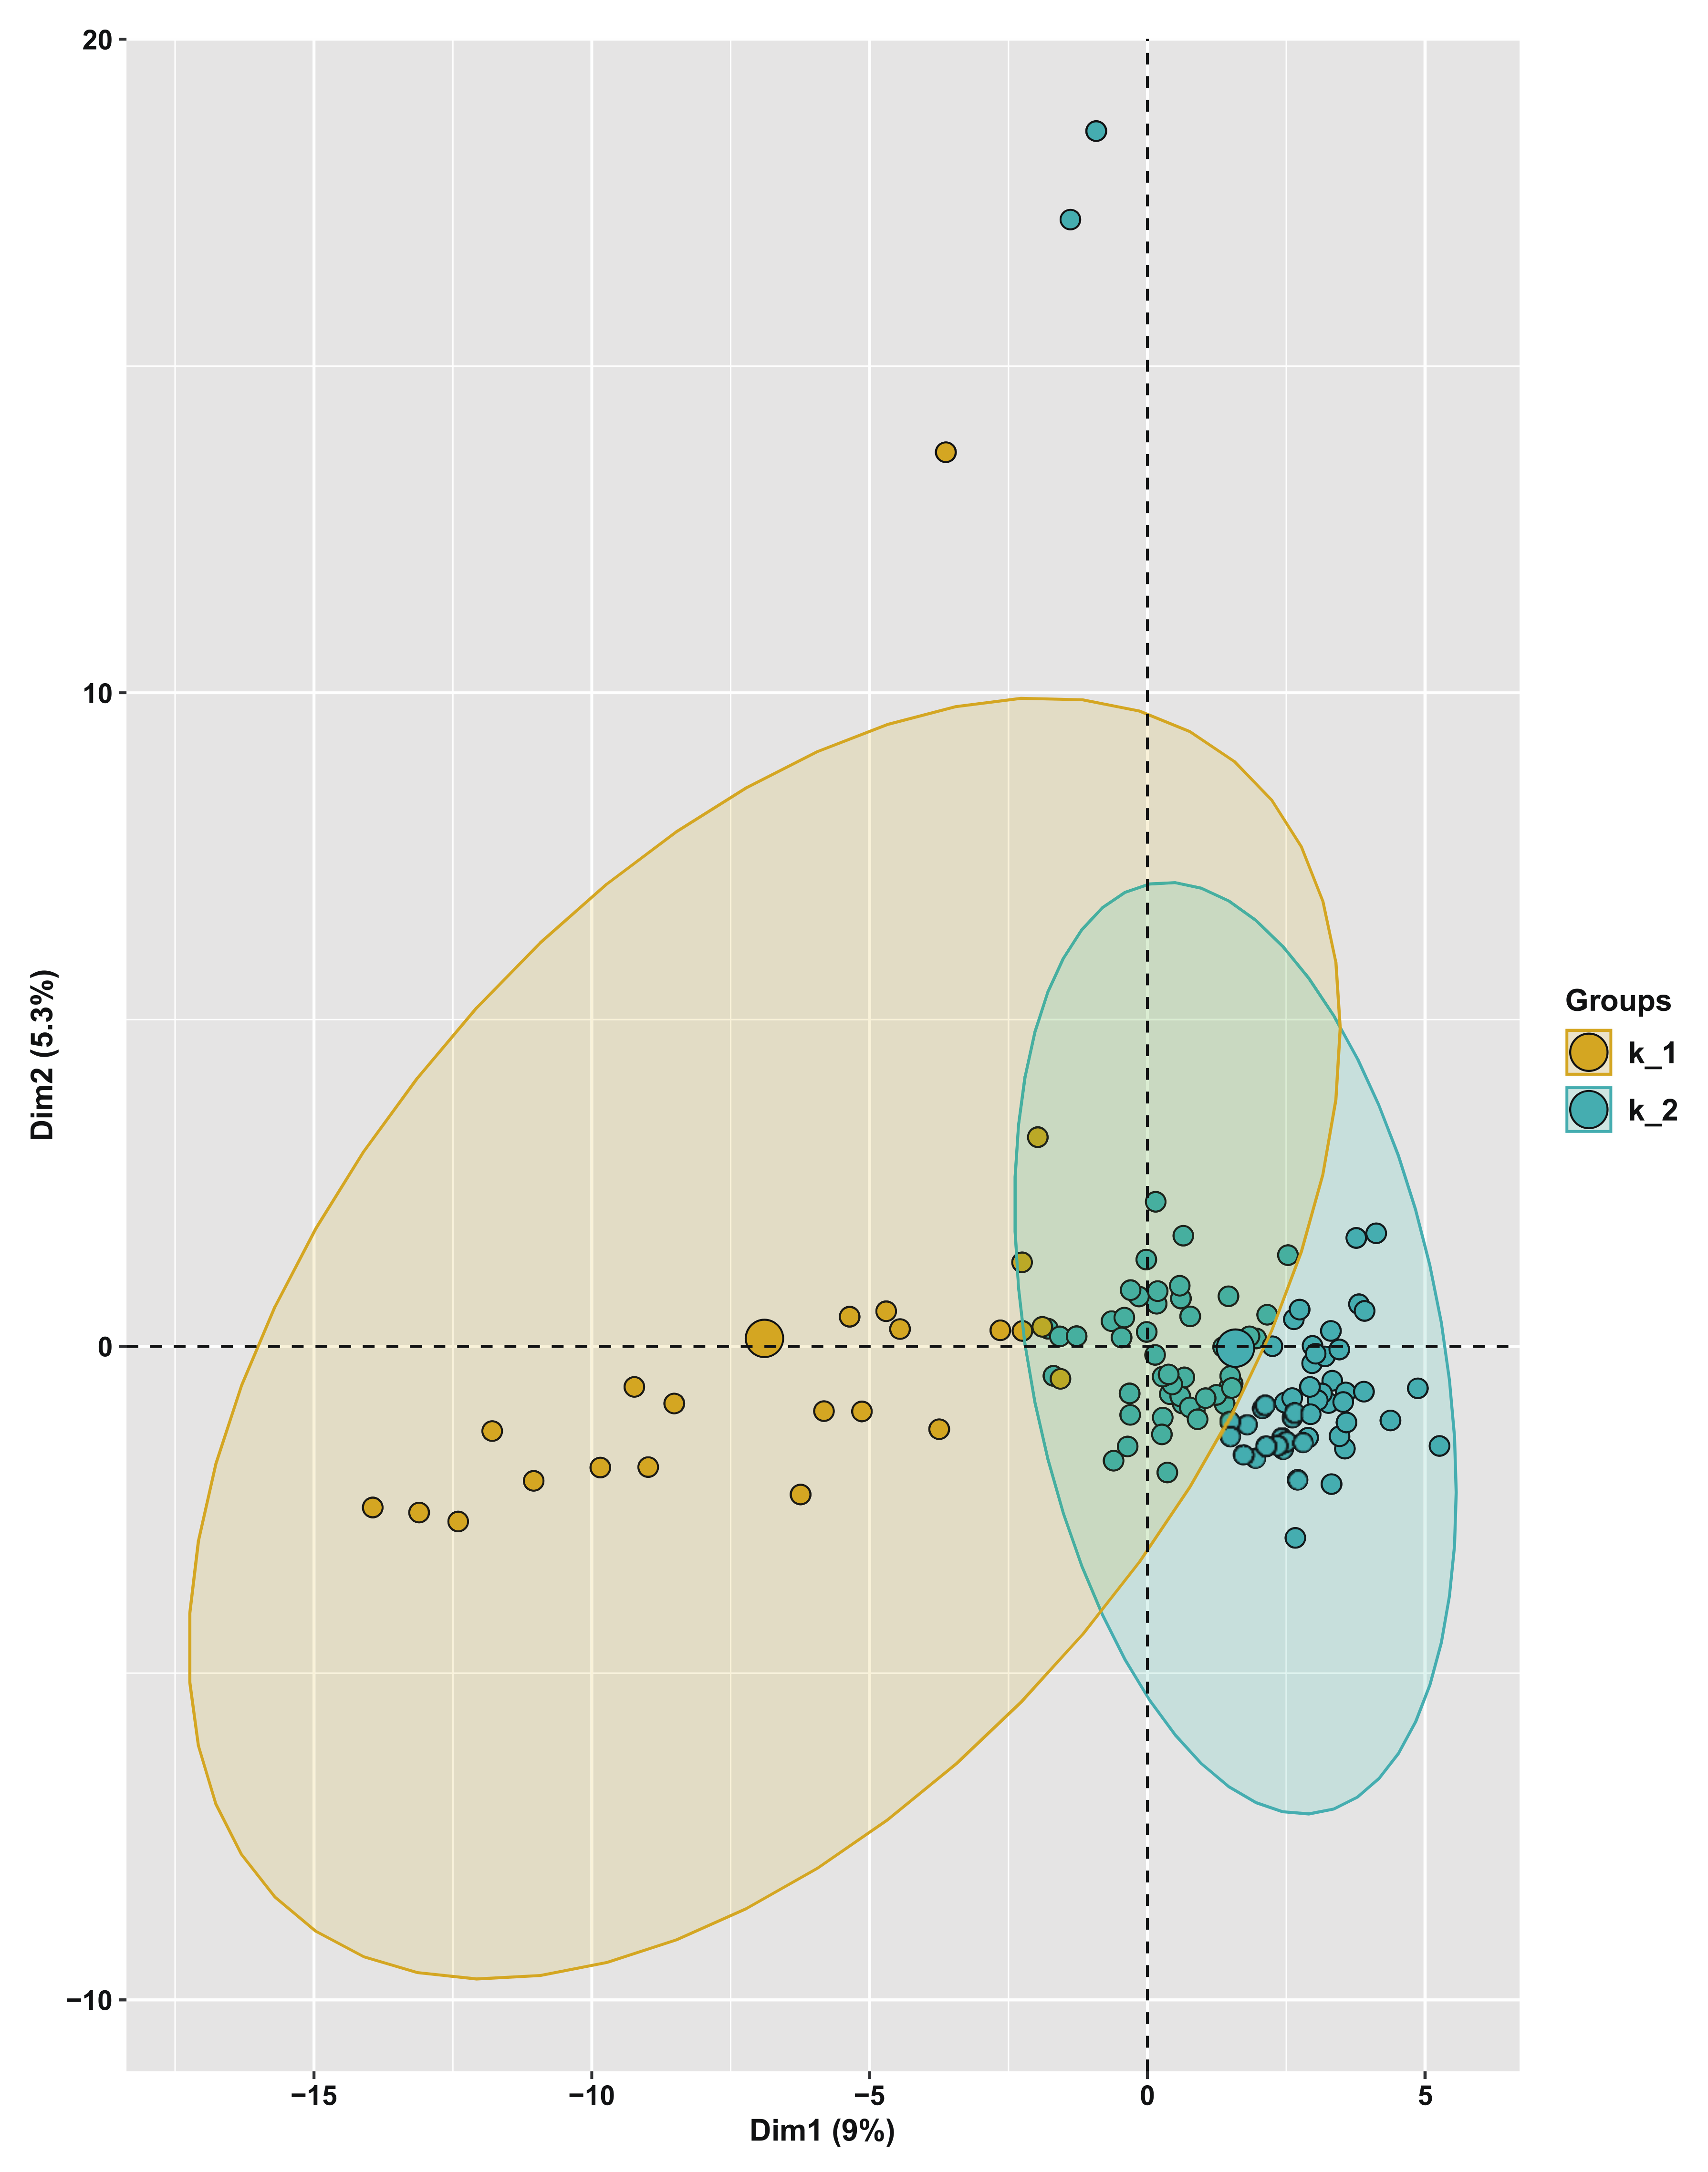
3.5. Population Structure and Principal Component Analysis of the Turnip Germplasm

The genetic structure of the population showed that lnP(D) increased consistently, while the K value increased from 1 to 10. The most apparent change in lnP(D) was observed when K was increased from 2 to 3 (Figure 2a), and a clear peak for ΔK was obtained when K = 2. The optimum number of subpopulations was 2 according to the plot of delta K against K [36] (Figure 2b). Accordingly, the 171 turnip varieties were roughly divided into two major populations, namely, P1 (green color) and P2 (red color), which contained 31 and 140 varieties, respectively (Figure 2c,d) (Q-matrices were not shown). The percentage of genotypes with a membership coefficient ≥90% was 61.99%. A total of 74.85% of genotypes exhibited a membership coefficient ≥80%. P1 was comprised of 11% of the landraces from Tibet, 44% of the varieties from Japan, and 30% of those from other provinces of China. The percentage of genotypes with a membership coefficient ≥80% was 67.74%. P2 contained 89% of the landraces from Tibet, 56% of the varieties from Japan, 70% of the varieties from different provinces of China, and all the European, Korean, and Chinese cabbages (Table S8). The percentage of genotypes with a membership coefficient ≥80% was 76.43%. Additionally, the genetic structure of 118 varieties from Tibet was analyzed separately (Figure S9a–d). The varieties comprised two populations: P1 (green color), which contained 13 varieties and P2 (red color), which contained 105 varieties, which was consistent with the results of the whole population. The percentage of genotypes with a membership coefficient ≥90% and ≥80% was 67.80% and 83.90%, respectively. A total of 76.92% of the genotypes exhibited a membership coefficient ≥80% in P1 and 84.76% in P2. In general, both population structure analysis of 171 varieties and 118 Tibetan landraces demonstrated high accordance with the cluster analysis.
The principal component analysis (PCA) divided 171 turnip varieties into two groups, k_ 1 and k_2 (Figure 3), which were matched to P1 and P2, and their relationship was consistent with the population structure. The main components of PCA 1 and PCA 2 explained 9% and 5.3% of the molecular variations, respectively. Another two clusters for 118 varieties from Tibet also emerged, k_1 and k_2 (Figure S10), which were contained in 13 and 105 landraces and matched to the population structure as well. The main components of PCA 1 and PCA 2 explained 9.1% and 3.6% of the molecular variations, respectively. Results of the PCA corroborated the cluster analysis and the population structure results.

3.6. Construction and Evaluation of the Primary Core Collection in Tibetan Turnip

Three primary core collections including 34, 26, and 19 accessions based on different sampling ratios of 10, 15, and 20 percent were constructed along with the stepwise clustering method. In the 20% collection, 24 were from Tibet, 6 were from abroad, and 4 were from other provinces. In the 15% collection, 18 samples were from Tibet, 6 were from abroad, and 2 were from other provinces of China, except Tibet. In the 10% collection, 12 samples were from Tibet, 5 were from abroad, and 2 were from other provinces. Germplasms with maximum or minimum values of morphological traits were preserved (Table S9).
The primary core collection is considered to be the representative of the initial collection when MD ≤20% and CR ≥80% [42]. The VD, CR, and VR values as well as the strength of the representation of the core collection increased with decreasing MD. In this study, the evaluation parameters of each primary core collection showed that VD and VR based on morphological traits at the sampling ratio of 15% were greater. Additionally, the mean value of Na, gene diversity, PIC, Ne, I, as well as He based on molecular data were all higher than initial populations or other pre-core collections (Table 2). All results indicated that the primary core collection had the best representation when the sampling ratio was 15%. Further, the 15% primary core collection was assessed with PCA based on morphological data. The eigen value, the contribution percentage, and the cumulative contribution percentage of the primary core germplasm were larger than those of the initial population (Table S10). Hence, the 15% primary core collection effectively eliminated genetic redundancy and increased the cumulative contribution percentage.

4. Discussion

Understanding the genetic relationship among the collected Tibetan turnip landraces will be the key for future research on germplasm innovation and breeding cultivars [1]. The combination of phenotypic trait investigation and SSR molecular markers is an essential and complementary method for genetic diversity analysis [17,43]. The precision of identification could be increased by the effective utilization of the associated characters with molecular markers [44]. In the present study, the genetic relationships among 171 turnips varieties were investigated based on morphological traits and SSR markers. All SSR markers displayed a high polymorphic information content (PIC = 0.516). The number of alleles and PIC were higher than previous studies reported on turnips [1,5]. The morphological traits also indicated an abundant diversity among all turnip varieties consistent with previous studies [5]. The clustering maps estimated from 58 morphological traits and 31 SSR markers demonstrated discordance to a certain extent. This was confirmed by the results exhibited by the Mantel test, consistent with earlier studies on other vegetable species [17,45]. Unexpectedly, 31 genetic and 58 morphological markers both showed a moderate-quality clustering, which indicates they were not identifying the varieties well separately. Additionally, the cophenetic correlation values showed a higher-quality clustering when a combined data of morphological traits and SSR markers were analyzed. These results indicated that the SSR markers and morphological traits were unable to replace each other solely to identify the distinctness of turnip varieties, but a combination of morphological traits and molecular markers could improve the precision of accurate identification compared to the separate morphological and molecular data analyses [17]. The reason might be that (i) the SSR markers are designed based on the non-coding DNA regions according to the whole genomic diversity, (ii) morphological traits are the product of synthetic biology and the environment, and only a few select genes cause the extreme morphologies [24]. Results from the Wilcoxon rank-sum test revealed significant differences in some qualitative and quantitative traits, such as plant width, leaf color, the number of leaves, and tuber characteristics between the two subgroups from the molecular-based tree (p < 0.05) (Tables S6 and S7), suggesting that these traits are possibly associated with SSR molecular markers and are worthy of further study.
Previous studies revealed that East Asia, with its ancient and extensive trade routes, is at the center of diversity of B. rapa [2,46]. Results of morphological traits and molecular markers in this study indicated rich genetic diversity among turnip varieties. The higher gene diversity, the larger number of alleles, the abundant PIC, and the wider H′ of morphological traits found in 118 turnip landraces showed that the genetic diversity of Tibetan landraces was higher than the whole population [5]. The values obtained on alleles were higher than the values in previous studies [1]. The genetic distances of 118 turnip landraces (0.121–0.932) featured much higher genetic diversity than the varieties found in Xinjiang “Qamugur” (the local name for turnip in Xinjiang, 0.098–0.160), turnips from different provinces of China (0.187–0.344), and varieties from Nordic areas (0.016–0.146) [1,47]. Moreover, a 15.5% variation in genome size has been observed between the landraces from two high-altitude regions [48]. This result may explain the much higher genetic diversity in Tibetan turnip landraces. These results indicated that landraces often harbor rich diversity that is essential for maintaining local traditional agricultural sustainability [17].
The enormous phenotypic variation was displayed in Brassica species, including heading and tuber-forming morphotypes due to the mesohexaploidization of two Brassica genomes [49]. Various preferences for turnip organs from different regions led to different morphological selections [50]. Unlike most landraces from Tibet with large bulk tubers (Figure S1), turnips from Japan all have ascending rosettes, smaller taproots, and narrow leaves, and turnips from Europe all have long, slender tubers and deep leaf fissures [51]. Previous studies have reported that the thickened part of turnips consists of both a hypocotyl and a root, and this group was one of the oldest groups of cultivated B. rapa [22,52,53]. Europe and Asia are two different independent origin centers of cultivated B. rapa subspecies [2]. In the European center, turnip and turnip rapeseed (oleifera) are the dominant forms, but Chinese turnip rape seed (oleifera) and leafy vegetables like Chinese cabbage, pak choi, and narinosa first originated from China. Subsequently, manifold morphotypes of different B. rapa accessions were derived and evolved separately from these two origin centers [54]. In the present study, the B. rapa ssp. pekinensis (Chinese cabbages) from China and Korea clustered together as neighbors and showed the smallest genetic distance, thus supporting the hypothesis that Chinese cabbage is the ancestor of Korean cabbage. Chinese cabbages were first introduced into ancient Korea during the Ming dynasty (1368 to 1644) and became the main ingredient in kimchi [2,55]. B. rapa ssp. rapa from Europe, B. rapa ssp. pekinensis, and 89% turnip landraces with high diversity from Tibet clustered together, implying a certain genetic relationship between these B. rapa subspecies. The proposed Chinese cabbage (ssp pekinensis) were hybrid from the northern turnip (ssp. rapa), and southern pak choi (ssp. chinensis) found in the wild in China could support this result [55,56]. Previous studies supported that the Mediterranean region, Afghanistan, Pakistan, Transcaucasia, and other Central Asia regions are the origin centers of ssp. rapa [2,16,51,55,57]. Moreover, De Candolle reported that ssp. rapa was cultivated before 2500–2000 B.C., much earlier than being introduced into Eastern Asia during the period after 1000 B.C. Considering these and combining the results of an earlier study [7], these results supported the hypotheses that either Tibet is one of the B. rapa gene centers worldwide [7] or Tibetan turnip was a branch of European turnip with various morphological traits. However, this requires further verification due to the limited sources of European groups and Chinese cabbages employed in this study. Similar to turnips from Tibet, turnips from Japan clustered into two groups, indicating that the turnips from Japan most likely had different origins [51], and Tibetan turnips have also been influenced to a certain degree.
Morphological traits and molecular markers resulted in the division of 171 varieties into two groups consistent with the population structure and the PCA, indicating the underlying relationships among populations with the geographical origin [58]. In previous research, Pradhan et al. assessed the genetic diversity among 180 B. nigra accessions by using SSR markers, revealing that B. nigra (L.) accessions from the same country of origin inclined to cluster together [59]. The genetic diversity of 25 turnips from Tibet, Gao found that their classification was related to the geographical origin [5]. Varieties that originated far apart showed fewer genetic similarities than those from adjoining geographical regions [44]. Furthermore, a similar relationship was also found in many Brassica vegetables [60,61]. However, some studies argued that population clustering could not be performed in accordance with geography but rather that it corresponds to morphotype [62,63,64] and flowering habit over geography [65], which was generally observed in previous studies [2,16]. Still, some have argued that both morphotype and geography contribute to the population structures of B. rapa subspecies and that broad morphological groups, such as oilseed and pak choi, were a primary contributor for population clusters [51]. In the present study, approximately 90% of the landraces from Tibet were clustered together, possibly because they all originated from one geographical region, and genetic exchanges between them or between them and other varieties from other places/origins are limited [16]. However, the 171 varieties were not divided into three large groups following their respective geographical origins. Plant length and width were significantly different whether in morphological or molecular trees. Therefore, we considered that both morphotype and geography contribute to the group classification of B. rapa subspecies, and the morphological traits of groups from the same geographical origin are similar due to the absence of gene communication, natural environment, and morphological selections [66]. In addition, most landraces collected from different regions of Tibet were clustered together (Figure S10), indicating the presence of more accession exchanges and higher purity of landraces that potentially exist in Tibet [5].
Most researchers believe that 10–20% of the sampled scale in vegetable crops should encompass the genetic diversity of the initial population [40,67]. In the present study, we designed an equal scale core set. A minimum number of collections that represent maximum genetic diversity of an entire population is best [68]. Our results showed the primary core collection with a 15% sampling ratio represented the best genetic diversity and genetic variation in the whole population whether based on morphological traits or SSR markers, which is consistent with previous studies [69]. Although most international genetic turnip resources in this study lack detailed geographical origins, the core collection is conducive to be stored and exchanged in the later processes of genetic resources conservation and utilization.

5. Conclusions

Tibetan turnips feature high genetic diversity, and they could be clustered into two subgroups based on morphological traits and SSR markers. Both morphotype and geography could contribute to the group classification of B. rapa subspecies, and a combination of morphological traits and molecular markers could improve the precision of accurate identification compared to the separate morphological and molecular data analyses. The sampling ratio of 15% to most accurately represent the initial population was compared with 10% and 20%. Therefore, when a primary core collection of turnip resources is constructed, a sampling ratio of 15% is recommended for future works. Tibetan turnip resources would greatly benefit from expanded sampling, including more turnip landraces throughout Tibet to construct a comprehensive Tibetan turnip landrace bank and to increase the breeding of seed samples for conserving genetic turnip resources. This study provides a foundation and new insights for research into germplasm innovation and breeding turnip cultivars.

Supplementary Materials

The following are available online at https://www.mdpi.com/article/10.3390/agronomy11101901/s1, Figure S1. Morphological diversity of partial turnip varieties (overground and underground). Codes (177-01~177-171) for varieties found in Table S1. Figure S2. Hierarchical cluster analysis of 171 turnip varieties based on morphological traits. Codes (177-01~177-171) for varieties found in Table S1. I = group 1; II = group 2. Figure S3. Hierarchical cluster analysis of 118 turnip landraces from Tibet based on morphological traits. Codes (177-01~177-171) for varieties found in Table S1. I = group 1; II = group 2. Figure S4. UPGMA dendrogram by cluster analysis of 171 turnip varieties based on SSR markers. Codes (177-01~177-171) for varieties found in Table S1. I = group 1; II = group 2. Figure S5. UPGMA dendrogram by cluster analysis of 118 turnip landraces collected from Tibet based on SSR markers. Codes (177-01~177-171) for varieties found in Table S1. I = group 1; II = group 2. Figure S6. Geographical origin location of landraces from Tibet by cluster analysis based on SSR markers. Figure S7. Comparison of genetic similarity coefficient matrix between morphological traits and SSR markers in turnip varieties by mantel test. Figure S8. UPGMA dendrogram by cluster analysis of 171 turnip varieties using combined morphological traits and SSR markers. Codes (177-01~177-171) for varieties found in Table S1. I = group 1; II = group 2. Figure S9. Population structure of 118 Tibetan turnip landraces based on SSR analysis. Codes (177-01~177-171) for varieties found in Table S1. a: Estimation of the optimum number of groups (K). The sharp peak of △K at K = 2 suggests two subpopulations. b: Graph for the parameter Ln P(D) and number of (K). c: Population structure when K = 2. d: Population structure when K = 3. The proportion of each color indicates the probability of each variety being divided into the corresponding group. Figure S10. Principal component analysis of 118 turnip landraces collected from Tibet. All varieties were aggregated into two groups, k_1 and k_2, matched to population structure. Table S1. Turnip varieties and landraces used in this study, and their geographical origin. Table S2. All morphological traits measured in this study. Table S3. Thirty-one pairs of SSR primers with polymorphism and their basic information. Table S4. Variation analysis of qualitative traits for turnip varieties. Table S5. Variation analysis of quantitative traits in turnip varieties. Table S6. Traits with significant differences between groups based on morphology-tree. Table S7. Traits with significant differences between groups based on dendrogram by SSR. Table S8. Varieties’ structure and their geographical origin in P1 and P2. Table S9. Construction of primary core collection based on different sampling scales. Table S10. Eigen value and cumulative contributive percentage for the initial population and pre-core collection.

Author Contributions

X.Y. and W.G. proposed and designed the research. R.L., F.Z., Y.G., S.Y. and K.Z. performed the experiments. C.L., H.Z. and J.L. performed the statistical analyses and interpretation of the experimental results. R.L. and X.Y. wrote the manuscript. All authors have read and agreed to the published version of the manuscript.

Funding

This work was partially supported by the National Key Research and Development Program of China (grant no. 2016YFD0100204-31), the National Natural Science Foundation of China (grant nos. 31460521 and 31872110), the Breeding Project of the Sci-tech Foundation of Zhejiang Province (grant no. 2016C02051-6-1), the Project of Modern Agriculture in Jiangsu Province (grant no. BE2018310), and the Breeding Project of the Sci-tech Foundation of Zhejiang Province (grant no. 2016C02051-6-1 and 2021C02065).The funding agencies had no role in the design, analysis, and interpretation of the data or in the writing of the manuscript.

Institutional Review Board Statement

Not applicable.

Informed Consent Statement

Not applicable.

Data Availability Statement

The data presented in this study are available on request from the corresponding author.

Acknowledgments

The authors gratefully acknowledge Zhenghong Wang, Huili Li, Iqbal Hussain, and Zhenning Liu for stimulating discussion and critical reading of the manuscript.

Conflicts of Interest

The authors declare that they have no competing financial interests or personal relationships that could have appeared to influence the work reported in this study.

References

  1. Gao, J.; Li, N.; Xuan, Z.; Yang, W. Genetic diversity among "Qamgur" varieties in China revealed by SSR markers. Euphytica 2017, 213, 204. [Google Scholar] [CrossRef]
  2. Zhao, J.J.; Wang, X.W.; Deng, B.; Lou, P.; Wu, J.; Sun, R.F.; Xu, Z.Y.; Vromans, J.; Koornneef, M.; Bonnema, G. Genetic relationships within Brassica rapa as inferred from AFLP fingerprints. Theor. Appl. Genet. 2005, 110, 1301–1314. [Google Scholar] [CrossRef] [PubMed]
  3. Committee of Chinese Herbal Medicine. Chinese Herbal Medicine-Tibetan Medicine; Science&Technology Press of Shanghai: Shanghai, China, 2002; pp. 349–350. [Google Scholar]
  4. Paul, S.; Geng, C.A.; Yang, T.H.; Yang, Y.P.; Chen, J.J. Phytochemical and health-beneficial progress of turnip (Brassica rapa). J. Food Sci. 2019, 84, 19–30. [Google Scholar] [CrossRef] [PubMed] [Green Version]
  5. Gao, Y.; Gong, W.; Li, R.; Zhang, L.; Zhang, Y.; Gao, Y.; Lang, J.; Zhao, K.; Liu, K.; Yu, X. Genetic diversity analysis of Tibetan turnip(Brassica rapa L. ssp. rapifera Matzg) revealed by morphological, physiological, and molecular marker. Genet. Resour. Crop. Evol. 2020, 67, 209–223. [Google Scholar] [CrossRef]
  6. The Investigation Team of the Crop Variety Resources in Tibet. A Collection of Studies on Crop Variety Resources in Tibet; China Agricultural Science and Technology Press: Beijing, China, 1987; p. 146. [Google Scholar]
  7. Wang, J.; Dan, B.; Hu, S.; Tu, J.; Luan, Y.; Xia, M.; Ga, Z.; Nima, Z.; Tang, L. RAPD analysis for the genetic diversity of Brassica rapa in Tibet. Acta Genet. Sin. 2002, 29, 1021–1027. [Google Scholar] [CrossRef]
  8. Choudhary, M.; Ghasal, P.C.; Kumar, S.; Yadav, R.P.; Singh, S.; Meena, V.S.; Bisht, J.K. Conservation Agriculture and Climate Change: An Overview. In Conservation Agriculture: An Approach to Combat Climate Change in Indian Himalaya; Bisht, J.K., Meena, V.S., Mishra, P.K., Pattanayak, A., Eds.; Springer: Singapore, 2016; pp. 1–37. [Google Scholar]
  9. Cao, J.; Qin, L. Germplasm of Horticultural Plants; China Agriculture Press: Beijing, China, 2005; pp. 118–125. [Google Scholar]
  10. Wang, J. Genetic Resources of Rapeseed in Tibet; Science Press of China: Beijing, China, 2009; pp. 1–215. [Google Scholar]
  11. Wang, J.; Luan, Y.; Daci, Z.; Chang, T. Geographical distribution and biological characters of wild rapeseed in Tibet. Chin. J. Oil Crop. Sci. 2006, 28, 134–137. [Google Scholar]
  12. Yao, T.D.; Thompson, L.; Yang, W.; Yu, W.S.; Gao, Y.; Guo, X.J.; Yang, X.X.; Duan, K.Q.; Zhao, H.B.; Xu, B.Q.; et al. Different glacier status with atmospheric circulations in Tibetan Plateau and surroundings. Nat. Clim. Chang. 2012, 2, 663–667. [Google Scholar] [CrossRef]
  13. Wang, X.F.; Li, Y.H.; Chu, B.Y.; Liu, S.R.; Yang, D.; Luan, J.W. Spatiotemporal dynamics and drivingforces of ecosystem changes: A case study of the National Barrier Zone, China. Sustainability 2020, 12, 6680. [Google Scholar] [CrossRef]
  14. Shang, Z.; Gibb, M.J.; Leiber, F.; Ismail, M.; Ding, L.; Guo, X.; Long, R. The sustainable development of grassland-livestock systems on the Tibetan plateau: Problems, strategies and prospects. Rangel. J. 2014, 36, 267–296. [Google Scholar] [CrossRef] [Green Version]
  15. Ramanatha Rao, V.; Hodgkin, T. Genetic diversity and conservation and utilization of plant genetic resources. Plant. Cell Tissue Organ. Cult. 2002, 68, 1–19. [Google Scholar] [CrossRef]
  16. Guo, Y.; Chen, S.; Li, Z.; Cowling, W.A. Center of origin and centers of diversity in an ancient crop, Brassica rapa (turnip rape). J. Hered. 2014, 105, 555–565. [Google Scholar] [CrossRef] [Green Version]
  17. Chikh-Rouhou, H.; Mezghani, N.; Mnasri, S.; Mezghani, N.; Garcés-Claver, A. Assessing the genetic diversity and population structure of a tunisian melon (Cucumis melo L.) collection using phenotypic traits and SSR molecular markers. Agronomy 2021, 11, 1121. [Google Scholar] [CrossRef]
  18. Barabaschi, D.; Tondelli, A.; Desiderio, F.; Volante, A.; Vaccino, P.; Valè, G.; Cattivelli, L. Next generation breeding. Plant Sci. 2016, 242, 3–13. [Google Scholar] [CrossRef]
  19. McGrath, J.M.; Quiros, C.F. Genetic diversity at isozyme and RFLP loci in Brassica campestris as related to crop type and geographical origin. Theor. Appl. Genet. 1992, 83, 783–790. [Google Scholar] [CrossRef] [PubMed]
  20. Gottlieb, L.D. Genetics and Morphological Evolution in Plants. Am. Nat. 1984, 123, 681–709. [Google Scholar] [CrossRef]
  21. Soengas, P.; Cartea, M.E.; Francisco, M.; Lema, M.; Velasco, P. Genetic structure and diversity of a collection of Brassica rapa subsp. rapa L. revealed by simple sequence repeat markers. J. Agric. Sci. 2011, 149, 617–624. [Google Scholar] [CrossRef] [Green Version]
  22. Zhang, N.W.; Zhao, J.J.; Lens, F.; de Visser, J.; Menamo, T.; Fang, W.; Xiao, D.; Bucher, J.; Basnet, R.K.; Lin, K.; et al. Morphology, carbohydrate composition and vernalization response in a genetically diverse collection of Asian and European turnips (Brassica rapa subsp rapa). PLoS ONE 2014, 9, e114241. [Google Scholar] [CrossRef] [Green Version]
  23. Cheng, F.; Wu, J.; Cai, C.C.; Fu, L.X.; Liang, J.L.; Borm, T.; Zhuang, M.; Zhang, Y.Y.; Zhang, F.L.; Bonnema, G.; et al. Genome resequencing and comparative variome analysis in a Brassica rapa and Brassica oleracea collection. Sci. Data 2016, 3, 160119. [Google Scholar] [CrossRef] [PubMed] [Green Version]
  24. Ammar, I.B.; Sonnante, G.; Dridi, B.A. Genetic variability in wild cardoon (Cynara cardunculus L. var. sylvestris) revealed by SSR markers and morphological traits. Sci. Hortic. 2015, 185, 76–81. [Google Scholar] [CrossRef]
  25. Meng, F.J.; Liu, L.; Peng, M.; Wang, Z.K.; Wang, C.; Zhao, Y.Y. Genetic diversity and population structure analysis in wild strawberry (Fragaria nubicola L.) from Motuo in Tibet Plateau based on simple sequence repeats (SSRs). Biochem. Syst. Ecol. 2015, 63, 113–118. [Google Scholar] [CrossRef]
  26. Li, X.; Shen, D. Descriptors and Data Standard for Root and Stem Mustard (Brassica Juncea Coss.); Chinese Agricultural Press: Beijing, China, 2008; pp. 1–82. [Google Scholar]
  27. Wang, S.; Cao, Y.; Redden, R.; Hu, J.; Usher, T. The morphological diversity and classification of adzuki bean [Vigna angularis (Willd.) Ohwi & Ohashi] germplasm resources in China. Acta Agron. Sin. 2002, 28, 727–733. [Google Scholar]
  28. Kabelka, E.; Franchino, B.; Francis, D.M. Two loci from Lycopersicon hirsutum LA407 confer resistance to strains of Clavibacter michiganensis subsp. michiganensis. Phytopathology 2002, 92, 504–510. [Google Scholar] [CrossRef] [Green Version]
  29. Wang, F. Study of resistant inheritance and SSR molecular marker for clubroot in turnip. Master’s Thesis, Zhejiang University, Hangzhou, China, 2012. [Google Scholar]
  30. Wang, X.; Wang, H.; Wang, J.; Sun, R.; Wu, J.; Liu, S.; Bai, Y.; Mun, J.-H.; Bancroft, I.; Cheng, F.; et al. The Brassica rapa Genome Sequencing Project, C. The genome of the mesopolyploid crop species Brassica rapa. Nat. Genet. 2011, 43, 1035–1039. [Google Scholar] [CrossRef] [Green Version]
  31. Byun, S.O.; Fang, Q.; Zhou, H.; Hickford, J.G. An effective method for silver-staining DNA in large numbers of polyacrylamide gels. Anal. Biochem. 2009, 385, 174–175. [Google Scholar] [CrossRef] [PubMed]
  32. Liu, K.; Muse, S. PowerMarker: New genetic data analysis software. Version 3.23. Bioinformatics 2005, 21, 2128–2129. [Google Scholar] [CrossRef] [Green Version]
  33. Peakall, R.; Smouse, P.E. GenAlEx 6.5: Genetic analysis in Excel. Population genetic software for teaching and research—An update. Bioinformatics 2012, 28, 2537–2539. [Google Scholar] [CrossRef] [PubMed] [Green Version]
  34. Chen, C.; Chu, Y.G.; Ding, C.J.; Su, X.H.; Huang, Q.J. Genetic diversity and population structure of black cottonwood (Populus deltoides) revealed using simple sequence repeat markers. BMC Genet. 2020, 21, 2. [Google Scholar] [CrossRef] [PubMed] [Green Version]
  35. Pritchard, J.K.; Stephens, M.; Donnelly, P. Inference of population structure using multilocus genotype data. Genetics 2000, 155, 945–959. [Google Scholar] [CrossRef]
  36. Evanno, G.; Regnaut, S.; Goudet, J. Detecting the number of clusters of individuals using the software STRUCTURE: A simulation study. Mol. Ecol. 2005, 14, 2611–2620. [Google Scholar] [CrossRef] [Green Version]
  37. Brbaklić, L.; Trkulja, D.; Mikić, S.; Mirosavljević, M.; Momčilović, V.; Dudić, B.; Procházková, L.; Aćin, V. Genetic diversity and population structure of serbian barley (Hordeum vulgare L.) collection during a 40-year long breeding period. Agronomy 2021, 11, 118. [Google Scholar] [CrossRef]
  38. Earl, D.A.; Vonholdt, B.M. STRUCTURE HARVESTER: A website and program for visualizing STRUCTURE output and implementing the Evanno method. Conserv. Genet. Resour. 2012, 4, 359–361. [Google Scholar] [CrossRef]
  39. Jakobsson, M.; Rosenberg, N.A. CLUMPP: A cluster matching and permutation program for dealing with label switching and multimodality in analysis of population structure. Bioinformatics 2007, 23, 1801–1806. [Google Scholar] [CrossRef] [Green Version]
  40. Xu, C.; Gao, J.; Du, Z.; Li, D.; Wang, Z.; Li, Y.; Pang, X. Identifying the genetic diversity, genetic structure and a core collection of Ziziphus jujuba Mill. var. jujuba accessions using microsatellite markers. Sci. Rep. 2016, 6, 31503. [Google Scholar] [CrossRef]
  41. Hammer, Ø.; Harper, D.A.T.; Ryan, P.D. PAST: Paleontological statistics software package for education and data analysis. Palaeontol. Electron. 2001, 4, 1–9. [Google Scholar]
  42. Hu, J.; Zhu, J.; Xu, H.M. Methods of constructing core collections by stepwise clustering with three sampling strategies based on the genotypic values of crops. Theor. Appl. Genet. 2000, 101, 264–268. [Google Scholar] [CrossRef]
  43. Zhou, R.; Wu, Z.; Cao, X.; Jiang, F.L. Genetic diversity of cultivated and wild tomato revealed by morphological traits and SSR markers. Genet. Mol. Res. 2015, 14, 13868–13879. [Google Scholar] [CrossRef] [PubMed]
  44. Keneni, G.; Bekele, E.; Imtiaz, M.; Dagne, K.; Getu, E.; Assefa, F. Genetic diversity and population structure of ethiopian chickpea (Cicer arietinum L.) germplasm accessions from different geographical origins as revealed by microsatellite markers. Plant. Mol. Biol. Rep. 2012, 30, 654–665. [Google Scholar] [CrossRef]
  45. Nkhoma, N.; Shimelis, H.; Laing, M.D.; Shayanowako, A.; Mathew, I. Assessing the genetic diversity of cowpea (Vignaun guiculata L. Walp.) germplasm collections using phenotypic traits and SNP markers. BMC Genet. 2020, 21, 110. [Google Scholar] [CrossRef]
  46. Song, K.; Osborn, T.C.; Williams, P.H. Brassica taxonomy based on nuclear restriction fragment length polymorphisms (RFLPs) 3. Genome relationships in Brassica and related genera and the origin of B. oleracea and B. rapa (syn. Campestris). Theor. Appl. Genet. 1990, 79, 497–506. [Google Scholar] [CrossRef] [PubMed]
  47. Persson, K.; Fält, A.S.; Bothmer, R. Genetic diversity of allozymes in Turnip (Brassica rapa L. var. rapa) from the Nordic Area. Hereditas 2001, 134, 43–52. [Google Scholar] [CrossRef] [PubMed]
  48. Basak, S.; Wang, G.; Sun, X.; Yang, Y. Variations in genome size of turnip landraces from two high-altitude environments. J. Am. Soc. Hort. Sci 2018, 143, 136–143. [Google Scholar] [CrossRef]
  49. Cheng, F.; Sun, R.F.; Hou, X.L.; Zheng, H.K.; Zhang, F.L.; Zhang, Y.Y.; Liu, B.; Liang, J.L.; Zhuang, M.; Liu, Y.X.; et al. Subgenome parallel selection is associated with morphotype diversification and convergent crop domestication in Brassica rapa and Brassica oleracea. Nat. Genet. 2016, 48, 1218–1224. [Google Scholar] [CrossRef] [PubMed]
  50. McAlvay, A.C.; Ragsdale, A.P.; Mabry, M.E.; Qi, X.; Bird, K.A.; Velasco, P.; An, H.; Pires, J.C.; Emshwiller, E. Brassica rapa domestication: Untangling wild and feral forms and convergence of crop morphotypes. Mol. Biol. Evol. 2021, 38, 3358–3372. [Google Scholar] [CrossRef]
  51. Bird, K.A.; An, H.; Gazave, E.; Gore, M.A.; Pires, J.C.; Robertson, L.D.; Labate, J.A. Population structure and phylogenetic relationships in a diverse panel of Brassica rapa L. Front. Plant. Sci. 2017, 8, 321. [Google Scholar] [CrossRef] [Green Version]
  52. Takahashi, H.; Kimura, M.; Suge, H.; Saito, T. Interactions between vernalization and photoperiod on the flowering and bolting of different turnip varieties. J. Jpn. Soc. Hortic. Sci. 1994, 63, 99–108. [Google Scholar] [CrossRef] [Green Version]
  53. Vogl-Lukasser, B.; Vogl, C.R.; Reiner, H. The turnip (Brassica rapa L. subsp. rapa ) in Eastern Tyrol (Lienz district; Austria). Ethnobot. Res. Appl. 2007, 5, 305–317. [Google Scholar] [CrossRef] [Green Version]
  54. Reiner, H.; Holzner, W.; Ebermann, R. The development of turnip-type and oilseed-type Brassica rapa crops from the wild type in Europe. An overview of botanical, historical and linguistic facts. In Proceedings of the Rapeseed today and tomorrow, 9th International Rapeseed Congress, Cambridge, UK, 4–7 July 1995; pp. 1066–1069. [Google Scholar]
  55. Zhao, J. Genetic dissection of important agronomic traits in Brassica rapa. Ph.D. Thesis, Chinese Academy of Agricultural Science, Beijing, China, 2005. [Google Scholar]
  56. Tan, C. The origin, distribution and evolution of the cultivars of Chinese head cabbage (B. compestris ssp. pekinensis). Sci. Agric. Sin. 1979, 12, 68–75. [Google Scholar]
  57. Takahashi, Y.; Yokoi, S.; Takahata, Y. Genetic divergence of turnip (Brassica rapa L. em. Metzg. subsp. rapa) inferred from simple sequence repeats in chloroplast and nuclear genomes and morphology. Genet. Resour. Crop. Evol. 2016, 63, 869–879. [Google Scholar] [CrossRef]
  58. Yang, X.; Su, W.; Wang, L.; Lei, J.; Chai, S.; Liu, Q. Molecular diversity and genetic structure of 380 sweetpotato accessions as revealed by SSR markers. J. Integr. Agric. 2015, 14, 633–641. [Google Scholar] [CrossRef]
  59. Pradhan, A.; Nelson, M.N.; Plummer, J.A.; Cowling, W.A.; Yan, G.J. Characterization of Brassica nigra collections using simple sequence repeat markers reveals distinct groups associated with geographical location, and frequent mislabelling of species identity. Genome 2011, 54, 50–63. [Google Scholar] [CrossRef] [PubMed]
  60. Sanchez-Yelamo, M.D.; Zumel, L.I. Correlation between the diversity of Brassica montana (Brassicaceae) populations and its geographic distribution in the NE Iberian Peninsula evaluated from enzymatic profiles of samples as a whole. J. Biol. Res. Thessalon 2013, 20, 243–258. [Google Scholar]
  61. Zamani-Nour, S.; Clemens, R.; Mollers, C. Cytoplasmic diversity of Brassica napus L., Brassica oleracea L. and Brassica rapa L. as determined by chloroplast microsatellite markers. Genet. Resour. Crop. Evol. 2013, 60, 953–965. [Google Scholar] [CrossRef] [Green Version]
  62. Del Carpio, D.P.; Basnet, R.K.; De Vos, R.C.H.; Maliepaard, C.; Visser, R.; Bonnema, G. The patterns of population differentiation in a Brassica rapa core collection. Theor. Appl. Genet. 2011, 122, 1105–1118. [Google Scholar] [CrossRef] [Green Version]
  63. Zhao, J.; Paulo, M.J.; Jamar, D.; Lou, P.; van Eeuwijk, F.; Bonnema, G.; Vreugdenhil, D.; Koornneef, M. Association mapping of leaf traits, flowering time, and phytate content in Brassica rapa. Genome 2007, 50, 963–973. [Google Scholar] [CrossRef] [Green Version]
  64. Zhao, J.J.; Artemyeva, A.; Del Carpio, D.P.; Basnet, R.K.; Zhang, N.W.; Gao, J.; Li, F.; Bucher, J.; Wang, X.W.; Visser, R.G.F.; et al. Design of a Brassica rapa core collection for association mapping studies. Genome 2010, 53, 884–898. [Google Scholar] [CrossRef]
  65. Tanhuanpää, P.; Erkkila, M.; Tenhola-Roininen, T.; Tanskanen, J.; Manninen, O. SNP diversity within and among Brassica rapa accessions reveals no geographic differentiation. Genome 2016, 59, 11–21. [Google Scholar] [CrossRef] [PubMed] [Green Version]
  66. Zeuli, P.L.S.; Qualset, C.O. Geographical diversity for quantitative spike characters in a world collection of durum wheat. Crop. Sci. 1987, 27, 235–241. [Google Scholar] [CrossRef]
  67. Miao, L.; Wang, S.; Zou, M.; Li, J.; Kong, L.; Yu, X. Review of the studies on core collection for horticultuala crops. J. Plant. Genet. Resour. 2016, 17, 791–800. [Google Scholar] [CrossRef]
  68. Brown, A.H.D. Core colection: A practical approach to genetic resources management. Genome 1989, 31, 818–824. [Google Scholar] [CrossRef]
  69. Li, G.; Li, X.; Shen, D.; Wang, H.; Song, J.; Qiu, Y. Studies on the methods of constructing Chinese cabbage core germplasm based on the morphological data. Acta Hortic. Sin. 2008, 35, 1759–1766. [Google Scholar] [CrossRef]
Figure 1. Geographical origin of all varieties in Tibet and China. ((A) Tibet. (B) China).
Agronomy 11 01901 g001
Figure 2. Population structure of 171 turnip varieties based on SSR analysis. Codes (177-01~177-171) for varieties found in Table S1. (a) Estimation of the optimum number of groups (K). The sharp peak of ΔK at K = 2 suggests two subpopulations. (b) Graph for the parameter LnP (D) and each value of (K). (c) Population structure when K = 2. (d) Population structure when K = 3. The proportion of each color indicates the probability of each variety being divided into the corresponding group.
Agronomy 11 01901 g002
Figure 3. Principal component analysis of 171 turnip germplasm varieties based on SSR markers. All varieties were aggregated into two groups, k_1 and k_2, matched to the population structure.
Agronomy 11 01901 g003
Table 1. Genetic diversity information list of 31 SSR primers used in the study.
The Whole Collection Collection from Tibet
No.MarkerSample SizeMajor. Allele. FrquencyNo. Allele (Na)Gene DiversityPICBand Freq.NeIHeuHeSample SizeMajor. Allele. FrquencyNo. Allele (Na)Gene DiversityPICBand Freq.NeIHeuHe
1SSR-000011710.211 90.854 0.837 0.472 1.561 0.521 0.344 0.345 118 0.102 33 0.949 0.947 0.515 1.709 0.580 0.398 0.401
2SSR-000051710.620 50.573 0.539 0.642 1.763 0.567 0.398 0.399 118 0.678 5 0.505 0.472 0.641 1.414 0.440 0.277 0.280
3SSR-000331710.357 60.735 0.689 0.338 1.344 0.364 0.225 0.226 118 0.297 11 0.806 0.780 0.345 1.445 0.428 0.273 0.276
4SSR-001601710.538 40.632 0.583 0.350 1.408 0.425 0.265 0.266 118 0.339 9 0.798 0.772 0.364 1.529 0.513 0.334 0.337
5SSR-002011710.491 60.645 0.586 0.338 1.466 0.406 0.271 0.272 118 0.339 12 0.759 0.724 0.360 1.569 0.458 0.312 0.315
6SSR-002071710.409 60.725 0.682 0.401 1.496 0.467 0.300 0.301 118 0.407 10 0.776 0.754 0.422 1.512 0.514 0.333 0.336
7SSR-068401710.637 30.508 0.438 0.599 1.519 0.512 0.333 0.334 118 0.636 3 0.503 0.428 0.614 1.430 0.428 0.272 0.274
8SSR-000741710.801 50.338 0.312 0.443 1.411 0.341 0.229 0.230 118 0.822 4 0.305 0.278 0.447 1.120 0.158 0.091 0.091
9SSR-000891710.298 70.776 0.741 0.373 1.509 0.467 0.306 0.307 118 0.195 23 0.895 0.887 0.397 1.714 0.570 0.392 0.395
10SSR-231951710.901 30.182 0.171 0.312 1.236 0.218 0.142 0.142 118 0.958 2 0.081 0.0780.319 1.029 0.058 0.027 0.027
11SSR-001061710.731 50.410 0.351 0.167 1.217 0.183 0.116 0.117 118 0.771 5 0.367 0.321 0.175 1.119 0.162 0.089 0.090
12SSR-192221710.462 50.628 0.555 0.286 1.367 0.361 0.227 0.228 118 0.390 8 0.687 0.634 0.329 1.497 0.450 0.293 0.296
13SSR-252461710.503 60.671 0.630 0.317 1.437 0.381 0.248 0.248 118 0.551 15 0.659 0.636 0.345 1.417 0.422 0.266 0.268
14SSR-243471710.398 40.697 0.641 0.198 1.261 0.285 0.173 0.174 118 0.280 8 0.793 0.763 0.242 1.469 0.409 0.265 0.267
15SSR-282371710.509 40.633 0.571 0.173 1.199 0.229 0.131 0.131 118 0.492 7 0.685 0.647 0.199 1.241 0.309 0.180 0.181
16SSR-391051710.515 40.559 0.464 0.112 1.147 0.170 0.099 0.099 118 0.449 5 0.607 0.528 0.127 1.250 0.228 0.144 0.146
17SSR-396941710.333 70.780 0.748 0.281 1.374 0.388 0.242 0.243 118 0.271 20 0.856 0.842 0.312 1.593 0.513 0.341 0.344
18SSR-169821710.667 40.500 0.450 0.336 1.447 0.374 0.244 0.245 118 0.746 4 0.406 0.364 0.353 1.263 0.332 0.194 0.195
19SSR-001221710.327 70.755 0.717 0.313 1.335 0.350 0.216 0.217 118 0.220 17 0.893 0.884 0.339 1.422 0.416 0.265 0.267
20SSR-001521710.895 30.191 0.176 0.310 1.254 0.229 0.149 0.150 118 0.898 3 0.186 0.174 0.316 1.084 0.154 0.074 0.075
21SSR-002081710.789 40.345 0.306 0.218 1.249 0.202 0.133 0.134 118 0.780 5 0.363 0.327 0.225 1.133 0.188 0.103 0.104
22SSR-368021710.737 40.419 0.378 0.326 1.266 0.311 0.186 0.187 118 0.737 4 0.418 0.376 0.333 1.258 0.318 0.188 0.190
23SSR-438141710.497 40.633 0.570 0.208 1.196 0.247 0.141 0.142 118 0.432 9 0.718 0.679 0.225 1.276 0.309 0.189 0.190
24SSR-002781710.474 80.693 0.653 0.402 1.517 0.447 0.298 0.299 118 0.415 16 0.774 0.753 0.418 1.401 0.385 0.250 0.252
25SSR-290611710.351 50.694 0.632 0.507 1.446 0.415 0.270 0.271 118 0.390 5 0.690 0.629 0.487 1.394 0.366 0.236 0.238
26SSR-166261710.491 50.607 0.530 0.367 1.394 0.347 0.229 0.230 118 0.508 4 0.570 0.480 0.362 1.295 0.253 0.164 0.166
27SSR-197521710.532 50.625 0.568 0.254 1.298 0.321 0.197 0.198 118 0.339 13 0.797 0.772 0.268 1.426 0.395 0.257 0.259
28SSR-374061710.713 80.475 0.459 0.210 1.175 0.245 0.135 0.135 118 0.619 13 0.595 0.578 0.248 1.326 0.371 0.226 0.228
29SSR-366421710.596 60.557 0.493 0.181 1.130 0.178 0.098 0.098 118 0.585 13 0.605 0.568 0.185 1.152 0.200 0.110 0.111
30SSR-316871710.906 40.174 0.1660.200 1.1480.161 0.095 0.095 118 0.941 2 0.112 0.105 0.188 1.025 0.045 0.022 0.023
31SSR-064091710.784 50.373 0.357 0.542 1.522 0.437 0.293 0.293 118 0.746 12 0.433 0.422 0.534 1.276 0.339 0.201 0.202
Min0.211 3 0.174 0.166 0.112 1.130 0.161 0.095 0.095 0.102 2 0.081 0.078 0.127 1.025 0.045 0.022 0.023
Max0.906 9 0.854 0.837 0.642 1.763 0.567 0.398 0.399 0.958 33 0.949 0.947 0.641 1.714 0.580 0.398 0.401
Mean0.564 5.194 0.561 0.516 0.328 1.358 0.340 0.217 0.218 0.527 9.677 0.600 0.568 0.343 1.348 0.345 0.218 0.220
Total17.474 161 17.385 15.993 10.176 42.092 10.549 6.735 6.755 16.331 300 18.591 17.601 10.634 41.788 10.710 6.767 6.825
Na = no. of different alleles; Ne = no. of effective alleles = 1/(p^2 + q^2); I = Shannon’s information index = −1* (p * Ln (p) + q * Ln(q)); He = expected heterozygosity = 2 * p * q; uHe = unbiased expected heterozygosity = (2N/(2N-1)) * He. no. allele = number of alleles; PIC = polymorphic information content (PIC).
Table 2. Evaluation parameters of each primary core collection.
Sampling ScaleInitial
Population
20% Pre-Core Collection15% Pre-Core Collection10% Pre-Core Collection
Evaluation Parameters
N171342619
Morphological traitsMD (%)-486
VD (%)-688
CR (%)-818073
VR (%)-102.01103.71102.52
SSR markersMajor allele frequency0.564 0.505 0.504 0.504
No. allele (Na)5.194 7.194 6.419 5.677
Gene diversity0.561 0.630 0.634 0.634
PIC0.516 0.598 0.598 0.593
Ne1.357 1.374 1.378 1.368
I0.343 0.360 0.358 0.350
He0.218 0.229 0.229 0.224
uHe0.219 0.233 0.234 0.230
MD = mean difference percentage; VD = variance difference percentage; CR = coincidence rate of range; VR = change rate of variation coefficient. Na = no. of different alleles; Ne = no. of effective alleles = 1/(p^2 + q^2); I = Shannon’s Information Index = -1* (p * Ln (p) + q * Ln(q)); He = expected heterozygosity = 2 * p * q; uHe = unbiased expected heterozygosity = (2N/(2N-1)) * He.
Publisher’s Note: MDPI stays neutral with regard to jurisdictional claims in published maps and institutional affiliations.

