Genome-Wide Expression and Alternative Splicing in Domesticated Sunflowers (Helianthus annuus L.) under Flooding Stress


Abstract

1. Introduction
2. Materials and Methods
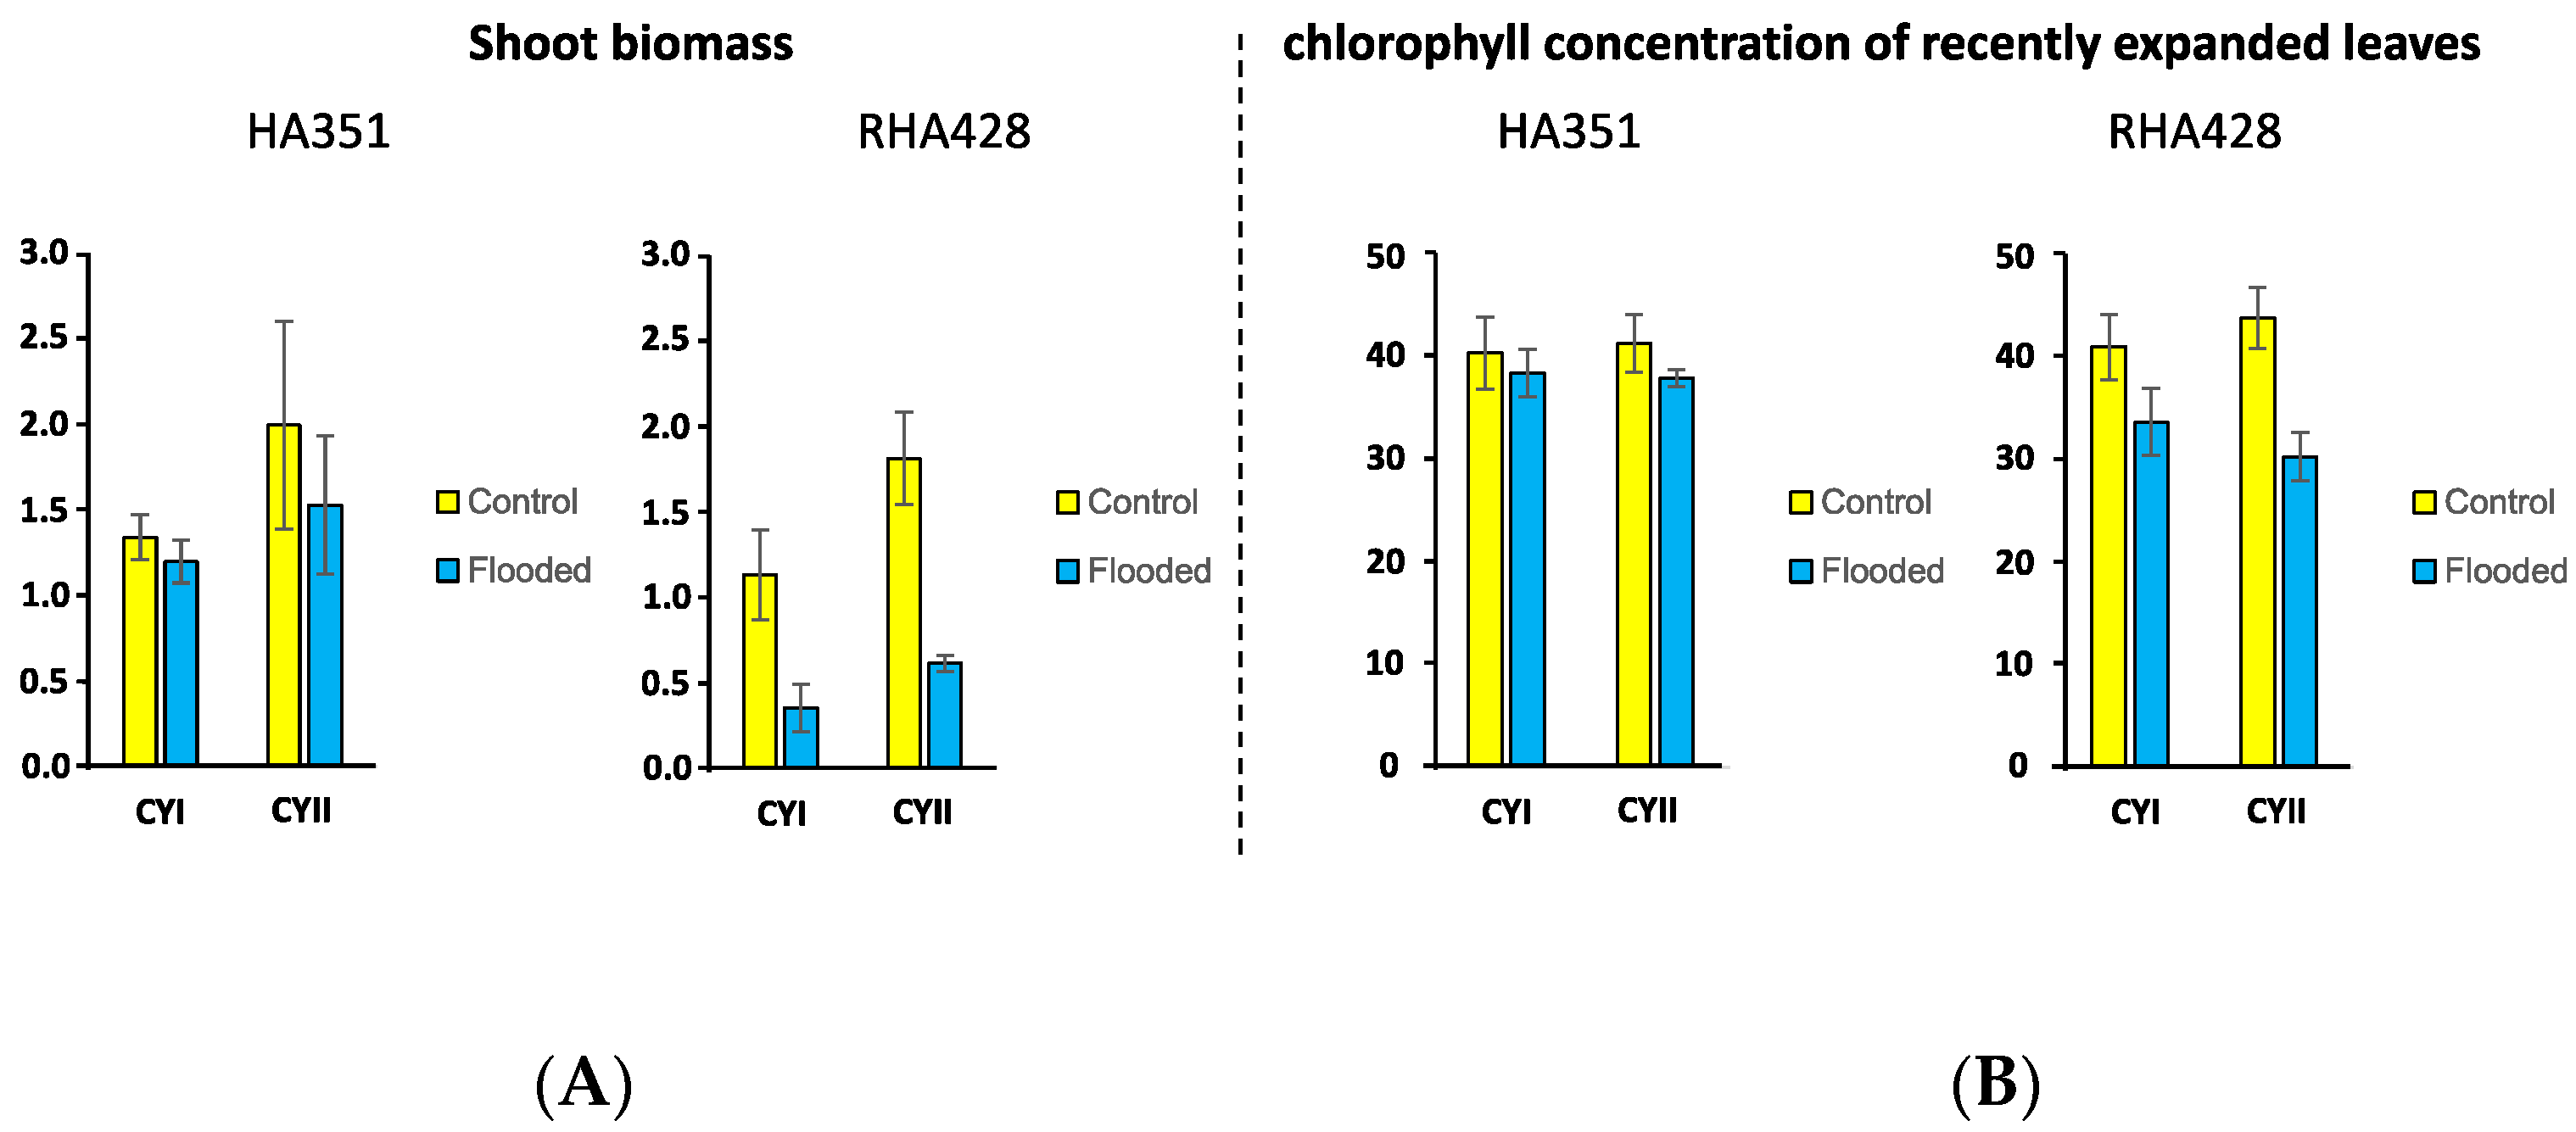
2.1. Plant Material and Flooding Stress Treatment
2.2. RNA-Seq Data Processing
2.3. Analyses of Differential Gene Expression and Alternative Splicing
2.4. Mixed Effect Model Analyses of Variation in Gene Expression and Alternative Splicing
2.5. Gene Co-Expression Network Analysis
2.6. Enrichment Comparisons
3. Results
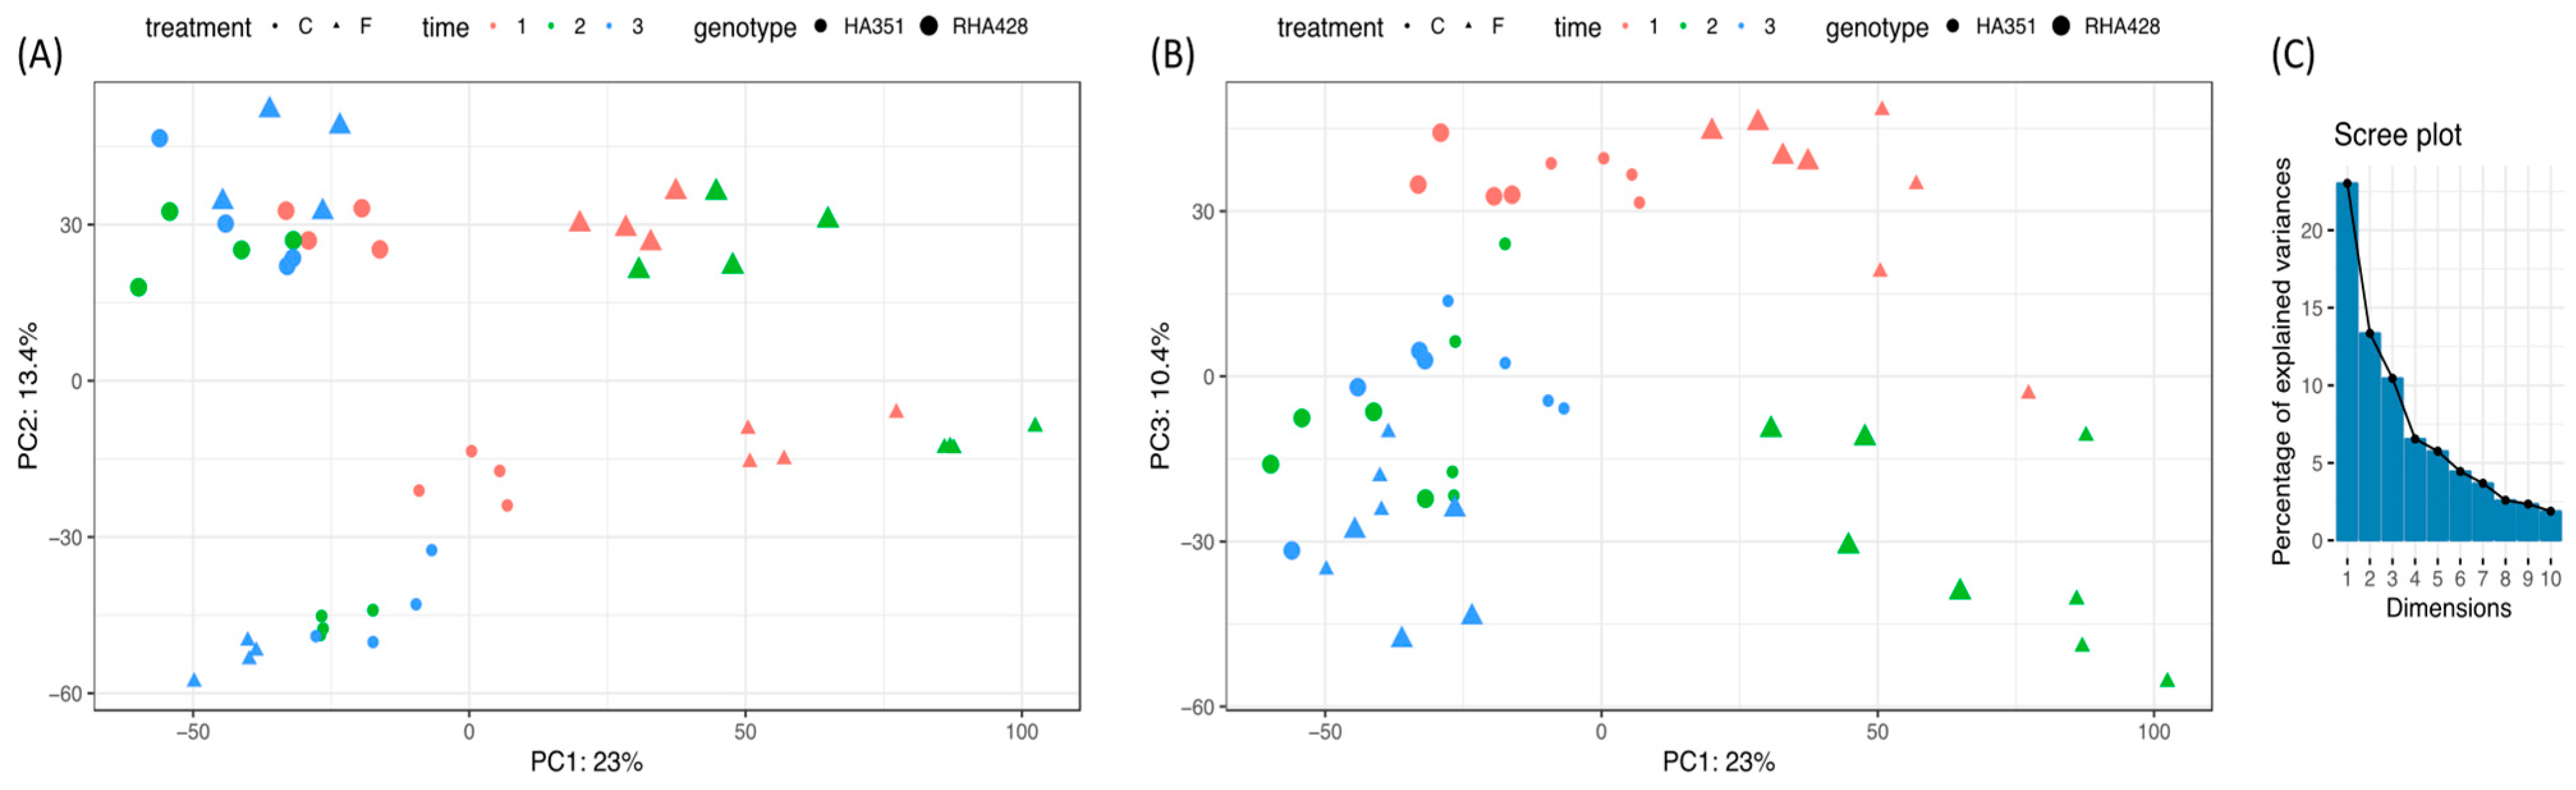
3.1. RNA-Seq Data
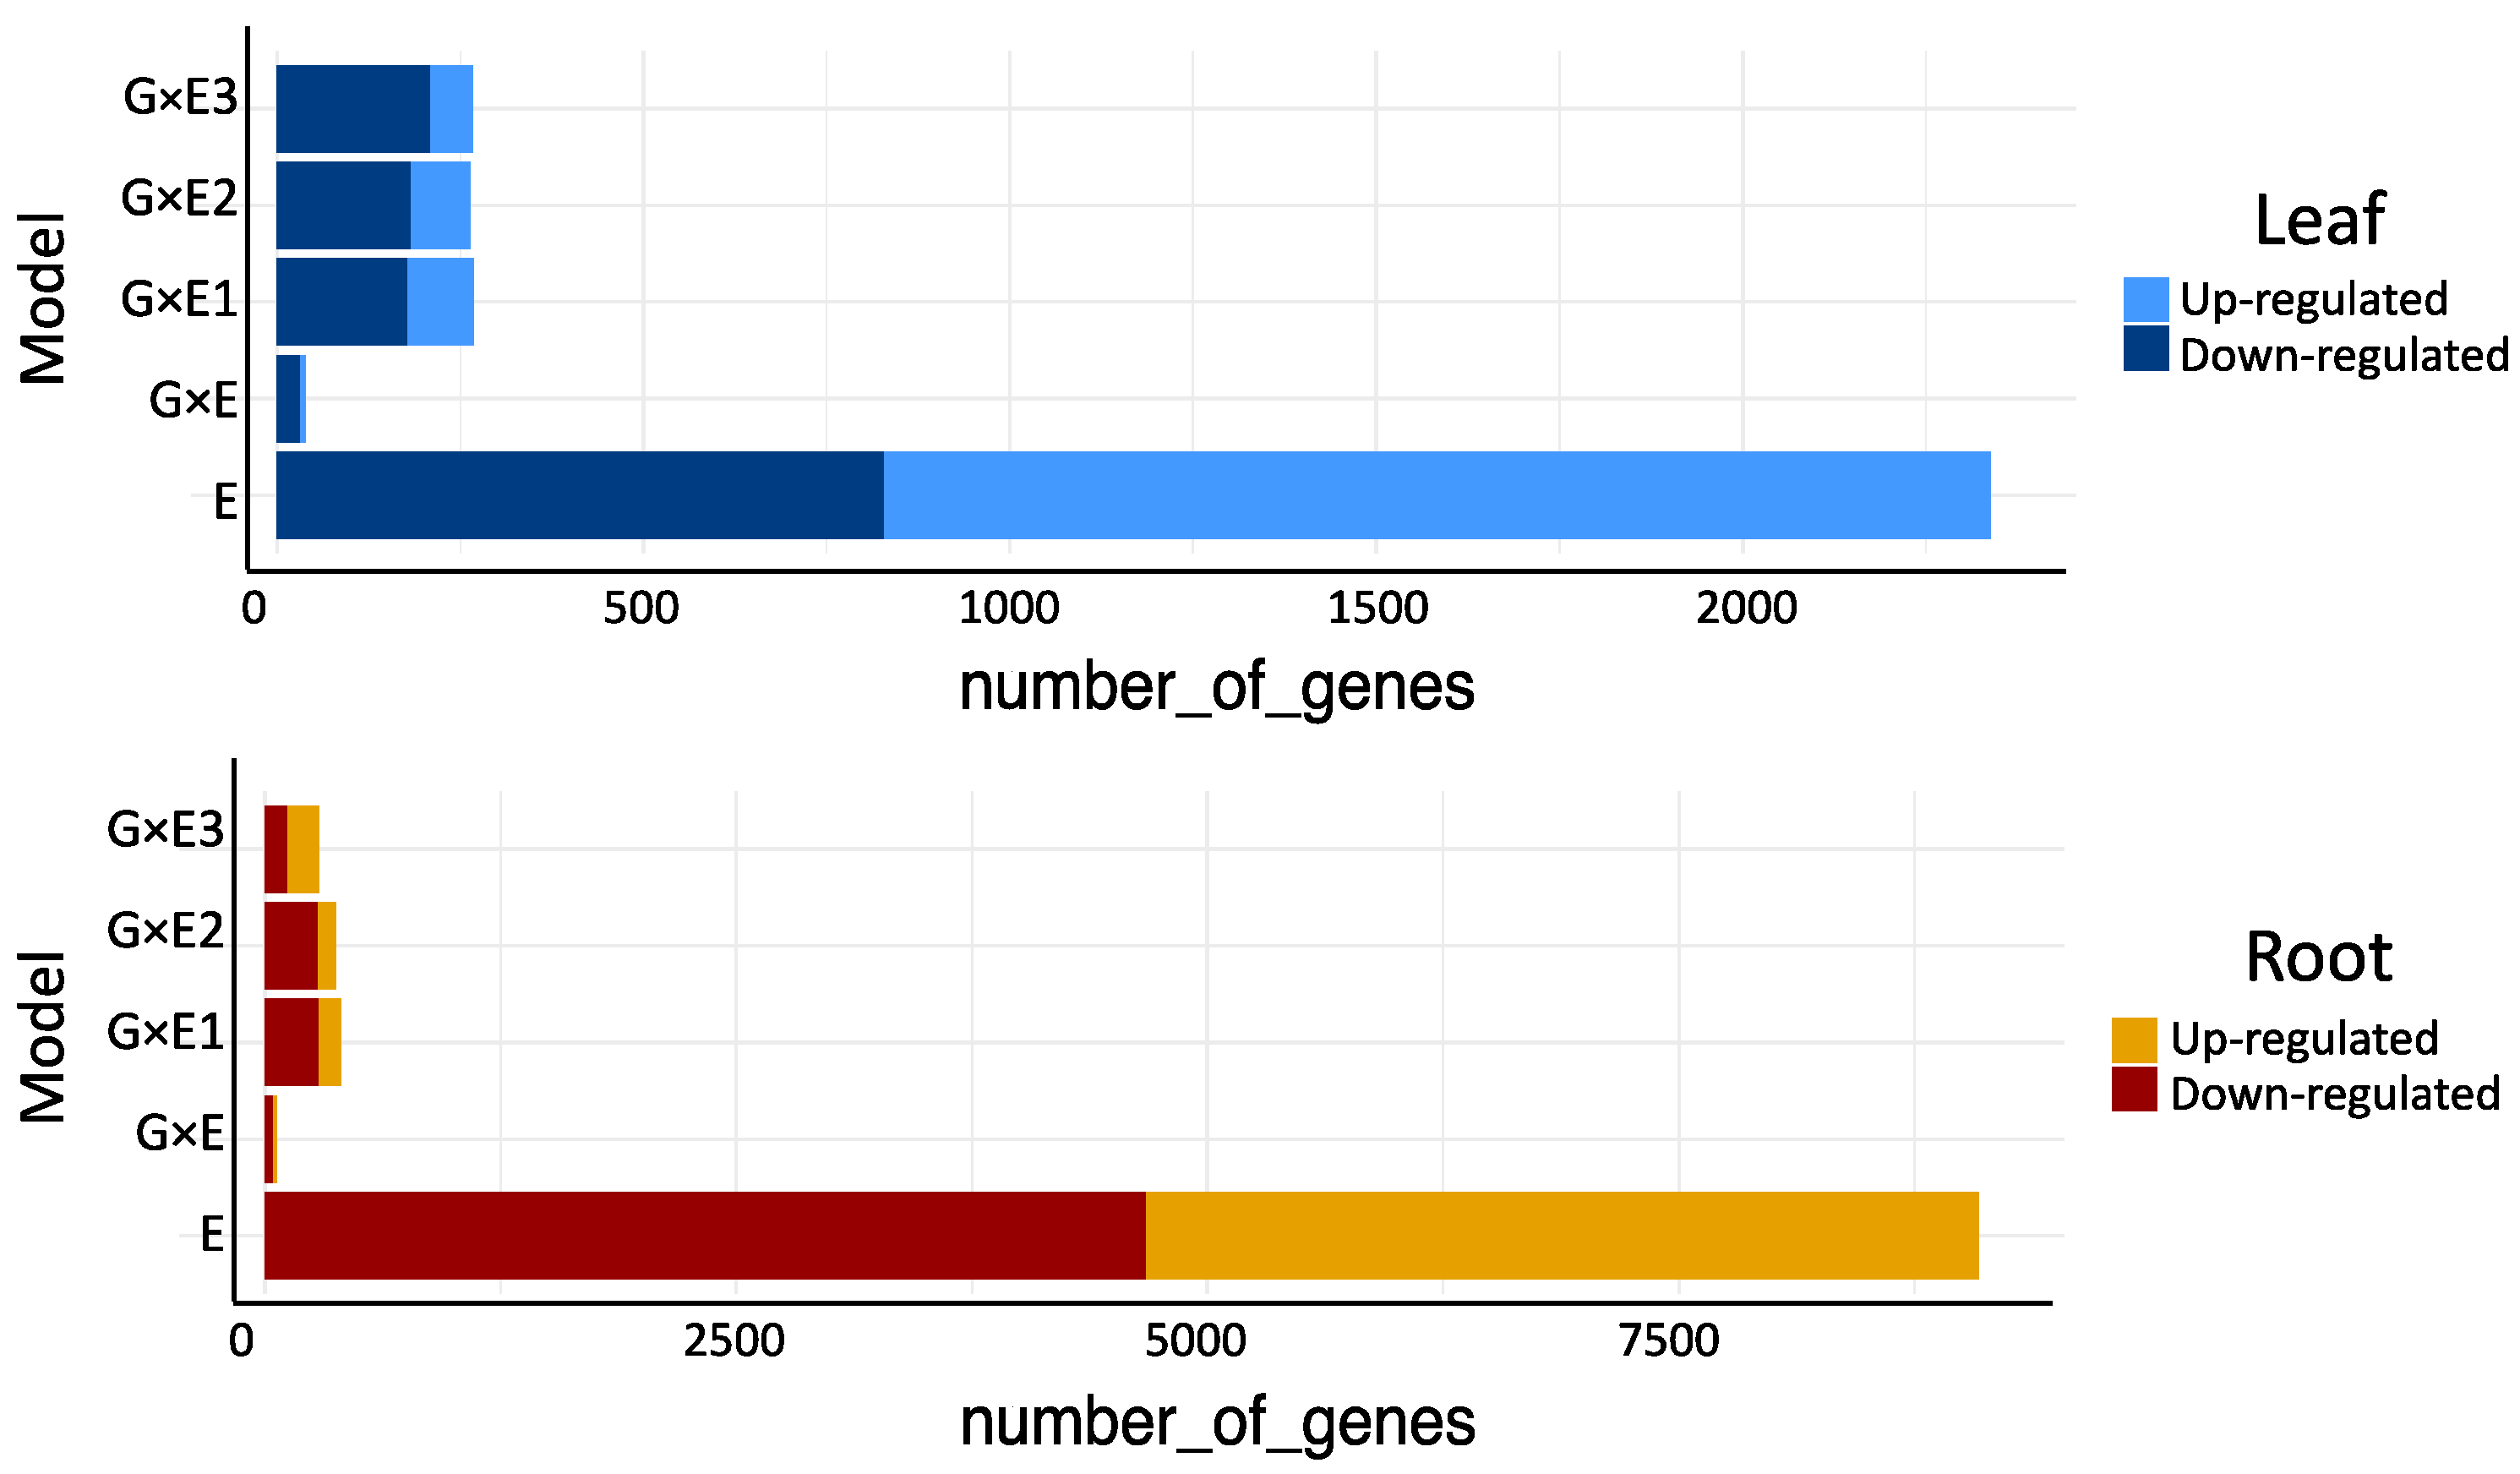
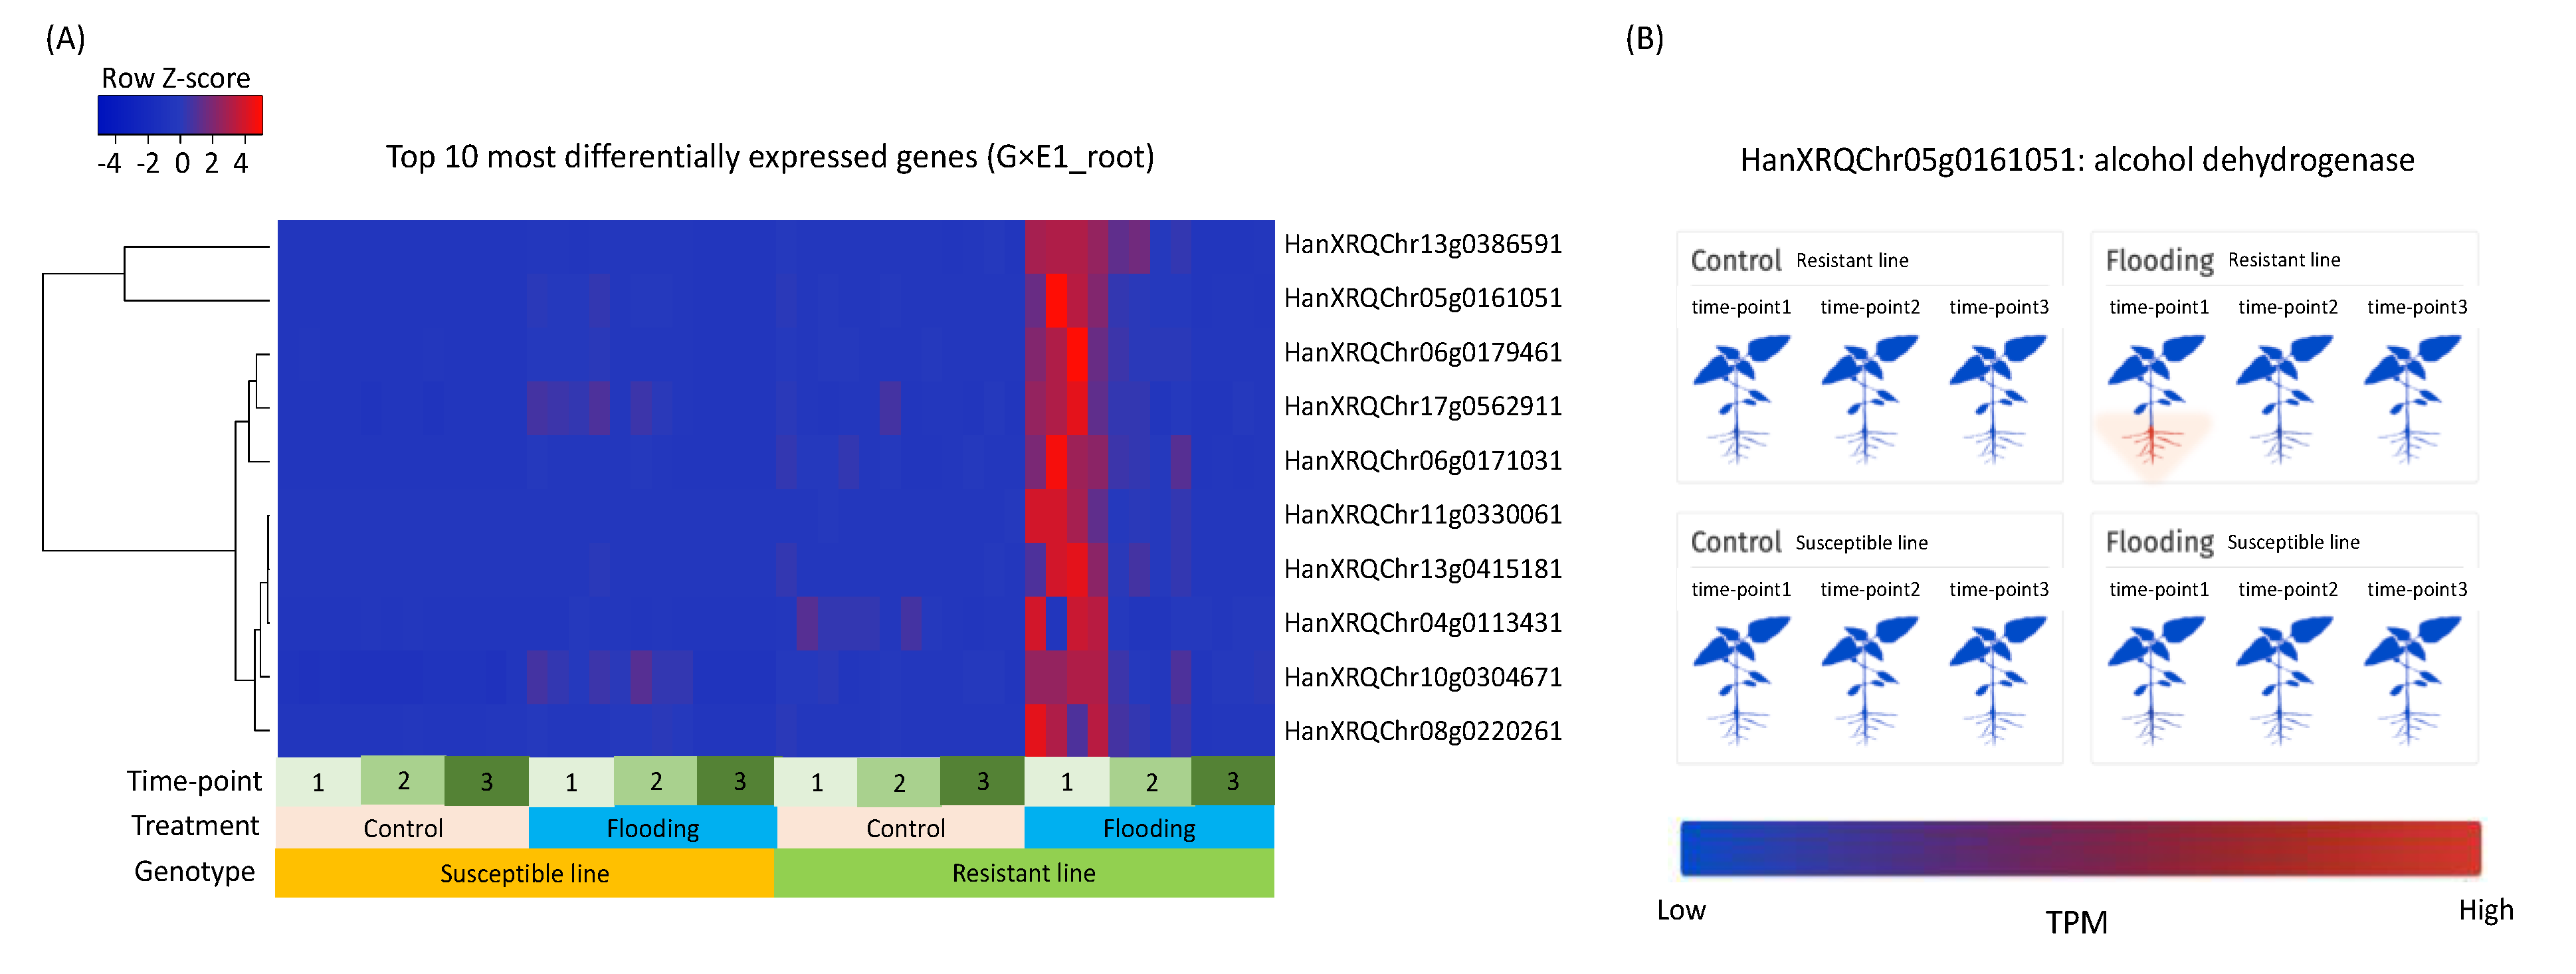
3.2. Differentially Expressed Genes (DEG) that Respond to Flooding Stress and Exhibit Genotype × Environment (G × E) Interactions
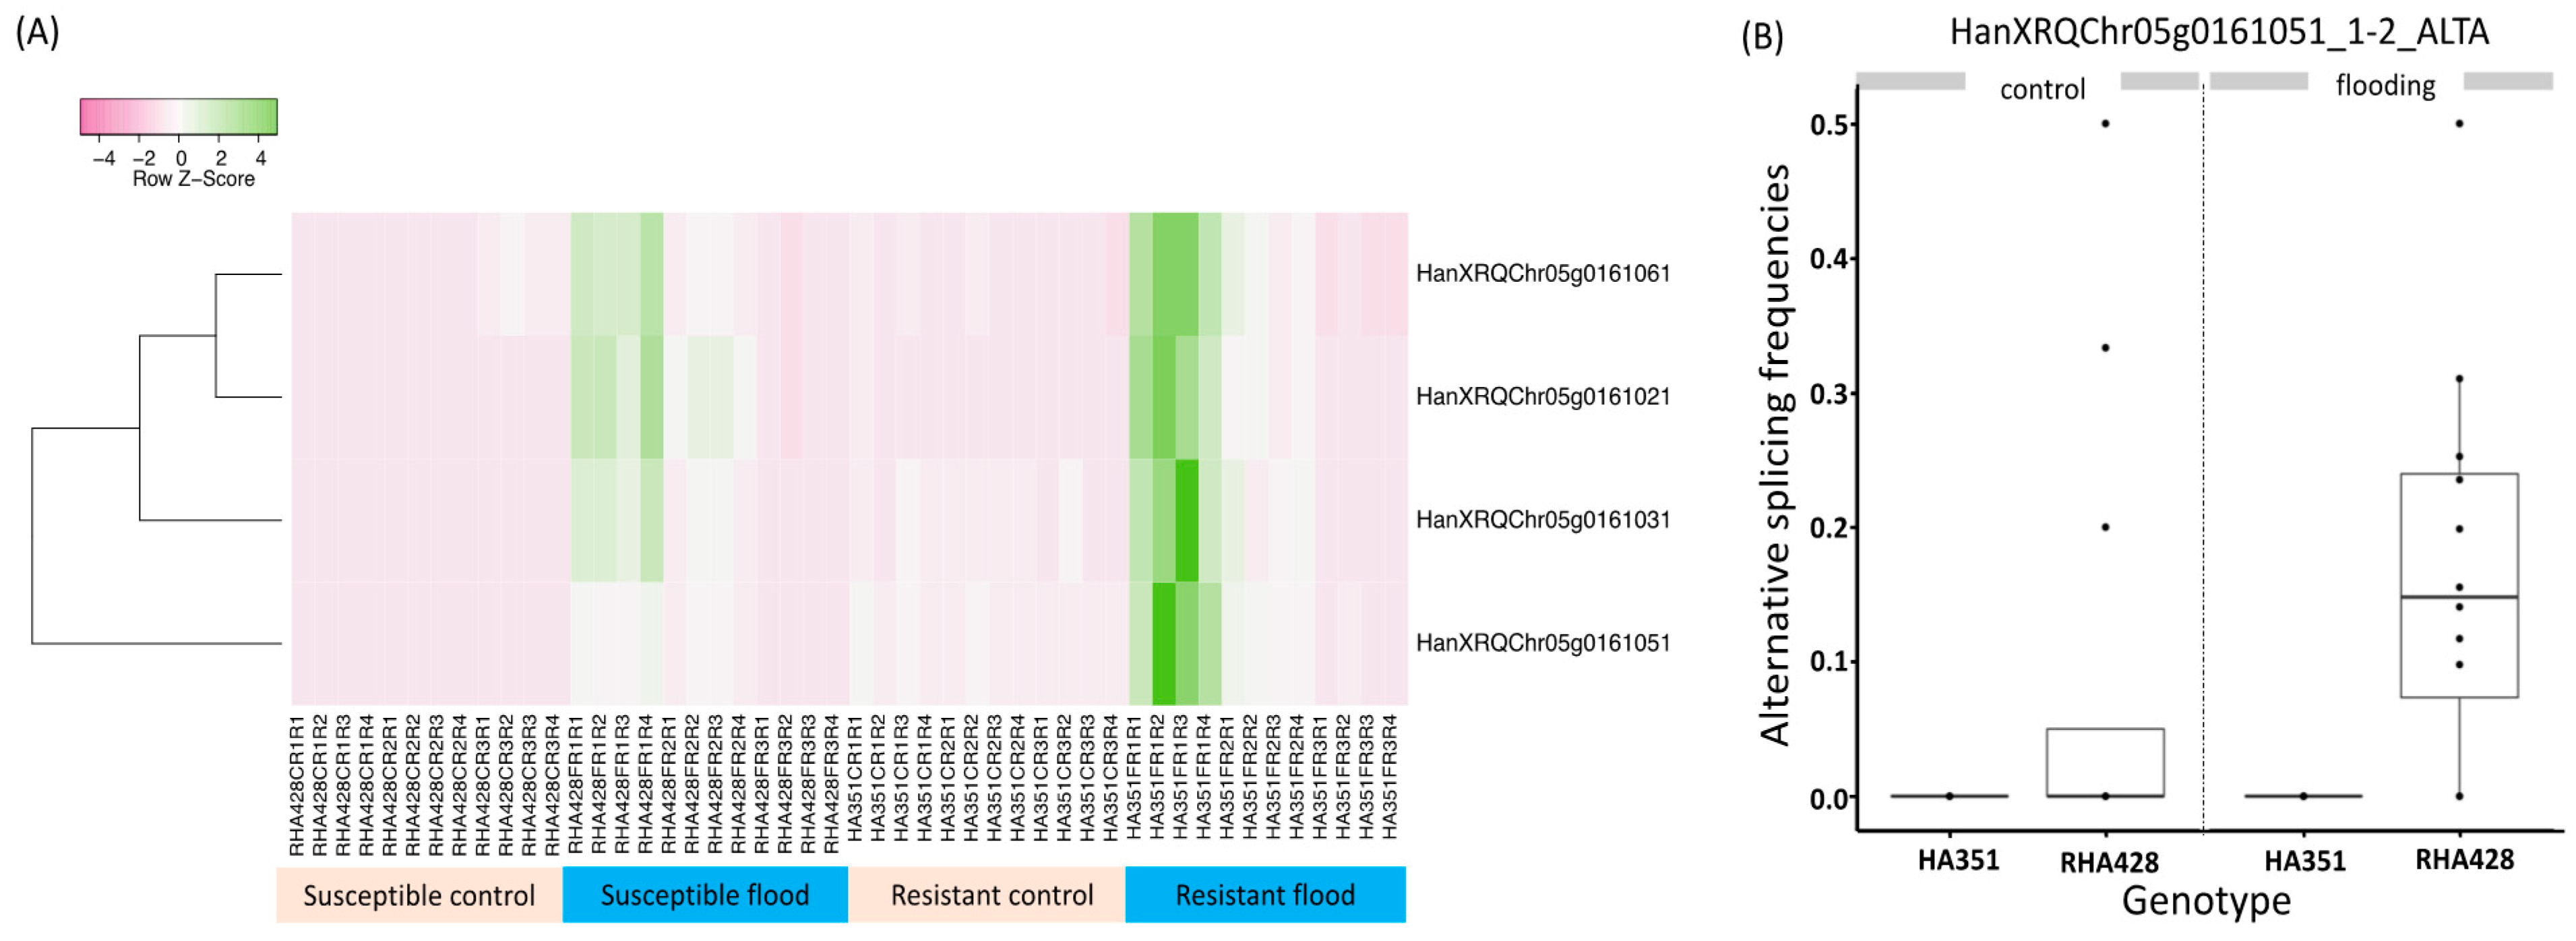
3.3. Differentially Spliced Genes (DAS) That Respond to the Flooding Stress
3.4. Putative Functions of Differentially Expressed Genes
3.5. Putative Function of Differentially Spliced Genes
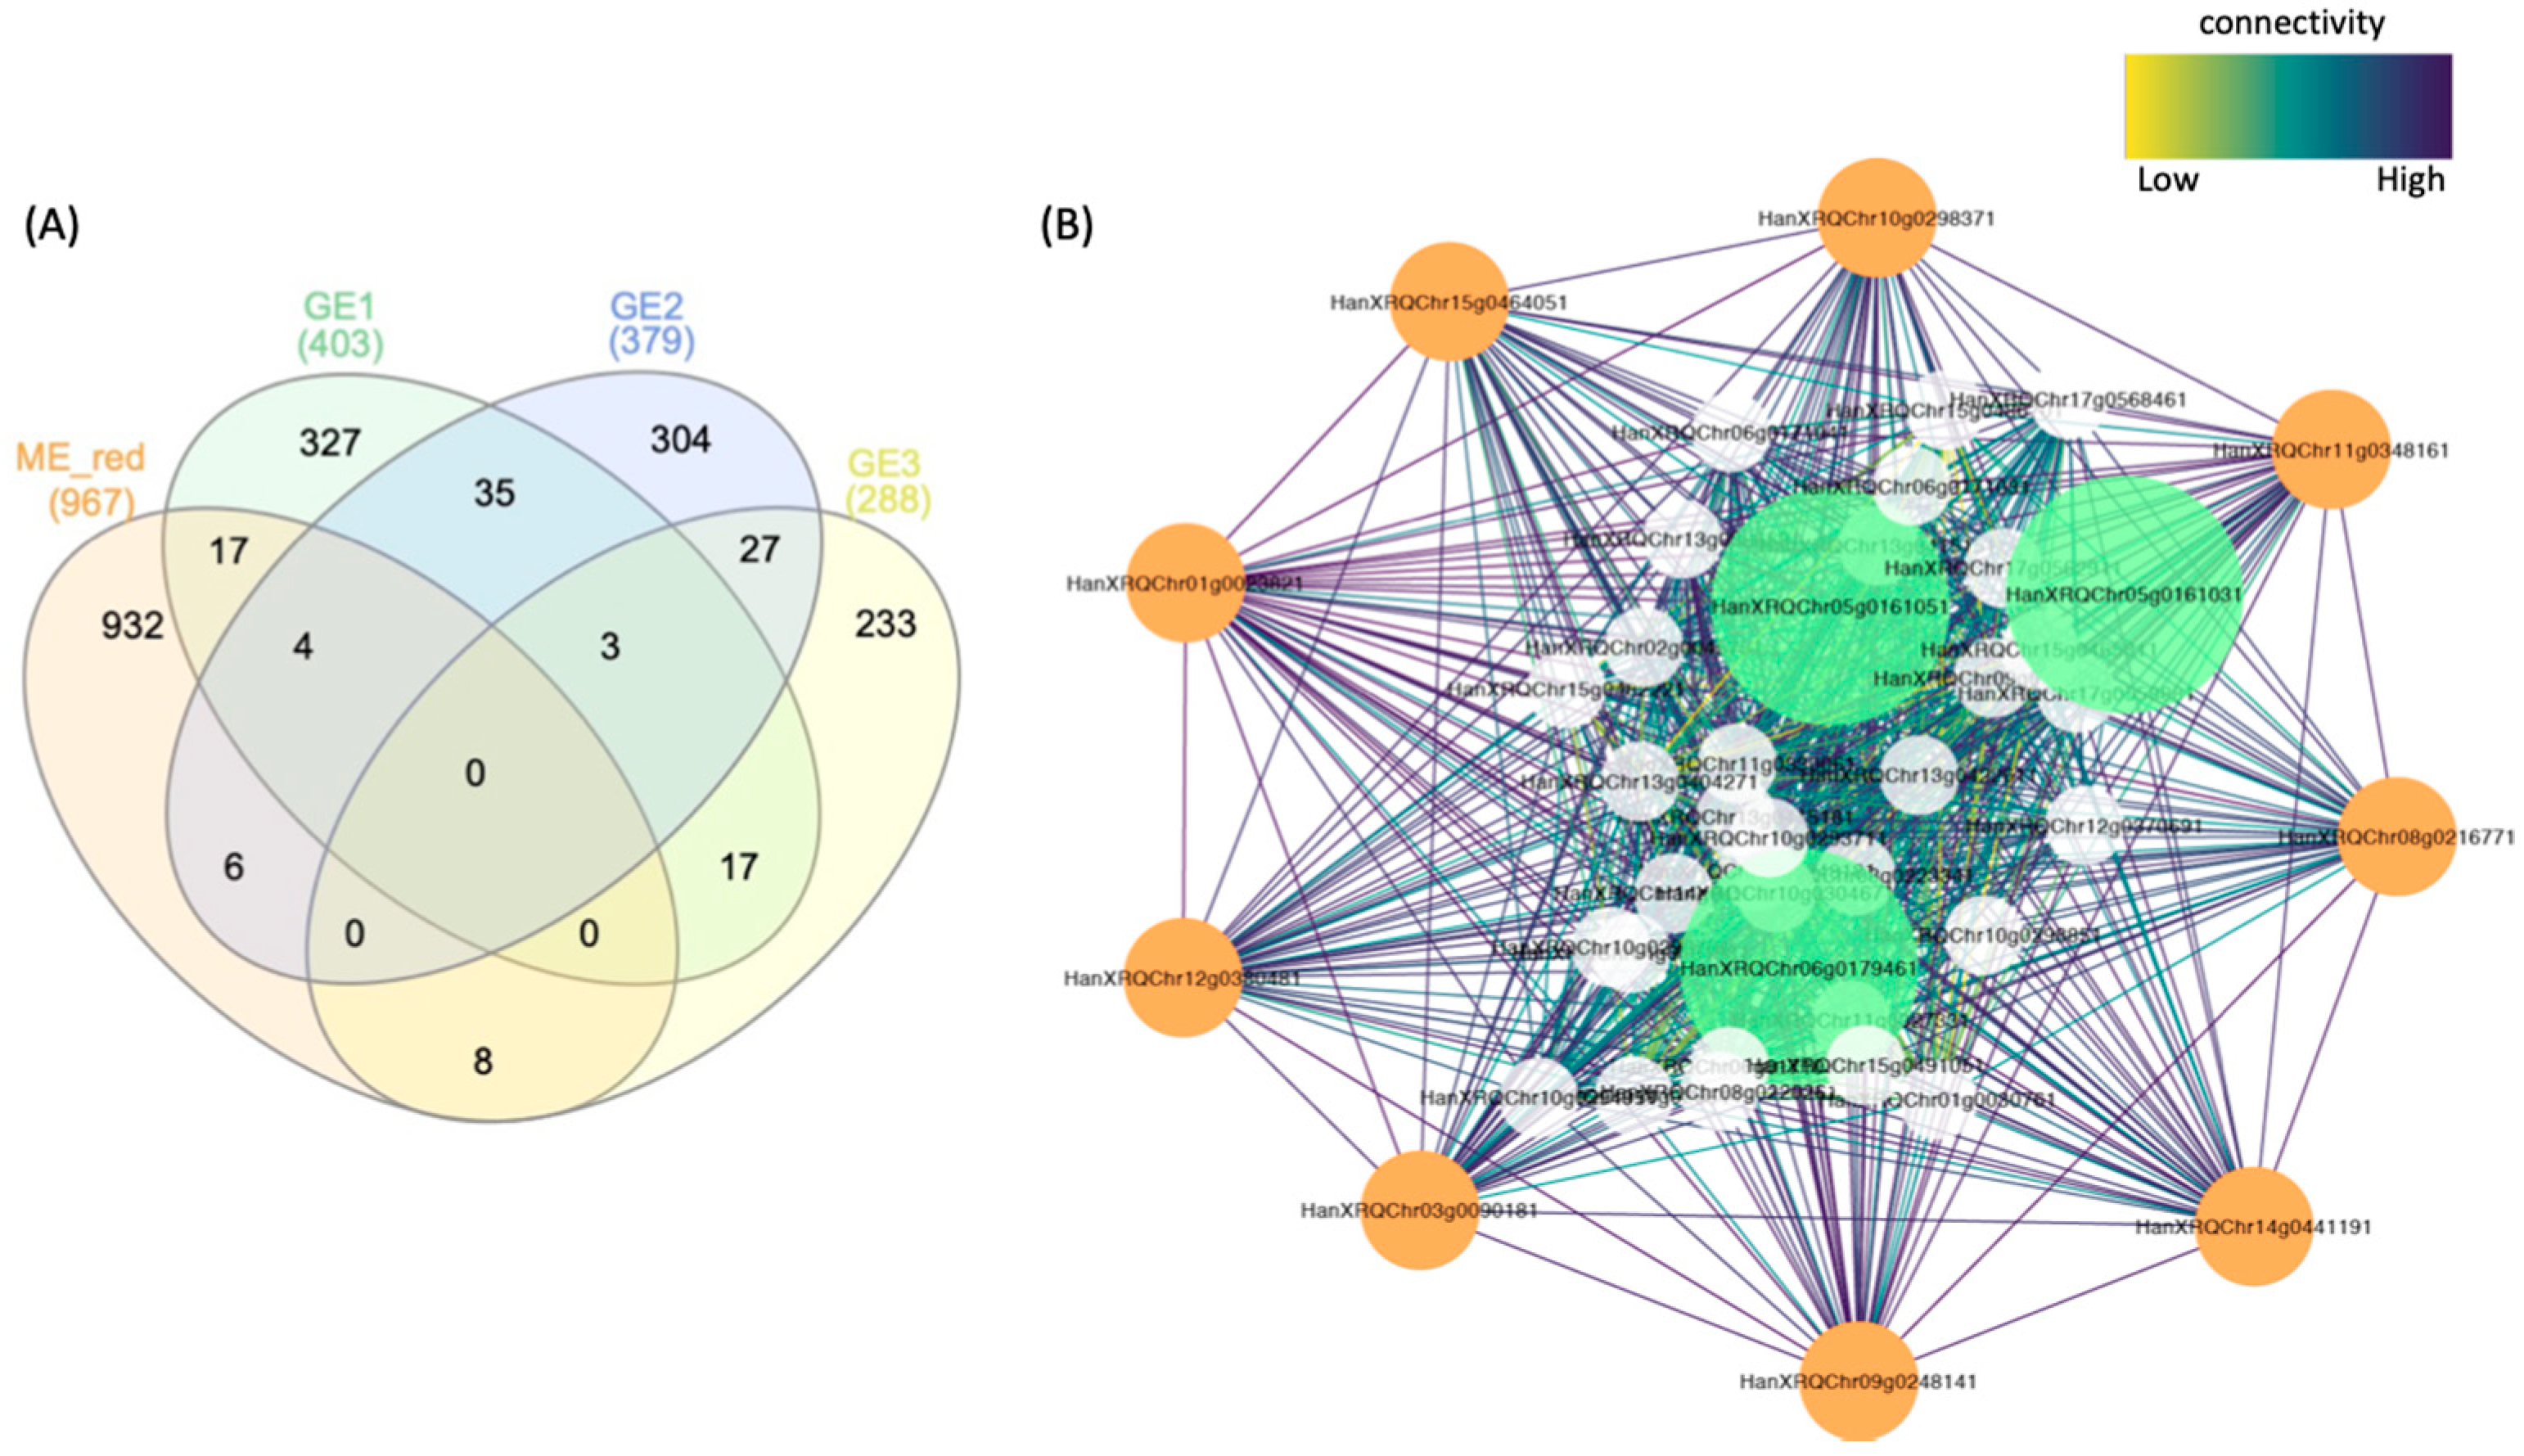
3.6. Gene Co-Expression Network Modules Underlying Responses to Flooding Stress
3.7. Comparison with Evolutionarily Conserved Submergence Activated Genes
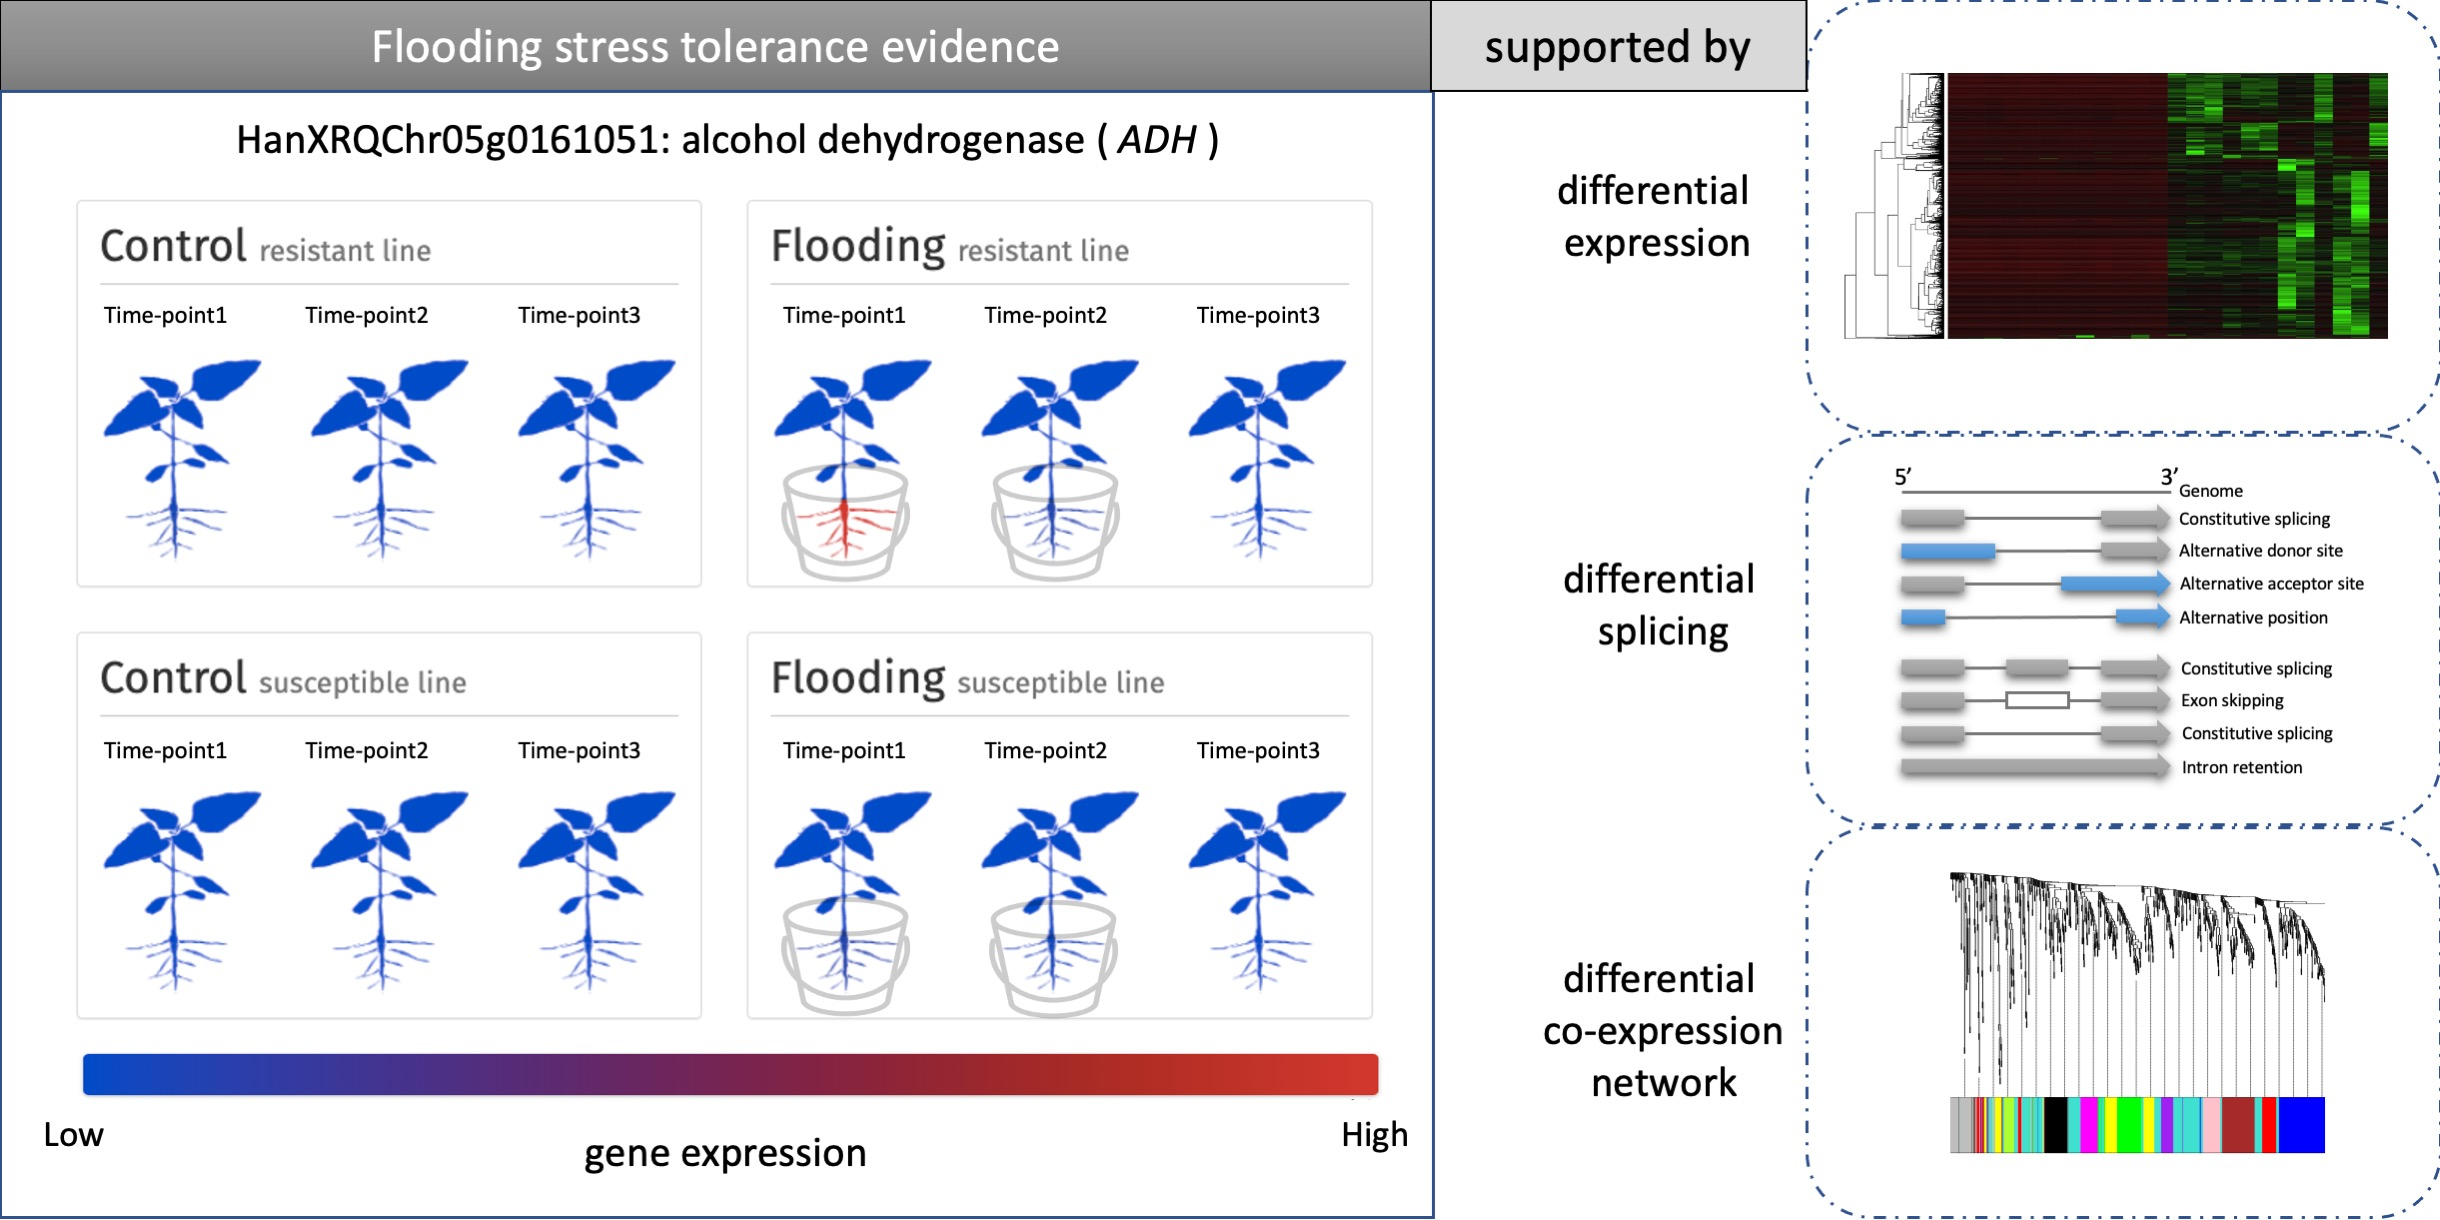
3.8. Case Study of the Alcohol Fermentation Pathway
4. Discussion
4.1. Root Dominant Responses to Flooding Stress in Sunflower
4.2. General Responses to Flooding
4.3. Changes in AS Levels Reinforce Expression Differences
4.4. Expression Changes Specific to the Flooding Resistant Cultivar
5. Conclusions
Supplementary Materials
Author Contributions
Funding
Institutional Review Board Statement
Informed Consent Statement
Data Availability Statement
Conflicts of Interest
References
- Rosenzweig, C.; Tubiello, F.N.; Goldberg, R.; Mills, E.; Bloomfield, J. Increased crop damage in the US from excess precipitation under climate change. Glob. Environ. Chang. 2002, 12, 197–202. [Google Scholar] [CrossRef]
- Kaniewski, D.; Marriner, N.; Morhange, C.; Faivre, S.; Otto, T.; Van Campo, E. Solar pacing of storm surges, coastal flooding and agricultural losses in the Central Mediterranean. Sci. Rep. 2016, 6, 25197. [Google Scholar] [CrossRef] [PubMed]
- Bailey-Serres, J.; Voesenek, L.A.C.J. Flooding stress: Acclimations and genetic diversity. Annu. Rev. Plant Biol. 2008, 59, 313–339. [Google Scholar] [CrossRef] [PubMed]
- Fukao, T.; Yeung, E.; Bailey-Serres, J. The submergence tolerance regulator SUB1A mediates crosstalk between submergence and drought tolerance in rice. Plant Cell 2011, tpc-110. [Google Scholar] [CrossRef] [PubMed]
- Colmer, T.D.; Voesenek, L.A.C.J. Flooding tolerance: Suites of plant traits in variable environments. Funct. Plant Biol. 2009, 36, 665–681. [Google Scholar] [CrossRef]
- Vashisht, D.; Hesselink, A.; Pierik, R.; Ammerlaan, J.M.H.; Bailey-Serres, J.; Visser, E.J.W.; Pedersen, O.; van Zanten, M.; Vreugdenhil, D.; Jamar, D.C.L.; et al. Natural variation of submergence tolerance among Arabidopsis thaliana accessions. N. Phytol. 2011, 190, 299–310. [Google Scholar] [CrossRef]
- Van Dongen, J.T.; Licausi, F. Oxygen sensing and signaling. Annu. Rev. Plant Biol. 2015, 66, 345–367. [Google Scholar] [CrossRef]
- Tadege, M.; Dupuis, I.; Kuhlemeier, C. Ethanolic fermentation: New functions for an old pathway. Trends Plant Sci. 1999, 4, 320–325. [Google Scholar] [CrossRef]
- Yang, W.; Catalanotti, C.; Posewitz, M.C.; Alric, J.; Grossman, A.R. Insights into algal fermentation. In Low-Oxygen Stress in Plants; van Dongen, J., Licausi, F., Eds.; Springer: Vienna, Austria, 2014; Volume 21, pp. 135–163. [Google Scholar] [CrossRef]
- Blokhina, O.; Virolainen, E.; Fagerstedt, K.V. Antioxidants, oxidative damage and oxygen deprivation stress: A review. Ann. Bot. 2003, 91, 179–194. [Google Scholar] [CrossRef]
- Loreti, E.; van Veen, H.; Perata, P. Plant responses to flooding stress. Curr. Opin. Plant Biol. 2016, 33, 64–71. [Google Scholar] [CrossRef]
- Voesenek, L.A.C.J.; Bailey-Serres, J. Flood adaptive traits and processes: An overview. N. Phytol. 2015, 206, 57–73. [Google Scholar] [CrossRef] [PubMed]
- Bailey-Serres, J.; Voesenek, L.A.C.J. Life in the balance: A signaling network controlling survival of flooding. Curr. Opin. Plant Biol. 2010, 13, 489–494. [Google Scholar] [CrossRef] [PubMed]
- Voesenek, L.A.C.J.; Bailey-Serres, J. Flooding tolerance: O2 sensing and survival strategies. Curr. Opin. Plant Biol. 2013, 16, 647–653. [Google Scholar] [CrossRef] [PubMed]
- Bailey-Serres, J.; Lee, S.C.; Brinton, E. Waterproofing crops: Effective flooding survival strategies. Plant Physiol. 2012, 160, 1698–1709. [Google Scholar] [CrossRef] [PubMed]
- Steffens, B.; Rasmussen, A. The physiology of adventitious roots. Plant Physiol. 2016, 170, 603–617. [Google Scholar] [CrossRef]
- Kende, H.; Van Der Knaap, E.; Cho, H.T. Deepwater rice: A model plant to study stem elongation. Plant Physiol. 1998, 118, 1105–1110. [Google Scholar] [CrossRef]
- Lorbiecke, R.; Sauter, M. Adventitious root growth and cell-cycle induction in deepwater rice. Plant Physiol. 1999, 119, 21–30. [Google Scholar] [CrossRef]
- Steffens, B.; Kovalev, A.; Gorb, S.N.; Sauter, M. Emerging roots alter epidermal cell fate through mechanical and reactive oxygen species signaling. Plant Cell 2012, 24, 3296–3306. [Google Scholar] [CrossRef]
- Bailey-Serres, J.; Fukao, T.; Gibbs, D.J.; Holdsworth, M.J.; Lee, S.C.; Licausi, F.; Perata, P.; Voesenek, L.A.C.J.; van Dongen, J.T. Making sense of low oxygen sensing. Trends Plant Sci. 2012, 17, 129–138. [Google Scholar] [CrossRef]
- Mustroph, A. Improving flooding tolerance of crop plants. Agronomy 2018, 8, 160. [Google Scholar] [CrossRef]
- VanToai, T.T.; Beuerlein, A.F.; Schmitthenner, S.K.; St. Martin, S.K. Genetic variability for flooding tolerance in soybeans. Crop. Sci. 1994, 34, 1112–1115. [Google Scholar] [CrossRef]
- VanToai, T.T.; St. Martin, S.K.; Chase, K.; Boru, G.; Schnipke, V.; Schmitthenner, A.F.; Lark, K.G. Identification of a QTL associated with tolerance of soybean to soil waterlogging. Crop. Sci. 2001, 41, 1247–1252. [Google Scholar] [CrossRef]
- Reyna, N.; Cornelious, B.; Shannon, J.G.; Sneller, C.H. Evaluation of a QTL for waterlogging tolerance in southern soybean germplasm. Crop. Sci. 2003, 43, 2077–2082. [Google Scholar] [CrossRef]
- Valliyodan, B.; Ye, H.; Song, L.; Murphy, M.; Shannon, J.G.; Nguyen, H.T. Genetic diversity and genomic strategies for improving drought and waterlogging tolerance in soybeans. J. Exp. Bot. 2016, 68, 1835–1849. [Google Scholar] [CrossRef] [PubMed]
- Wu, C.; Zeng, A.; Chen, P.; Florez-Palacios, L.; Hummer, W.; Mokua, J.; Klepadlo, M.; Yan, L.; Ma, Q.; Cheng, Y. An effective field screening method for flood tolerance in soybean. Plant Breed. 2017, 136, 710–719. [Google Scholar] [CrossRef]
- Chen, W.; Yao, Q.; Patil, G.B.; Agarwal, G.; Deshmukh, R.K.; Lin, L.; Wang, B.; Wang, Y.; Prince, S.J.; Song, L.; et al. Identification and comparative analysis of differential gene expression in soybean leaf tissue under drought and flooding stress revealed by RNA-Seq. Front. Plant Sci. 2016, 7, 1044. [Google Scholar] [CrossRef] [PubMed]
- Komatsu, S.; Yamamoto, R.; Nanjo, Y.; Mikami, Y.; Yunokawa, H.; Sakata, K. A comprehensive analysis of the soybean genes and proteins expressed under flooding stress using transcriptome and proteome techniques. J. Proteome Res. 2009, 8, 4766–4778. [Google Scholar] [CrossRef]
- Arora, K.; Panda, K.K.; Mittal, S.; Mallikarjuna, M.G.; Rao, A.R.; Dash, P.K.; Thirunavukkarasu, N. RNAseq revealed the important gene pathways controlling adaptive mechanisms under waterlogged stress in maize. Sci. Rep. 2017, 7, 10950. [Google Scholar] [CrossRef]
- Reynoso, M.A.; Kajala, K.; Bajic, M.; West, D.A.; Pauluzzi, G.; Yao, A.I.; Hatch, K.; Zumstein, K.; Woodhouse, M.; Rodriguez-Medina, J.; et al. Evolutionary flexibility in flooding response circuitry in angiosperms. Science 2019, 365, 1291–1295. [Google Scholar] [CrossRef]
- Staiger, D.; Brown, J.W. Alternative splicing at the intersection of biological timing, development, and stress responses. Plant Cell 2013, 25, 3640–3656. [Google Scholar] [CrossRef]
- Wang, B.B.; Brendel, V. Genomewide comparative analysis of alternative splicing in plants. Proc. Natl. Acad. Sci. USA 2006, 103, 7175–7180. [Google Scholar] [CrossRef] [PubMed]
- Kim, E.; Magen, A.; Ast, G. Different levels of alternative splicing among eukaryotes. Nucleic Acids Res. 2007, 35, 125–131. [Google Scholar] [CrossRef] [PubMed]
- Kalyna, M.; Simpson, C.G.; Syed, N.H.; Lewandowska, D.; Marquez, Y.; Kusenda, B.; Marshall, J.; Fuller, J.; Cardle, L.; McNicol, J.; et al. Alternative splicing and nonsense-mediated decay modulate expression of important regulatory genes in Arabidopsis. Nucleic Acids Res. 2012, 40, 2454–2469. [Google Scholar] [CrossRef] [PubMed]
- Drechsel, G.; Kahles, A.; Kesarwani, A.K.; Stauffer, E.; Behr, J.; Drewe, P.; Rätsch, G.; Wachter, A. Nonsense-mediated decay of alternative precursor mRNA splicing variants is a major determinant of the Arabidopsis steady state transcriptome. Plant Cell 2013, 25, 3726–3742. [Google Scholar] [CrossRef] [PubMed]
- Smith, J.E.; Baker, K.E. Nonsense-mediated RNA decay–A switch and dial for regulating gene expression. BioEssays 2015, 37, 612–623. [Google Scholar] [CrossRef] [PubMed]
- Syed, N.H.; Prince, S.J.; Mutava, R.N.; Patil, G.; Li, S.; Chen, W.; Babu, V.; Joshi, T.; Khan, S.; Nguyen, H.T. Core clock, SUB1, and ABAR genes mediate flooding and drought responses via alternative splicing in soybean. J. Exp. Bot. 2015, 66, 7129–7149. [Google Scholar] [CrossRef]
- Zou, X.; Jiang, Y.; Zheng, Y.; Zhang, M.; Zhang, Z. Prolyl 4-hydroxylase genes are subjected to alternative splicing in roots of maize seedlings under waterlogging. Ann. Bot. 2011, 108, 1323–1335. [Google Scholar] [CrossRef]
- Van Veen, H.; Vashisht, D.; Akman, M.; Girke, T.; Mustroph, A.; Reinen, E.; Hartman, S.; Kooiker, M.; van Tienderen, P.; Schranz, E.; et al. Transcriptomes of eight Arabidopsis thaliana accessions reveal core conserved, genotype-and organ-specific responses to flooding stress. Plant Physiol. 2016, 172, 668–689. [Google Scholar] [CrossRef]
- Yasumoto, S.; Terakado, Y.; Matsuzaki, M.; Okada, K. Effects of high water table and short-term flooding on growth, yield, and seed quality of sunflower. Plant Prod. Sci. 2011, 14, 233–248. [Google Scholar] [CrossRef]
- Van der Merwe, R.; Labuschagne, M.T.; Herselman, L.; Hugo, A. Effect of heat stress on seed yield components and oil composition in high-and mid-oleic sunflower hybrids. S. Afr. J. Plant Soil 2015, 32, 121–128. [Google Scholar] [CrossRef]
- Machekposhti, M.F.; Shahnazari, A.; Ahmadi, M.Z.; Aghajani, G.; Ritzema, H. Effect of irrigation with sea water on soil salinity and yield of oleic sunflower. Agric. Water Manag. 2017, 188, 69–78. [Google Scholar] [CrossRef]
- Hussain, M.; Farooq, S.; Hasan, W.; Ul-Allah, S.; Tanveer, M.; Farooq, M.; Nawaz, A. Drought stress in sunflower: Physiological effects and its management through breeding and agronomic alternatives. Agric. Water Manag. 2018, 201, 152–166. [Google Scholar] [CrossRef]
- Gao, L.; Lee, J.S.; Hübner, S.; Hulke, B.S.; Qu, Y.; Rieseberg, L.H. Genetic and phenotypic analyses indicate that resistance to flooding stress is uncoupled from performance in cultivated sunflower. N. Phytol. 2019, 223, 1657–1670. [Google Scholar] [CrossRef] [PubMed]
- Hulke, B.S.; Kleingartner, L.W. Sunflower. In Yield Gains in Major U.S. Field Crops; Smith, S., Diers, B., Specht, J., Carver, B., Eds.; CSSA: Madison, WI, USA, 2014; pp. 433–457. [Google Scholar] [CrossRef]
- Wample, R.L.; Reid, D.M. Control of adventitious root production and hypocotyl hypertrophy of sunflower (Helianthus annuus) in response to flooding. Physiol. Plant 1978, 44, 351–358. [Google Scholar] [CrossRef]
- Ni, X.L.; Gui, M.Y.; Tan, L.L.; Zhu, Q.; Liu, W.Z.; Li, C.X. Programmed cell death and aerenchyma formation in water-logged sunflower stems and its promotion by ethylene and ROS. Front. Plant Sci. 2019, 9, 1928. [Google Scholar] [CrossRef] [PubMed]
- Torres, A.M.; Diedenhofen, U. Sunflower alcohol dehydrogenase genotypes: Germination rates and response to flooding. Environ. Exp. Bot. 1981, 21, 35–44. [Google Scholar] [CrossRef]
- Jayasekera, G.A.U.; Reid, D.M.; Yeung, E.C. Fates of ethanol produced during flooding of sunflower roots. Can. J. Bot. 1990, 68, 2408–2414. [Google Scholar] [CrossRef]
- Bolger, A.M.; Lohse, M.; Usadel, B. Trimmomatic: A flexible trimmer for Illumina sequence data. Bioinformatics 2014, 30, 2114–2120. [Google Scholar] [CrossRef]
- Badouin, H.; Gouzy, J.; Grassa, C.J.; Murat, F.; Staton, E.; Cottret, L.; Lelandais-Brière, C.; Owens, G.; Carrere, S.; Mayjonade, B.; et al. The sunflower genome illuminates the evolutionary history of the Asterids and provides new insights into oil metabolism and flowering time. Nature 2017, 546, 148–152. [Google Scholar] [CrossRef]
- Dobin, A.; Davis, C.A.; Schlesinger, F.; Drenkow, J.; Zaleski, C.; Jha, S.; Batut, P.; Chaisson, M.; Gingeras, T.R. STAR: Ultrafast universal RNA-seq aligner. Bioinformatics 2013, 29, 15–21. [Google Scholar] [CrossRef]
- Liao, Y.; Smyth, G.K.; Shi, W. featureCounts: An efficient general purpose program for assigning sequence reads to genomic features. Bioinformatics 2014, 30, 923–930. [Google Scholar] [CrossRef]
- Rau, A.; Gallopin, M.; Celeux, G.; Jaffrézic, F. Data-based filtering for replicated high-throughput transcriptome sequencing experiments. Bioinformatics 2013, 29, 2146–2152. [Google Scholar] [CrossRef]
- Robinson, M.D.; McCarthy, D.J.; Smyth, G.K. edgeR: A Bioconductor package for differential expression analysis of digital gene expression data. Bioinformatics 2010, 26, 139–140. [Google Scholar] [CrossRef]
- Venables, W.N.; Ripley, B.D. Modern Applied Statistics with S-PLUS; Springer Science & Business Media: New York, NY, USA, 1999. [Google Scholar]
- Tack, D.C.; Pitchers, W.R.; Adams, K.L. Transcriptome analysis indicates considerable divergence in alternative splicing between duplicated genes in Arabidopsis thaliana. Genetics 2014, 198, 1473–1481. [Google Scholar] [CrossRef]
- Park, E.; Pan, Z.; Zhang, Z.; Lin, L.; Xing, Y. The expanding landscape of alternative splicing variation in human populations. Am. J. Hum. Genet. 2018, 102, 11–26. [Google Scholar] [CrossRef]
- Benjamini, Y.; Hochberg, Y. Controlling the false discovery rate: A practical and powerful approach to multiple testing. J. R. Stat. Soc. Ser. B Methodol. 1995, 57, 289–300. [Google Scholar] [CrossRef]
- Bates, D.; Maechler, M.; Bolker, B.; Walker, S. Fitting linear mixed-effects models using lme4. J. Stat. Softw. 2015, 67, 1–48. [Google Scholar] [CrossRef]
- Kuznetsova, A.; Brockhoff, P.B.; Christensen, R.H.B. lmerTest package: Tests in linear mixed effects models. J. Stat. Softw. 2017, 82. [Google Scholar] [CrossRef]
- Fox, J.; Weisberg, S. An R Companion to Applied Regression, 2nd ed.; Sage: Thousand Oaks, CA, USA, 2011; Available online: http://socserv.socsci.mcmaster.ca/jfox/Books/Companion (accessed on 8 May 2019).
- Langfelder, P.; Horvath, S. WGCNA: An R package for weighted correlation network analysis. BMC Bioinform. 2008, 9, 559. [Google Scholar] [CrossRef]
- Shannon, P.; Markiel, A.; Ozier, O.; Baliga, N.S.; Wang, J.T.; Ramage, D.; Amin, N.; Schwikowski, B.; Ideker, T. Cytoscape: A software environment for integrated models of biomolecular interaction networks. Genome Res. 2003, 13, 2498–2504. [Google Scholar] [CrossRef]
- Tian, T.; Liu, Y.; Yan, H.; You, Q.; Yi, X.; Du, Z.; Xu, W.; Su, Z. agriGO v2.0: A GO analysis toolkit for the agricultural community, 2017 update. Nucleic Acids Res. 2017, 45, W122–W129. [Google Scholar] [CrossRef]
- Benjamini, Y.; Yekutieli, D. The control of the false discovery rate in multiple testing under dependency. Ann. Stat. 2001, 29, 1165–1188. [Google Scholar] [CrossRef]
- Supek, F.; Bošnjak, M.; Škunca, N.; Šmuc, T. REVIGO summarizes and visualizes long lists of gene ontology terms. PLoS ONE 2011, 6, e21800. [Google Scholar] [CrossRef]
- Qi, B.; Yang, Y.; Yin, Y.; Xu, M.; Li, H. De novo sequencing, assembly, and analysis of the Taxodium ‘Zhongshansa’ roots and shoots transcriptome in response to short-term waterlogging. BMC Plant Biol. 2014, 14, 201. [Google Scholar] [CrossRef]
- Kreuzwieser, J.; Hauberg, J.; Howell, K.A.; Carroll, A.; Rennenberg, H.; Millar, A.H.; Whelan, J. Differential response of gray poplar leaves and roots underpins stress adaptation during hypoxia. Plant Physiol. 2009, 149, 461–473. [Google Scholar] [CrossRef]
- Sasidharan, R.; Hartman, S.; Liu, Z.; Martopawiro, S.; Sajeev, N.; van Veen, H.; Yeung, E.; Voesenek, L.A.C.J. Signal dynamics and interactions during flooding stress. Plant Physiol. 2018, 176, 1106–1117. [Google Scholar] [CrossRef]
- Gasch, P.; Fundinger, M.; Müller, J.T.; Lee, T.; Bailey-Serres, J.; Mustroph, A. Redundant ERF-VII transcription factors bind to an evolutionarily conserved cis-motif to regulate hypoxia-responsive gene expression in Arabidopsis. Plant Cell 2016, 28, 160–180. [Google Scholar] [CrossRef]
- Xu, X.; Chen, M.; Ji, J.; Xu, Q.; Qi, X.; Chen, X. Comparative RNA-seq based transcriptome profiling of waterlogging response in cucumber hypocotyls reveals novel insights into the de novo adventitious root primordia initiation. BMC Plant Biol. 2017, 17, 1–13. [Google Scholar] [CrossRef]
- Neogy, A.; Garg, T.; Kumar, A.; Dwivedi, A.K.; Singh, H.; Singh, U.; Singh, Z.; Prasad, K.; Jain, M.; Yadav, S.R. Genome-wide transcript profiling reveals an auxin-responsive transcription factor, OsAP2/ERF-40, promoting rice adventitious root development. Plant Cell Physiol. 2019, 60, 2343–2355. [Google Scholar] [CrossRef]
- Grichko, V.P.; Glick, B.R. Ethylene and flooding stress in plants. Plant Physiol. Biochem. 2001, 39, 1–9. [Google Scholar] [CrossRef]
- Pezeshki, S.R. Wetland plant responses to soil flooding. Environ. Exp. Bot. 2001, 46, 299–312. [Google Scholar] [CrossRef]
- Glenz, C.; Schlaepfer, R.; Iorgulescu, I.; Kienast, F. Flooding tolerance of Central European tree and shrub species. For. Ecol. Manag. 2006, 235, 1–13. [Google Scholar] [CrossRef]
- Lee, K.W.; Chen, P.W.; Yu, S.M. Metabolic adaptation to sugar/O2 deficiency for anaerobic germination and seedling growth in rice. Plant Cell Environ. 2014, 37, 2234–2244. [Google Scholar] [CrossRef]
- Filichkin, S.A.; Priest, H.D.; Givan, S.A.; Shen, R.; Bryant, D.W.; Fox, S.E.; Wong, W.K.; Mockler, T.C. Genome-wide mapping of alternative splicing in Arabidopsis thaliana. Genome Res. 2010, 20, 45–58. [Google Scholar] [CrossRef] [PubMed]
- Marquez, Y.; Brown, J.W.; Simpson, C.G.; Barta, A.; Kalyna, M. Transcriptome survey reveals increased complexity of the alternative splicing landscape in Arabidopsis. Genome Res. 2012, 22, 1184–1195. [Google Scholar] [CrossRef] [PubMed]
- Laloum, T.; Martín, G.; Duque, P. Alternative splicing control of abiotic stress responses. Trends Plant Sci. 2018, 23, 140–150. [Google Scholar] [CrossRef]
- Reddy, A.S.; Marquez, Y.; Kalyna, M.; Barta, A. Complexity of the alternative splicing landscape in plants. Plant Cell 2013, 25, 3657–3683. [Google Scholar] [CrossRef]
- Soergel, D.A.W.; Lareau, L.F.; Brenner, S.E. Regulation of Gene Expression by Coupling of Alternative Splicing and NMD; Landes Bioscience: Austin, TX, USA, 2013. Available online: https://www.ncbi.nlm.nih.gov/books/NBK6088/ (accessed on 15 May 2019).
- Filichkin, S.A.; Mockler, T.C. Unproductive alternative splicing and nonsense mRNAs: A widespread phenomenon among plant circadian clock genes. Biol. Direct 2012, 7, 20. [Google Scholar] [CrossRef]
- Matsukura, S.; Mizoi, J.; Yoshida, T.; Todaka, D.; Ito, Y.; Maruyama, K.; Shinozaki, K.; Yamaguchi-Shinozaki, K. Comprehensive analysis of rice DREB2-type genes that encode transcription factors involved in the expression of abiotic stress-responsive genes. Mol. Genet. Genom. 2010, 283, 185–196. [Google Scholar] [CrossRef]
- Peng, X.; Zhang, L.; Zhang, L.; Liu, Z.; Cheng, L.; Yang, Y.; Shen, S.; Chen, S.; Liu, G. The transcriptional factor LcDREB2 cooperates with LcSAMDC2 to contribute to salt tolerance in Leymus chinensis. Plant Cell Tissue Organ. Cult. 2013, 113, 245–256. [Google Scholar] [CrossRef]
- Lee, J.S.; Adams, K.L. Global insights into duplicated gene expression and alternative splicing in polyploid Brassica napus under heat, cold, and drought stress. Plant Genome 2020, e20057. [Google Scholar] [CrossRef]
- Fukao, T.; Bailey-Serres, J. Plant responses to hypoxia–is survival a balancing act? Trends Plant Sci. 2004, 9, 449–456. [Google Scholar] [CrossRef] [PubMed]
- Bui, L.T.; Novi, G.; Lombardi, L.; Iannuzzi, C.; Rossi, J.; Santaniello, A.; Mensuali, A.; Corbineau, F.; Giuntoli, B.; Perata, P.; et al. Conservation of ethanol fermentation and its regulation in land plants. J. Exp. Bot. 2019, 70, 1815–1827. [Google Scholar] [CrossRef] [PubMed]
- Loehlin, D.W.; Carroll, S.B. Expression of tandem gene duplicates is often greater than twofold. Proc. Natl. Acad. Sci. USA 2016, 113, 5988–5992. [Google Scholar] [CrossRef]
- Fukao, T.; Xu, K.; Ronald, P.C.; Bailey-Serres, J. A variable cluster of ethylene response factor–like genes regulates metabolic and developmental acclimation responses to submergence in rice. Plant Cell 2006, 18, 2021–2034. [Google Scholar] [CrossRef]
- Wang, B.; Jin, Q.; Zhang, X.; Mattson, N.S.; Ren, H.; Cao, J.; Wang, Y.; Tao, D.; Xu, Y. Genome-wide transcriptional analysis of submerged lotus reveals cooperative regulation and gene responses. Sci. Rep. 2018, 8, 9187. [Google Scholar] [CrossRef]
- Yeung, E.; van Veen, H.; Vashisht, D.; Paiva, A.L.S.; Hummel, M.; Rankenberg, T.; Steffens, B.; Steffen-Heins, A.; Sauter, M.; de Vries, M.; et al. A stress recovery signaling network for enhanced flooding tolerance in Arabidopsis thaliana. Proc. Natl. Acad. Sci. USA 2018, 115, E6085–E6094. [Google Scholar] [CrossRef]
- Razzaque, S.; Elias, S.M.; Haque, T.; Biswas, S.; Jewel, G.N.A.; Rahman, S.; Weng, X.; Ismail, A.M.; Walia, H.; Juenger, T.E.; et al. Gene expression analysis associated with salt stress in a reciprocally crossed rice population. Sci. Rep. 2019, 9, 1–17. [Google Scholar] [CrossRef]
- Bhattacharjee, A.; Sharma, R.; Jain, M. Over-expression of OsHOX24 confers enhanced susceptibility to abiotic stresses in transgenic rice via modulating stress-responsive gene expression. Front. Plant Sci. 2017, 8, 628. [Google Scholar] [CrossRef]


| Variables | Comparisons |
|---|---|
| Tissue types | Leaf vs. root |
| Genotypes (G) | HA351 (resistant) vs. RHA428 (susceptible) |
| Treatments (E) | Control vs. flooding |
| Time-points (1,2,3) | 1st day of flooding vs. 8th day flooding vs. 6th day of recovery |
| G × E | (HA351 vs. RHA428) × (control vs. flooding) |
| G × E at 1,2 or 3 | (HA351 vs. RHA428) × (control vs. flooding) at three different time-points |
| Example: G × E1_root | That is, DEGs from a mixed ANOVA of genotype (HA351 vs. RHA428) × treatment (control vs. flooding) interactions at time-point 1 in root tissue. |
| Tissue Type | Leaf | Root | ||||||
|---|---|---|---|---|---|---|---|---|
| Cultivar: Time-Point | DEG | DAS | DEG | DAS | ||||
| Up | Down | Up | Down | Up | Down | Up | Down | |
| HA351: 1st day of flooding | 6 | 35 | 22 | 136 | 781 | 554 | 220 | 136 |
| HA351: 8th day flooding | 355 | 151 | 48 | 420 | 1178 | 1416 | 153 | 377 |
| HA351: 6th day of recovery | 5 | 23 | 32 | 19 | 123 | 183 | 193 | 153 |
| RHA428: 1st day of flooding | 22 | 48 | 11 | 2 | 1106 | 644 | 791 | 113 |
| RHA428: 8th day flooding | 1006 | 294 | 31 | 183 | 2243 | 2825 | 23 | 233 |
| RHA428: 6th day of recovery | 6 | 6 | 3 | 39 | 451 | 796 | 143 | 234 |
Publisher’s Note: MDPI stays neutral with regard to jurisdictional claims in published maps and institutional affiliations. |
© 2021 by the authors. Licensee MDPI, Basel, Switzerland. This article is an open access article distributed under the terms and conditions of the Creative Commons Attribution (CC BY) license (http://creativecommons.org/licenses/by/4.0/).
Share and Cite
Lee, J.S.; Gao, L.; Guzman, L.M.; Rieseberg, L.H. Genome-Wide Expression and Alternative Splicing in Domesticated Sunflowers (Helianthus annuus L.) under Flooding Stress. Agronomy 2021, 11, 92. https://doi.org/10.3390/agronomy11010092
Lee JS, Gao L, Guzman LM, Rieseberg LH. Genome-Wide Expression and Alternative Splicing in Domesticated Sunflowers (Helianthus annuus L.) under Flooding Stress. Agronomy. 2021; 11(1):92. https://doi.org/10.3390/agronomy11010092
Chicago/Turabian StyleLee, Joon Seon, Lexuan Gao, Laura Melissa Guzman, and Loren H. Rieseberg. 2021. "Genome-Wide Expression and Alternative Splicing in Domesticated Sunflowers (Helianthus annuus L.) under Flooding Stress" Agronomy 11, no. 1: 92. https://doi.org/10.3390/agronomy11010092
APA StyleLee, J. S., Gao, L., Guzman, L. M., & Rieseberg, L. H. (2021). Genome-Wide Expression and Alternative Splicing in Domesticated Sunflowers (Helianthus annuus L.) under Flooding Stress. Agronomy, 11(1), 92. https://doi.org/10.3390/agronomy11010092