Genome Wide Identification and Analysis of the R2R3-MYB Transcription Factor Gene Family in the Mangrove Avicennia marina


Abstract
1. Introduction
2. Materials and Methods
2.1. Identification of R2R3-MYB Transcription Factors in A. marina Genome
2.2. Chromosomal Location and Nomenclature
2.3. Phylogenetic Analysis
2.4. Exon-Intron Structure and Conserved Motif Analysis
2.5. Duplication, dN/dS and Homology/Synteny Analysis
2.6. Conserved Motif Identification in Promoter Region
2.7. In Silico Expression Analysis
3. Results
3.1. R2R3-MYB Transcription Factor Family in Avicennia marina
3.2. Phylogenetic Analysis and Classification of R2R3 MYB Genes
3.3. Chromosomal Location and Gene Duplication
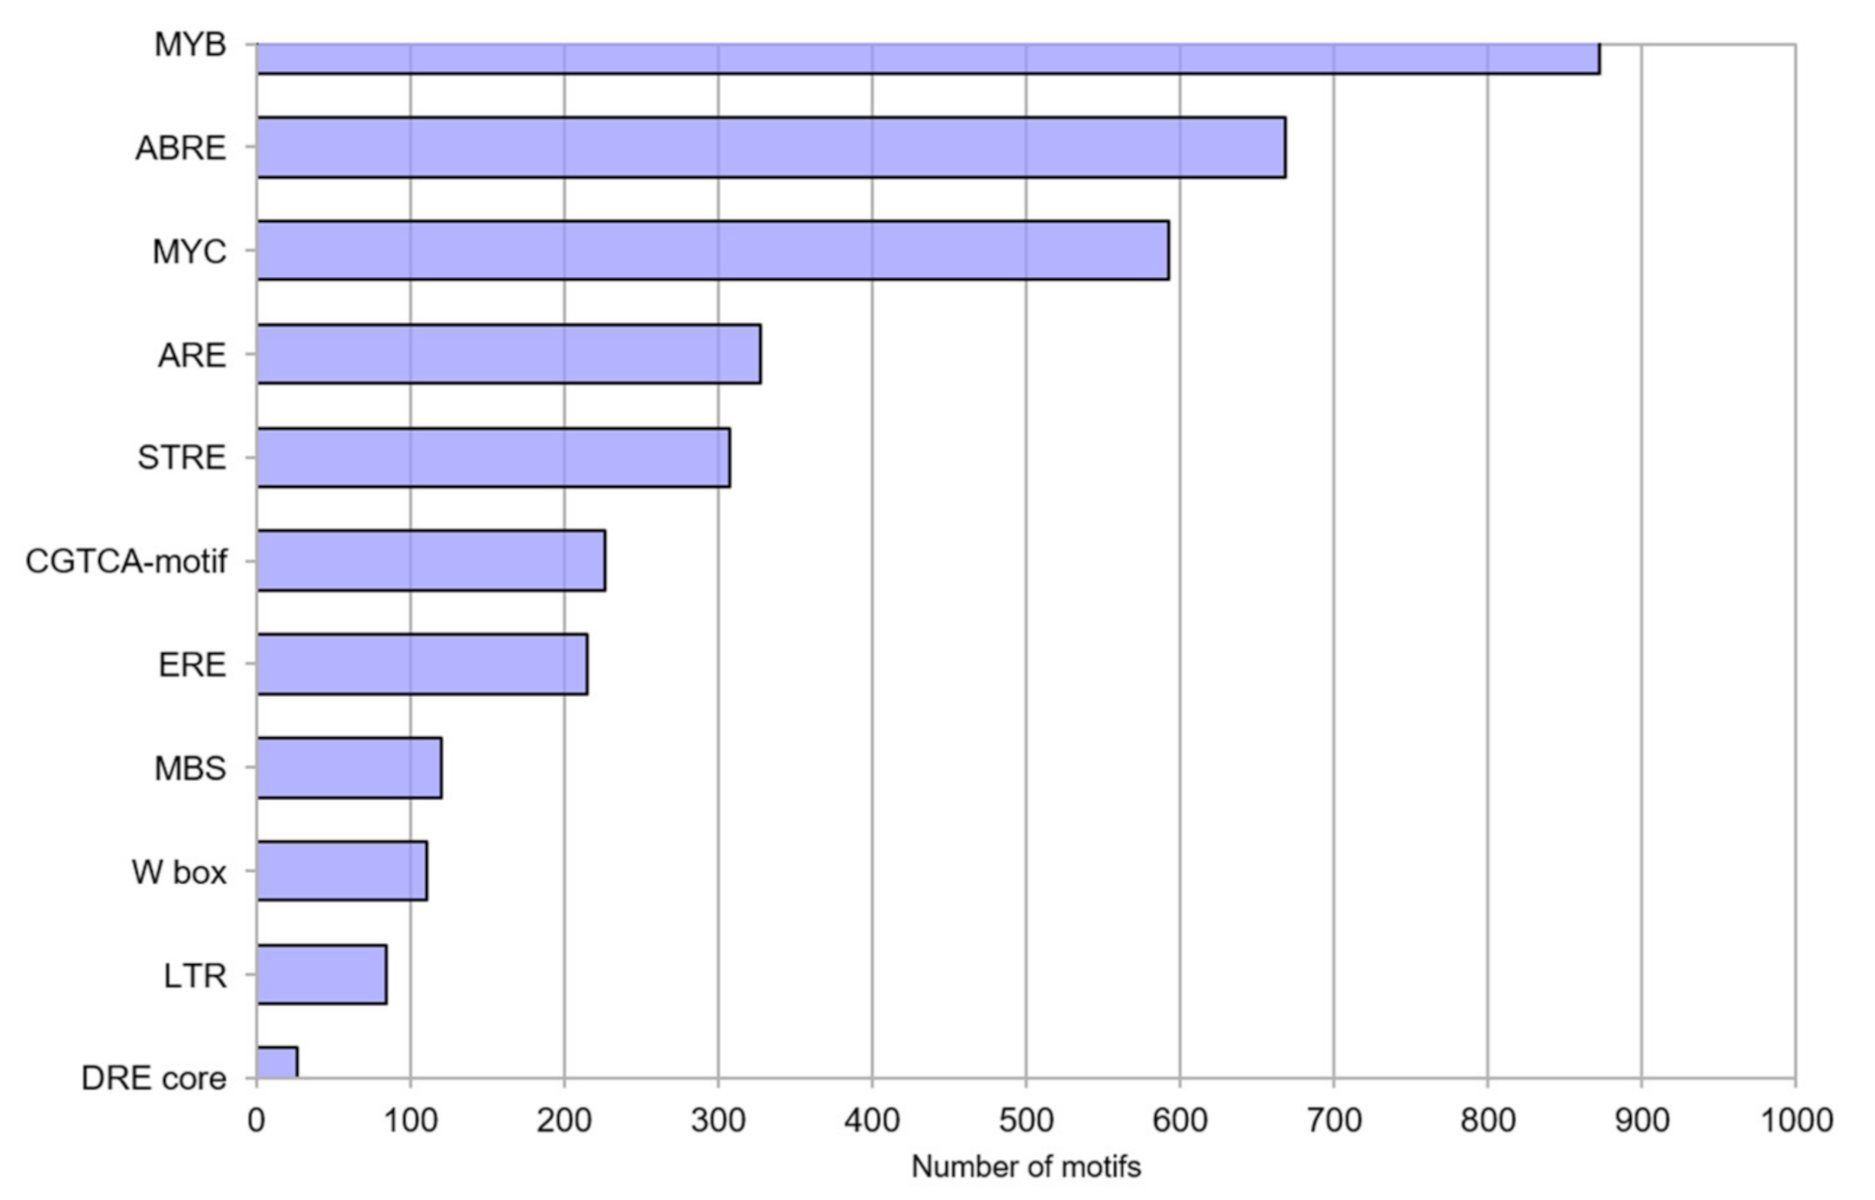
3.4. Promoter Motif Analysis
3.5. Homology with R2R3 MYB Genes from Rice and Arabidopsis
3.6. In Silico Gene Expression Analysis
4. Discussion
4.1. The Evolution of A. marina R2R3 MYB Gene Family
4.2. AmR2R3 MYB in the Regulation of Gene Expression During Drought and Salinity Stress
5. Conclusions
Supplementary Materials
Author Contributions
Funding
Data Availability Statement
Acknowledgments
Conflicts of Interest
References
- Anwar, A.; Kim, J.-K. Transgenic Breeding Approaches for Improving Abiotic Stress Tolerance: Recent Progress and Future Perspectives. Int. J. Mol. Sci. 2020, 21, 2695. [Google Scholar] [CrossRef]
- Lamers, J.; van der Meer, T.; Testerink, C. How Plants Sense and Respond to Stressful Environments. Plant Physiol. 2020, 182, 1624–1635. [Google Scholar] [CrossRef]
- Haak, D.C.; Fukao, T.; Grene, R.; Hua, Z.; Ivanov, R.; Perrella, G.; Li, S. Multilevel Regulation of Abiotic Stress Responses in Plants. Front. Plant Sci. 2017, 8, 1564. [Google Scholar] [CrossRef]
- Li, X.; Tang, Y.; Li, H.; Luo, W.; Zhou, C.; Zhang, L.; Lv, J. A Wheat R2R3 MYB Gene TaMpc1-D4 Negatively Regulates Drought Tolerance in Transgenic Arabidopsis and Wheat. Plant Sci. 2020, 299, 110613. [Google Scholar] [CrossRef]
- Baillo, E.H.; Kimotho, R.N.; Zhang, Z.; Xu, P. Transcription Factors Associated with Abiotic and Biotic Stress Tolerance and Their Potential for Crops Improvement. Genes 2019, 10, 771. [Google Scholar] [CrossRef]
- Wang, P.; Yang, C.; Chen, H.; Luo, L.; Leng, Q.; Li, S.; Han, Z.; Li, X.; Song, C.; Zhang, X.; et al. Exploring Transcription Factors Reveals Crucial Members and Regulatory Networks Involved in Different Abiotic Stresses in Brassica Napus L. BMC Plant Biol. 2018, 18, 202. [Google Scholar] [CrossRef]
- Zuo, C.; Tang, Y.; Fu, H.; Liu, Y.; Zhang, X.; Zhao, B.; Xu, Y. Elucidation and Analyses of the Regulatory Networks of Upland and Lowland Ecotypes of Switchgrass in Response to Drought and Salt Stresses. PLoS ONE 2018, 13, e0204426. [Google Scholar] [CrossRef]
- Mondal, S.K.; Roy, S. Genome-Wide Sequential, Evolutionary, Organizational and Expression Analyses of Phenylpropanoid Biosynthesis Associated MYB Domain Transcription Factors in Arabidopsis. J. Biomol. Struct. Dyn. 2018, 36, 1577–1601. [Google Scholar] [CrossRef]
- Muthamilarasan, M.; Khandelwal, R.; Yadav, C.B.; Bonthala, V.S.; Khan, Y.; Prasad, M. Identification and Molecular Characterization of MYB Transcription Factor Superfamily in C4 Model Plant Foxtail Millet (Setaria italica L.). PLoS ONE 2014, 9, e109920. [Google Scholar] [CrossRef]
- Wong, D.C.J.; Schlechter, R.; Vannozzi, A.; Höll, J.; Hmmam, I.; Bogs, J.; Tornielli, G.B.; Castellarin, S.D.; Matus, J.T. A Systems-Oriented Analysis of the Grapevine R2R3-MYB Transcription Factor Family Uncovers New Insights into the Regulation of Stilbene Accumulation. DNA Res. 2016, 23, 451–466. [Google Scholar] [CrossRef]
- Du, H.; Feng, B.-R.; Yang, S.-S.; Huang, Y.-B.; Tang, Y.-X. The R2R3-MYB Transcription Factor Gene Family in Maize. PLoS ONE 2012, 7, e37463. [Google Scholar] [CrossRef]
- Wilkins, O.; Nahal, H.; Foong, J.; Provart, N.J.; Campbell, M.M. Expansion and Diversification of the Populus R2R3-MYB Family of Transcription Factors. Plant Physiol. 2009, 149, 981–993. [Google Scholar] [CrossRef]
- He, Q.; Jones, D.C.; Li, W.; Xie, F.; Ma, J.; Sun, R.; Wang, Q.; Zhu, S.; Zhang, B. Genome-Wide Identification of R2R3-MYB Genes and Expression Analyses During Abiotic Stress in Gossypium Raimondii. Sci. Rep. 2016, 6, 22980. [Google Scholar] [CrossRef]
- Katiyar, A.; Smita, S.; Lenka, S.K.; Rajwanshi, R.; Chinnusamy, V.; Bansal, K.C. Genome-Wide Classification and Expression Analysis of MYB Transcription Factor Families in Rice and Arabidopsis. BMC Genom. 2012, 13, 544. [Google Scholar] [CrossRef]
- Jung, C.; Seo, J.S.; Han, S.W.; Koo, Y.J.; Kim, C.H.; Song, S.I.; Nahm, B.H.; Choi, Y.D.; Cheong, J.-J. Overexpression of AtMYB44 Enhances Stomatal Closure to Confer Abiotic Stress Tolerance in Transgenic Arabidopsis. Plant Physiol. 2008, 146, 623–635. [Google Scholar] [CrossRef]
- He, C.; Teixeira da Silva, J.A.; Wang, H.; Si, C.; Zhang, M.; Zhang, X.; Li, M.; Tan, J.; Duan, J. Mining MYB Transcription Factors from the Genomes of Orchids (Phalaenopsis and Dendrobium) and Characterization of an Orchid R2R3-MYB Gene Involved in Water-Soluble Polysaccharide Biosynthesis. Sci. Rep. 2019, 9, 13818. [Google Scholar] [CrossRef]
- Liu, J.; Osbourn, A.; Ma, P. MYB Transcription Factors as Regulators of Phenylpropanoid Metabolism in Plants. Mol. Plant 2015, 8, 689–708. [Google Scholar] [CrossRef]
- Stracke, R.; Werber, M.; Weisshaar, B. The R2R3-MYB Gene Family in Arabidopsis Thaliana. Curr. Opin. Plant Biol. 2001, 4, 447–456. [Google Scholar] [CrossRef]
- Paz-Ares, J.; Ghosal, D.; Wienand, U.; Peterson, P.A.; Saedler, H. The Regulatory C1 Locus of Zea Mays Encodes a Protein with Homology to Myb Proto-Oncogene Products and with Structural Similarities to Transcriptional Activators. EMBO J. 1987, 6, 3553–3558. [Google Scholar] [CrossRef]
- Zhao, Y.; Yang, Z.; Ding, Y.; Liu, L.; Han, X.; Zhan, J.; Wei, X.; Diao, Y.; Qin, W.; Wang, P.; et al. Over-Expression of an R2R3 MYB Gene, GhMYB73, Increases Tolerance to Salt Stress in Transgenic Arabidopsis. Plant Sci. 2019, 286, 28–36. [Google Scholar] [CrossRef]
- Yu, Y.; Bi, C.; Wang, Q.; Ni, Z. Overexpression of TaSIM Provides Increased Drought Stress Tolerance in Transgenic Arabidopsis. Biochem. Biophys. Res. Commun. 2019, 512, 66–71. [Google Scholar] [CrossRef]
- Zhang, Y.-L.; Zhang, C.-L.; Wang, G.-L.; Wang, Y.-X.; Qi, C.-H.; Zhao, Q.; You, C.-X.; Li, Y.-Y.; Hao, Y.-J. The R2R3 MYB Transcription Factor MdMYB30 Modulates Plant Resistance against Pathogens by Regulating Cuticular Wax Biosynthesis. BMC Plant Biol. 2019, 19, 362. [Google Scholar] [CrossRef] [PubMed]
- Tang, Y.; Bao, X.; Zhi, Y.; Wu, Q.; Guo, Y.; Yin, X.; Zeng, L.; Li, J.; Zhang, J.; He, W.; et al. Overexpression of a MYB Family Gene, OsMYB6, Increases Drought and Salinity Stress Tolerance in Transgenic Rice. Front. Plant Sci. 2019, 10, 168. [Google Scholar] [CrossRef]
- Dai, X.; Xu, Y.; Ma, Q.; Xu, W.; Wang, T.; Xue, Y.; Chong, K. Overexpression of an R1R2R3 MYB Gene, OsMYB3R-2, Increases Tolerance to Freezing, Drought, and Salt Stress in Transgenic Arabidopsis. Plant Physiol. 2007, 143, 1739–1751. [Google Scholar] [CrossRef]
- Pasquali, G.; Biricolti, S.; Locatelli, F.; Baldoni, E.; Mattana, M. Osmyb4 Expression Improves Adaptive Responses to Drought and Cold Stress in Transgenic Apples. Plant Cell Rep. 2008, 27, 1677–1686. [Google Scholar] [CrossRef]
- Wang, Z.L.; Li, P.H.; Fredricksen, M.; Gong, Z.Z.; Kim, C.S.; Zhang, C.; Bohnert, H.J.; Zhu, J.K.; Bressan, R.A.; Hasegawa, P.M.; et al. Expressed Sequence Tags from Thellungiella Halophila, a New Model to Study Plant Salt-Tolerance. Plant Sci. 2004, 166, 609–616. [Google Scholar] [CrossRef]
- Uno, Y.; Furihata, T.; Abe, H.; Yoshida, R.; Shinozaki, K.; Yamaguchi-Shinozaki, K. Arabidopsis Basic Leucine Zipper Transcription Factors Involved in an Abscisic Acid-Dependent Signal Transduction Pathway under Drought and High-Salinity Conditions. Proc. Natl. Acad. Sci. USA 2000, 97, 11632–11637. [Google Scholar] [CrossRef]
- Oh, S.J.; Kim, Y.S.; Kwon, C.W.; Park, H.K.; Jeong, J.S.; Kim, J.K. Overexpression of the Transcription Factor AP37 in Rice Improves Grain Yield under Drought Conditions. Plant Physiol. 2009, 150, 1368–1379. [Google Scholar] [CrossRef]
- Ganesan, G.; Sankararamasubramanian, H.M.; Harikrishnan, M.; Ganpudi, A.; Parida, A. A MYB Transcription Factor from the Grey Mangrove Is Induced by Stress and Confers NaCl Tolerance in Tobacco. J. Exp. Bot. 2012, 63, 4549–4561. [Google Scholar] [CrossRef]
- Tomlinson, P.B. The Botany of Mangroves, 1986 the Botany of Mangroves, 1st ed.; Cambridge University Press: Cambridge, UK, 2016. [Google Scholar]
- Parida, A.; George, S. Sustaining and Enhancing Crop Productivity in an Era of Climate Change. Curr. Sci. 2015, 109, 462–473. [Google Scholar]
- Tuteja, N.; Gill, S.S.; Tiburcio, A.F.; Tuteja, R. Improving Crop Resistance to Abiotic Stress; John Wiley & Sons: Hoboken, NJ, USA, 2012. [Google Scholar]
- Joshi, R.; Mangu, V.R.; Bedre, R.; Sanchez, L.; Pilcher, W.; Zandkarimi, H.; Baisakh, N. Salt Adaptation Mechanisms of Halophytes: Improvement of Salt Tolerance in Crop Plants. In Elucidation of Abiotic Stress Signaling in Plants: Functional Genomics Perspectives, Volume 2; Pandey, G.K., Ed.; Springer: New York, NY, USA, 2015; pp. 243–279. [Google Scholar] [CrossRef]
- Das, S.K.; Patra, J.K.; Thatoi, H. Antioxidative Response to Abiotic and Biotic Stresses in Mangrove Plants: A Review. Int. Rev. Hydrobiol. 2016, 101, 3–19. [Google Scholar] [CrossRef]
- Friis, G.; Vizueta, J.; Nelson, D.R.; Khraiwesh, B.; Qudeimat, E.; Salehi-Ashtiani, K.; Ortega, A.; Marshell, A.; Duarte, C.M.; Burt, J.A. A High-Quality Genome Assembly and Annotation of the Gray Mangrove, Avicennia Marina. bioRxiv 2020. [Google Scholar] [CrossRef]
- Tombuloglu, H. Genome-Wide Identification and Expression Analysis of R2R3, 3R- and 4R-MYB Transcription Factors during Lignin Biosynthesis in Flax (Linum Usitatissimum). Genomics 2020, 112, 782–795. [Google Scholar] [CrossRef] [PubMed]
- Gasteiger, E.; Hoogland, C.; Gattiker, A.; Duvaud, S.; Wilkins, M.R.; Appel, R.D.; Bairoch, A. Protein Identification and Analysis Tools on the ExPASy Server. In The Proteomics Protocols Handbook; Walker, J.M., Ed.; Springer Protocols Handbooks; Humana Press: Totowa, NJ, USA, 2005; pp. 571–607. [Google Scholar] [CrossRef]
- Savojardo, C.; Martelli, P.L.; Fariselli, P.; Profiti, G.; Casadio, R. BUSCA: An Integrative Web Server to Predict Subcellular Localization of Proteins. Nucleic Acids Res. 2018, 46, W459–W466. [Google Scholar] [CrossRef] [PubMed]
- Voorrips, R.E. MapChart: Software for the Graphical Presentation of Linkage Maps and QTLs. J. Hered. 2002, 93, 77–78. [Google Scholar] [CrossRef]
- Kumar, S.; Stecher, G.; Li, M.; Knyaz, C.; Tamura, K. MEGA X: Molecular Evolutionary Genetics Analysis across Computing Platforms. Mol. Biol. Evol. 2018, 35, 1547–1549. [Google Scholar] [CrossRef]
- Wang, Y.; Tang, H.; DeBarry, J.D.; Tan, X.; Li, J.; Wang, X.; Lee, T.; Jin, H.; Marler, B.; Guo, H.; et al. MCScanX: A Toolkit for Detection and Evolutionary Analysis of Gene Synteny and Collinearity. Nucleic Acids Res. 2012, 40, e49. [Google Scholar] [CrossRef]
- Quinlan, A.R.; Hall, I.M. BEDTools: A Flexible Suite of Utilities for Comparing Genomic Features. Bioinformatics 2010, 26, 841–842. [Google Scholar] [CrossRef]
- Lescot, M.; Déhais, P.; Thijs, G.; Marchal, K.; Moreau, Y.; Van de Peer, Y.; Rouzé, P.; Rombauts, S. PlantCARE, a Database of Plant Cis-Acting Regulatory Elements and a Portal to Tools for in Silico Analysis of Promoter Sequences. Nucleic Acids Res. 2002, 30, 325–327. [Google Scholar] [CrossRef]
- Grabherr, M.G.; Haas, B.J.; Yassour, M.; Levin, J.Z.; Thompson, D.A.; Amit, I.; Adiconis, X.; Fan, L.; Raychowdhury, R.; Zeng, Q.; et al. Full-Length Transcriptome Assembly from RNA-Seq Data without a Reference Genome. Nat. Biotechnol. 2011, 29, 644–652. [Google Scholar] [CrossRef]
- Haas, B.J.; Papanicolaou, A.; Yassour, M.; Grabherr, M.; Blood, P.D.; Bowden, J.; Couger, M.B.; Eccles, D.; Li, B.; Lieber, M.; et al. De Novo Transcript Sequence Reconstruction from RNA-Seq Using the Trinity Platform for Reference Generation and Analysis. Nat. Protoc. 2013, 8, 1494–1512. [Google Scholar] [CrossRef]
- Howe, E.; Holton, K.; Nair, S.; Schlauch, D.; Sinha, R.; Quackenbush, J. MeV: MultiExperiment Viewer. In Biomedical Informatics for Cancer Research; Ochs, M.F., Casagrande, J.T., Davuluri, R.V., Eds.; Springer: Boston, MA, USA, 2010; pp. 267–277. [Google Scholar] [CrossRef]
- Yanagisawa, S. Transcription Factors in Plants: Physiological Functions and Regulation of Expression. J. Plant Res. 1998, 111, 363–371. [Google Scholar] [CrossRef]
- Zörb, C.; Geilfus, C.-M.; Dietz, K.-J. Salinity and Crop Yield. Plant Biol. 2019, 21 (Suppl. S1), 31–38. [Google Scholar] [CrossRef]
- Kavitha, K.; George, S.; Venkataraman, G.; Parida, A. A Salt-Inducible Chloroplastic Monodehydroascorbate Reductase from Halophyte Avicennia Marina Confers Salt Stress Tolerance on Transgenic Plants. Biochimie 2010, 92, 1321–1329. [Google Scholar] [CrossRef] [PubMed]
- Khan, S.-A.; Li, M.-Z.; Wang, S.-M.; Yin, H.-J. Revisiting the Role of Plant Transcription Factors in the Battle against Abiotic Stress. Int. J. Mol. Sci. 2018, 19, 1634. [Google Scholar] [CrossRef] [PubMed]
- Cao, Y.; Han, Y.; Li, D.; Lin, Y.; Cai, Y. MYB Transcription Factors in Chinese Pear (Pyrus Bretschneideri Rehd.): Genome-Wide Identification, Classification, and Expression Profiling during Fruit Development. Front. Plant Sci. 2016, 7, 577. [Google Scholar] [CrossRef] [PubMed]
- Yan, Q.; Wu, F.; Ma, T.; Zong, X.; Ma, Q.; Li, J.; Zhao, Y.; Wang, Y.; Zhang, J. Comprehensive Analysis of BZIP Transcription Factors Uncovers Their Roles during Dimorphic Floret Differentiation and Stress Response in Cleistogenes Songorica. BMC Genom. 2019, 20, 760. [Google Scholar] [CrossRef] [PubMed]
- Biłas, R.; Szafran, K.; Hnatuszko-Konka, K.; Kononowicz, A.K. Cis-Regulatory Elements Used to Control Gene Expression in Plants. Plant Cell Tissue Organ Cult. 2016, 127, 269–287. [Google Scholar] [CrossRef]
- Heinekamp, T.; Kuhlmann, M.; Lenk, A.; Strathmann, A.; Dröge-Laser, W. The Tobacco BZIP Transcription Factor BZI-1 Binds to G-Box Elements in the Promoters of Phenylpropanoid Pathway Genes in Vitro, but It Is Not Involved in Their Regulation in Vivo. Mol. Gen. Genom. 2002, 267, 16–26. [Google Scholar] [CrossRef]
- Heinekamp, T.; Strathmann, A.; Kuhlmann, M.; Froissard, M.; Müller, A.; Perrot-Rechenmann, C.; Dröge-Laser, W. The Tobacco BZIP Transcription Factor BZI-1 Binds the GH3 Promoter in Vivo and Modulates Auxin-Induced Transcription. Plant J. 2004, 38, 298–309. [Google Scholar] [CrossRef]
- Abe, H.; Yamaguchi-Shinozaki, K.; Urao, T.; Iwasaki, T.; Hosokawa, D.; Shinozaki, K. Role of Arabidopsis MYC and MYB Homologs in Drought- and Abscisic Acid-Regulated Gene Expression. Plant Cell 1997, 9, 1859–1868. [Google Scholar] [CrossRef] [PubMed]
- Klepikova, A.V.; Kasianov, A.S.; Gerasimov, E.S.; Logacheva, M.D.; Penin, A.A. A high resolution map of the Arabidopsis thaliana developmental transcriptome based on RNA-seq profiling. Plant J. 2016, 88, 1058–1070. [Google Scholar] [CrossRef] [PubMed]
- Abe, H.; Urao, T.; Ito, T.; Seki, M.; Shinozaki, K.; Yamaguchi-Shinozaki, K. Arabidopsis AtMYC2 (BHLH) and AtMYB2 (MYB) Function as Transcriptional Activators in Abscisic Acid Signaling. Plant Cell 2003, 15, 63–78. [Google Scholar] [CrossRef] [PubMed]
- Yamaguchi-Shinozaki, K.; Shinozaki, K. Organization of Cis-Acting Regulatory Elements in Osmotic- and Cold-Stress-Responsive Promoters. Trends Plant Sci. 2005, 10, 88–94. [Google Scholar] [CrossRef] [PubMed]
- Isayenkov, S.V.; Maathuis, F.J. Plant salinity stress: Many unanswered questions remain. Front. Plant Sci. 2019, 10, 8. [Google Scholar]


| Accession | Protein Length (aa) | Protein Molecular Weight (in kDa) | Isoelectric Point (pI) | Subcellular Localisation |
|---|---|---|---|---|
| AmMYB1 | 307 | 34.68 | 6.20 | nucleus |
| AmMYB2 | 349 | 38.13 | 5.21 | nucleus |
| AmMYB4 | 146 | 16.72 | 9.68 | nucleus |
| AmMYB6 | 304 | 34.17 | 8.90 | nucleus |
| AmMYB7 | 156 | 17.61 | 10.28 | chloroplast |
| AmMYB9 | 335 | 37.07 | 5.93 | nucleus |
| AmMYB10 | 307 | 33.42 | 7.78 | nucleus |
| AmMYB11 | 373 | 42.58 | 6.08 | nucleus |
| AmMYB12 | 287 | 33.23 | 9.58 | nucleus |
| AmMYB13 | 533 | 59.68 | 7.63 | endomembrane system |
| AmMYB14 | 100 | 11.46 | 9.83 | nucleus |
| AmMYB16 | 295 | 31.79 | 8.65 | nucleus |
| AmMYB17 | 441 | 48.95 | 8.55 | nucleus |
| AmMYB19 | 386 | 41.64 | 6.17 | nucleus |
| AmMYB20 | 216 | 24.35 | 9.38 | chloroplast |
| AmMYB21 | 279 | 31.89 | 5.71 | nucleus |
| AmMYB22 | 173 | 20.09 | 5.85 | chloroplast |
| AmMYB24 | 214 | 23.67 | 9.54 | nucleus |
| AmMYB25 | 470 | 51.73 | 5.38 | nucleus |
| AmMYB26 | 275 | 31.23 | 7.69 | nucleus |
| AmMYB29 | 372 | 42.06 | 8.42 | chloroplast |
| AmMYB30 | 273 | 30.71 | 8.97 | nucleus |
| AmMYB32 | 353 | 38.86 | 7.55 | nucleus |
| AmMYB33 | 321 | 35.03 | 8.98 | nucleus |
| AmMYB34 | 235 | 25.83 | 9.30 | nucleus |
| AmMYB36 | 274 | 30.40 | 9.11 | nucleus |
| AmMYB37 | 275 | 31.30 | 5.64 | nucleus |
| AmMYB38 | 273 | 30.48 | 9.06 | nucleus |
| AmMYB39 | 301 | 33.26 | 8.78 | nucleus |
| AmMYB40 | 295 | 32.96 | 8.62 | nucleus |
| AmMYB41 | 420 | 46.47 | 6.13 | extracellular space |
| AmMYB42 | 330 | 37.25 | 7.88 | nucleus |
| AmMYB45 | 1159 | 128.76 | 6.09 | nucleus |
| AmMYB46 | 307 | 34.10 | 9.86 | chloroplast |
| AmMYB47 | 189 | 21.43 | 9.52 | nucleus |
| AmMYB49 | 331 | 36.60 | 6.76 | nucleus |
| AmMYB50 | 291 | 31.09 | 8.55 | nucleus |
| AmMYB51 | 379 | 43.13 | 5.65 | nucleus |
| AmMYB53 | 195 | 22.89 | 9.31 | nucleus |
| AmMYB54 | 250 | 28.53 | 7.67 | nucleus |
| AmMYB55 | 236 | 27.15 | 6.19 | nucleus |
| AmMYB57 | 311 | 35.24 | 5.92 | nucleus |
| AmMYB58 | 529 | 59.04 | 7.61 | nucleus |
| AmMYB60 | 294 | 32.99 | 6.16 | nucleus |
| AmMYB61 | 411 | 45.86 | 6.19 | nucleus |
| AmMYB62 | 273 | 29.06 | 8.15 | nucleus |
| AmMYB63 | 261 | 28.93 | 5.22 | nucleus |
| AmMYB65 | 358 | 40.16 | 9.06 | nucleus |
| AmMYB69 | 280 | 30.61 | 9.05 | nucleus |
| AmMYB71 | 327 | 36.19 | 6.20 | nucleus |
| AmMYB72 | 304 | 32.81 | 6.45 | nucleus |
| AmMYB73 | 286 | 32.95 | 9.27 | nucleus |
| AmMYB74 | 465 | 51.35 | 6.38 | nucleus |
| AmMYB76 | 959 | 106.61 | 5.09 | nucleus |
| AmMYB77 | 597 | 63.17 | 6.22 | nucleus |
| AmMYB79 | 283 | 32.45 | 5.22 | extracellular space |
| AmMYB80 | 205 | 22.99 | 6.10 | nucleus |
| AmMYB82 | 320 | 35.69 | 6.27 | nucleus |
| AmMYB83 | 314 | 34.90 | 9.21 | nucleus |
| AmMYB86 | 568 | 61.70 | 4.88 | nucleus |
| AmMYB87 | 183 | 20.58 | 4.94 | nucleus |
| AmMYB88 | 308 | 34.32 | 8.86 | nucleus |
| AmMYB91 | 180 | 20.46 | 6.01 | nucleus |
| AmMYB98 | 295 | 33.90 | 7.06 | nucleus |
| AmMYB100 | 295 | 31.74 | 6.80 | nucleus |
| AmMYB101 | 290 | 32.41 | 6.72 | nucleus |
| AmMYB102 | 333 | 36.08 | 7.23 | chloroplast |
| AmMYB105 | 1046 | 115.14 | 5.10 | nucleus |
| AmMYB106 | 575 | 65.27 | 5.73 | nucleus |
| AmMYB107 | 181 | 20.94 | 6.36 | nucleus |
| AmMYB108 | 353 | 39.25 | 6.03 | nucleus |
| AmMYB112 | 367 | 41.38 | 5.93 | nucleus |
| AmMYB116 | 275 | 31.23 | 9.46 | nucleus |
| AmMYB117 | 385 | 43.53 | 9.31 | nucleus |
| AmMYB118 | 320 | 34.81 | 9.34 | nucleus |
| AmMYB119 | 353 | 39.43 | 8.04 | nucleus |
| AmMYB120 | 202 | 22.88 | 6.65 | nucleus |
| AmMYB121 | 482 | 52.81 | 7.55 | nucleus |
| AmMYB122 | 334 | 37.37 | 5.62 | nucleus |
| AmMYB127 | 328 | 36.67 | 6.70 | nucleus |
| AmMYB128 | 431 | 47.87 | 6.95 | nucleus |
| AmMYB129 | 299 | 32.84 | 9.75 | nucleus |
| AmMYB130 | 121 | 13.72 | 7.19 | extracellular space |
| AmMYB131 | 252 | 28.48 | 8.84 | nucleus |
| AmMYB132 | 329 | 36.00 | 5.09 | nucleus |
| AmMYB133 | 321 | 36.29 | 8.98 | extracellular space |
| AmMYB134 | 386 | 43.40 | 5.73 | nucleus |
| AmMYB135 | 232 | 25.94 | 6.24 | nucleus |
| AmMYB137 | 259 | 29.05 | 4.65 | chloroplast |
| AmMYB138 | 551 | 59.97 | 5.11 | nucleus |
| AmMYB139 | 321 | 36.13 | 6.21 | nucleus |
| AmMYB140 | 271 | 31.28 | 6.45 | nucleus |
| AmMYB143 | 251 | 28.41 | 6.13 | nucleus |
| AmMYB146 | 228 | 25.90 | 9.73 | nucleus |
| AmMYB147 | 343 | 38.22 | 7.92 | nucleus |
| AmMYB151 | 307 | 34.58 | 7.90 | nucleus |
| AmMYB152 | 403 | 43.71 | 5.25 | nucleus |
| AmMYB153 | 345 | 38.36 | 9.33 | chloroplast |
| AmMYB155 | 376 | 41.99 | 8.99 | nucleus |
| AmMYB157 | 424 | 47.74 | 6.14 | nucleus |
| AmMYB158 | 261 | 28.50 | 9.69 | nucleus |
| AmMYB159 | 352 | 39.46 | 6.45 | nucleus |
| AmMYB161 | 258 | 29.06 | 8.94 | nucleus |
| AmMYB163 | 302 | 33.13 | 9.38 | nucleus |
| AmMYB164 | 425 | 46.93 | 6.89 | nucleus |
| AmMYB166 | 539 | 58.42 | 4.87 | nucleus |
| AmMYB167 | 338 | 38.15 | 7.42 | nucleus |
| AmMYB168 | 242 | 28.69 | 9.55 | nucleus |
| AmMYB172 | 240 | 27.00 | 6.96 | nucleus |
| AmMYB174 | 405 | 45.33 | 8.93 | nucleus |
| AmMYB175 | 359 | 40.00 | 6.01 | nucleus |
| AmMYB177 | 308 | 34.25 | 8.47 | nucleus |
| AmMYB178 | 331 | 36.56 | 8.19 | nucleus |
| AmMYB181 | 282 | 30.99 | 9.48 | nucleus |
| AmMYB182 | 535 | 59.41 | 8.17 | nucleus |
| AmMYB183 | 361 | 41.32 | 9.15 | nucleus |
| AmMYB184 | 303 | 34.58 | 7.27 | nucleus |
| AmMYB185 | 253 | 28.50 | 9.15 | nucleus |
| AmMYB187 | 416 | 46.08 | 6.64 | nucleus |
| AmMYB189 | 323 | 35.53 | 8.94 | nucleus |
| AmMYB190 | 320 | 35.91 | 5.46 | nucleus |
| AmMYB191 | 266 | 30.00 | 9.12 | nucleus |
| AmMYB192 | 463 | 50.47 | 6.40 | nucleus |
| AmMYB194 | 994 | 110.87 | 5.20 | nucleus |
| AmMYB196 | 1748 | 191.24 | 6.20 | nucleus |
| AmMYB198 | 338 | 36.80 | 9.25 | nucleus |
| AmMYB199 | 482 | 54.22 | 5.75 | nucleus |
| AmMYB201 | 398 | 43.35 | 6.03 | nucleus |
| AmMYB202 | 386 | 42.74 | 7.23 | nucleus |
| AmMYB204 | 314 | 34.54 | 7.72 | nucleus |
| AmMYB205 | 135 | 15.62 | 10.20 | nucleus |
| AmMYB206 | 228 | 25.45 | 9.08 | nucleus |
| AmMYB208 | 317 | 36.35 | 9.36 | nucleus |
| AmMYB209 | 288 | 31.91 | 8.84 | nucleus |
| AmMYB211 | 343 | 38.51 | 6.28 | nucleus |
| AmMYB212 | 269 | 30.88 | 5.79 | nucleus |
| AmMYB213 | 284 | 31.65 | 9.05 | nucleus |
| AmMYB214 | 294 | 31.42 | 8.96 | nucleus |
| AmMYB216 | 287 | 32.41 | 5.93 | nucleus |
| AmMYB218 | 483 | 54.26 | 6.23 | nucleus |
| AmMYB220 | 348 | 38.90 | 8.80 | endomembrane system |
| AmMYB221 | 336 | 37.14 | 8.12 | nucleus |
| AmMYB222 | 315 | 35.43 | 4.98 | nucleus |
| AmMYB225 | 113 | 12.98 | 10.13 | nucleus |
| AmMYB226 | 108 | 12.31 | 10.05 | nucleus |
| AmMYB227 | 211 | 24.32 | 7.01 | nucleus |
| AmMYB228 | 334 | 37.68 | 5.34 | nucleus |
| AmMYB229 | 385 | 41.70 | 6.28 | nucleus |
| AmMYB230 | 265 | 29.92 | 9.43 | chloroplast |
| AmMYB231 | 251 | 28.28 | 5.48 | nucleus |
| AmMYB232 | 325 | 35.58 | 7.76 | nucleus |
| AmMYB233 | 351 | 39.47 | 6.55 | nucleus |
| AmMYB234 | 269 | 31.22 | 9.30 | chloroplast |
| AmMYB235 | 148 | 16.54 | 10.15 | nucleus |
| AmMYB236 | 478 | 52.71 | 8.68 | nucleus |
| AmMYB237 | 302 | 34.65 | 6.17 | nucleus |
| AmMYB240 | 244 | 27.54 | 5.62 | nucleus |
| AmMYB241 | 258 | 29.42 | 6.08 | nucleus |
| AmMYB242 | 354 | 40.16 | 7.17 | nucleus |
| AmMYB244 | 303 | 32.14 | 9.21 | nucleus |
| AmMYB245 | 612 | 67.24 | 7.47 | nucleus |
| AmMYB247 | 321 | 35.66 | 9.07 | nucleus |
| AmMYB248 | 342 | 38.21 | 5.63 | nucleus |
| AmMYB250 | 417 | 46.73 | 6.56 | nucleus |
| AmMYB251 | 313 | 34.57 | 8.99 | mitochondrion |
| AmMYB253 | 252 | 28.07 | 9.09 | nucleus |
| AmMYB255 | 308 | 34.72 | 8.42 | nucleus |
| AmMYB256 | 399 | 43.21 | 5.59 | nucleus |
| AmMYB257 | 312 | 34.83 | 7.53 | chloroplast |
| AmMYB259 | 415 | 46.14 | 8.70 | nucleus |
| AmMYB260 | 217 | 23.93 | 9.15 | nucleus |
| AmMYB262 | 334 | 37.34 | 8.15 | nucleus |
| AmMYB263 | 383 | 42.63 | 8.94 | nucleus |
| AmMYB265 | 351 | 39.18 | 5.54 | nucleus |
| AmMYB266 | 332 | 38.23 | 8.40 | nucleus |
| AmMYB267 | 251 | 28.39 | 7.31 | nucleus |
| AmMYB268 | 519 | 56.12 | 7.25 | chloroplast |
| AmMYB271 | 377 | 42.75 | 5.76 | nucleus |
| AmMYB274 | 332 | 36.77 | 6.87 | nucleus |
| AmMYB275 | 330 | 37.51 | 6.73 | chloroplast |
| AmMYB277 | 370 | 40.70 | 7.61 | nucleus |
| AmMYB279 | 472 | 52.65 | 7.11 | nucleus |
| AmMYB280 | 325 | 35.50 | 9.14 | nucleus |
| AmMYB283 | 219 | 24.82 | 7.87 | nucleus |
| AmMYB284 | 1743 | 191.10 | 5.83 | nucleus |
| Tandem Duplication Events | ||||
|---|---|---|---|---|
| Gene Pair | dN | dS | dN/dS | Type of selection |
| AmMYB222/AmMYB225 | 0.3481 | 2.708 | 0.1285 | Purifying |
| AmMYB225/AmMYB226 | 0.1159 | 0.1196 | 0.9684 | Purifying/Neutral |
| AmMYB240/AmMYB241 | 0.3453 | 0.9179 | 0.3761 | Purifying |
| AmMYB266/AmMYB267 | 0.5621 | 1.9159 | 0.2934 | Purifying |
| AmMYB33/AmMYB34 | 0.4598 | 7.248 | 0.0634 | Purifying |
| AmMYB53/AmMYB54 | 0.2837 | 0.6626 | 0.4281 | Purifying |
| AmMYB80/AmMYB82 | 0.6197 | 23.7159 | 0.0261 | Purifying |
| Collinear duplications | ||||
| AmMYB151/AmMYB255 | 0.1009 | 0.6072 | 0.1662 | Purifying |
| AmMYB152/AmMYB256 | 0.1861 | 0.441 | 0.4221 | Purifying |
| AmMYB155/AmMYB257 | 0.2913 | 0.7077 | 0.4116 | Purifying |
| AmMYB157/AmMYB259 | 0.162 | 0.5626 | 0.2879 | Purifying |
| AmMYB158/AmMYB260 | 0.2732 | 0.8214 | 0.3326 | Purifying |
| AmMYB159/AmMYB262 | 0.1536 | 0.5262 | 0.292 | Purifying |
| Name of the Motif | Motif Sequence | Function |
|---|---|---|
| ABRE | TACGTG; ACGTG; CACGTA; CACGTG; CGCACGTGTC; CGTACGTGCA; AACCCGG | cis-acting element involved in the abscisic acid responsiveness |
| ARE | AAACCA | cis-acting regulatory element essential for the anaerobic induction |
| CGTCA-motif | CGTCA | cis-acting regulatory element involved in the MeJA-responsiveness |
| DRE core | GCCGAC | cis-acting regulatory element involved in cold and dehydration response |
| ERE | ATTTTAAA | cis-acting regulatory element involved in oxidative stress response |
| LTR | CCGAAA | cis-acting element involved in low-temperature responsiveness |
| MBS | CAACTG | MYB binding site involved in drought-inducibility |
| MYB | TAACCA; CAACCA; CAACAG; CAACTG; TAACTG; TAACCA | cis-acting element involved in drought responsiveness |
| MYC | CATGTG; CATTTG; TCTCTTA; CAATTG | cis-acting element involved in drought responsiveness |
| STRE | AGGGG | cis-regulatory element able to mediate transcriptional induction by different forms of stress |
| W box | TTGACC | cis-regulatory element that acts as a binding site for WRKY TFs |
Publisher’s Note: MDPI stays neutral with regard to jurisdictional claims in published maps and institutional affiliations. |
© 2021 by the authors. Licensee MDPI, Basel, Switzerland. This article is an open access article distributed under the terms and conditions of the Creative Commons Attribution (CC BY) license (http://creativecommons.org/licenses/by/4.0/).
Share and Cite
Pradhan, S.; Shyamli, P.S.; Suranjika, S.; Parida, A. Genome Wide Identification and Analysis of the R2R3-MYB Transcription Factor Gene Family in the Mangrove Avicennia marina. Agronomy 2021, 11, 123. https://doi.org/10.3390/agronomy11010123
Pradhan S, Shyamli PS, Suranjika S, Parida A. Genome Wide Identification and Analysis of the R2R3-MYB Transcription Factor Gene Family in the Mangrove Avicennia marina. Agronomy. 2021; 11(1):123. https://doi.org/10.3390/agronomy11010123
Chicago/Turabian StylePradhan, Seema, P Sushree Shyamli, Sandhya Suranjika, and Ajay Parida. 2021. "Genome Wide Identification and Analysis of the R2R3-MYB Transcription Factor Gene Family in the Mangrove Avicennia marina" Agronomy 11, no. 1: 123. https://doi.org/10.3390/agronomy11010123
APA StylePradhan, S., Shyamli, P. S., Suranjika, S., & Parida, A. (2021). Genome Wide Identification and Analysis of the R2R3-MYB Transcription Factor Gene Family in the Mangrove Avicennia marina. Agronomy, 11(1), 123. https://doi.org/10.3390/agronomy11010123