1. Introduction
Soil may contribute to the implementation of several Sustainable Development Goals (SDGs), including the mitigation of global climatic warming through carbon (C) sequestration [
1]. On a global scale, the accumulation of carbon in the form of soil organic matter (SOM) contributes to multiple soil-related ecosystem services [
2] and benefits soil health and quality [
3]. Additionally, the contribution of particular soil types to the SDGs’ implementation has been reported, with an emphasis on soils rich in organic matter [
4]. Agricultural soils represent a promising opportunity for the management of C stocks. The interest in developing strategies for soil organic carbon (SOC) sequestration is related to the fact that this process can achieve significant reductions in greenhouse gas emissions by providing a level of CO
2 in the atmosphere that prevents an increase in the global average temperature of more than 2 °C. In recent years, many studies have focused on C storage, including the reduction of its losses, by optimizing agricultural management. Increasing the C stock in arable land soils improves both soil health and the environment, so it is recognized as a “win–win strategy” [
5]. Alternative farming methods have been tested in many countries regarding the use of their potential to optimize carbon and nitrogen cycles in agroecosystems [
6].
C sequestration by arable soils means that they can be considered as a significant resource in climate change mitigation at a low cost and allows the implementation of soil managing techniques aimed at SOC sequestration on a global scale. As a practical development of this concept, the “4 per 1000” initiative was put forward at the 21st Convention of Parties (COP 21) of the United Nations Framework Convention on Climate Change (UNFCCC). According to this initiative, an annual increase in carbon reserves of 0.4% in all soils used in agriculture in the 0–40 cm layer will double the reduction of greenhouse gas emissions into the atmosphere [
7]. However, there are many questions regarding the practical feasibility of such a process for agricultural soils. This process is quite challenging to control with high soil C reserves, and it strongly depends on changes in agricultural technology.
Additionally, the accumulation of C in the soil is finite, usually coming to an equilibrium state within 20–30 years. It is also subject to external factors such as climate change, which alters the agroecosystems’ productivity and is related to sustainable agriculture. Finally, its implementation can be challenging from an economic point of view, so the careful selection of climate-smart agricultural soils is required [
8].
In this regard, long-term field experiments are a suitable base for the practical testing of SOC sequestration approaches, allowing integrated use of long-term data on weather conditions, crop productivity, and agricultural technology features, including fertilizer systems, as the most frequently studied active factor in the experiments. Many existing meta-analyses of C sequestration on a global and regional scale are based on the generalization of data from long-term field experiments [
9,
10,
11,
12]. Because only a few of these experiments were specifically designed to evaluate the dynamics of C, their value increases when integrated with carbon dynamics models. The comparative analysis of various experimental variants complemented by modelling allows us to identify alternative solutions for the use of various agrotechnological techniques that provide C sequestration.
We have already tested the results of the field experiments of the “Geographical experimental network for the use of fertilizers” for practical testing of agrotechnology’s suitability for reaching the goals of the “4 per 1000” initiative [
13,
14,
15]. In this paper, we assess the potential of carbon sequestration by arable sandy podzols, which are believed to have a high potential for C sequestration [
16]. We provide analysis for current and future climate conditions in order to develop optimal agricultural techniques for increasing SOC reserves by more than 4‰ per annum.
2. Materials and Methods
For the present study, we used the data obtained in a long-term field experiment of the Research Institute of Organic Fertilizers and Peat: “The effect of long-term application of fertilizer systems on the productivity of grain crop rotation, product quality, and fertility of sod-podzolic soil”, which was initiated in 1968 and lasted for 50 years. The experimental field is located in the north-eastern part of the Meshcherskaya lowland, 10 km from the city of Vladimir near the village of Vyatkino in Sudogodsky district (56°04′01″ N, 40°29′09″ E). The climate is temperate continental without a dry season and with warm summers (Dfb), the average air temperature for the year is 3.9 °C, the sum of biologically active temperatures (>10 °C) is 2000–2100 °C, and the average precipitation per annum is 560–590 mm. According to geobotanical zoning, the farm’s territory is located in the southern taiga subzone and has a predominance of mixed coniferous and deciduous forests. In geomorphological terms, this area is lacustrine-glacial zander, slightly undulating lowland. Absolute altitude ranges from 130 to 170 m above sea level. Soil parent material texture is sand to sandy loam in places, underlain by loamy moraine till. A characteristic feature of light-textured soils under natural vegetation in the region is the low content of organic matter and nutrition elements, low cation exchange capacity, and high acidity. Ploughing has resulted in the formation of a 20–25 cm arable layer. This layer contains a higher level of organic carbon and nutrition elements, a slightly heavier texture, and a more expressed structure that leads to higher biological activity and biodiversity, thus reflecting better soil health. The soil of the particular experimental field has a sandy loam texture, underlaid at a depth of 40–50 cm by loamy moraine till. In the international classification, the soil is classified as Albic Podzol (Epiarenic, Endoloamic, Aric, Raptic) [
17]. Soil properties before establishing the experiment were as follows: pH 6.2–6.5, extractable acidity—1.0–2.2 cmol
c·kg
−1, exchangeable bases—4.8–5.3 cmol
c·kg
−1, labile P
2O
5—14–25 mg·kg
−1 (very low availability), K
2O—63–104 mg·kg
−1 (low to medium availability). The clay content at 0–20 cm was 80 g·kg
−1, the initial reserve of SOC was 11.0 t·ha
−1. The site has been used in agriculture for at least 200 years. Experimental data on productivity dynamics, agrochemical indicators, and organic C in the long-term experiment are summarized in the work of Lukin et al. [
18].
The long-term experiment was established to study the effect of long-term use of various fertilizer systems (organic, organo-mineral, and mineral) on the crop rotation productivity and fertility of arable podzols. The study aimed to explore the balance and transformation of organic matter and elements of mineral nutrition of plants. The experiment scheme includes options without fertilizers (absolute control) and options with a different combination of mineral and organic fertilizers (organo-mineral) and options with their separate application. Crop rotation included annual lupine–winter wheat–potatoes–barley on two fields with four replications. The plots’ size was 7 m × 23 m = 161 m2 with the experiment’s total area being 2.6 ha. The most dramatic changes in the main agrochemical indicators occurred during the first 2–3 rotations. Then they varied following the annual intake of nutrients with fertilizers, their removal by the crop, and their fixation in the soil. In 1984–1989, the experiment was mothballed, with the passage of a two-year fallow field during this period. Since 1989, fertilization and crop rotation were resumed according to the previous scheme. Currently, data on 11 crop rotations are summarized.
To model the dynamics of soil organic matter, we used data on four variants for 1968–1998: control; NPK (N
50P
25K
60 equivalent to 10 t·ha
−1 manure annually); a half dose of mineral and organic fertilizers—5 t·ha
−1 of farmyard manure (FYM) + N
25P
12K
30 (1/2FYM + 1/2NPK); manure and a double dose of mineral fertilizers—10 t·ha
−1 FYM + N
100P
50K
120 (FYM + 2NPK). The manure was obtained from the same research institute’s cattle farm, with the following characteristics: organic matter 58.8%, pH 7.7, total N 1.13%, P
2O
5 1.20%, K
2O 1.18%. The features could vary in different years but not significantly.
Table 1 shows the dynamics of crop rotation productivity for the selected options, taking into account by-products.
It was found that acidification of the soil occurred after 11 rotations. The most significant decrease in pH was observed in the variants with mineral fertilizers’ introduction (
Table 2). The content of mobile phosphorus in the soil without fertilizers practically did not change compared to the initial one. Despite the annual removal of phosphorus with the crops, the content of mobile phosphorus in the soil was stabilized at the level of 51 mg·kg
−1 (medium availability) when fertilizer of 25 kg·ha
−1 of P
2O
5 was applied. When applying higher doses (P
50), the phosphorus content in the soil increased. Long-term use of arable soil without applying potash fertilizers led to a decrease in the potassium content. The highest potassium content at the end of the 11th rotation—246 mg·kg
−1 (very high availability)—was observed when applying manure at a dose of 10 t·ha
−1 together with mineral fertilizers N
100P
50K
120 (
Table 2).
To study soil organic carbon dynamics, we used the RothC version 26.3 model, which examines the cycle of organic matter in the arable layer of automorphic mineral soils. It uses a monthly step, taking into account the influence of soil type, temperature, soil humidity, and vegetation cover [
19]. In the RothC model, ORP is divided into five pools: carbon of readily decomposing plant residues, DPM; stable plant material, RPM; microbial biomass, BIO; humified, HUM, and inert organic matter, IOM, which have different mineralization rates described by first-order equations. The amount of C entering the soil on a monthly basis was calculated using the Levin dependence [
20] and reference data on the quality of FYM. The initial distribution of carbon across these pools to run the model is modelled for equilibrium C content conditions. The content of the IOM pool, according to [
21] was pre-calculated at 1.19 t·ha
−1. After calculating the IOM pool, the RothC model was run in the mode of calculating the distribution of C across the pools by selecting the average long-term value of C input to the soil so that the C stock obtained by modelling corresponded to the experimentally determined one. The calculated equilibrium average annual value of C input was 500 kg·ha
−1. A control variant was used to configure the model, and the data from the other variants were considered independent to check the quality of the configuration. Verification of the correspondence of experimental and calculated data was carried out based on the Modeval model for statistical evaluation of simulation results [
22].
The forecast of SOC reserve dynamics under the future climate was made for the climate scenarios RCP4.5 and RCP8.5 used in the IPCC AR5 report [
23]. These scenarios describe four pathways of changes in greenhouse gas emissions and concentrations and land-use for the 21st century. The scenario RCP4.5 corresponds to the moderate anthropogenic impact on the Earth’s climate system and scenario RCP8.5 to the extreme effects. CO
2 concentrations forecast by 2100 for RCP4.5 is 580–650 ppm CO
2 and more than 1000 ppm for the RCP8.5 scenario. Regional climate model developed at the Voeikov Main Geophysical Observatory for an ensemble scenario of 31 CMIP5 models [
24] was used for calculations of climate data for the experimental area basing on the “Climate–Soil–Yield” simulation system [
25], where the output data temperature, precipitation, and potential evapotranspiration with a monthly resolution up to 2100 were reported. The obtained climate data were used to make a forecast of crop rotation yield for each treatment up to 2090. Additional details are described in Prokopyeva et al. [
26].
3. Results
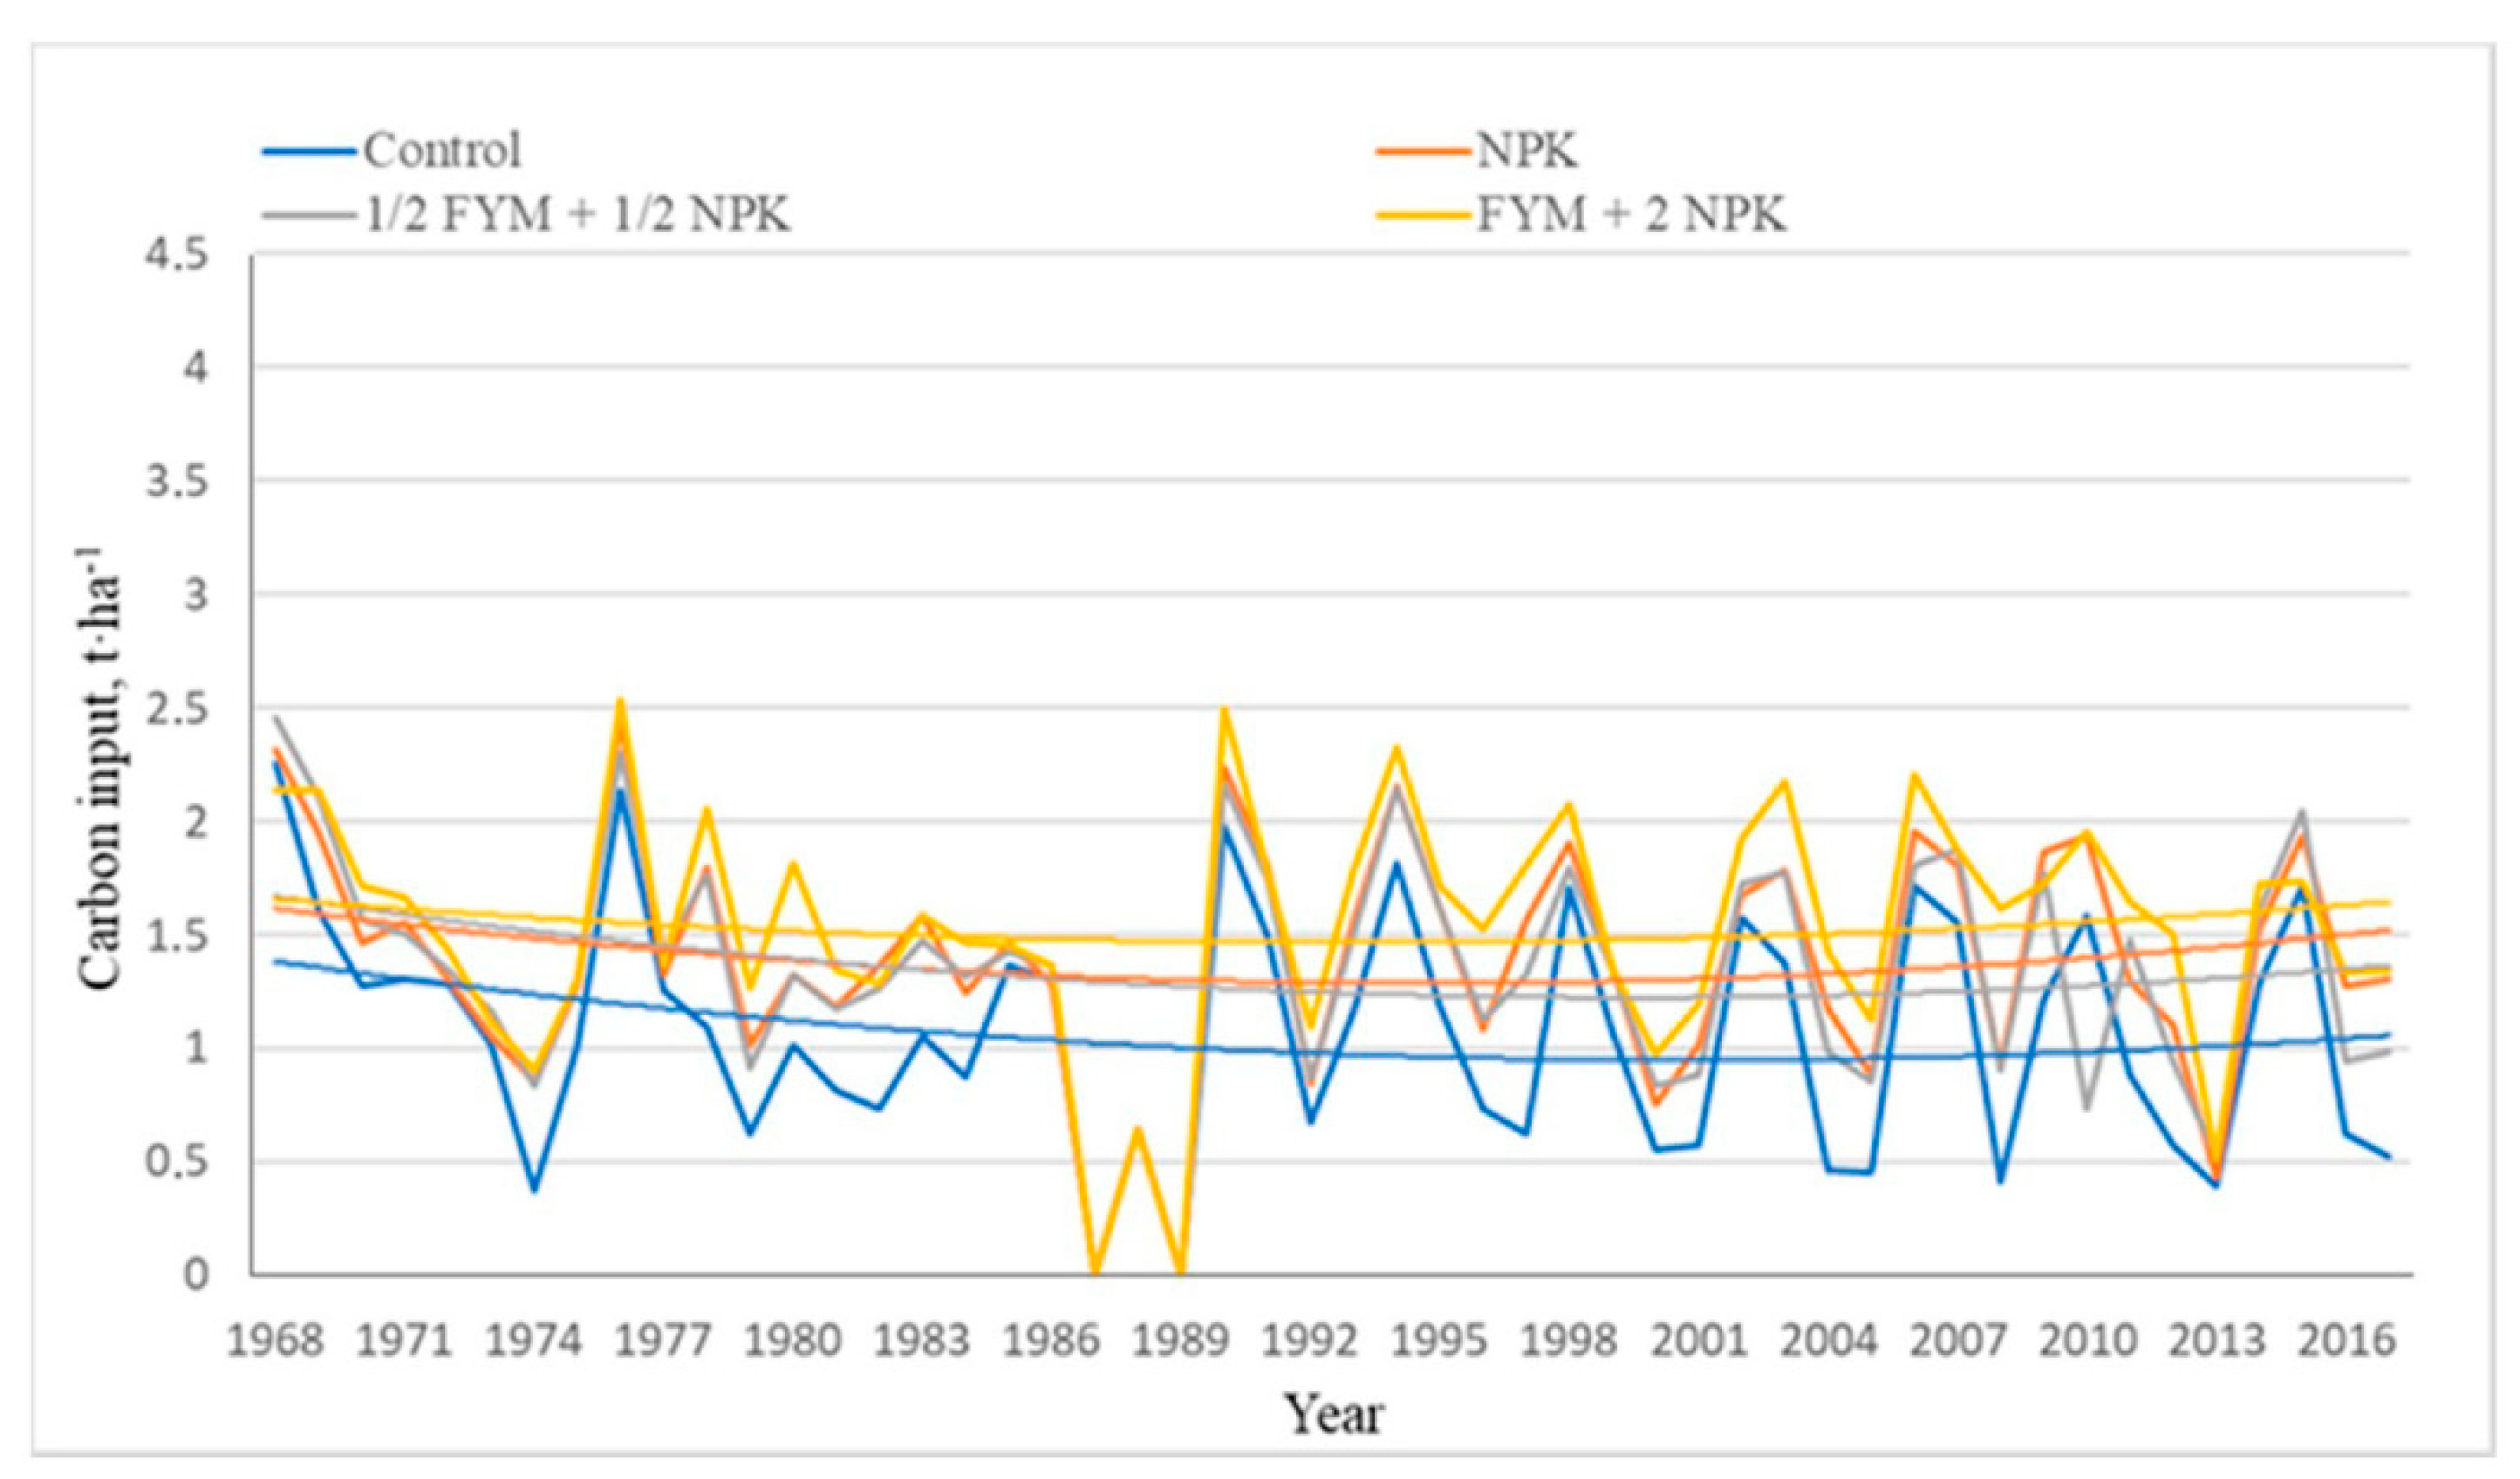
Figure 1 and
Figure 2 show the dynamics of carbon input into the soil both with plant residues (crop residues + underground biomass,
Figure 1) and in total, taking into account the introduction of C with organic fertilizers (
Figure 2). In general, the entire observation period can be divided into two sections: the period before the conservation of the experiment (1968–1986) and the period from the renewal of the investigation to the present (1990–2017).
In the period before conservation, there is a decrease in carbon supply with plant residues in all four variants (
Figure 1). After the resumption of the experiment, the C flow stabilized: the variants of NPK, and 1/2FYM + 1/2NPK at the level of 1200–1300 kg·ha
−1 per year, the option FYM + 2NPK at 1500 kg·ha
−1 per year, while in the control variant, the indicator dropped below the mark of 1000 kg·ha
−1 per year and stabilized at 950 kg·ha
−1 per year. After a stabilization period, its growth resumed, more noticeable in the last 15 years of the experiment, in the variants with fertilization. It should also be noted that in the control variant, there was a slight increase in C input at the end of the observation period. The difference in the dynamics of C input in the control and the variants with fertilizers was primarily due to the relatively smaller amount of plant residues, which could also be traced by the dynamics of crop rotation productivity (
Table 1). Moreover, a smaller ratio of underground to aboveground biomass, which is taken into account in the Levin equations [
16], contributed to this difference. Differences in crop rotation productivity between the variants with organic and mineral fertilizers significantly affected plant residues’ receipt only after the conservation of the experiment. The average intake of C was close for the NPK and 1/2FYM + 1/2NPK variants and was higher for the FYM + 2NPK variant by about 200 kg·ha
−1 per year (
Table 3). Significant changes were caused by the intake of C of organic fertilizers applied every two years, as shown in
Figure 2. Additional carbon input from the biannual application of organic fertilizers to the soil resulted in an average increase of about 200 kg·ha
−1 per year for the option 1/2FYM + 1/2NPK (extra 13%) and about 600 kg·ha
−1 per year (extra 28%) for the option FYM + 2NPK (
Table 3).
With a drop in the total average annual C input over the period 1968–1983 for organo-mineral variants, the period 1975–1984 was more favourable for crop development than the beginning of the experiment (1968–1974). This phenomenon led to a slight slowdown in the C drop rate. When the experiment was resumed in 1990, the increase in C input to the soil decreased in the series FYM + 2NPK > 1/2FYM + 1/2NPK > NPK. Notably, the stabilization and beginning of the C input growth were observed in the FYM + 2NPK variant earlier than in the 1/2FYM + 1/2NPK variant.
Over the entire study period (
Figure 3), the total C stock dynamics correlated with changes in C supply to the soil.
Over the entire experiment period, the FYM + 2NPK variant resulted in SOC accumulation of 3.6 t·ha−1 (21.3% of the initial content). For the 1/2FYM + 1/2NPK variant, SOC reached the initial reserves. In the variant NPK, by 2017, the observed loss of C stock was −1.57 t·ha−1 (9.3% of the initial content) and in control −4.81 t·ha−1 (28.4% of the original content). Most of the C stock loss in all variants occurred before conservation. During this period, the loss of C stock occurred in all variants, increasing in the series: control > NPK > 1/2FYM + 1/2NPK > FYM + 2NPK and amounted to −7.25 t·ha−1 (42.8%), −6.17 t·ha−1 (36.5%), −5.1 t·ha−1 (30.1%), and −4.29 t·ha−1 (25.4%), respectively.
Since the experiment’s launch in 1990, all variants except the control have shown a steady increase in the total C stock. SOC reserves reached a plateau in the second half of the period, around 2005 in the NPK and 1/2FYM + 1/2NPK variants and about 2010 in the FYM + 2NPK variant. The largest increase was observed in the FYM + 2NPK variant. After reaching the minimum values during the conservation period (12.6 t·ha−1), the total carbon stock increased to 20.5 t·ha−1 (63%) by 2017. In the variant 1/2FYM + 1/2NPK, the minimum stock was 11.8 t·ha−1, after which, by 2017 it increased to 16.8 t·ha−1 C (42.4%). For the NPK variant, the stock rose from 10.8 to 15.4 t·ha−1 C (42.6%) during this period. The rapid growth of the indicator is primarily due to significant losses in C reserves in the period before conservation and especially during the conservation, which included two-year fallow. After reaching the minimum level during the conservation period, C stock in the control variant increased in the first years after renewal. It reached a plateau with a stable C reserve of about 12 t·ha−1. In the variants with fertilization, stabilization occurred around 2008, ranging from 15 to 21 t·ha−1 C.
The average annual losses of C to the atmosphere in the form of CO
2 due to mineralization of plant residues, SOM, and organic fertilizers were calculated using the RothC model. These losses averaged 1156 kg·ha
−1for the control variant, increasing to 1418 kg·ha
−1for NPK, 1540 kg·ha
−1for 1/2FYM + 1/2NPK, and 1872 kg·ha
−1for FYM + 2NPK, and a total of 56.6, 69.4, 75.4, and 91.7 t·ha
−1 for 49 years, respectively (
Table 3).
The comparison of model data on the dynamics of total SOC stocks with experimental data showed that the model satisfactorily reproduced SOC stocks’ observed dynamics (
Figure 4,
Table 4).
There was some underestimation of the results in the post-conservation period 1990–2010 since the observed growth of C stocks was faster than predicted by the model. In contrast, in the initial period of modelling on the FYM + 2NPK variant, there was an overestimation of the results. The correlation coefficient values varied in the range of 0.4–0.9; the lowest value of the average square error −7.2 was observed in the variant 1/2FYM + 1/2NPK, but in all cases, it did not exceed 10.5. The coefficient of determination for all variants was 0.3–0.7, which indicated the possibility of a more significant deviation of the simulated values from the observed average, compared to the experimental data.
The dependence of SOC reserves in the arable layer calculated by RothC on the average annual C input is described by a linear relationship on average throughout observations of
Cinp:
where ΔC is the average annual change in C reserves in the 0–20 cm layer, kg·ha
−1, and
Cinp is the organic C input to the soil.
According to the Equation (1), to maintain SOC stocks, we should apply an annual average of 1515 kg and to accumulate annually 4‰—1853 kg C. The first condition is met in the variant 1/2FYM + 1/2NPK, and the second in the variant FYM + 2NPK (
Table 3).
A logarithmic relationship better describes the dependence of SOC reserves in the arable layer based on experimental observations for the same period on C input:
According to the Equation (2), to maintain C reserves in the soil, an average of 1483 kg of C should be applied annually, close to the value calculated using the RothC model.
Figure 5 shows calculated data on the C dynamics in the soils of the studied long-term experiment variants in 2017–2090 for two climate scenarios. With expected climate change under the RCP4.5 scenario, C stock increases over the entire period, while under the RCP8.5 scenario, the C stock reaches a plateau by 2070 for all the compared variants. Thus, under the less severe climate change scenario, RCP4.5, additional opportunities exist for C capture by arable soils in 2070–2090.
Compared to 2018, under the RCP4.5 scenario the expected C stock increase in soil will be up to 12.9 t·ha−1 for the control variant, up to 15.8 t·ha−1 for the NPK variant, and up to 20.0 t·ha−1 for the variants with the application of mineral and organic fertilizers. Under the RCP8.5 scenario, the C reserves increase will be lower and will amount up to 7.9 t·ha−1 for the control variant, up to 9.5 t·ha−1 for the NPK variant, up to 12.6 t·ha−1 for the 1/2FYM + 1/2NPK, and up to 11.8 t·ha−1 for the FYM + 2NPK variant. For both scenarios, an increase in organic C reserves in the period 2017–2090 is expected in the sequence: 1/2FYM + 1/2NPK > FYM + 2NPK > NPK > control.
To estimate the annual C increase or loss, we divided the modelling interval from 1968 to 2090 into five periods, from 20 to 30 years each. Twenty-year periods are recommended for the calculation by the 4 per 1000 initiative and discussed in [
27,
28] (
Table 5).
In the period 2018–2090, SOC input is projected to be 1.3–1.5 times higher under the RCP4.5 scenario and 13–20% less over the same periods under the RCP 8.5 scenario (
Table 5). This result can provide an annual increase in C reserves from 21‰ to 27‰ under the first and from 16‰ to 21‰ under the second climate scenario in the period 2020–2040. In the period 2040–2070, although C input will remain at the same level (RCP 4.5) or slightly increase (RCP8.5), it is expected to accumulate only 7‰ and 5–6‰ C, respectively. In the last 20 years, the annual increase in SOC under the RCP4.5 scenario will decrease by half. Under the RCP8.5 scenario, a loss of up to 1‰ of previously accumulated reserves may be expected. However, the absolute input of C will not decrease under both scenarios. The accumulation rate is predicted to be the highest for the variant 1/2FYM + 1/2NPK and the lowest for the variant FYM + 2NPK. This trend reflects the finiteness of sequestration processes with an increase in C input to the soil up to a new equilibrium state of SOM dynamics. The variant FYM + 2NPK at the beginning of the modelled period had the largest C reserve that most probably was the main reason for a lower C stocks growth rate even amid higher C input to soil.
Figure 6 shows an estimate of the possible accumulation of C under the future climate. The accumulation of C is approximately equal for two organo-mineral variants for the period 2018–2070 under the RCP4.5 scenario. If the RCP8.5 scenario is implemented, the 1/2FYM + 1/2NPK variant provides slightly better results. In the period 2070–2090, the variant with the application of mineral fertilizers shows an additional accumulation of about 2 t·ha
−1 C, and with the use of organic and mineral fertilizers, 3 t·ha
−1 under the RCP4.5 scenario.
4. Discussion
Long-term experimental studies combined with an application of the RothC model are interesting from several points of view. First, these studies demonstrate the practical possibility of managing organic C reserves in the arable soil layer using existing crop rotation systems. We confirmed that the studied soil with initially low natural reserves of organic C showed a rapid response to the variation in crop rotation productivity, which leads to a traceable accumulation of C reserves. However, in the course of a conservation period under fallow, these soils may be subjected to a rapid loss of previously accumulated C. For example, for the control variant, the model predicts the loss of up to 40% of the initial C reserves during the two-year fallow period. Possible loss of up to 60% of SOC reserves was shown using the RothC 26.3 simulation for a podzol under a 200-year-old pine forest in Scotland [
29].
The dynamics of SOC stock in light-textured podzols under cultivation is susceptible to soil management. The break in the experiment in 1984–1989 resulted in an immediate decline in C reserves due to the lack of input of plant residues and organic fertilizers. After the restart of the experiments, strong acceleration in SOC growth was noted that reflects the general rule: the less is the C stock in soils, the better is the response of SOC reserve to C input.
A noteworthy positive result is the ability of podzol to maintain the initial SOC reserves at an annual intake of 1.5 t·ha
−1 of C and the sequential accumulation of 4‰ at an additional input of 350 kg·ha
−1 of C. These trends were practically traced for 30 years after the conservation of the experiment and were reproduced using RothC. As shown earlier, for Retisols of different texture for the same cool temperature zone with initial C stock of 19–32 t·ha
−1, C input of 1.5 t·ha
−1·yr
−1 was needed, but C input was estimated as high as 2.0 t·ha
−1·yr
−1 for maintaining sustainable SOC stock 41–43 t·ha
−1 [
16]. These estimates are less than those given by Wang et al. [
30], who estimated the critical C input rate for arable soils to produce wheat in Russia as 1.9 t·ha
−1·yr
−1 with current average and potential inputs of 1.3 and 2.8 t·ha
−1·yr
−1, respectively. This value applies primarily to Chernozem soils with large absolute reserves of organic C. Previously we demonstrated by modelling using RothC 26.3 based on a long-term field experiment on Chernozem that to maintain or increase organic C reserves, it is necessary to ensure the introduction of at least 1900–2100 kg·ha
−1 C [
14].
The second important issue is the potential existence of more favourable conditions for C sequestration in the studied soil under the future climates. During the experimental period in 1968–2018, SOC reserves reached the initial value only in the FYM + 2NPK variant. Under the future environment (RCP4.5 climate scenario), the initial SOC stock may be achieved in the control variant by 2042, in the NPK variant by 2026, and in the 1/2FYM + 1/2NPK variant by 2023. Under the RCP 8.5 scenario, this level will be reached in 2051, 2030, and 2023, respectively. The accumulation of C implies further growth, which can meet the condition for all variants that repeatedly exceed 4‰ in the first 20 years and then practically meets this condition in the next 30 years—up to/ 2070 for the RCP4.5 scenario. In this case, we consider that the 4 per 1000 initiative considers a layer of 0–40 cm, so the absolute increase only in the upper horizon should be higher than 4‰. According to long-term Rothamsted experiments with fertilizers [
31], it was proposed to use the value >7‰ in the 0–23 cm layer as an equivalent to 4‰ in the upper 40 cm layer.
When modelling the C dynamics in a long-term experiment in the Moscow region on Retisol, under slightly warmer climate and on loamy-textured soils, we showed that ensuring yield growth for the RCP4.5 and especially RCP8.5 scenario was a challenging task. We concluded that additional sequestration of C was possible with a decrease in the critical level of annual C input to the soil [
15,
26]. At the same time, the expected growth will be provided only in the period 2020–2040.
In the current long-term experiment, the existing crop rotation allows a steady increase in productivity under the future climate and a consistent increase in C stocks. The latter can be traced over 50 years with a gradual decrease in the sequestration rate for the RCP4.5 scenario or reaching a new equilibrium level after 2060 for the RCP8.5 scenario. This fact allows considering light-textured arable soils in the non-Chernozem zone, especially in the context of the loss of part of the initial reserves of C, as a suitable object for the implementation of the 4 per 1000 initiative in the long term. The results obtained are much more optimistic than the data provided by Wiesmeier et al. [
32] for agricultural soils in Bavaria. According to the most optimistic scenario of these authors, for the 21st century, if the C supply will increase by 20%, the soil will lose 3–8% of the current C stock, and to maintain the current SOC level, an increase in the C supply of at least 29% is required.
According to Equation (1), the proportion of C accumulated in the soil is 0.2 of the total mass of the introduced carbon, which is consistent with the data of Grant et al. [
33]. This value is higher than 0.095 for the control variant and 0.14 for the NPK variant reported by Ludwig et al. [
34], obtained in the long-term experiment “Eternal rye” in Halle on sandy Haplic Phaeozem. The lack of organic carbon sources may be a challenge in many regions of the world, including some areas in Russia (see [
13]). However, in the Vladimir region, livestock is of significant importance, and necessary FYM reserves exist. The regional administration aims to organize the interaction between the livestock enterprises with the crop producers to develop mutually beneficial cooperation. The lack of FYM in places may also be compensated with the introduction of grass fields in the crop rotations [
15,
26].
The calculations also allow us to assess the possibility for long-term maintenance of organic C reserves and the required crop rotation productivity. From the model data, it is clear that to maintain the initial reserves of C in the control variant, it is necessary to provide an annual supply of 450 kg·ha
−1 of C (
Table 3). According to the results shown in
Table 5, it can be seen that in 2020–2040, the increase in C reserves is more than 18% with an increase in revenue from less than 100 kg·ha
−1. However,
Figure 6 and
Table 5 show that the additional annual intake of 500 kg·ha
−1 of C in the variant FYM + 2NPK compared to the variant 1/2FYM + 1/2NPK did not provide further C accumulation over a 50-year period, which reflects the finality of the soil capacity for C sequestration.
In general, under expected climatic scenarios, even the most critical ones such as RCP8.5, the Vladimir region will benefit from global warming in increased yields and even SOC accumulation. However, the abundance of extreme climatic events such as prolonged droughts would negatively affect the plants’ growth.


 ,
, 


