Article

Optimization and Comparison of Ultrasound and Microwave-Assisted Extraction of Phenolic Compounds from Cotton-Lavender (Santolina chamaecyparissus L.)

1
Team of Biotechnological Valorization of Microorganism, Genomics and Bioinformatics, Department of Biology, Faculty of Sciences and Techniques, University Abdelmalek Essaâdi, B.P. 415 Tangier, Morocco
2
Department of Analytical Chemistry, Faculty of Sciences, University of Cadiz, Agrifood Campus of International Excellence (ceiA3), IVAGRO, 11510 Puerto Real, Cadiz, Spain
*
Author to whom correspondence should be addressed.
Agronomy 2021, 11(1), 84; https://doi.org/10.3390/agronomy11010084
Submission received: 26 November 2020 / Revised: 21 December 2020 / Accepted: 31 December 2020 / Published: 4 January 2021
(This article belongs to the Special Issue Extraction and Analysis of Natural Product in Plant)

Abstract

:
The interest in natural phenolic compounds has increased because of their attractive use especially as antioxidant and antimicrobial agents in foods. The large content in phenolic compounds of interest in Santolina chamaecyparissus L. (S. chamaecyparissus) makes this plant a target source that is worthy of note. In this work, new extraction technologies comprising ultrasound (UAE) and microwave (MAE) assisted extraction of the phenolic compounds in S. chamaecyparissus have been developed, optimized, and compared. Several extraction factors have been optimized based on a Box-Behnken design. Such optimized factors include the percentage of methanol in water (25–75%), the temperature (10–70 °C), the ultrasound amplitude (20–80%), the ultrasound cycle (0.2–1 s), the solvent pH (2–7) and the solvent-sample ratio (5/0.2–15/0.2 mL/g) with regard to UAE, while the percentage of methanol in water (50–100%), the temperature (50–100 °C), the pH (2–7) and the solvent-sample ratio (5/0.2–15/0.2 mL/g) were optimized for MAE. The solvent composition was the most influential parameter both on MAEs (64%) and UAEs (74%). The extraction optimum time was established as 15 min for MAE and 25 min for UAE. Five major phenolic compounds were detected and identified by Ultra-High-Performance Liquid Chromatography—Quadrupole Time of Flight—Mass Spectrometry (UHPLC-QToF-MS) in the extracts: chlorogenic acid, quercetin 3-O-galactoside, quercetin 3-O-glucoside, isoorientin, and cynarin. With the exception of chlorogenic acid, the other four compounds have been identified for the first time in S. chamaecyparissus. The findings have confirmed that MAE is a significantly more efficient extraction method than UAE to extract phenolic compounds from S. chamaecyparissus.

Graphical Abstract

1. Introduction

Santolina chamaecyparissus L. (S. chamecyparissus) is a well-known aromatic and medicinal plant that grows in North Africa and Southern Europe [1]. This plant has a strong aroma. It is used in traditional medicine as a vermifuge, emmenagogue, stimulant, and a stomachic and also to treat different kinds of dermatitis [2]. Several studies have reported certain properties of its essential oil, such as its strong insecticide [3,4,5] or antitermitic activity [4]. The extracts from S. chamecyparissus have also proven their antimicrobial activity [6,7,8]. These properties are complemented by their highest content in bioactive compounds; namely terpenoids such as monoterpenes and sesquiterpenes and particularly artemisia ketone [4,5,9,10,11,12] and eucalyptol [3,6,7,13], which are well known to be present in S. chamaecyparissus essential oil. Some flavonoids and phenolic compounds can also be found in other plants of the Santolina genera such as chlorogenic acid, cynarin, luteolin 7-O-glucoside, apigenin 7-O-glucoside, and apigenin [14,15,16]. However, to the best of our knowledge, with the exception of chlorogenic acid [15], no specific data are available regarding the phenolic profile of the extracts that can be obtained from S. chamaecyparissus species.
Unlike other the conventional extraction methods for bioactive compounds, that require longer extraction times, larger amounts of solvent, cause the degradation of some of the compounds and provide low extraction selectivity [17], ultrasound-assisted extraction (UAE) and microwave-assisted extraction (MAE) can be considered as highly promising and efficient green techniques. Both of them have proven to be low-cost extraction methods for bioactive compounds in plants, since they are faster, use less solvent, reduce the degradation of thermolabile compounds, and can be successfully completed without a considerable number of process steps [18,19,20] that are generally required in other traditional methods.
The ultrasound-assisted procedure is mainly based on the implementation of high-frequency ultrasonic waves, that have the capacity to disrupt the plant cell walls and thus facilitate the penetration of the solvent into the cells to collect the extractable compounds [19,21,22]. On the other hand, the microwave method is mainly based on the energy from microwaves, which cause the movement of liquid molecules, which, in turn, heat the samples rapidly and increase the characteristic capillary porosity that allows the diffusion of the solvent into the plant cells and, subsequently, forces the releasing of the substances from the plant cell into the solvent [23,24].
Several works have been recently published on the use of UAE applied to the extraction of phenolic compounds from a number of plants such as myrtle (Myrtus communis L.) [25], pomegranate peel (Punica granatum L.) [26], maqui (Aristotelia chilensis (Mol.) Stuntz) [27], black chokeberry (Aronia melanocarpa L.) [28], sloes (Prunus spinosa L.) [29], among others. Moreover, MAE has been widely employed for the extraction of phenolic compounds from maqui berry (Aristotelia chilensis) [30], myrtle (Myrtus communis L.) [31], Açai (Euterpe oleracea Mart.) [32], pomegranate peels [23], among others. To the best of our knowledge, no report has been published so far on the use of UAE, MAE for the extraction of phenolic compounds from S. chamaecyparissus and their efficiency levels have not yet been compared.
The efficiency for phenolic compound extraction of either of these methods may be altered by many factors such as time, temperature, solvent, pH, and solvent-sample ratio. UAE, particularly, can also be affected by two additional variables, namely ultrasound amplitude and cycle [25,30,31,33]. In this study, the Response Surface Methodology (RSM) using a Box-Behnken Design (BBD) was selected to optimize all of these variables that may have an effect on the effective extraction of phenolic compounds. BBD requires a shorter number of experiments, which means less time, less solvent consumption, and a more efficient large-scale implementation [25,30,31,34,35].
The main goals in this study are to develop, optimize and compare new analytical methods for the extraction of phenolic compounds from S. chamaecyparissus with analytical purposes, using two different green extraction techniques: ultrasound-assisted extraction (UAE) and microwave-assisted extraction (MAE). Furthermore, for the first time, Ultra-High-Performance Liquid Chromatography—Quadrupole Time of Flight—Mass Spectrometry (UHPLC-QToF-MS) has been used to determine the extracts’ phenolic profile.

2. Materials and Methods

2.1. Chemicals

The ultrapure water for the experiments was obtained from a Milli-Q water purification system by EMD Millipore Corporation (Bedford, MA, USA). The methanol (Fisher Scientific, Loughborough, UK), acetonitrile (Fisher Scientific, Loughborough, UK), acetic acid (Scharlab, S.L., Sentmenat, Barcelona, Spain), and formic acid (Scharlab, S.L., Sentmenat, Barcelona, Spain) were HPLC grade. The hydrochloric acid and the sodium hydroxide used for the adjustment of the samples’ pH were provided by Panreac Química S.A.U., Castellar del Vallés, Barcelona, Spain and Panreac Química S.A.U., Castellar del Vallés, Barcelona, Spain, respectively. Folin-Ciocalteu reagent (Merck KGaA, EMD Millipore Corporation, Darmstadt, Germany) and anhydrous sodium carbonate (Panreac Química S.A.U., Castellar del Vallés, Barcelona, Spain) were used to determine the total phenolic content. Gallic acid, chlorogenic acid, quercetin 3-O-galactoside, quercetin 3-O-glucoside, isoorientin, and cynarin (Sigma Aldrich Chemical Co. St. Louis, MO, USA) were used as phenolic compound standards.

2.2. Plant Material

The S. chamaecyparissus leaves for the experiments were harvested from a greenhouse in the Faculty of Sciences and Techniques of Tangier (University Abdelmalek Essaâdi, Tangier, Morocco). The leaves were washed and dried in an incubator (Nuve EN 055/120 Incubator, Nüve, Ankara, Turkey) at 30 °C for 3 days. The dried leaves were milled to powder and stored at 4 °C until the extraction.

2.3. Ultrasound-Assisted Extraction (UAE)

The UAE of the phenolic compounds was performed using an ultrasonic probe UP200S (200 W, 24 kHz) (HielscherUltrasonics GmbH, Teltow, Germany) at different methanol concentrations (25, 50, and 75%) in water, temperatures (10, 40, and 70 °C), amplitudes (20, 50 and 80% of the maximum amplitude), cycles (0.2, 0.6 and 1 s), pH (2, 4.5 and 7) and solvent-sample ratios (5/0.2, 10/0.2 and 15/0.2 mL/g).
The solvent was prepared with HPLC grade methanol and ultrapure water. The solvents’ pH was adjusted by means of hydrochloric acid (1 M) and sodium hydroxide (0.5 M).
For the different experimental conditions, 0.2 g of the sample was added to the methanol-water mixture in a “falcon” type tube submerged in a water bath coupled to a temperature controller (Frigiterm, J.P. Selecta, Barcelona, Spain). After the extraction, the extracts were centrifuged for two five-minute cycles at 11.544× g. Then, the necessary amount of methanol-water was added up to 25 mL final volume. The extracts were kept in bottles at −20 °C until analysis.

2.4. Microwave-Assisted Extraction (MAE)

The MAEs of the phenolic compounds were performed in a temperature-controlled microwave oven (One Touch Technology Mars 6, CEM Corporation, Matthews, NC, USA) with adjustable time. According to the experimental design, the extractions were performed under different conditions (methanol percentage, pH, ratio, and temperature). The solvent (methanol-water) was prepared at three different methanol/pure water concentrations (50, 75, and 100%) and pH levels (2, 4.5, and 7).
Of the plant powder, 0.2 g was measured and placed into a microwave Teflon tube. Then, the solvent at the corresponding solvent-sample ratio (5/0.2, 10/0.2, or 15/0.2 mL/g) was added and each sample was placed in the microwave at the corresponding temperature (50, 75, or 100 °C). The tubes were placed in the middle of the microwave on a rotating carousel. The samples were exposed to a cycle of 8 min during which the temperature was gradually increased for 3 min until the desirable temperature was reached and then, it was stably maintained for 5 min. After that, the samples were let to cool down for 25 min. After that, the extracts were centrifuged at 11.544× g for two 5-min periods. Finally, more solvent at the same methanol concentration and pH level was added to make up to 25 mL total volume. The extracts were stored in bottles at −20 °C until analysis.

2.5. Determining the Total Phenolic Content (TPC)

The Folin-Ciocalteu method [36] was used to determine the TPC. For that purpose, 0.25 mL of each sample, which had been previously filtered through a 0.45 µm nylon syringe filter (Nylon Syringe Filter, FILTER-LAB, Barcelona, Spain), was mixed with 12.5 mL of distilled water, 1.25 mL of Folin-ciocalteu reagent, and 5 mL of sodium carbonate solution Na2CO3 (20%). Then, an additional amount of distilled water was added up to reach the desired 25 mL final volume. The mixture was let to rest for 30 min and then the absorbance was measured at 765 nm by means of a UV-vis Spectrophotometer Cary 60 (Agilent Technologies, Santa Clara, CA, USA). The results were expressed in gallic acid equivalents, according to the gallic acid calibration curve at concentration levels between 1 and 1000 mg L−1 (y = 0.0009x + 0.0631; R² = 0.9999).

2.6. Experimental Design and Statistical Analysis

Due to its high efficiency and the shorter number of experiments required [37] Box-Behnken design (BBD) was the method selected to optimize the phenolic compounds extraction techniques.
The UAEs were performed considering six factors at three different levels −1 (low), 0 (medium), 1 (high). Thus, the UAE experimental design was formed by 54 samples including six experiment repetitions for which each one of the variables remained in their medium values (0, 0, 0, 0, 0, 0). The independent variables were: % methanol-water (X1) (25, 50, 75%), temperature (X2) (10, 40, 70 °C), amplitude (X3) (20, 50, 80% of the maximum amplitude), cycle (X4) (0.2, 0.6, 1 s), pH (X5) (2, 4.5, 7), and solvent-sample ratio (X6) (5/0.2, 10/0.2, 15/0.2 mL/g).
In the case of MAEs, the experimental design comprised just 27 extractions performed in duplicate with three repetitions at the variables’ medium value (0, 0, 0, 0). This model considers only four three-level parameters (−1, 0, 1). The variable ranges were: % methanol-water (X1) (50, 75, 100%), temperature (X2) (50, 75, 100 °C), pH (X3) (2, 4.5, 7) and solvent-sample ratio (X4) (5/0.2, 10/0.2, 15/0.2 mL/g).
The entire BBD matrixes for MAE and UAE can be seen in Table 1 and Table 2 respectively. Stratigraphic Centurion XVII (Statgraphics Technologies, Inc., The Plains, VA, USA) was used to develop and analyze the two models; the response surface design was used to examine the results obtained according to the variations of the relevant variables. The above-mentioned statistical software was used to make an estimate of the TPC, to determine the variance, to build a Pareto chart, and to optimize the method conditions.

2.7. Identification of the Phenolic Compounds by UHPLC-QToF-MS

The phenolic compounds were identified by Ultra-High-Performance Liquid Chromatography coupled to a Quadropole-Time-of-Flight-Mass Spectrometer (UHPLC-QToF-MS) (Xevo G2S QToF, Waters Corp., Milford, MA, USA). The extracts were previously filtered through a 0.22 µm nylon syringe filter (Filtros Anoia, S.A., FILTER-LAB, Barcelona, Spain) and injected into the equipment. 2% formic acid in ultrapure water (solvent A) and 2% formic acid in acetonitrile (solvent B) at a flow rate of 0.4 mL/min were employed for the chromatographic separation. The gradient of elution used was as follows (time, % solvent B): 0 min, 3%; 3 min, 10%; 4 min, 100%; 7 min, 100%; 11 min, 100%; 11.5 min, 3%; 12 min, 3%. The determination of analytes was carried out using an electrospray source system under the following conditions: negative mode, capillary voltage = 3 kV, source temperature = 120 °C, desolvation temperature = 400 °C, cone gas flow = 10 L h−1, desolvation gas flow = 850 L h−1, cone voltage = 30 V. The chromatography column employed was a C18 with dimensions of 2.1 mm × 100 mm and a particle size of 1.7 µm (Acquity UPLC BEH C18, Waters Corp., Milford, MA, USA). The column temperature was set at 60 °C. The full scan negative mode was used to capture the mass between 100 and 1200 m/z. The Photodiode Array (PDA) at a range from 210 until 500 nm and 1.2 nm resolution was employed. The data were analyzed by means of MassLynx software (Waters Corporation, Milford, MA, USA).

2.8. Analysis of the Phenolic Compounds by UHPLC-PAD

Once the main phenolic compounds had been identified, the extracts were analyzed by Ultra-High-Performance Liquid Chromatography fitted with a photodiode array detector (UHPLC-PDA) (Acquity UHPLC Waters Corporation, Milford, MA, USA). The chromatographic separation was carried out by a C18 reverse-phase column (1.7 µm, 2.1 × 100 mm, Waters). The column temperature was set at 55 °C. The solvents employed were as follows: 2% acetic acid in ultrapure water (solvent A) and 2% acetic acid in acetonitrile (solvent B). The gradient of elution was (time, % solvent B): 0 min, 0%; 1 min, 0%; 3 min, 5%; 4 min, 10%; 4.5 min, 10%; 5 min, 20%; 7 min, 20%; 8 min, 30%; 9 min, 100%; 12 min, 100%; 13 min, 0%. The flow rate was 0.6 mL/min. The separation of the phenolic compounds was run for 20 min including 5 min for re-equilibration. The extracts had been previously filtered through a 0.22 µm syringe filter (Nylon Syringe Filter, Filtros Anoia, S.A., FILTER-LAB, Barcelona, Spain). The analysis of the data was performed by means of Empower 3 software (Waters Corporation, Milford, MA, USA) at 280 nm.
The calibration curves of the different known concentrations (0.1–100 mg L−1) of the compounds that had been identified were plotted for quantification. The results were expressed in mg g−1 of the dried sample.

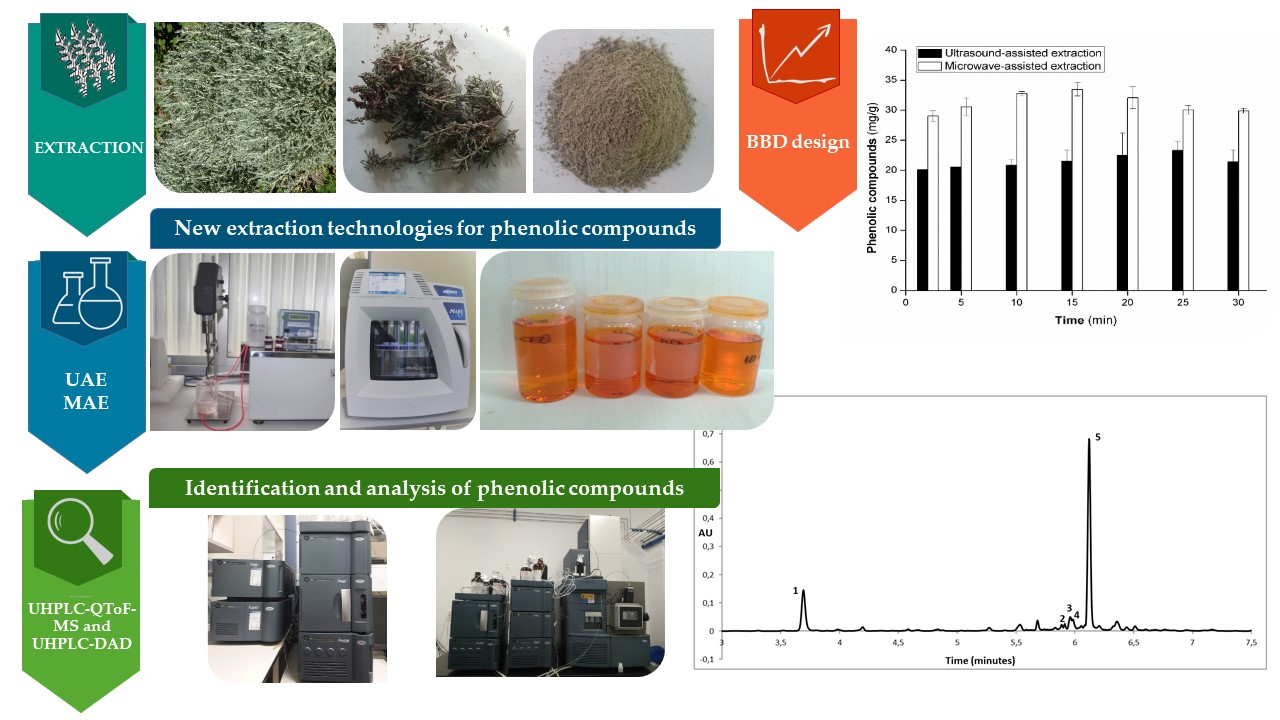
3. Results and Discussion

3.1. Optimization of the Ultrasound-Assisted Extraction (UAE) Conditions

Before carrying out the experimental design, the degradability of the two major phenolic compounds present in S. chamaecyparissus (chlorogenic acid and cynarin) was evaluated with respect to temperature. Temperatures of 10-20-30-40-50-60-70 °C were evaluated, during 10 min, in the intermediate conditions of the experimental design (amplitude—50%; cycle—0.6). These conditions were applied to volumes of S. chamaecyparissus extract (15 mL) previously obtained from a mother extract using UAE (methanol-water—50%; pH—4.5; solvent-sample ratio—10/0.2 mL/g). Each experiment was done in duplicate. The results obtained show that there is no significant degradability of these compounds in the range of temperatures studied, so a range of 10–70 °C was determined for the design.
After the 54 samples in the design were extracted and the total phenolic compound content was determined for each of them, the most influential variables in the process were evaluated. Table 2 shows the experimental and the predicted values of the TPC extractions from S. chamaecyparissus by UAE. In this case, the TPC extracted yields ranged from 10.35 to 31.38 mg g−1. In order to verify each variable significance, the full quadratic polynomial equation (Equation (1)) and the p-value were used as can be seen in Table 3.
YTP (mg g1) = 16.84 + 10.61·X1 + 1.66·X2 + 7.77·X3 + 0.27·X4 + 1.64·X5 + 0.14·X6 + 3.73·X12 + 2.79·X1X2 + 5.74·X1X3 − 0.56·X1X4
+ 1.47·X1X5 − 0.17·X1X6 − 6.12·X22 + 6.61·X2 X3 − 1.69·X2X4 + 0.44·X2X5 − 0.004·X2X6 + 2.19·X32 + 1.25·X3X4 − 0.48·X3X5 +
0.93·X3X6 − 3.30·X42 − 1.60 ·X4X5 + 0.57·X4X6 + 6.31·X52 − 2.12·X5X6 + 5.59·X62
Since the correlation coefficient obtained (R2 = 92.92%) for the experimental design is quite high, it can be construed that the prediction model fits well with the observed values.
It can also be observed that the p-values in Table 3 corresponding to the solvent composition and the ultrasound amplitude were lower than 0.05, which indicates that both solvent and amplitude were factors with a relevant influence on TPC extraction. In fact, a p-value lower than 0.01 indicates a highly significant factor that denotes quadratic interactions between solvent, amplitude, and temperature. However, there was no significant interaction between factors with a p-value of over 0.05.
The model clearly proves that both solvent and ultrasound amplitude, have a positive effect of 10.61 and 7.77, respectively. This leads us to conclude that an increase in the percentage of methanol and a high ultrasound amplitude would increment the TPC in the extracts. Likewise, solvent, amplitude, and temperature present significant quadratic interactions and had positive coefficients. This could be attributed to the cavitation and vibration caused by the ultrasounds, which would enhance extraction efficiency as a result of improved solvent penetration [38].
The above-mentioned results were verified by means of a Pareto chart (Figure 1) which revealed that methanol concentration, ultrasound amplitude, and the quadratic term of pH, temperature, ratio, and amplitude have a relevant effect on the TPC extracted from S. chamaecyparissus by UAE.
The results obtained in this work are similar to those obtained by V. González de Peredo et al., (2019) [25], who indicate that the double interaction between methanol concentration and the temperature was one of the most influential variables on the extraction of TPC from myrtle (Myrtus communis L.). Furthermore, Espada-Bellido et al., (2017) [34] and Zardo et al., (2019) [39] both found that the solvent composition was one of the most influential factors on the extraction of TPC respectively from mulberry (Morus nigra) and sunflower cake. While, Ryu and Koh, (2019) [40] point out that the solid-liquid ratio and the ultrasound amplitude significantly affect the extraction of TPC from black soybeans (Glycine max L.).
The optimal conditions for the TPC extraction from S. chamaecyparissus were determined through the analysis of the design and were as follows: 74% methanol in the water at pH 3, 70 °C extraction temperature, 80% ultrasound amplitude, 0.6 s cycle, and 5/0.2 mL/g solvent-sample ratio. An acidified solvent was found to be optimum for the extraction of the TPC, which is in accordance with numerous previous works that reported the largest extraction yields when a high percentage of solvent with a pH level between 3 and 7 were employed [25,34]. Other authors indicate that high amplitude values would cause bubble cavitation and intense collapses that would disrupt cell walls and increase the release of the targeted compounds [40]. Temperatures above 70 °C were not tested because of the considerable evaporation of the extraction solvent at those temperatures. In addition, a higher temperature would affect the solvent-sample ratio and cause the degradation of the phenolic compounds [41]. Likewise, no greater ultrasound amplitude values were tested, since extract losses could be observed due to the splashing effect caused by the ultrasound waves intense power.

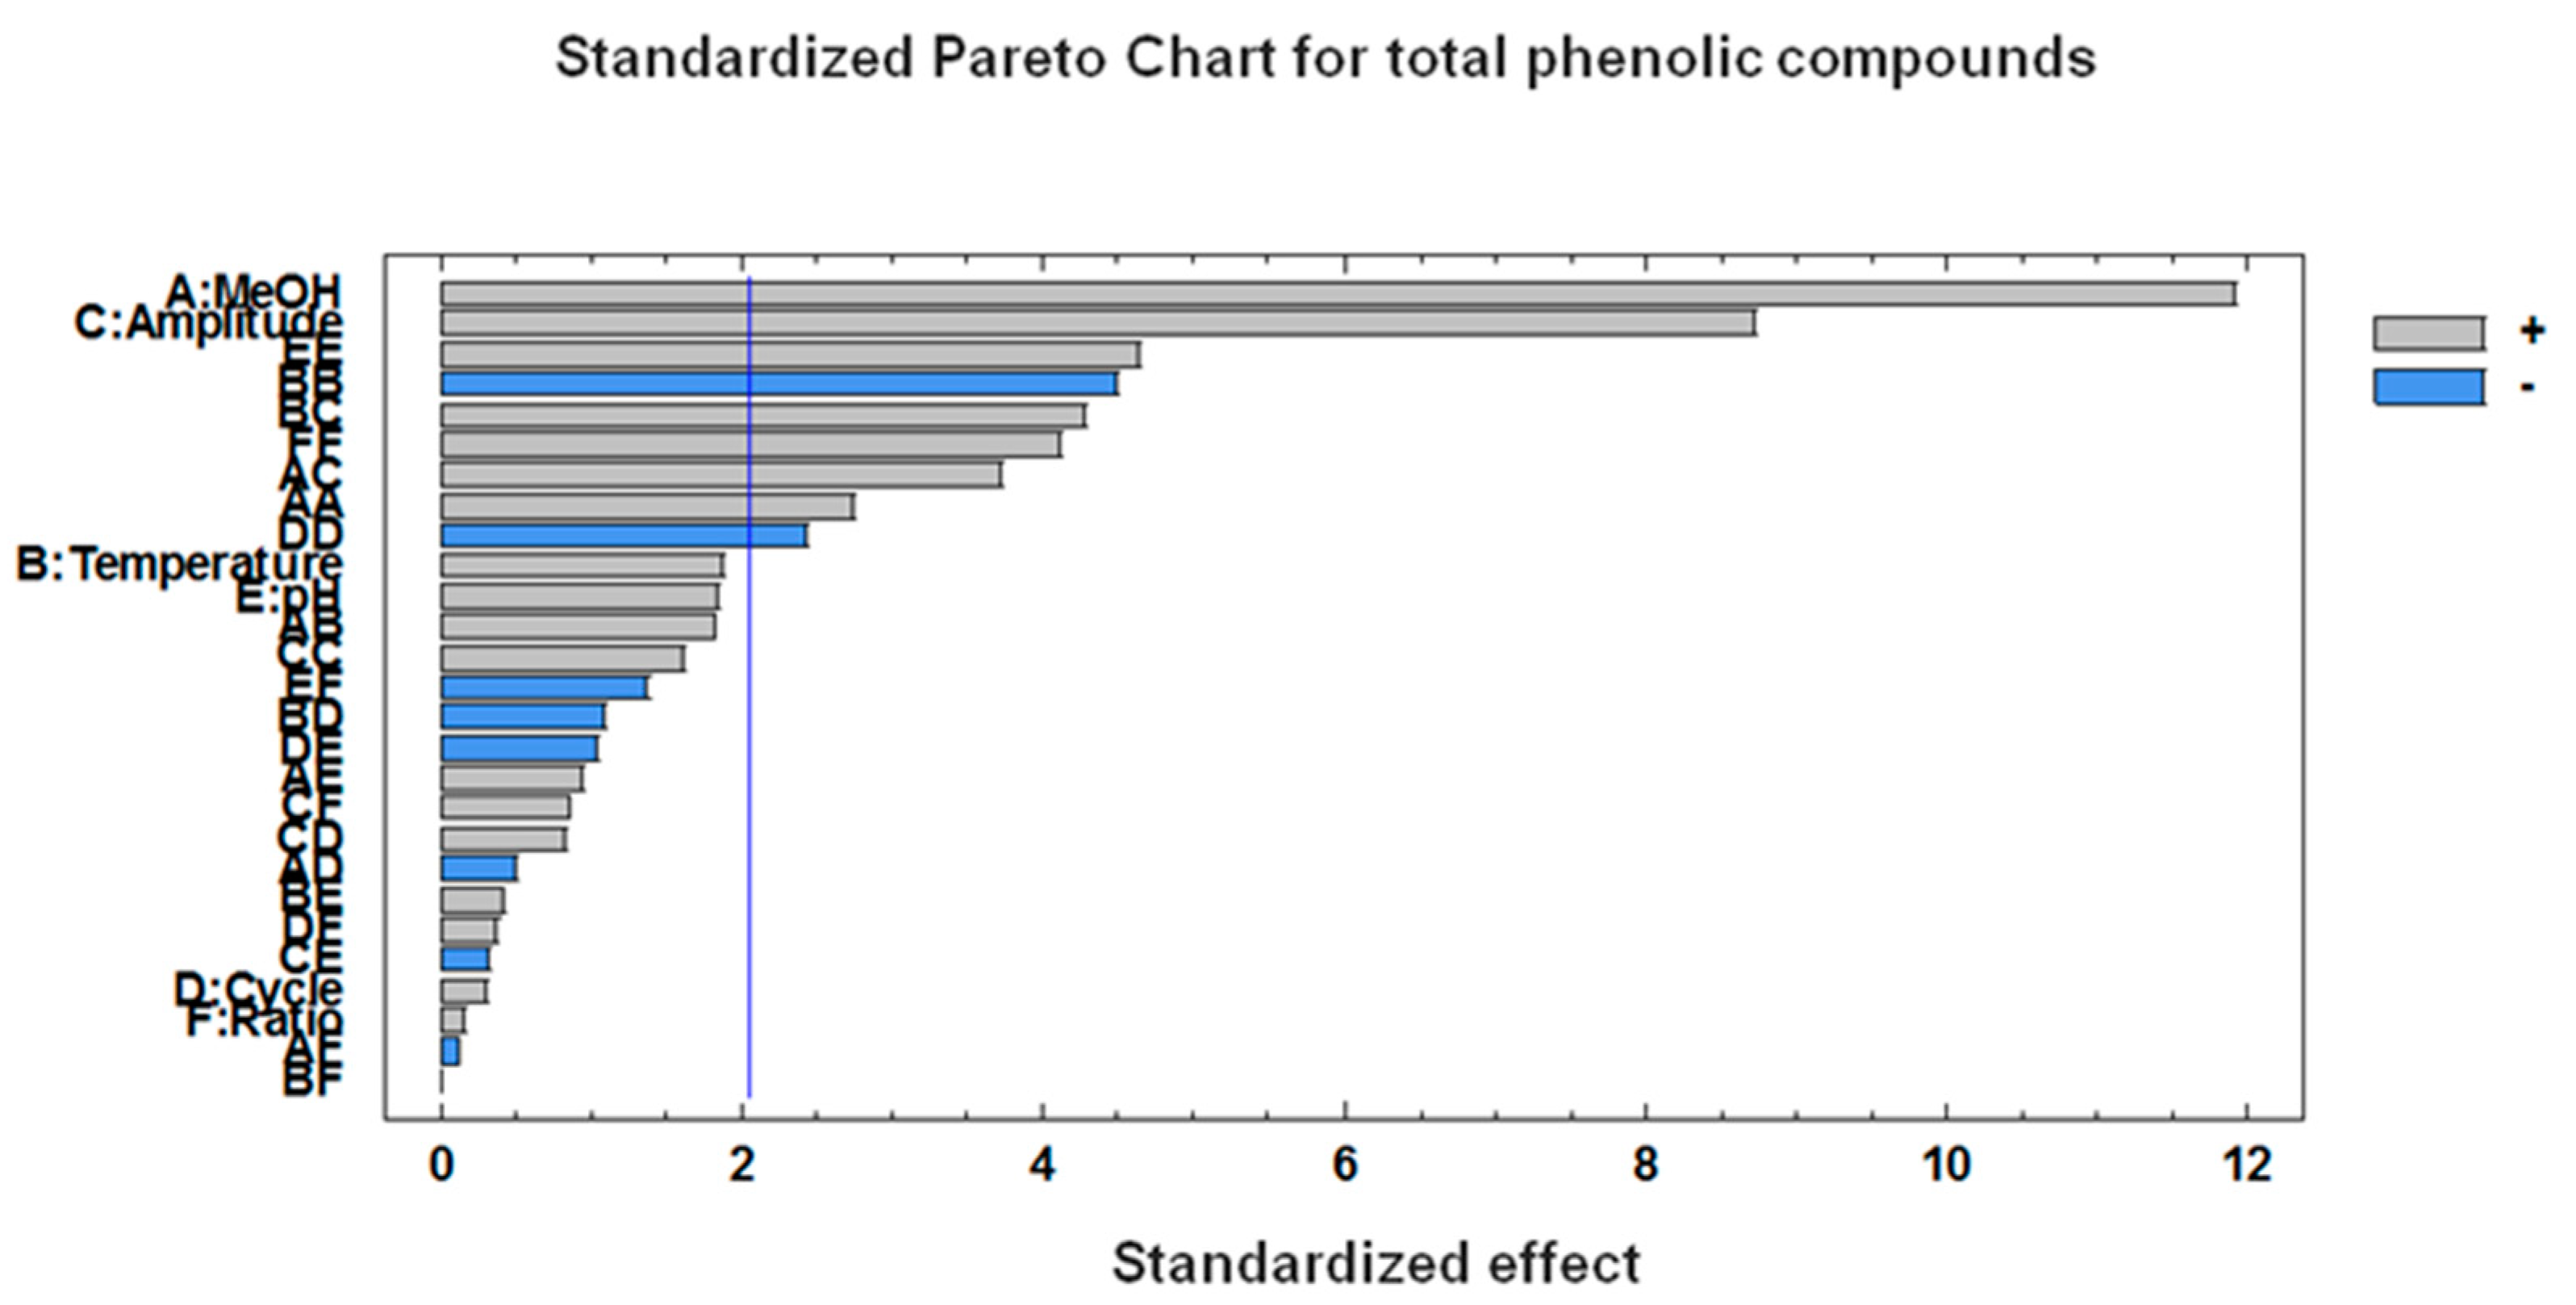
3.2. Optimization of the Microwave-Assisted Extraction (MAE) Conditions

Before carrying out the experimental design for MAE, the degradability of the two major phenolic compounds present in S. chamaecyparissus (chlorogenic acid and cynarin) was evaluated with respect to temperature. Temperatures of 50-75-100-125-150 °C were evaluated, during 10 min. These conditions were applied to volumes of S. chamaecyparissus extract (15 mL) previously obtained from a mother extract using UAE (methanol-water—50%; pH—4.5; solvent-sample ratio—10/0.2 mL/g). Each experiment was done in duplicate. The results obtained show that there is a degradation of these two compounds at temperatures higher than 100 °C (125 and 150 °C), so the study interval was determined as 50-75-100 °C.
The different results obtained for the extraction of the TPC from S. chamaecyparissus where four variables were set at three different levels can be seen in Table 1. The MAE yields obtained were between 17.57 and 38.15 mg g–1 of TPC, i.e., larger than those obtained by UAE.
To study the relationship between the independent variables and their responses, a second-order polynomial (Equation (2)) was developed as follows:
YTP (mg g1) = 31.87 − 8.69·X1 + 5.05·X2 − 0.42·X3 + 6.19·X4 − 10.45·X12 − 0.68·X1X2 − 3.14·X1X3 − 1.33·X1X4 − 0.28·X22 − 1.47·X2 X3
0.36·X2X4 + 1.93·X32 − 2.56·X3X4 − 3.27·X42
The correlation coefficient square (R2 = 84.85%) clearly demonstrated an extremely close agreement between estimated and actual data.
The results, presented in Table 3, reveal that the p-values for the %MeoH, the solvent-sample ratio, and the temperature were less than 0.05, which confirms that the effect of these three factors on the TPC extractions was more significant than just the effect from pH. Although the quadratic effect between the different factors did not show any significant interactions, it seems clear that the variations in the percentage of methanol (X1) significantly affects the extraction yields of the phenolic compounds. Thus, the analysis of the model confirms that a higher methanol percentage has a negative effect (–8.69) on the yields. On the contrary, the temperature (5.05) and the solvent-sample ratio (6.19) had both positive effects on the yields, which means that a high solvent-sample ratio and a higher temperature would sharply increase TPC extraction yields. This phenomenon might be explained by the larger volume of extraction solvent, which would contribute to a quick release of the intracellular substances [42]. Moreover, methanol showed a significant quadratic effect, with a negative coefficient (–10.45).
The Pareto chart (Figure 2) confirms the above explained statistical results, where the influence of the solvent, the extraction temperature, the solvent-sample ratio, and its quadratic interaction can be observed. These results are in agreement with those obtained by V. González de Peredo et al., (2018) [31], who reported that solvent composition is one of the most influential factors on the extraction of TPC from myrtle (Myrtus communis L.), and Vázquez-Espinosa et al., (2018) [30] who reported that the extraction temperature and the solvent percentage were the most influential parameters on the extraction of TPC from maqui berry (Aristotelia chilensis). In the same way, Zhang et al., (2019) [43] proved that the concentration of the solvent and the solvent-sample ratio are the most influential factors on the extraction of TPC from Asparagus officinalis L. roots.
The optimal conditions for the MAE of TPCs from S. chamaecyparissus were as follows: 65% methanol in the water at pH 2, 100 °C temperature, and 15/0.2 mL/g as the optimum solvent-sample ratio. The percentage of solvent is at a rather mild level, which is in accordance with many recent publications [23,30,31,43]. pH levels lower than 2 were not tested, since the extractions using solvent at a lower pH level may cause the acid hydrolysis of the TPCs [44]. With respect to the extraction temperatures, the maximum temperature used was 100 °C, since higher temperatures could cause a degradation of the phenolic compounds [45].

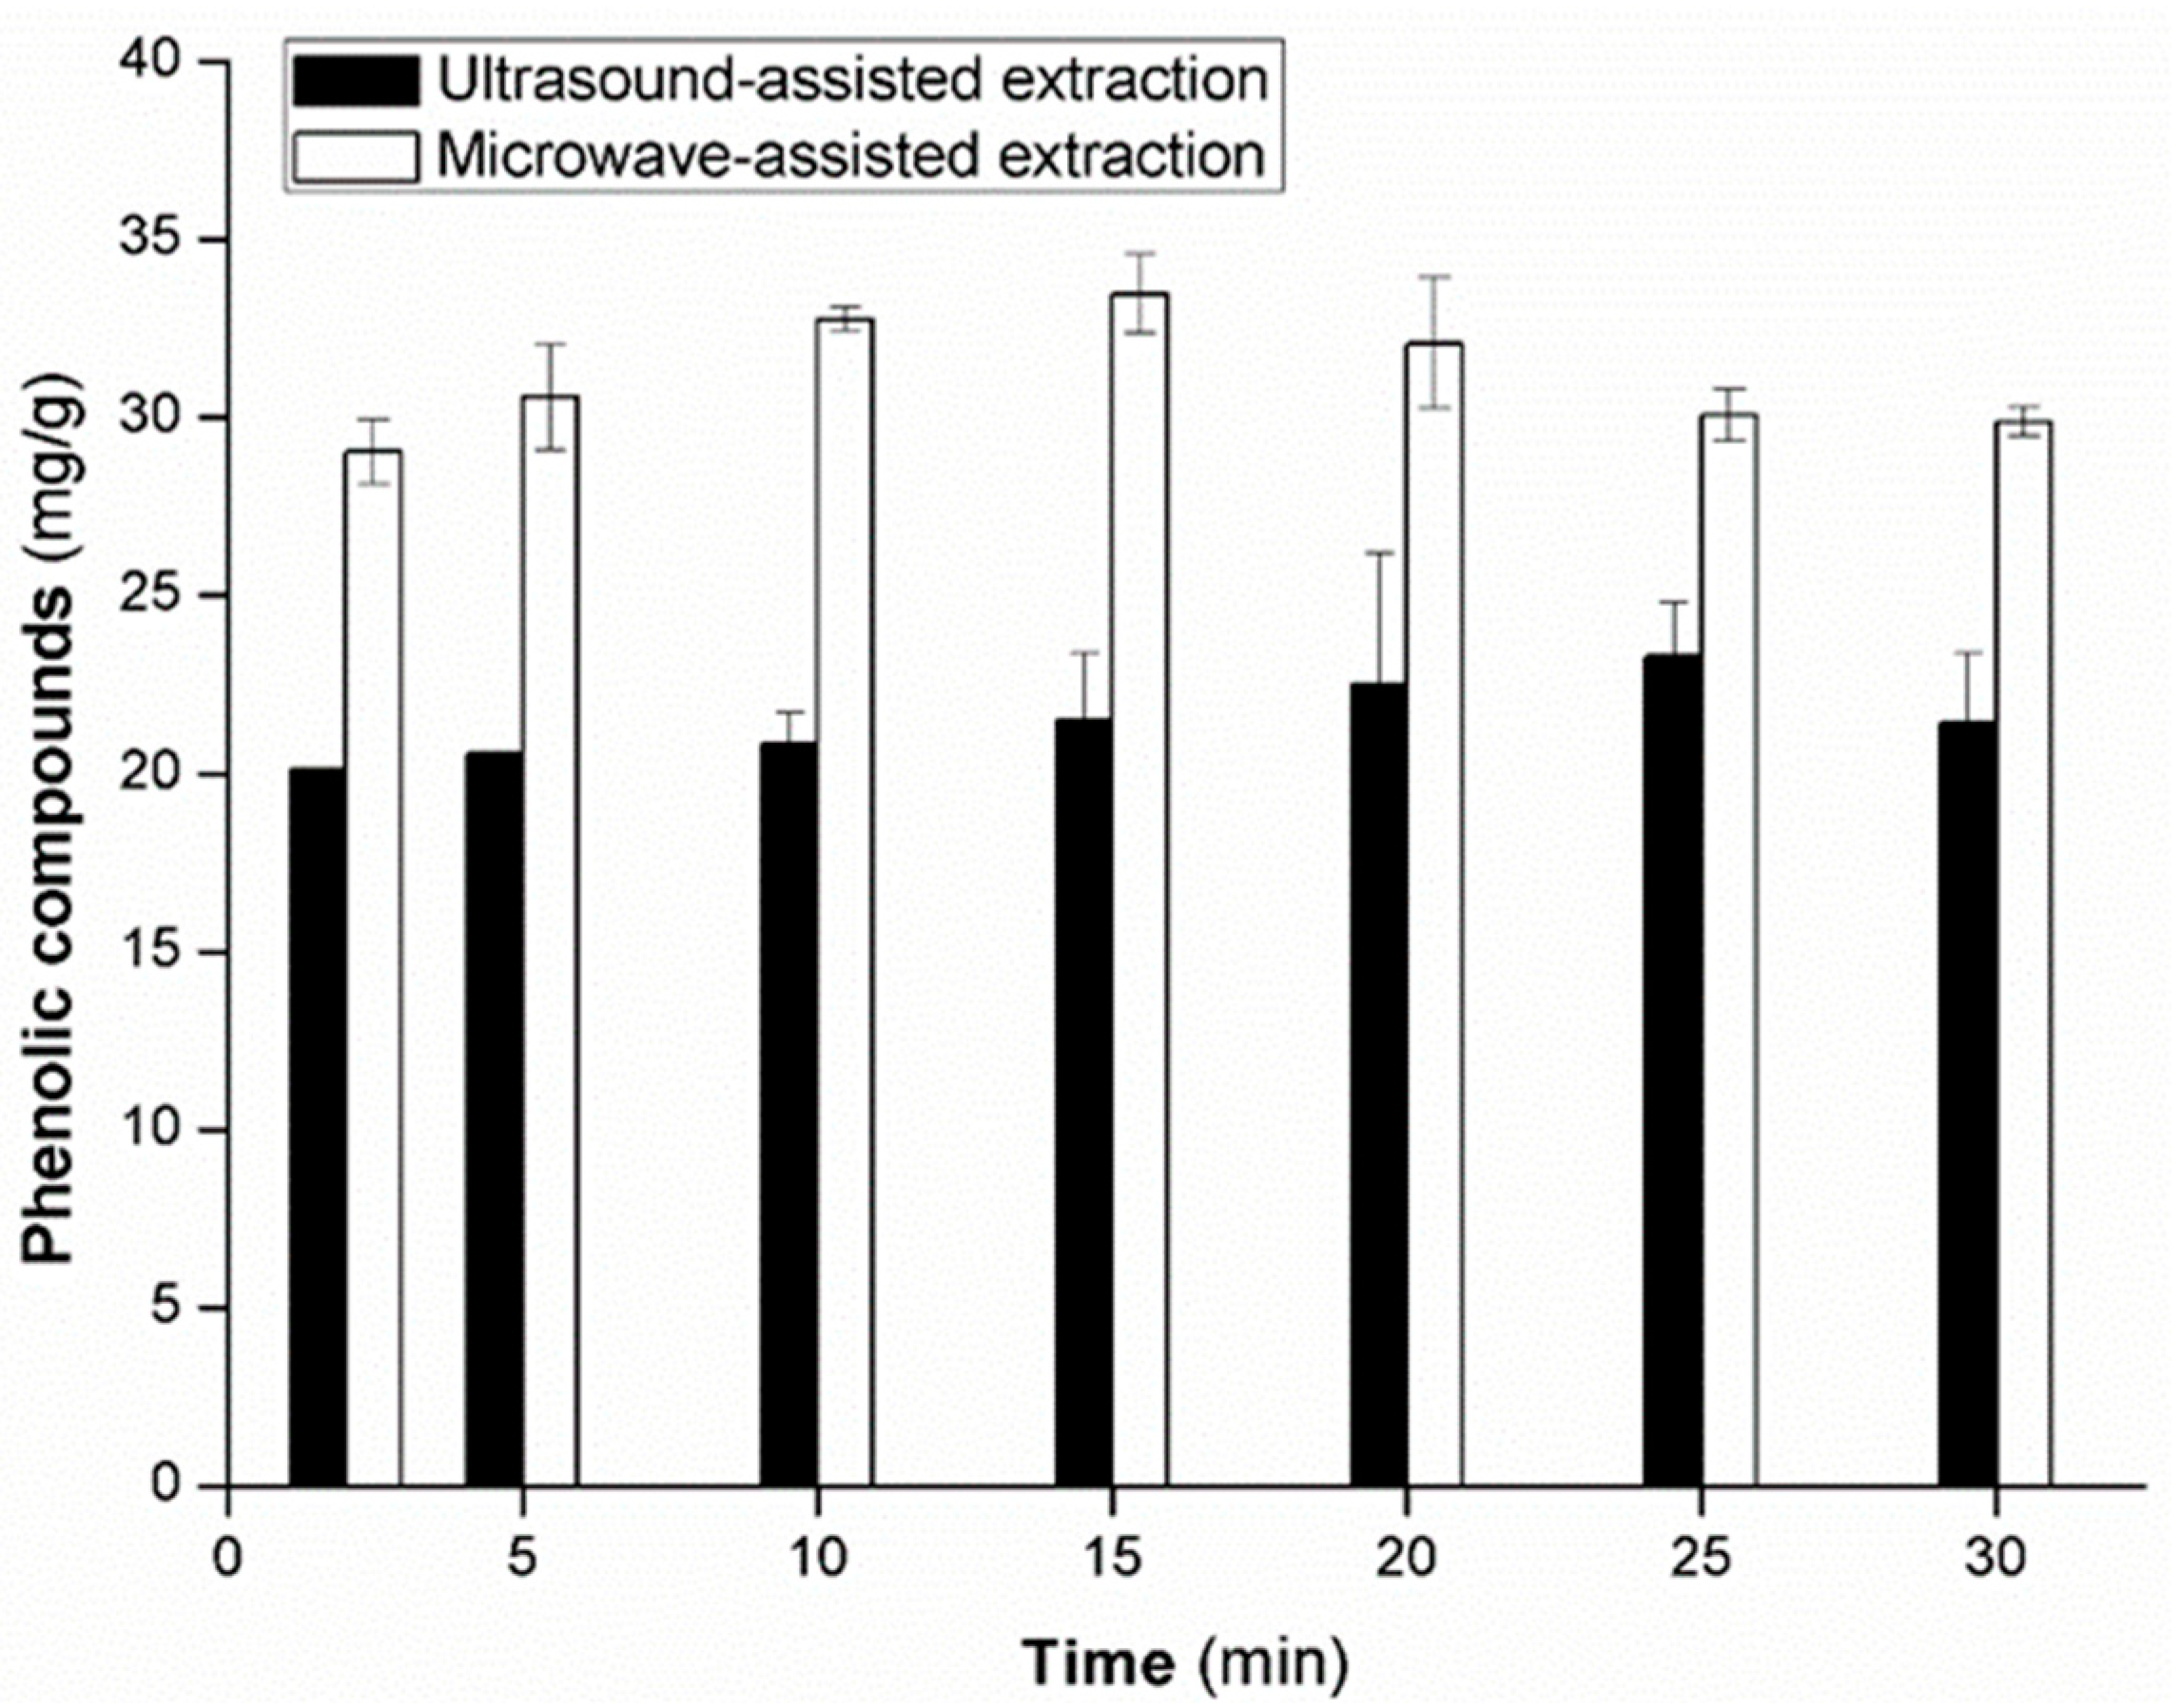
3.3. Extraction Time

In order to determine the time that would give place to the maximum TPC extraction yields, different times (5, 10, 15, 20, 25, and 30 min) were tested in triplicate under optimal extraction conditions. Figure 3 shows the resulting S. chamaecyparissus TPC yields from UAE and MAEs.
It can be seen that the amount of TPC extracted increases with time until a maximum yield is reached at 15 min in the case of MAE and at 25 min in the case of UAE. Times longer than those would result in a sharp reduction of the yields. Consequently, it should be concluded that 15 and 25 min were the respective optimal extraction times for TPC MAE and UAE extractions.
These results are in agreement with [46] where 26.1 min was the optimal time for the UAE of anthocyanins from Hibiscus sabdariffa. and with V. González de Peredo et al., (2018) [31] who found that 15 min was the optimal time for TPC MAE from myrtle (Myrtus communis L.).
Our results suggest that MAE is faster and obtains greater TPC yields than UAE from S. chamaecyparisssus. Similar results were reported by Kaderides et al., (2019) [23] according to whom MAE would obtain 1.7 greater TPC yields from pomegranate peels and in a shorter time (4 min) than those obtained by UAE. These differences can be explained by the intense cell destruction that MAE causes on the plant material [23] and also to the higher pressures and temperatures that are reached when MAE is applied.

3.4. Repeatability and Intermediate Precision of the Methods

The precision of the UAE and the MAE methods applied to the extraction of total phenolic compounds from S. chamaecyparissus were evaluated on the same day (repeatability) and on different days (intermediate precision) under the optimum conditions established for each one of the extraction methods. A total of 30 extractions were carried out using each one of the methods under such optimum conditions on three consecutive days. For repeatability, 10 extractions were performed on the same day under invariable conditions. To determine their intermediate precision, 10 extractions were carried out on each one of the two following days.
The repeatability results were 4.11% for UAE and 3.38% for MAE. The intermediate precision results were 4.54% for UAE and 3.82% for MAE. Both repeatability and intermediate precision were within the acceptable limits (±10%) according to AOAC [47] and showed good precision, with values under 5.0% for both TPC UAE and MAEs from S. chamaecyparissus.

3.5. Identification and Quantification of the Phenolic Compounds

The S. chamaecyparissus extracts obtained under the optimal conditions (UAE and MAE) were analyzed by UHPLC-QToF-MS. In order to identify the phenolic compounds, the data obtained were compared with the data available from the literature regarding other Santolina species [16] and also with the retention time, ultraviolet-visible (UV-Vis), and mass spectra corresponding to their available standard compounds (chlorogenic acid, quercetin 3-O-galactoside, quercetin 3-O-glucoside, isoorientin, and cynarin). The molecular ions [M-H] monitored for their identification were (by peak emergence order): chlorogenic acid (m/z 353.1437), quercetin 3-O-galactoside (m/z 463.1621), quercetin 3-O-glucoside (m/z 463.1615), isoorientin (m/z 447.1635), and cynarin (m/z 515.2030). The TIC chromatogram, the chromatograms for their respective masses, and the mass spectra corresponding to all these compounds are presented in Figures S1–S10. The five phenolic compounds obtained by UAE and MAE were also detected and quantified by means of the UHPLC-DAD equipment. A typical chromatogram (λ = 350 nm) is presented in Figure 4. The phenolic compound content in S. chamaecyparissus is presented in Table 4.
As can be seen in Table 4, the phenolic compound that presents the highest concentration in S. chamaecyparissus is cynarin, followed by chlorogenic acid. Regarding the presence of flavonoids (quercetin 3-O-galactoside, quercetin 3-O-glucoside, and isoorientin) in S. chamaecyparissus, its concentration is lower when compared to compounds 1 and 4. This high content in phenolic compounds makes S. chamaecyparissus an excellent source of certain compounds that could be useful to control some human diseases and also for specific applications in agriculture. These compounds, with the exception of chlorogenic acid, have been identified in S. chamaecyparissus for the first time.

4. Conclusions

This is the first report that has been published on the UAE and MAE of phenolic compounds from S. chamaecyparissus. Both extraction methods have been optimized using a BBD. The optimal UAE extraction conditions were established at 74% methanol in the water at pH 3, an extraction temperature of 70 °C, an ultrasound amplitude of 80%, cycles of 0.6 s, and a solvent-solid ratio of 5/0.2 mL/g. The optimum conditions for MAE extraction were determined as 65% methanol in the water at pH 2, 100 °C extraction temperature, and 15/0.2 mL/g as the optimum solvent-solid ratio. The optimal extraction time for MAE and UAE were 15 and 25 min respectively. To the best of our knowledge, this is the first report on a UHPLC-QToF-MS analysis of S. chamaecyparissus extracts. Analyzes have revealed the presence of the five following major phenolic compounds: chlorogenic acid, quercetin 3-O-galactoside, quercetin 3-O-glucoside, isoorientin, and cynarin. With the exception of chlorogenic acid, the other four compounds have been identified for the first time in S. chamaecyparissus. The comparison of the two methods has confirmed that MAE would be a more attractive method to be considered in future studies for the extraction of phenolic compounds from S. chamaecyparissus.

Supplementary Materials

The following are available online at https://www.mdpi.com/2073-4395/11/1/84/s1, Figure S1: TIC chromatogram of Santolina chamaecyparissus L. extract; Figure S2: Chromatogram at m/z 353 in negative mode for chlorogenic acid (Peak1) in Santolina chamaecyparissus L. extract; Figure S3: m/z spectrum for chlorogenic acid (time = 2.74 min) in Santolina chamaecyparissus L. extract; Figure S4: Chromatogram at m/z 463 in negative mode for quercetin 3-O-galactoside (Peak2) and quercetin 3-O-glucoside (Peak3) in Santolina chamaecyparissus L. extract; Figure S5: m/z spectrum for quercetin 3-O-galactoside (time = 5.25 min) in Santolina chamaecyparissus L. extract; Figure S6: m/z spectrum for quercetin 3-O-glucoside (time = 5.41 min) in Santolina chamaecyparissus L. extract; Figure S7: Chromatogram at m/z 447 in negative mode for isoorientin (Peak4) in Santolina chamaecyparissus L. extract; Figure S8: m/z spectrum for isoorientin (time = 5.44 min) in Santolina chamaecyparissus L. extract; Figure S9: Chromatogram at m/z 515 in negative mode for cynarin (Peak5) in Santolina chamaecyparissus L. extract; Figure S10: m/z spectrum for cynarin (time = 5.52 min) in Santolina chamaecyparissus L. extract.

Author Contributions

Conceptualization, G.F.B. and H.E.; methodology, M.A.; software, G.F.B. and M.A.; formal analysis, M.A., A.V.G.-d.-P. and M.V.-E.; investigation, G.F.B. and M.A.; resources, M.P.; data curation, M.A., A.V.G.-d.-P. and M.V.-E.; writing—original draft preparation, M.A.; writing—review and editing, G.F.B.; supervision, G.F.B., M.P. and H.E.; project administration, G.F.B.; funding acquisition, M.P. and G.F.B. All authors have read and agreed to the published version of the manuscript.

Funding

This work has been supported by the project “EQC2018-005135-P” (Equipment for liquid chromatography by means of mass spectrometry and ion chromatography), of the State Subprogram of Research Infrastructures and Technical Scientific Equipment. This work has also been supported by V. la Andaluza and University of Cadiz by the project OT2016/046. The authors thank the Spanish Ministry of Science and Innovation for the predoctoral contracts (FPU grant AP-2018-03811) granted to Ana Velasco González de Peredo and (FPU17-02962) granted to Mercedes Vázquez-Espinosa.

Data Availability Statement

Data is contained within the article and supplementary material.

Acknowledgments

The authors are grateful to the Instituto de Investigación Vitivinícola y Agroalimentaria (IVAGRO) for providing the necessary facilities to carry out the research. A special remark goes to Carmelo García Barroso (in memoriam) for his contribution to the scientific community in the area of phenolic compounds and oenology and his important inputs to this research.

Conflicts of Interest

The authors declare no conflict of interest.

References

  1. Ruiz-Navajas, Y.; Viuda-Martos, M.; Perez-Alvarez, J.A.; Sendra, E.; Fernández-López, J. Chemical Characterization and Antibacterial Activity of Two Aromatic Herbs (Santolina chamaecyparissus and Sideritis angustifolia) Widely Used in the Folk Medicine. J. Food Saf. 2012, 32, 426–434. [Google Scholar] [CrossRef]
  2. Djarmouni, M.; Baghiani, A.; Adjadj, M.; Arrar, L. In vitro and in vivo Antioxidant, Antihemolytic and Anti-inflammatory Activities of Santolina chamaecyparissus Extracts. Pharmacogn. Commun. 2018, 8, 15–24. [Google Scholar] [CrossRef] [Green Version]
  3. Elguea-Culebras, G.O.; Sánchez-Vioque, R.; Berruga, M.I.; Herraiz-Peñalver, D.; González-Coloma, A.; Andrés, M.F.; Santana-Méridas, O. Biocidal Potential and Chemical Composition of Industrial Essential Oils from Hyssopus officinalis, Lavandula × intermedia var. Super, and Santolina chamaecyparissus. Chem. Biodivers. 2018, 15, e1700313. [Google Scholar] [CrossRef] [PubMed]
  4. Seo, S.-M.; Kim, J.; Kang, J.; Koh, S.-H.; Ahn, Y.-J.; Kang, K.-S.; Park, I.-K. Fumigant toxicity and acetylcholinesterase inhibitory activity of 4 Asteraceae plant essential oils and their constituents against Japanese termite (Reticulitermes speratus Kolbe). Pestic. Biochem. Physiol. 2014, 113, 55–61. [Google Scholar] [CrossRef] [PubMed]
  5. Yeom, H.-J.; Jung, C.-S.; Kang, J.; Kim, J.; Lee, J.-H.; Kim, D.-S.; Kim, H.-S.; Park, P.-S.; Kang, K.-S.; Park, I.-K. Insecticidal and Acetylcholine Esterase Inhibition Activity of Asteraceae Plant Essential Oils and Their Constituents against Adults of the German Cockroach (Blattella germanica). J. Agric. Food Chem. 2015, 63, 2241–2248. [Google Scholar] [CrossRef] [PubMed]
  6. Diánez, F.; Santos, M.; Parra, C.; Navarro, M.J.; Blanco, R.; Gea, F.J. Screening of antifungal activity of 12 essential oils against eight pathogenic fungi of vegetables and mushroom. Lett. Appl. Microbiol. 2018, 67, 400–410. [Google Scholar] [CrossRef] [PubMed]
  7. Salah-Fatnassi, K.B.H.; Hassayoun, F.; Cheraif, I.; Khan, S.; Jannet, H.B.; Hammami, M.; Aouni, M.; Harzallah-Skhiri, F. Chemical composition, antibacterial and antifungal activities of flowerhead and root essential oils of Santolina chamaecyparissus L., growing wild in Tunisia. Saudi J. Biol. Sci. 2017, 24, 875–882. [Google Scholar] [CrossRef] [Green Version]
  8. Djeddi, S.; Djebile, K.; Hadjbourega, G.; Achour, Z.; Argyropoulou, C.; Skaltsa, H. In vitro antimicrobial properties and chemical composition of santolina chamaecyparissus essential oil from Algeria. Nat. Prod. Commun. 2012, 7, 937–940. [Google Scholar] [CrossRef] [Green Version]
  9. Czerniewicz, P.; Chrzanowski, G.; Sprawka, I.; Sytykiewicz, H. Aphicidal activity of selected Asteraceae essential oils and their effect on enzyme activities of the green peach aphid, Myzus persicae (Sulzer). Pestic. Biochem. Physiol. 2018, 145, 84–92. [Google Scholar] [CrossRef]
  10. Demirci, B.; Özek, T.; Baser, K.H.C. Chemical composition of santolina chamaecyparissus L. Essential oil. J. Essent. Oil Res. 2000, 12, 625–627. [Google Scholar] [CrossRef]
  11. Derbesy, M.; Touche, J.; Zola, A. The Essential Oil of Santolina chamaecyparissus L. J. Essent. Oil Res. 1989, 1, 269–275. [Google Scholar] [CrossRef]
  12. Garg, S.N.; Gupta, D.; Mehta, V.K.; Kumar, S. Volatile Constituents of the Essential Oil of Santolina chamaecyparissus Linn, from the Southern Hills of India. J. Essent. Oil Res. 2001, 13, 234–235. [Google Scholar] [CrossRef]
  13. Zaiter, L.; Benayache, F.; Beghidja, N.; Figueredo, G.; Chalard, P.; Chalchat, J.-C.; Marchioni, E.; Benayache, S. Essential oils of Santolina africana Jord. & Fourr. and Santolina chamaecyparissus L. J. Essent. Oil Bear. Plants 2015, 18, 1338–1342. [Google Scholar] [CrossRef]
  14. Sacchetti, G.; Romagnoli, C.; Ballero, M.; Tosi, B.; Poli, F. Internal secretory structures and preliminary phytochemical investigation on flavonoid and coumarin content in Santolina insularis (Asteraceae). Phyton 1997, 37, 219–228. [Google Scholar]
  15. Güneş, A.; Kordali, Ş.; Turan, M.; Bozhüyük, A.U. Determination of antioxidant enzyme activity and phenolic contents of some species of the Asteraceae family from medicanal plants. Ind. Crop. Prod. 2019, 137, 208–213. [Google Scholar] [CrossRef]
  16. Rodrigues, A.M.; Falé, P.D.V.; Madeira, P.J.A. Phenolic profile and biological activities of decoctions from Santolina impressa, a Portuguese endemic species. J. Herb. Med. 2020, 21, 100335. [Google Scholar] [CrossRef]
  17. de Castro, M.D.L.; García-Ayuso, L.E. Soxhlet extraction of solid materials: An outdated technique with a promising innovative future. Anal. Chim. Acta 1998, 369, 1–10. [Google Scholar] [CrossRef]
  18. Alupului, A.; Calinescu, I.; Lavric, V. Microwave extraction of active principles from medicinal plants. UPB Sci. Bull. Ser. B 2012, 74, 129–142. [Google Scholar]
  19. Chemat, F.; Tomao, V.; Virot, M. Chapter 5: Ultrasound-assisted extraction in food analysis. In Handbook of Food Analysis Instruments, 1st ed.; Otles, S., Ed.; CRC Press: Boca Raton, FL, USA, 2008; pp. 80–100. [Google Scholar] [CrossRef]
  20. Cravotto, G.; Boffa, L.; Mantegna, S.; Perego, P.; Avogadro, M.; Cintas, P. Improved extraction of vegetable oils under high-intensity ultrasound and/or microwaves. Ultrason. Sonochem. 2008, 15, 898–902. [Google Scholar] [CrossRef]
  21. Chemat, F.; Rombaut, N.; Sicaire, A.-G.; Meullemiestre, A.; Fabiano-Tixier, A.-S.; Abert-Vian, M. Ultrasound assisted extraction of food and natural products. Mechanisms, techniques, combinations, protocols and applications. A review. Ultrason. Sonochem. 2017, 34, 540–560. [Google Scholar] [CrossRef]
  22. Herrera, M.C.; De Castro, M.L. Ultrasound-assisted extraction of phenolic compounds from strawberries prior to liquid chromatographic separation and photodiode array ultraviolet detection. J. Chromatogr. A 2005, 1100, 1–7. [Google Scholar] [CrossRef] [PubMed]
  23. Kaderides, K.; Papaoikonomou, L.; Serafim, M.; Goula, A.M. Microwave-assisted extraction of phenolics from pomegranate peels: Optimization, kinetics, and comparison with ultrasounds extraction. Chem. Eng. Process. Intensif. 2019, 137, 1–11. [Google Scholar] [CrossRef]
  24. Kratchanova, M.; Pavlova, E.; Panchev, I. The effect of microwave heating of fresh orange peels on the fruit tissue and quality of extracted pectin. Carbohydr. Polym. 2004, 56, 181–185. [Google Scholar] [CrossRef]
  25. González de Peredo, A.V.; Vázquez-Espinosa, M.; Espada-Bellido, E.; Ferreiro-González, M.; Amores-Arrocha, A.; Palma, M.; Barbero, G.F.; Jiménez-Cantizano, A. Alternative Ultrasound-Assisted Method for the Extraction of the Bioactive Compounds Present in Myrtle (Myrtus communis L.). Molecules 2019, 24, 882. [Google Scholar] [CrossRef] [PubMed] [Green Version]
  26. Santos, M.P.; Souza, M.C.; Sumere, B.R.; da Silva, L.C.; Cunha, D.T.; Bezerra, R.M.N.; Rostagno, M.A. Extraction of bioactive compounds from pomegranate peel (Punica granatum L.) with pressurized liquids assisted by ultrasound combined with an expansion gas. Ultrason. Sonochem. 2019, 54, 11–17. [Google Scholar] [CrossRef]
  27. Vázquez-Espinosa, M.; González de Peredo, A.V.; Ferreiro-González, M.; Barbero, G.F.; Espada-Bellido, E. Assessment of ultrasound assisted extraction as an alternative method for the extraction of anthocyanins and total phenolic compounds from maqui berries (Aristotelia chilensis (Mol.) Stuntz). Agronomy 2019, 9, 148. [Google Scholar] [CrossRef] [Green Version]
  28. Vázquez-Espinosa, M.; González de Peredo, A.V.; Espada-Bellido, E.; Ferreiro-González, M.; Toledo-Dominguez, J.J.; Carrera, C.; Palma, M.; Barbero, G.F. Ultrasound-assisted extraction of two types of antioxidant compounds (TPC and TA) from black chokeberry (Aronia melanocarpa L.): Optimization of the individual and simultaneous extraction methods. Agronomy 2019, 9, 456. [Google Scholar] [CrossRef] [Green Version]
  29. González de Peredo, A.V.; Vázquez-Espinosa, M.; Espada-Bellido, E.; Ferreiro-González, M.; Carrera, C.; Palma, M.; Álvarez, J.A.; Barbero, G.F.; Ayuso, J. Optimization of analytical ultrasound-assisted methods for the extraction of total phenolic compounds and anthocyanins from sloes (Prunus spinosa L.). Agronomy 2020, 10, 966. [Google Scholar] [CrossRef]
  30. Vázquez-Espinosa, M.; Espada-Bellido, E.; González de Peredo, A.V.; Ferreiro-González, M.; Carrera, C.; Palma, M.; Barroso, C.G.; Barbero, G.F. Optimization of Microwave-Assisted Extraction for the Recovery of Bioactive Compounds from the Chilean Superfruit (Aristotelia chilensis (Mol.) Stuntz). Agronomy 2018, 8, 240. [Google Scholar] [CrossRef] [Green Version]
  31. González de Peredo, A.V.; Vázquez-Espinosa, M.; Espada-Bellido, E.; Jiménez-Cantizano, A.; Ferreiro-González, M.; Amores-Arrocha, A.; Palma, M.; Barroso, C.G.; Barbero, G.F. Development of New Analytical Microwave-Assisted Extraction Methods for Bioactive Compounds from Myrtle (Myrtus communis L.). Molecules 2018, 23, 2992. [Google Scholar] [CrossRef] [Green Version]
  32. Aliaño-González, M.J.; Ferreiro-González, M.; Espada-Bellido, E.; Carrera, C.; Palma, M.; Ayuso, J.; Barbero, G.F.; Álvarez, J.A. Extraction of Anthocyanins and Total Phenolic Compounds from Açai (Euterpe oleracea Mart.) Using an Experimental Design Methodology. Part 3: Microwave-Assisted Extraction. Agronomy 2020, 10, 179. [Google Scholar] [CrossRef] [Green Version]
  33. Machado, A.P.D.F.; Pereira, A.L.D.; Barbero, G.F.; Martínez, J. Recovery of anthocyanins from residues of Rubus fruticosus, Vaccinium myrtillus and Eugenia brasiliensis by ultrasound assisted extraction, pressurized liquid extraction and their combination. Food Chem. 2017, 231, 1–10. [Google Scholar] [CrossRef] [PubMed]
  34. Espada-Bellido, E.; Ferreiro-González, M.; Carrera, C.; Palma, M.; Barroso, C.G.; Barbero, G.F. Optimization of the ultrasound-assisted extraction of anthocyanins and total phenolic compounds in mulberry (Morus nigra) pulp. Food Chem. 2017, 219, 23–32. [Google Scholar] [CrossRef] [PubMed]
  35. Maran, J.P.; Sivakumar, V.; Thirugnanasambandham, K.; Sridhar, R. Optimization of microwave assisted extraction of pectin from orange peel. Carbohydr. Polym. 2013, 97, 703–709. [Google Scholar] [CrossRef] [PubMed]
  36. Singleton, V.L.; Orthofer, R.; Lamuela-Raventós, R.M. Analysis of total phenols and other oxidation substrates and antioxidants by means of folin-ciocalteu reagent. Methods Enzymol. 1999, 299, 152–178. [Google Scholar] [CrossRef]
  37. Ferreira, S.C.; Bruns, R.E.; Ferreira, H.S.; Matos, G.D.; David, J.M.; Brandao, G.C.; da Silva, E.P.; Portugal, L.A.; Dos Reis, P.S.; Souza, A.S. Box-Behnken design: An alternative for the optimization of analytical methods. Anal. Chim. Acta 2007, 597, 179–186. [Google Scholar] [CrossRef] [PubMed]
  38. Wang, W.; Jung, J.; Tomasino, E.; Zhao, Y. Optimization of solvent and ultrasound-assisted extraction for different anthocyanin rich fruit and their effects on anthocyanin compositions. LWT-Food Sci. Technol. 2016, 72, 229–238. [Google Scholar] [CrossRef] [Green Version]
  39. Zardo, I.; de Sobczyk, A.E.; Marczak, L.D.F.; Sarkis, J. Optimization of Ultrasound Assisted Extraction of Phenolic Compounds from Sunflower Seed Cake Using Response Surface Methodology. Waste Biomass Valori. 2019, 10, 33–44. [Google Scholar] [CrossRef]
  40. Ryu, D.; Koh, E. Optimization of Ultrasound-Assisted Extraction of Anthocyanins and Phenolic Compounds from Black Soybeans (Glycine max L.). Food Anal. Methods 2019, 12, 1382–1389. [Google Scholar] [CrossRef]
  41. Carrera, C.; Ruiz-Rodríguez, A.; Palma, M.; Barroso, C.G. Ultrasound assisted extraction of phenolic compounds from grapes. Anal. Chim. Acta 2012, 732, 100–104. [Google Scholar] [CrossRef]
  42. Guo, D.; Chen, F.; Wheeler, J.; Winder, J.; Selman, S.; Peterson, M.; Dixon, R.A. Improvement of in-rumen digestibility of alfalfa forage by genetic manipulation of lignin O-methyltransferases. Transgenic Res. 2001, 10, 457–464. [Google Scholar] [CrossRef] [PubMed]
  43. Zhang, H.; Birch, J.; Ma, Z.F.; Xie, C.; Yang, H.; Bekhit, A.E.-D.; Dias, G. Optimization of microwave-assisted extraction of bioactive compounds from New Zealand and Chinese Asparagus officinalis L. roots. J. Food Sci. Technol. 2019, 56, 799–810. [Google Scholar] [CrossRef] [PubMed]
  44. Putnik, P.; Kovačević, D.B.; Penić, M.; Fegeš, M.; Dragović-Uzelac, V. Microwave-Assisted Extraction (MAE) of Dalmatian Sage Leaves for the Optimal Yield of Polyphenols: HPLC-DAD Identification and Quantification. Food Anal. Methods 2016, 9, 2385–2394. [Google Scholar] [CrossRef]
  45. Spigno, G.; Tramelli, L.; De Faveri, D.M. Effects of extraction time, temperature and solvent on concentration and antioxidant activity of grape marc phenolics. J. Food Eng. 2007, 81, 200–208. [Google Scholar] [CrossRef]
  46. Pinela, J.; Prieto, M.A.; Pereira, E.; Jabeur, I.; Barreiro, M.F.; Barros, L.; Ferreira, I.C.F.R. Optimization of heat- and ultrasound-assisted extraction of anthocyanins from Hibiscus sabdariffa calyces for natural food colorants. Food Chem. 2019, 275, 309–321. [Google Scholar] [CrossRef] [PubMed] [Green Version]
  47. AOAC. Manual on Policies and Procedures. In Peer Verified Methods Program; AOAC International: Gaithersburg, MD, USA, 1998. [Google Scholar]
Figure 1. Pareto chart for the standardized effect of the variables on the UAE of phenolic compounds.
Agronomy 11 00084 g001
Figure 2. Pareto chart representing the standardized effects of the different variables on the MAE of the phenolic compounds in Santolina chamaecyparissus L.
Agronomy 11 00084 g002
Figure 3. Total Phenolic Content (TPC) UAE and MAE from Santolina chamaecyparissus L. using different times.
Agronomy 11 00084 g003
Figure 4. Ultra-High-Performance Liquid Chromatography (UHPLC)-DAD phenolic profile of S. chamaecyparissus extract (recorded at 350 nm) using MAE optimal conditions. Peak numbering is in accordance with Table 4.
Agronomy 11 00084 g004
Table 1. Microwave-assisted extraction (MAE) of the total phenolic compounds in Santolina chamaecyparissus according to a Box-Behnken design.
SampleParameterTPC (mg/g)
MeOH
X1
Temp.
X2
pH
X3
Ratio
X4
Observed ValueEstimated Value
1−1−10026.8399930.5967
21−10024.6314625.0459
3−110032.2095533.3202
4110023.7106921.4791
500−1−123.1975924.3012
6001−130.5415229.7064
700−1128.4866730.8469
8001135.1137535.5353
9000032.6100531.8689
10−100−123.8027225.5979
11100−120.4851918.2364
12−100132.3709133.1196
13100126.3845923.0893
140−1−1031.0338629.6506
1501−1030.2062930.6968
160−11038.1558636.1653
17011034.392634.2757
18000031.1895131.8689
190−10−127.3322627.0386
20010−128.6994529.1781
210−10136.290835.7871
22010132.5356532.8042
23−10−1032.9671227.9884
2410−1017.5691419.9767
25−101036.1519833.7194
26101019.3855924.3392
27000031.8070631.8689
Table 2. Ultrasound-assisted extraction (UAE) of the total phenolic compounds in Santolina chamaecyparissus according to a Box-Behnken design.
SampleParametersTPC (mg/g)
MeOH
X1
Temp.
X2
Amplitude
X3
Cycle
X4
pH
X5
Ratio
X6
Observed ValueEstimated Value
100−10−1−115.810718.2751
20010−1−128.121025.5952
300−101−123.262422.518
400101−131.385428.8766
500−10−1117.997819.6054
60010−1127.149928.7954
700−101117.978819.6035
800101129.395427.8321
90−10−1−1011.265712.0803
10010−1−1015.258514.9915
110−101−1015.628515.6357
120101−1016.160915.1685
130−10−11013.604414.8733
14010−11018.955518.6718
150−1011014.691415.2349
1601011016.746315.6551
17−10−1−10012.362212.0446
1810−1−10018.536917.4708
19−101−10010.354412.8199
20101−10028.924229.735
21−10−110011.471811.6154
2210−110019.349415.9295
23−10110012.879414.8999
2410110031.339830.7029
250−1−100−117.290116.6491
2601−100−112.259411.7105
270−1100−116.370816.8797
2801100−124.762625.1585
290−1−100115.356115.8613
3001−100110.521610.9139
310−1100118.314217.962
3201100126.492126.232
33−1−100−1014.460214.1986
341−100−1022.718120.5516
35−1100−1012.495712.6284
361100−1025.024624.5659
37−1−1001013.743113.9253
381−1001023.626323.2171
39−11001010.799413.2424
4011001027.580628.1187
41−100−10−114.498614.2599
42100−10−125.280625.6064
43−10010−115.875314.5097
4410010−119.865924.7441
45−100−10117.926814.003
46100−10124.586624.9978
47−10010116.684215.404
4810010124.093625.2867
4900000018.647016.8419
5000000016.152916.8419
5100000017.933916.8419
5200000015.479616.8419
5300000016.870216.8419
5400000015.967716.8419
Table 3. Comparative variance analysis of the Box-Behnken variables in the ultrasound and microwave-assisted extractions.
SourceUltrasound-Assisted ExtractionMicrowave-Assisted Extraction
Coefficient Estimatep-ValueCoefficient Estimatep-Value
Average16.8419 31.8689
A:MeOH10.61460.0000−8.69590.0004
B:Temperature1.66570.07305.04670.0159
C:Amplitude7.77430.0000
D:Cycle0.26930.7649
E:pH1.63980.0772−0.42170.8188
F:Ratio0.14290.87396.18730.0049
AA3.73280.0109−10.44960.0022
AB2.79220.0821−0.68420.8300
AC5.74450.0010
AD−0.55600.6148
AE1.46940.3500−3.14510.3331
AF−0.17580.9102−1.33440.6763
BB−6.11910.0001−0.27630.9202
BC6.60870.0002
BD−1.68910.2839
BE0.44370.6877−1.46780.6463
BF−0.00440.9977−0.35840.9104
CC2.18930.1199
CD1.25460.4238
CE−0.48070.7580
CF0.93500.3995
DD−3.30140.0226
DE−1.59680.3105
DF0.57560.7123
EE6.31450.00011.93280.4879
EF−2.12240.1809−2.56120.4275
FF5.58770.0004−3.26650.2497
Numbers in red are those with significant values (p-value < 0.05).
Table 4. Retention time (Rt), maximum absorption wavelengths in the visible region (λmax), mass spectra data, identification, and quantification of the phenolic compounds (optimal conditions obtained for MAE) in S. chamaecyparissus extract analyzed by Ultra-High-Performance Liquid Chromatography—Quadrupole Time of Flight—Mass Spectrometry (UHPLC-QToF-MS).
PeakRt (min)λmax (nm)λquantification
(nm)
Molecularion
[M-H]
Molecular FormulaCompoundQuantification
(mg g–1) dw (MAE)
12.74325325353C16H18O95-O-Caffeoylquinic acid (Chlorogenic acid)2.66
25.25353350463C21H20O12Quercetin 3-O-galactoside0.05
35.41353350463C21H20O12Quercetin 3-O-glucoside0.28
45.44350350477C21H20O11Luteolin 6-C-glucoside (isoorientin)0.18
55.52325325515C25H24O121,5-Dicaffeoylquinic acid (Cynarin)8.01
Publisher’s Note: MDPI stays neutral with regard to jurisdictional claims in published maps and institutional affiliations.

